International Master CIM 2014
69
A SOCIOMETRIC ANALYSIS FOR THE CREATION OF AN INTEGRATED MULTICULTURAL WORK TEAM Frederico Rocha de Araújo International Master – CIM 2014 RIO DE JANEIRO 2015
Transcript of International Master CIM 2014
A SOCIOMETRIC ANALYSIS FOR THE CREATION OF AN
INTEGRATED MULTICULTURAL WORK TEAM
Frederico Rocha de Araújo
International Master – CIM 2014
RIO DE JANEIRO 2015
ii
International Master – CIM 2014
Frederico Rocha de Araújo
A SOCIOMETRIC ANALYSIS FOR THE CREATION OF AN
INTEGRATED MULTICULTURAL WORK TEAM
A dissertation for the conclusion of the
Corporate International Master’s, a joint program
between Georgetown University (USA), ESADE
(Spain) and FGV (Brazil) as a requirement for
obtaining the degree of Executive Master’s in
International Business from Georgetown
University’s McDonough School of Business,
Corporate Master of Business Administration from
ESADE Business School and Mestrado Executivo
em Gestão Empresarial, Stricto sensu (Executive
Master’s in Business Management) from
FGV/EBAPE, under the advising of Professor Dr.
Marcos Rego.
Rio de Janeiro 2015
iii
Ficha catalográfica elaborada pela Biblioteca Mario Henrique Simonsen/FGV
Araújo, Frederico Rocha de A sociometric analysis for the creation of an integrated multicultural work team / Frederico Rocha de Araújo. – 2015. 69 f.
Dissertação (mestrado) - Escola Brasileira de Administração Pública e de Empresas, Centro de Formação Acadêmica e Pesquisa.
Orientador: Marcos Lopez Rego. Inclui bibliografia.
1. Sociometria. 2. Grupos de trabalho. 3. Interação social. 4. Relações humanas. 5. Redes sociais. I. Rego, Marcos Lopez. II. Escola Brasileira de Administração Pública e de Empresas. Centro de Formação Acadêmica e Pesquisa. III. Título. CDD – 658.3145

iv

v
Acknowledgments
To my wife, Raquel Fortes, for the unconditional support during the course and
encouragement throughout our life together. Thank you for your confidence. To my
parents, for the strong principles that have conducted my steps throughout my life’s
journey. To my colleagues, for the partnership, trust and support during this course,
which will change our personal and professional lives. For Prof. Brian Oglesbee, for the
English reviews of this dissertation and the papers during the course. And for all the
professors during the program, especially Professor Marcos Rego, for his guidance for
this dissertation and Doctor Andrea Claudia de Souza and Doctor Manoel Mendonça
for the essential insights for this dissertation.

vi
“The quality of your life is the quality of your relationships.” Anthony Robbins
vii
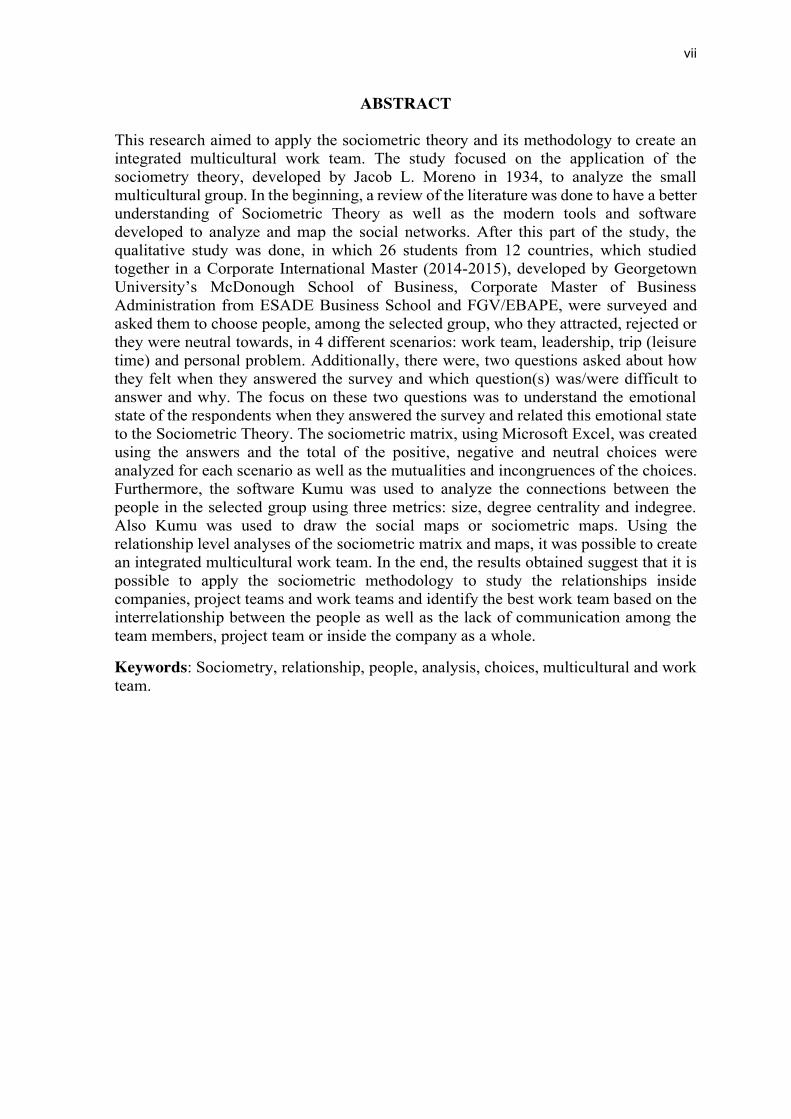
ABSTRACT
This research aimed to apply the sociometric theory and its methodology to create an integrated multicultural work team. The study focused on the application of the sociometry theory, developed by Jacob L. Moreno in 1934, to analyze the small multicultural group. In the beginning, a review of the literature was done to have a better understanding of Sociometric Theory as well as the modern tools and software developed to analyze and map the social networks. After this part of the study, the qualitative study was done, in which 26 students from 12 countries, which studied together in a Corporate International Master (2014-2015), developed by Georgetown University’s McDonough School of Business, Corporate Master of Business Administration from ESADE Business School and FGV/EBAPE, were surveyed and asked them to choose people, among the selected group, who they attracted, rejected or they were neutral towards, in 4 different scenarios: work team, leadership, trip (leisure time) and personal problem. Additionally, there were, two questions asked about how they felt when they answered the survey and which question(s) was/were difficult to answer and why. The focus on these two questions was to understand the emotional state of the respondents when they answered the survey and related this emotional state to the Sociometric Theory. The sociometric matrix, using Microsoft Excel, was created using the answers and the total of the positive, negative and neutral choices were analyzed for each scenario as well as the mutualities and incongruences of the choices. Furthermore, the software Kumu was used to analyze the connections between the people in the selected group using three metrics: size, degree centrality and indegree. Also Kumu was used to draw the social maps or sociometric maps. Using the relationship level analyses of the sociometric matrix and maps, it was possible to create an integrated multicultural work team. In the end, the results obtained suggest that it is possible to apply the sociometric methodology to study the relationships inside companies, project teams and work teams and identify the best work team based on the interrelationship between the people as well as the lack of communication among the team members, project team or inside the company as a whole.
Keywords: Sociometry, relationship, people, analysis, choices, multicultural and work team.
viii
TABLE OF FIGURES Figure 1 - Classic Sociogram ................................................................................... 8
Figure 2 - Network Analysis Map - Gephi Software ............................................... 8
Figure 3 - Structure of Leadership – Popular Leader. ........................................... 13
Figure 4 - Structure of Leadership - Powerful Leaders. ........................................ 14
Figure 5 - Leadership Structure - Isolated Leader. ................................................ 15
Figure 6 - Project complexity triangle ................................................................... 19
Figure 7 - Level of impact on project complexity ................................................. 19
Figure 8 - Selected group profile. .......................................................................... 27
Figure 9 - Sociogram of Work Team ..................................................................... 30
Figure 10 - Sociogram of Leadership .................................................................... 34
Figure 11 - Negative choices of work Team .......................................................... 37
Figure 12 - Negative choices of Leadership .......................................................... 37
Figure 13 - Negative Choices of Trip .................................................................... 37
Figure 14 - Negative Choices of Personal Problems ............................................. 37
Figure 15 - Work Team - Positive and Neutral Choices ........................................ 46
Figure 16 - Isolated groups..................................................................................... 49
ix
CHART LIST Chart 1 - Sociometric Matrix of Work Team ......................................................... 31
Chart 2 - Metric of Positive and Neutral choices ................................................... 32
Chart 3 - Metric of Negative choices ..................................................................... 32
Chart 4 - Analysis of Mutualities and Incongruences from Work Team Scenario33
Chart 5 - Sociometric Matrix of Leadership .......................................................... 35
Chart 6 - Analyses of Mutualities and Incongruences from Leadership ............... 36
Chart 7 - Sociometric Matrix of Trip ..................................................................... 38
Chart 8 - Sociometric Matrix of Personal Problem ............................................... 39
Chart 9 - Analysis of Mutualities and Incongruences from Trip Scenario ............ 40
Chart 10 - Analysis of Mutualities and Incongruences from Personal Problem ... 40
Chart 11- Opened question analysis ....................................................................... 41
Chart 12 - Integrated multicultural Work Team .................................................... 47

x
SUMMARY
INTRODUCTION ................................................................................................................. 1
DISCUSSION………………...………………………………………………………….4 SOCIOMETRY THEORY .............................................................................................. 4 SOCIOGRAM ................................................................................................................. 7 SOCIOMETRIC TEST .................................................................................................. 10 SOCIOMETRIC CRITERION ...................................................................................... 11 SOCIOMETRIC MATRIX ............................................................................................ 12 SOCIOMETRIC LEADER ............................................................................................ 13 WORK PROJECT TEAM ............................................................................................. 16
Hard skills and soft skills ........................................................................................... 18
RESEARCH METHODOLOGY ..................................................................................... 21 GROUP RESEARCHED ............................................................................................... 21 SOCIOMETRIC QUESTIONNAIRE ........................................................................... 21 KUMU SOFTWARE ..................................................................................................... 26
DATA ANALISYS AND DISCUSSION OF THE RESULTS ..................................... 27 ANALYSIS OF THE SOCIOMETRIC TEST ......................................................................... 28
Analysis of Teamwork Sociometric Test ................................................................... 30 Analysis of Leadership Sociometric Test ................................................................... 33 Analysis of Trip and Personal Problem’s Sociometric Tests .................................... 36
RESEARCH OPENED QUESTIONS ANALYSIS .................................................................... 41
CONCLUSIONS AND RECOMMENDATIONS ......................................................... 46 HYPOTHETICAL INTEGRATED MULTICULTURAL WORK TEAM ....................................... 46 RECOMMENDATION ....................................................................................................... 49
REFERENCES ..................................................................................................................... 52
APPENDIX ........................................................................................................................... 57 APPENDIX A: EXAMPLE OF MORENO’S SOCIOMETRIC MATRIX ................... 57 APPENDIX B: SOCIOMETRIC SYMBOLS AND INTERNAL STRUTUCRES....... 58
A Sociometric Analysis for the creation of an integrated multicultural work team
Frederico Rocha de Araújo
Because of the ongoing process of the modernization of society, difficulties within
relationships have increased. People have become more distant from each other and
unstable in terms of emotions, which contribute to a lack of healthy relationships
between the employees of companies.
McPherson, Smith-Levin and Brashears (2006, p.371) concluded that: “The
number of people who have someone to talk to about matters that are important to them
has declined dramatically, and the number of alternative discussion partners has
shrunk”.
These problems have impacted countries, societies, families, institutions and
companies around the world because people have stopped talking (communicating) to,
and relating to each other, which have affected society.as a whole.
In the case of companies, these problems in relationships have affected the success
of new businesses, projects, departments, and teams as well as their leadership.
Sometimes executives invest time and resources in the restructuring of their companies,
thinking over and rethinking the organizational charts, however, they fail in this process.
This happens because some of the real work in a company happens despite formal
organization. Krackhardt and Hanson (1993) wrote about these problems and studied
informal networks. These informal networks could be explained as relationship
networks that employees form inside their organizations, which can be created across
functions, departments and divisions.
When entrepreneurs, executives, human resource directors and leaders create
companies or projects and choose people to participate in their teams as members or
leaders, they focus on competence, professional background, experience, and so on.
However, these aforementioned professionals forget the capacity of the team
members to establish good relationships with their colleagues, mainly in terms of
emotional relationships between the team members.
Companies can find the failures causes in the negative tension within the team.
This tension affects the efficiency of this social group, according to Moreno (1934) or
could create a failure within the organizational networks (Krackhardt & Hanson, 1993).
2
One way to reduce this possible weak interaction within the team is the application
of sociometric methods to analyze the emotional relationships between the people who
are part of a social multicultural group (work team).
Sociometry is a method created by Moreno (1934) to study the interpersonal
connections of individuals and groups of all sizes. This methodology aims to improve
human relationships within the framework of the group. He wrote an important book
called Who Shall Survive?, which introduced Sociometry and his theory.
It is possible to use Sociometry to select the best team among a group of people
from different cultures, who work together, considering the level of relationships within
this group, as well as finding the leader for the selected team, using the team preferences
for a leader.
Additionally, when the leader knows the sociometric profile of his/her team, an
engagement and greater efficiency in the issues that their subordinates are involved in
is achieved, mainly because it unites like-minded people in the same project. So, the
inter-relationships between the team members increase and the team achieves success
(Krackhardt & Hanson, 1993).
Sociometry is a theory of human behavior. Its research was assigned to many types
of groups and small communities. One result found that what is applied in one group is
not applied to another group because each group is made up of different people. As a
result, each group reacts in a different way. Possibly, the research could have had
different results if they had introduced another or a different person into the group
analyzed (Moreno, 1934).
The importance of understanding the way that a person who belongs to a
multicultural group selects the people, who he or she wants to work with as a team as
well as who he or she chooses as a leader, based on the level of social relations among
them, is an important selection and creation process of an integrated multicultural work
team. Moreover, the choice of one group member directly affects the choice of a group
leader. So, if all the choices of the individuals in a group are considered and analyzed,
it is possible to select an integrated team and the right leader.
This dissertation research will fit in with Moreno’s research, only changing the
applicability. Moreno created his sociometric method by studying the behavior of
refugees in Austria and the relationship among the girls from the Hudson School for
(Delinquent) Girls (Smith, 1950).

3
Different from Moreno’s, this study is going to apply the method to identify how
executives could select people based on their emotional relationships with these people.
Besides, this research is interested in discovering who will be selected as a leader, and
what kind of leader this person will be, within Moreno's leader classification (Moreno,
1934). It also compares the leaders chosen naturally within the assumptions or criteria
presented as teamwork, leisure and confidence, with a specific criterion or question
about leadership.
Thus, this research will examine the application of the Sociometric research
methodology to a small and select group of international executives, who have never
worked together in a company. The objective is to analyze the level of emotional
relationships in a multicultural social group.
The main problem addressed is: How does sociometric theory contribute to the
selection and creation of an integrated multicultural work team, and give support to the
identification of a leader among the team members?
Therefore, using the individual preferences of each individual from the selected
group regarding his or her choices based on the relationship level, it will be possible to
create the best work team and define the right leader, as well as to compare the
preferences of the individuals within four different criteria: teamwork, leadership,
leisure and personal confidence.
It is important to note that sociometry is an instrument through which social truth
can be explored, the truth about conflicts and social structure (Moreno, 1934).
The theoretical framework is presented in Discussion, followed by the research
methodology, and finally, the results.

4
Discussion
Sociometry theory
Sociometry is a term coined by Doctor J.L.Moreno (1889-1974), who had studied
the interpersonal connections of individuals and groups.
“The word sociometry can be defined using its two main parts as the measurement
of friendship or, in a broader sense, the measurement of interpersonal relationships”
(Smith, 1950, p.211). However, for Moreno, “sociometry is, first of all, a theory and
then a method” (Moreno, 1942, p. 6). As a method, sociometry has attracted many
scholars to this study field.
According to Moreno (1934), humanity can be considered an organic social unit.
As a unit, tension appears between and within the different parts. This leads to these
parts of society separating or attracting as happens in physics. Tension between the parts
could be beneficial for the part and harmful to the whole; or advantageous for one part
and disadvantageous for the other.
Besides this, the tensions can express themselves as affinities or non-affinities in
the relationships between individuals or groups of individuals as well as manifesting as
attractions, repulsions and rejections.
Attraction, repulsion and rejection are connected to many social, biological, and
psychological factors. As well as having close or distant effects over the immediate
participants of the relationship, they may also affect all other parts of the social unit
called Humanity.
When two or more people work as a social group, this group is not made only of
people, but of the relationships between them. Perhaps, when considering society’s
wellness, the relationship between people is more important than the people themselves.
Without relationships, Humanity could not manifest itself as a social group.
The complex pattern of a social structure is made up of many other simple
patterns. These simple patterns could be expressed by the emotional interrelated
connections between people. People that live near or far from each other construct these
connections, so, the geographic pattern of distribution is created, but it is influenced by
the development stage of each individual. Nevertheless, individuals in the same
evolution stage in terms of culture, education, experience, economics, behavior, and so

5
on, tend to attract each other. The opposite happens when there are differences in levels
or stages of social or personal evolution.
Additionally, temporal pattern is also an influence for the establishment of
connections between people. This happens because of human life dynamism. Events
throughout life can change the individual’s perceptions about themselves, about the
environment and consequently, the emotional connections created with other people.
Also, the different roles that individuals develop in a society can directly affect
their choices of interpersonal connections.
The technique designed by Moreno (1934) had the objective of revealing the
dynamics of interpersonal relationships and to make the scientific application of this
knowledge for the improvement of human relationships within the framework of the
group, at a specific time, place and with a predetermined group (Smith, 1950).
In 1934, Jacob L. Moreno published a book called Who Shall Survive?, which
provided a method to analyze the context of real and live groups. This theory has offered
quantitative and qualitative analysis for the interpersonal dynamic relationship
improvement among people. Thus, Sociometry is the methodology used to describe the
informal organization of groups of many different kinds (Smith, 1950).
Furthermore, in this aforementioned book, Dr. Moreno brought up an idea based
on Darwin’s Theory of natural selection. From the point of view of a sociometrist view,
social laws of natural selection are the capacity of the human being to emotionally adapt
and create a connection with another human. However, sometimes individuals are
disconnected from their peers because they cannot perceive who or where their peers
are. So, the individual and groups of individuals are excluded from their social
aggregates, from the material resources that they need, from love, from work, and from
homes.
With Sociometry it is possible to analyze millions or billions of small groups
within a sociogram; the connection of each individual is shown. In this way, the
sociometrist, using psychological techniques, for instance, psychodrama could improve
the connections of this individual and improve his or her life conditions. This process
of social relation improvement can enhance the survival of each individual.
In a definition given by Moreno, Sociometry is a technique developed to identify
the structure of ties in a group based on affection rather than role expectations (Moreno,
1943).
6
Additionally, sociometry is a classificatory science. Sociometry uses the
mathematical study of the psychological properties of the population.
Sociometry is a theory of human behavior, which has impacted many areas of
study including psychology, psychiatry, sports, sales, management and human
resources, mainly for group leaders in all settings.
Moreno (1934) developed a classification technique that seeks to bring together
people who can develop harmonious interpersonal relationships with each other.
According to him, when we put together people who develop harmonious relationships,
we are creating a social group with the right conditions to work at maximum efficiency
and minimal destructiveness.
Moreno devoted many years to creating the role of sociometrist-building theory and methodology and representing the field in publications and at international meetings. The journal Sociometry began in 1937; its editorial board and contributing editors included such figures as Gordon Allport, Paul Lazarsfield, John Dewey, George Gallup, Adolf Meyer, Margaret Mead, and Gardner Murphy. In 1942 the Sociometric Institute opened and he formed the American Society of Group Psychotherapy and Psychodrama. In 1936, Henry J. Meyer, at the School of Social Work, University of Michigan, had differentiated three types of sociometry: (1) as an orientation towards life, (2) as a theory of society, and (3) as a method of research. (Hale, 2009).
Another important piece of evidence about the applicability of Sociometry is the
thesis written by Mendelson (1976). In this thesis, he described “the fascination of social
psychologists, teachers, activists, military, professionals, psychotherapists and others
with Moreno’s methodologies, as well as the mixed impact of the field of sociology on
Moreno’s legacy.”
According to this research, Moreno’s literature is the most influential theory and
method that will be used as the theoretical basis for this dissertation. The other
theoretical grounds produced were also based on Moreno's work. Researchers from
different areas have used Moreno’s theory to support their studies.
In the area of psychology and psychiatry, Hale (2009), Moreno (1941), Moreno
(1955), Northway (1946), Remer (2002), Smith (1950), Tagiuri and Kogan (1957) used
the theory to study human relationships, psychodrama and social relationship problems.
Also, this theory has been used for studies involving human resources (Blumberg, 1999;
Colarelli & Boos, 1992; Criswell, 1949; Gardner, 1956; Lucius & Kuhnert, 1997;
Massarik, Tannenbaum, Kahane & Weschler, 1953), leadership (Beck, Eng & Brusa,
1989; Burke, 1971; Gibb, 1950; Jennings, 1947; Marak Jr., 1964; Read, 1974), sports
7
behavior (Vierimaa, 2013), pedagogy (Buckridan, 1975; Daugherty, 2003; Mciver,
1948;) and for military studies.
Moreover, there is a new generation of researchers who have used the theory of
Moreno (1934) by another name. This is the case of researchers Krackhardt and Hanson
(1993) and prof. Pentland (2012). Both of them use sociometry as a base to analyze
human beings relationships. A good example of the application of the theory is MIT’s
Human Dynamics Laboratory, which has identified work group dynamics (Pentland,
2012).
Sociogram
A Sociogram is the process of mapping that can be defined as the method of
investigation that allows the exploration of sociometric facts. The sociogram shows the
exact location of each individual and all of his or her interrelationships (Moreno, 1934).
The Moreno Sociogram was a unique map used to do a structural analysis of the
community. However, recently, researchers have developed another concept called
Informal Networks, using the sociometric bases. (Daugherty, 2003; Krackhardt &
Hanson, 1993; Pentland, 2012). Open Source Software has also been created for
exploring and manipulating Networks, which could analyze people networks (Bastian,
Heymann & Jacony, 2009).
The only way to see a social structure is through mapping, using Sociometry or
any kind of informal network analysis. The latter uses the method coined by Doctor
Moreno as well (Moreno, 1934).
8
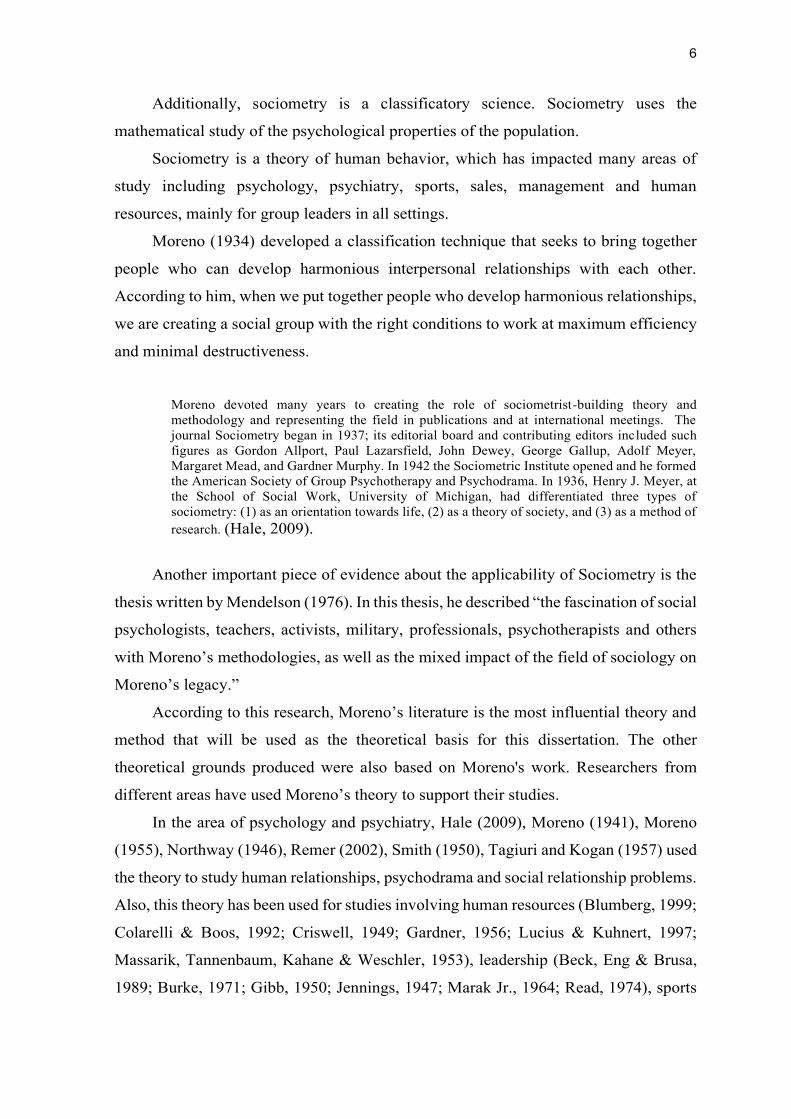
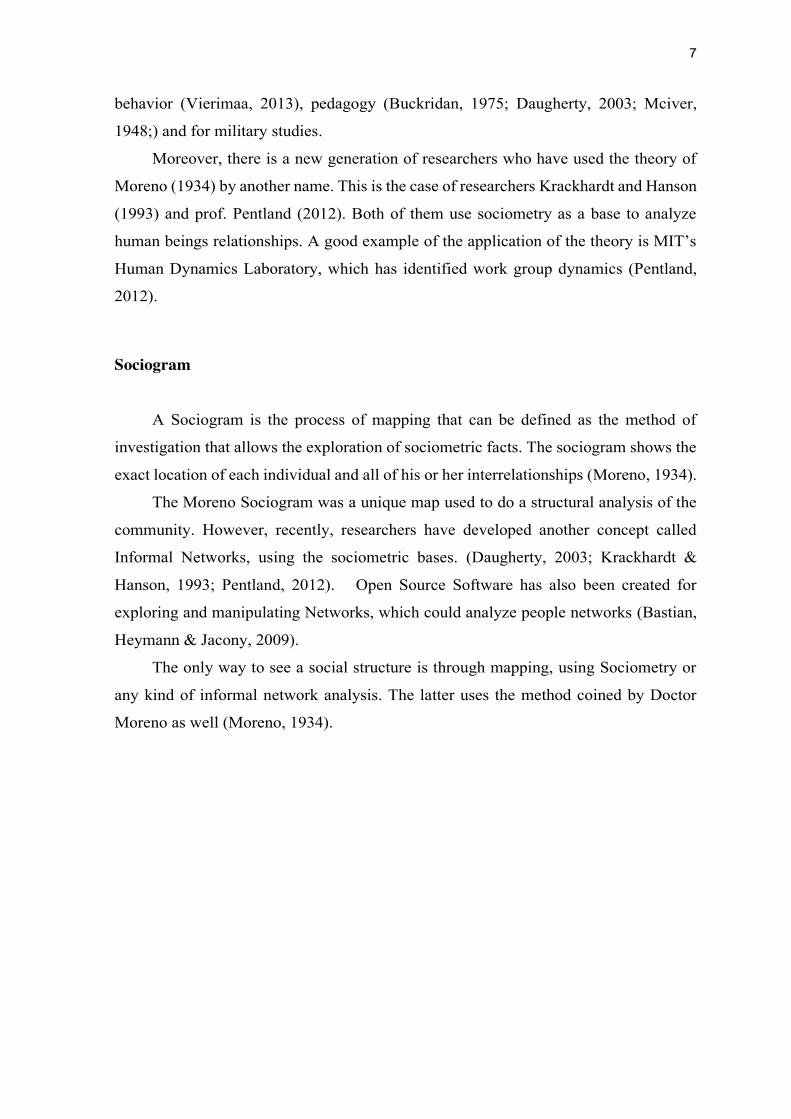
Figure 1: A classic Sociogram and Figure 2: Network analysis from Gephi
Software shows the map models that could be created to represent social networks.
Figure 1 - Classic Sociogram (Hollader, C.E.cit. p.10)
Figure 2 - Network Analysis Map - Gephi Software
Also, a Sociogram from the group selected for the purpose of this dissertation is
shown in Data Analysis and Discussion of the results, considering the choices made by
9
the respondents, like Figure 1 and Figure 2 as well as the sociometric symbols and
internal structures in the Appendix A.
For mapping the sociogram and analyzing the social network the software called
Kumu (https://www.kumu.io) was used. This software also brings some metrics that
were used to improve the analysis and compare it with the results obtained from the
sociometric matrices in Analysis of the Sociometric Test, in this dissertation.
According to Hollander (2015, p. 1):
There are three major types of sociograms: the role-diagram, the perceptual sociogram, and the more conventional sociogram of the moment. The techniques for administering a sociogram, no matter what type:
a. Criterion Selection; b. Matrix Formation; c. Sociogram Charting; d. Analysis; and e. Application.
Another consideration about the Sociogram is that it needs to be applied to
analyze real situations in which the participants of the research react to a stated action
criterion and the data collected through the use of a sociometric test has to be inserted
into an appropriate chart to show a "picture" of the network of the relationship among
the people from a specific group. Moreno had a specific consideration about the value
of the data collected from a sociometric test: The responses received in the course of sociometric procedures form each individual, however spontaneous and essential they may appear, are materials only and not yet sociometric facts in themselves. We have first to visualize and represent how these responses hang together… The sociometrist is in the paradoxical situation that he has to construct and map of his universe before he can explore it (Moreno, 1937, p.217).
This dissertation used the sociogram in order to map the relations among the
members of the selected group in a determined moment (at the end of the course) using
four different criteria – teamwork, leadership, leisure time and personal problem.
The map of a sociogram represents the socio-geographic position of each
member of the group and their relationship to the other people from the selected group.
As shown in Figure 1 and Appendix B, a sociogram is made up of symbols, with specific
meanings, that can show the inter-relationships among the members of the group
analyzed.

10
Sociometric test
A sociometric test is an instrument that measures the level of organization of social
groups. For this test, the researcher asks individuals of the group to select people for a
group that this individual will participate or already participates in. Also, this test is used
as an instrument to construct or reconstruct one specific group.
In this dissertation research each individual was asked to choose three people
within the selected group that they intend to be a member of and four different scenarios
were addressed (team work, leadership, leisure time and personal problems) where the
individuals need to choose their preferences based on the level of relationship with three
members of the selected group. These choices were based on the emotional relationship
between the people.
A sociometric test analyzes the social structures and measures the attraction
(choice), repulsion (rejection) and neutrality that happen between people from selected
social groups.
According to Moreno (1934) in his book called Who will Survive? This test applied in residential, employment and school groups, revealed the following:
a. Different criteria can lead to groups that can either be the same or different, with the same people;
b. Groups with different functions, such as residential and industrial, tend to be structured differently;
c. People, if they could, would be grouped in different ways; d. These spontaneous groups and the role that individuals play or intend to play within them have
a strong influence on the behavior of each individual in particular, on the group as a whole; e. Spontaneous groupings and the forms of grouping imposed on them by some authority
constitute a potential source of conflict (Moreno, 1934. p. 119).
So, it will be possible to verify using the results of the sociometric test, applied to
the selected group, the aforementioned points from “a” to “e”.
Another consideration about the test is the possible group member resistance to
choose the people who they reject. This resistance sometimes is caused by the fear of
becoming explicit in the rejection and how the group will perceive this rejection and
mainly how the rejection will affect the person who made the choice. The fear of
expressing their preferences in relation to others is actually the fear of the feeling that
others have for them (Moreno, 1934).
The individuals/respondents need to make their choice without embarrassment.
So, to guarantee the individual spontaneity at the moment of answering the sociometric
questionnaire, the respondents were guaranteed that their names would be changed to

11
codes in an introduction to the sociometric survey. See Introduction of the Sociometric
Questionnaire, Research Methodology of this dissertation. The codes used are #1, #2,
#3 … #26 and these numbers represent the order of the responses received by the
researcher.
Sociometric criterion
The sociometric criteria are the sociometric standards. So, the criteria are the
common reasons that lead individuals to join together spontaneously, for a specific
purpose. This can be explained by “What” the researcher wants to measure in terms of
relationship and always refers to something connected to social interaction. Mainly
because it is in society that people create their relationship network.
These criteria could change at any moment, depending on the purpose of the
people. For instance, these purposes could be work, love, hate, leisure, fear, friendship,
partnership, and so on. The number of criteria that create a purpose for people to join
into a group reaches millions of possibilities. Thus, human society forms a complex and
deep unconscious infrastructure.
There are as many sociometric criteria as the actions that humans can develop in
society. However, the criteria can be grouped into operating, when you want to
accomplish a task, and affective, when it is inside the emotional part of the proposal.
For the purpose of this dissertation, the criteria selected for the group were
teamwork, leadership, leisure time and personal problems (confidence). So, two of the
criteria presented to the respondents are linked to operational and two to affective. The
aim of choosing these four criteria was to conduct a comparison between the
professional and personal criteria and see if there was a pattern of choices between them
as well as if there was some pattern in the choices related to attractions, rejections and
indifference (neutrality).
Each of the individuals at the moment of selecting their personal group took into
account the criteria presented by the questionnaire and different values; objectives,
patterns and rules influenced these individuals in the their preferences selection.
Therefore, the different combinations of influences of each of the individuals in their
choices, will affect the group creation for each criteria (Smith, 1950). Because of this,
12
if there enters a new individual into a group, all the dynamics of the group maybe
changed.
In the words of Moreno, 1934, p.124: Theoretically, the sociometric test requires: a. The participants of the situation to relate to each other through one or more criteria; b. A criteria needs to be chosen which the participants wish to respond to at the time of the test, with a high degree of spontaneity; c. That the individuals are properly motivated, so that their answers are sincere; d. That the criteria selected for the test be strong, lasting and definitive, rather than weak, temporary and indefinite.
The sociometric test in a Discussion of this dissertation shows that these
requirements cited were followed to develop the test, which was applied to the selected
group.
Sociometric matrix
A sociometric matrix is an instrument for analyzing the information received from
a sociometric questionnaire. So, this is a data summary sheet, which organizes the
researched choices. This sheet is a multicellular chart with two margins in which the
respondent’s names are listed: one at the left vertical margin and the other at the top,
proceeding horizontally
Each positive researched response (attraction) is indicated in a cell that intersects
with the name of their sociometric choice. The rejections and neutrality are also
registered in the same way. The colors used for this in the cell are blue for positive
(attraction), red for negative (rejection) and green for neutrality (neutral). In sequence,
at the end of the spreadsheet, the numbers of positive, negative and neutral choices of
the selected group are summarized as well as the number of positive, negative and
neutral mutualities and the incongruences. See an example of a sociometric matrix in
Appendix A.
With the results, it is possible to see the sociometric stars, rejects and isolates. The
sociometric stars are the people who have received the largest number of positive
choices, the rejects are those people that received the largest number of negative choices
and the isolates are those people who have received no positive or negative choices
(neutrals).

13
Sociometric leader
Based on all of the information obtained through the sociometric questionnaire
and through the analysis performed by using the Sociogram, the Sociometric Score of
each individual will be set and the Sociometric Leader will be chosen who could be (1)
a popular leader, (2) a powerful leader or (3) an isolated leader.
Additionally, in the questionnaire one question will be administered about
leadership, which has the objective of analyzing if the respondent answer matches with
his or her chosen leader in relation to their relationships with the members of the group
analyzed.
Figure 3 represents a Sociogram made in Dormitory A8, Where the population of this dormitory was 25 at the moment of the test. BL is the center of the attraction of 20 individuals, in which 18 of them lived with him in the same dormitory. 2 of the individuals lived in another lodge. BL chose 4 individuals (SA, TT, ML and OY) from his group of residence. Thus, he was classified as a popular leader. The 2 individuals outside of the group (VE and PR) were isolated individuals, because their groups rejected them. So, the conclusion is that BL, despite having quantitatively the biggest direct influence, this influence was limited to Dormitory A8. He did not have any external influence in the other dormitory (Moreno, 1934, p.257).
Figure 3 - Structure of Leadership – Popular Leader. (Moreno, 1934, p.257)
14
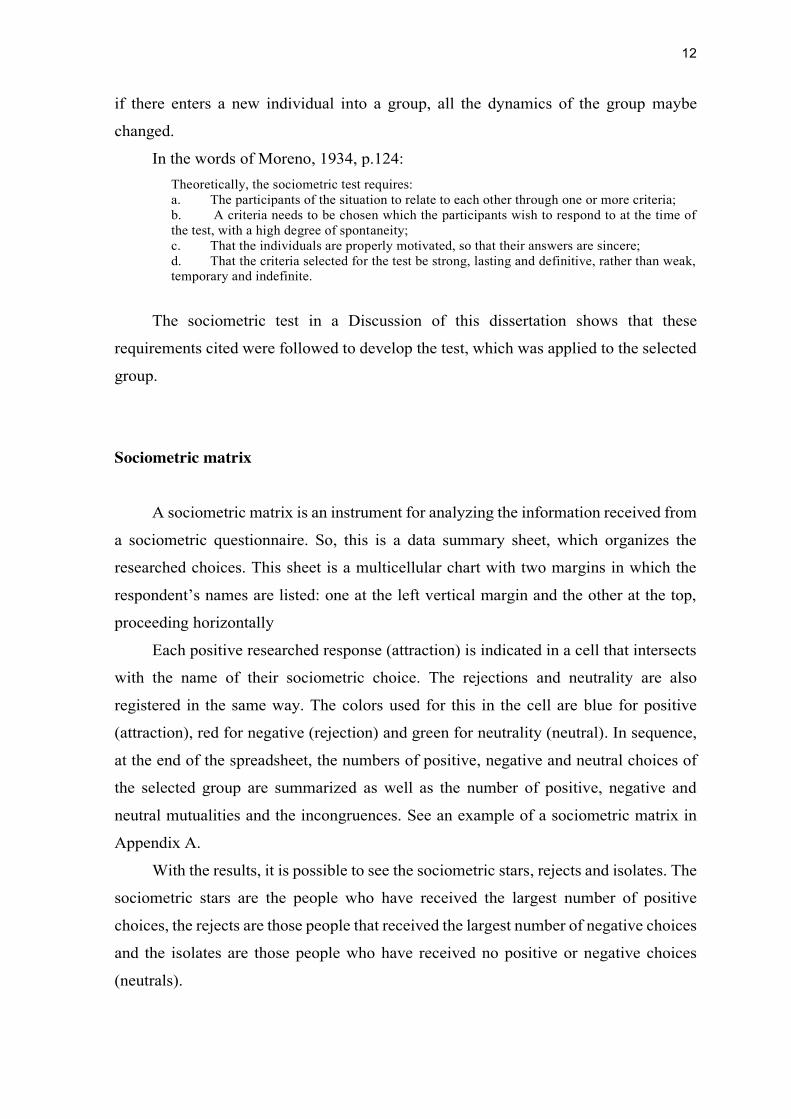
Figure 4 represents a Sociogram made in a group of dorms. LP, from Dormitory A6 was a center of attraction of 4 individuals: SV and ES, both of them from the same dormitory. MM (from A1) and KM (from A7). LP used 4 of her 5 choices and chose positively SV, ES, MM and KM, forming a pair with each one. Quantitatively, LP would be classified as an individual with direct average influence, but through the intermediation of SV, ES, MM and KM, she indirectly led hundreds of individuals, of which 58 were indicated in this sociogram. In reality, LP had an important position within the group/community (Moreno, 1934, p.258).
Figure 4 - Structure of Leadership - Powerful Leaders. (Moreno, 1934, p.258)
The last example of the structure of leadership developed by Moreno (1934) is the
Structure of the Isolated Leader. Figure 5 represents the Structure of the Isolated Leader.
In this case individual A established a big network of influence, through indirect
connections.
15
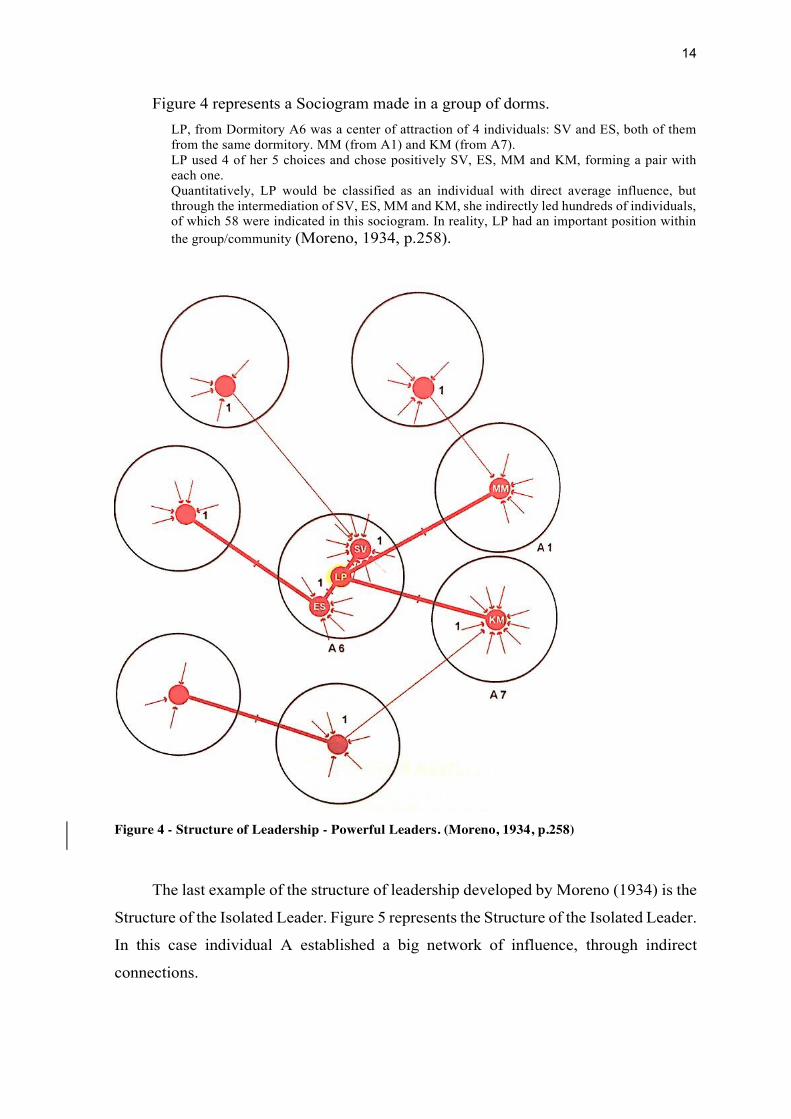
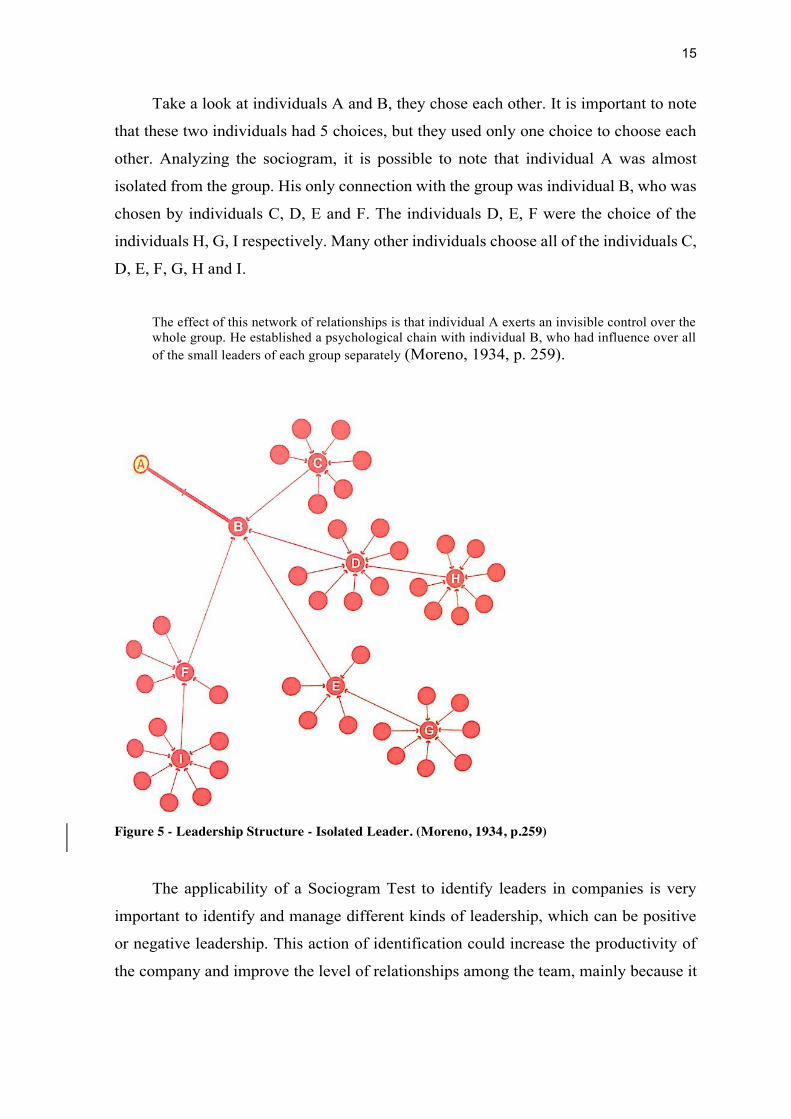
Take a look at individuals A and B, they chose each other. It is important to note
that these two individuals had 5 choices, but they used only one choice to choose each
other. Analyzing the sociogram, it is possible to note that individual A was almost
isolated from the group. His only connection with the group was individual B, who was
chosen by individuals C, D, E and F. The individuals D, E, F were the choice of the
individuals H, G, I respectively. Many other individuals choose all of the individuals C,
D, E, F, G, H and I.
The effect of this network of relationships is that individual A exerts an invisible control over the whole group. He established a psychological chain with individual B, who had influence over all of the small leaders of each group separately (Moreno, 1934, p. 259).
Figure 5 - Leadership Structure - Isolated Leader. (Moreno, 1934, p.259)
The applicability of a Sociogram Test to identify leaders in companies is very
important to identify and manage different kinds of leadership, which can be positive
or negative leadership. This action of identification could increase the productivity of
the company and improve the level of relationships among the team, mainly because it
16
affects the communication inside the company and among the departments directly.
(Krackhardt & Hanson, 1993; Pentland, 2012).
On the other hand, a leader that knows the sociometric profile of his or her team
can create a good working environment, because he or she knows the interrelation
connections. With this important information the leader can, for instance, choose the
right team for a project, increase productivity, and can improve the communication and
efficiency of the team. (Berkowitz, 1956; Burke, 1976; Beck, Eng & Brusa, 1989;
Krackhardt & Hanson, 1993; Pentland, 2012).
It is important to note that the form of leadership depends on the configuration of
the group. In this way, the power of a leader is connected to the level of power of the
individuals that chose him or her as a leader.
Furthermore, Sociometric leaders are different from traditional leaders because
they influence their followers to develop a project with an articulated enthusiasm unlike
traditional leaders that influence with an enthusiasm that is somewhat blind (Moreno,
1934).
Future leaders will have to study or use sociometry to create the bases for efficient
groups with good psychological relationships and strong emotional interrelationships In
this way, this leader will have a sociometric and planned community.
Work project team
The marketplace dynamism in a global world has demanded that companies
should be more agile and flexible in order to maintain competitiveness. Nowadays the
customers’ expectations regarding the quality of a product or a service have increased.
A customer does not accept products or services, which do not satisfy their
requirements. “Due to the fact that companies have changed their structure and way of
working” (Zahra, Nazir, Khalid, Raana & Majeed, 2014, p.40).
In this way, many companies have created a project area to manage specific
projects because this is the way to help them to work in a lower cost and well-organized
manner.
The project is: a temporary endeavor undertaken to compete a task, it has a beginning and end. For the accomplishment of projects with limited resources we need management. Project management is the application of knowledge, skills, tools and techniques to carry out project activities in order to meet stakeholder’s needs and expectations from a project. The management of project
17
related activities within a specified time, cost and performance standards along with good customer relations” (Zahra et al., 2014, p.41).
As a project is a temporary connection of people for a specific purpose and as
companies around the world are becoming more global, project managers have to deal
with multicultural temporary teams, which their needs have led to. Moreover, managers
must consider many aspects related to the difference of culture, emotions,
communication and relationships.
Flannes (as cited in Zahra et al., 2014, p.42) mentioned in his paper related to
people skills for project management that these skills greatly depend upon the ability of
effective communication between two persons, working actually as leader in different
scenarios, the usage of a system that can separate people according to their skills,
encouraging their to work as a group or alone, efficiently managing clashes between
individuals or team, coping with personal and professional tensions, and actively taking
part in career development.
According to Flannes (2015), the most difficult task of the project manager is to
select people by their soft skills required for a specific project. On the other hand,
selecting people based on their hard skills is not so hard, because these skills are more
tangible in terms of a project. Marando (2012) concluded in her research that the project
managers fail to direct their projects in the right way just because the lack of
management skills which are usually known as ‘soft skills’. Soft skills are mainly
elusive, a solid output or any deliverable is not demanded and they commonly work
without any pattern and tools.
Thus, the problem of handling soft skills is not only a problem experienced by
project managers related to their team, but regarding themselves.
In addition to these problems of managing soft skills, managers have to face
complex projects. This complexity is caused by the projects being complex systems, not
only due to the technical issues but also due to the wider organizational factors that are
usually beyond a project manager’s control (Whitty & Maylor, 2009).
Azim (2010) expressed that projects are very dependent on the participation,
reactions and interactions of people, thus making these interdependencies hard to model
and unpredictable to some extent. However, as it is described in this dissertation, the
utilization of sociometry could decrease the factor of failure related to the personal
relationships within projects.
18
Hard skills and soft skills
Hard skills in project management generally refer to process, procedures, tools
and techniques and soft skills refer to dealing with human issues.
The Project Management Body of Knowledge (PMI, 2004) gives focus to hard
skills more than soft skills as compared to the other bodies of knowledge, for instance
BoKs (Morris, Crawford, Hodgson, Shepherd & Thomas, 2006; Pant & Baroudi, 2008).
Other researchers have demonstrated the increase of the importance of soft skills for
project management, from an evaluation of BoKs, project manager competence
(Ireland, 2004) and leadership styles as the factor of the success of projects.
It is important to note that Section 7 of Association of Project Management (APM)
APMBoK (APM, 2006), brought the importance of people to a project. The important
factors related to people in the APM (2006) are:
a. “Communication;
b. Teamwork;
c. Leadership;
d. Conflict management;
e. Negotiation;
f. Human resources management;
g. Behavioral characteristics;
h. Learning and development; and
i. Professionalism and ethics.
Experience shows however that it is people who deliver successful projects, not methods and tools, and it is people’s ability to engage intelligently with the complexity of projects, that is central to the successful management of projects (Winter, Smith, Morris & Cicmil, 2006, p. 646).
Based on this citation, the relationship between people who work together is an
important factor for the accomplishment of an objective in a project. In terms of
complexity in projects, the interaction of people is the main factor of complexity.

19
Figure 6 - Project complexity triangle (Azim et. al, 2010, p.393)
Figure 7 - Level of impact on project complexity (Azim et. al.,2010, p.397)
As the result of a study made by Azim et. al 2012, people who work with complex
projects concluded that project complexity is formed by a triangle of Product/Service,
Process and People, as showed in Figure 6 – Complexity triangle. And, as the Figure 7
– Level of impact on project complexity, people were considered by 74, 47% of the
respondents as the most important thing in a complex project.
With this proof of the importance of people for a project, sociometry and the tools
shown in this dissertation can help project managers or the human resource department
to select people to work together in a project, independent of whether these people are
from different cultures or not.
The factors related to people in APM (2006) can be improved with the utilization
of the method of relationships measurement developed by Sociometry Theory and the
20
new tools that help draw social maps and analyze the data obtained from a sociometric
test, as shown in this dissertation.
With the application of the methodology studied, it is possible to improve the
selection of people who will work in a team and its leader. As the selection process uses
the level of interpersonal relationships between the people who will participate in a
project and as the project manager selects only people who have a good relationship
with each other, communication and negotiation are improved and the conflicts are
reduced. With this, the effort to manage human resources is lower because the conflicts
between people will not be severe. So, the behavioral, learning and developmental
process is improved because people establish a cooperative behavior inside the group.
And the last factor that could be improved is professionalism and ethics because people
tend to choose their counterparts in relation to soft skills.
All of these aforementioned points will be improved because the people will not
be forced to establish or maintain a relationship with people who they do not like.
Thus, the selection of the teams of the projects will be done in two phases, the first
is pre-selection of people based on their hard skills and some soft skills needed for the
project. Then the sociometric methodology will be applied to analyze the relationship
level between the preselected people. Finally, the team will be created, considering the
level of interpersonal relationships among team members, being disregarding the people
with high levels of rejection by the group. If these rejected people are necessary for the
project, the Human Resource or the project manager should create some group
dynamics to reduce rejections and reintroduce these rejections into the group.
21
RESEARCH METHODOLOGY
Group researched
The group researched was 26 students, which studied together in a Corporate
International Master (2014-2015), developed by Georgetown University’s McDonough
School of Business, Corporate Master of Business Administration from ESADE
Business School and FGV/EBAPE. This group was selected because of its multicultural
characteristics and the level of hard and soft skills of its participants.
The small group of students was chosen because of the time granted for the
development of research and dissertation. The entire master course had duration of 14
months, and only 11 months to do the research and write the dissertation. Because of
this a small group was chosen in order to do an oriented research.
Sociometric questionnaire
The research was conducted using online forms, via the tool "Form" provided by
Survey Monkey Inc. (www.surveymonkey.com), once the questions were listed, a link
was provided in order to forward to all the participants. All of the 26 students answered
the questionnaire. The questionnaire was assigned at the end of August 2015 and
completed at the end of September 2015.
The questionnaire that was applied to the participants was a Sociometric
Questionnaire (Sociometric Test). Besides the Sociometric questionnaire, additional
questions regarding personal information (question number 1) as well as qualitative
questions about the feelings and the difficulties that the respondent found in answering
the Sociometric questionnaire (questions number 14 and 15).
22
Dear classmates, the following test is part of my master's thesis, which is entitled: The sociometric analysis for the creation of an integrated cross-cultural team.
The question that I intend to answer in my thesis is: How does sociometric theory contribute to the selection and creation of an integrated multicultural work team; and give support to the identification of a leader among the team members?
Sociometry is a method created by JL Moreno in 1934 to study interpersonal connections of individuals and groups of all sizes. This methodology aims to improve human relations within the group. Thus, the research aims to evaluate interpersonal relations in CIM2 based on the preference of the relationship between the classmates.
It is important to note that the name of the group members will be changed to acronyms or numbers, allowing the complete confidentiality of the people involved. Thus, it is expected that responses / choices are a faithful representation of the relationship preferences between the classmates of CIM2.
The following questions will be presented in 3 different situations and the respondent should make their choices based on the level of personal relationships with their classmates, considering their personal preferences. Thank you for your help. Let’s take the test!!!!!! Meanings
Choose = (+) attraction
Not choose = (-) rejection
Neutral = (+/-) irrelevant, does not matter for you, but you do not reject
23
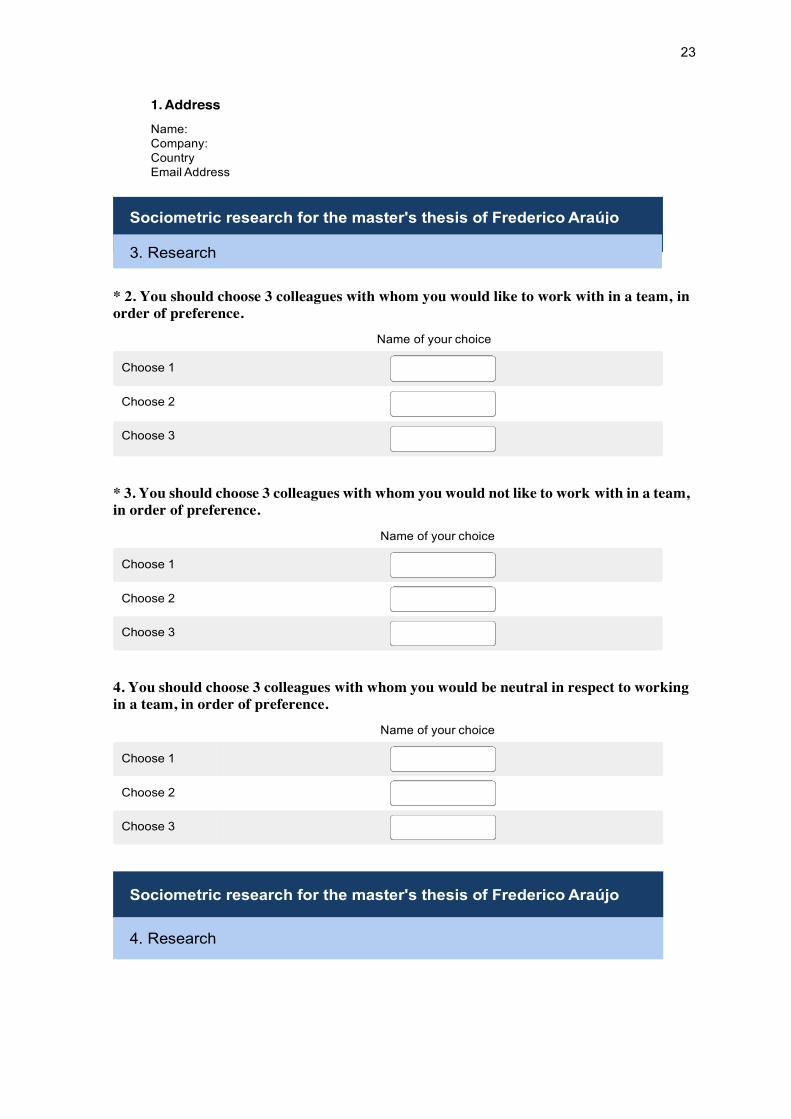
1. Address
Name: Company: Country Email Address
* 2. You should choose 3 colleagues with whom you would like to work with in a team, in order of preference.
Name of your choice
* 3. You should choose 3 colleagues with whom you would not like to work with in a team, in order of preference. Name of your choice
4. You should choose 3 colleagues with whom you would be neutral in respect to working in a team, in order of preference.
Name of your choice

24
5. You should choose 3 colleagues to be your leader of a team, in order of preference.
Name of your choice
* 6. You should choose 3 colleagues to not be your leader of a team, in order of preference.
Name of your choice
7. You should choose 3 colleagues who are neutral in your choice to be your leader of a team, in order of preference.
Name of your choice
8. You should choose 3 colleagues with whom you would like to take a trip together, in order of preference.
Name of your choice

25
* 9. You should choose 3 colleagues with whom you would not like to take a trip together, in order of preference.
Name of your choice
10. You should choose 3 colleagues with whom you would be neutral in respect to taking a trip together, in order of preference.
Name of your choice
11. In a situation where you are going through a personal problem, you should choose 3 colleagues with whom you would share this problem and seek support, in order of preference. Name of your choice
12. In a situation where you are going through a personal problem, you should choose 3 colleagues with whom you would not share this problem and seek support, in order of preference. Name of your choice

13. In a situation where you are going through a personal problem, you should choose 3 colleagues with whom you would be neutral in respect to sharing this problem and seeking support, in order of preference.
Name of your choice
14. Please explain in a few words what you felt when you answered this survey. 15. Some of the questions were difficult for you answer. Which was/were and why?
Kumu software
Kumu is cloud software produced by Kumu Inc., which has the objective of
facilitating the analysis of relationships, through network mapping and the use of certain
metrics. So, this software simplifies the analysis of complex systems.
The metrics utilized from Kumu are the following: Size, Degree Centrality and
Indegree. These metrics are described in Analysis of the Sociometric Test in this
dissertation.

27
DATA ANALISYS AND DISCUSSION OF THE RESULTS
The group selected to take the Sociometric Test was the 26 students from
Corporate International Master 2, which the researcher is a member. This group was
composed of 66% Males and 34% Females, from 12 different countries of Citizenship,
14 different languages spoken and 10 Countries of Residence.
They had an average of 12 years of work experience and more than 200 employees
under their supervision. The amounts of 11% are executives, 35% occupy senior
positions, 46% are in intermediate positions and only 8% are juniors.
Figure 8 - Selected group profile.

28
The profile of the group is important because it has an influence over the results
of the Sociometric Test and shows the cultural diversity and experience of the
respondents.
This selected group studied together for one year and they had four international
modules in Washington - USA, Rio de Janeiro - Brazil, Barcelona - Spain and Shanghai
- China. During these modules they participated in many group projects and they had
some leisure time together. Between the international modules, they had virtual modules
where they exchanged a lot of information via email and Skype. So, during one year the
group had constant contact.
It is worth mentioning that the researcher is part of the CIM 2 and he who applied
the research. This may have influenced the choices of respondents, since the choices are
based on the personal relationship level of each individual. Besides this, the fact that the
respondents choices would be kept secret was guaranteed. However, the only case that
would not be guaranteed complete confidentiality was related to the researcher who had
access to all the research results and he would know who rejected him. For the same
reason, the individuals could choose him, because he would know who chose him
positively (attraction).
Thus, among those with more positive (attractions) or neutral (indifferent)
choices, may appear the researcher.
So there is a good chance the researcher had influenced the outcome of this
research. This issue does not invalidate the research, but it creates a warning that is
concerning the implementation of the method by a person outside the studied group.
Analysis of the Sociometric Test
As an instrument of analysis, the sociograms and sociometric matrix show
important details about the interrelationships of the selected group members.
All sociometric symbols and typical internal structures of the sociograms are
described in Appendix B - Sociometric Symbols and Internal Structures.
The colors used in the cell to represent the negative, positive and neutral choices
were blue for positive (attraction), red for negative (rejection), green for neutrality
(neutral). At the end of the spreadsheet, the numbers of positive, negative and neutral
choices of the selected group were summarized as well as the number of positive,
29
negative and neutral mutualities and the incongruences. The incongruences were
represented with black arrows in a Sociometric Matrix.
In addition, using the results of positive, negative and neutral choices in each chart
(spreadsheet) below and for each scenario, it is possible to define the stars (largest
number of positive choices), rejects (largest number of negative choices) and isolates
(largest number of neutral choices).
Also, the number of incongruences shows, in some cases, the conflicts and
frustration that can be generated in a person who chooses someone who rejects them.
Thus, most of the conflicts and frustration created in a group are caused by the
mutualities and incongruences.
Another negative impact in a group, generated by the negative mutualities and
serious incongruences (incompatible relationship, attractions x rejections) is the lack of
communication inside a group. So, this lack of communication can affect the success of
a project or the operation of two or more areas on a company, or, in the worst case, on
the whole company (Krackhardt & Hanson, 1993; Pentland, 2012).
The software Kumu was used to plot the Sociograms (maps) as well as to develop
some analyses using the metrics brought by this software. For running the metrics, the
database obtained by the sociometric test applied to the selected group was used.
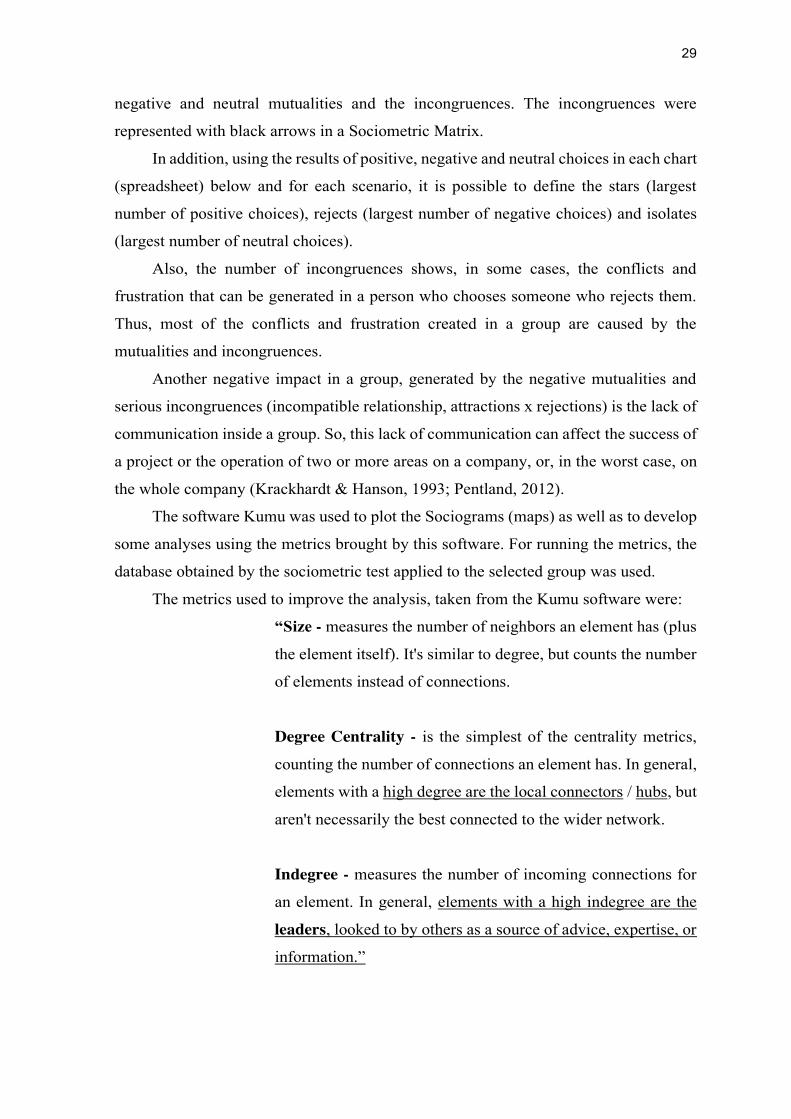
The metrics used to improve the analysis, taken from the Kumu software were:
“Size - measures the number of neighbors an element has (plus
the element itself). It's similar to degree, but counts the number
of elements instead of connections.
Degree Centrality - is the simplest of the centrality metrics,
counting the number of connections an element has. In general,
elements with a high degree are the local connectors / hubs, but
aren't necessarily the best connected to the wider network.
Indegree - measures the number of incoming connections for
an element. In general, elements with a high indegree are the
leaders, looked to by others as a source of advice, expertise, or
information.”
30
Analysis of Teamwork Sociometric Test
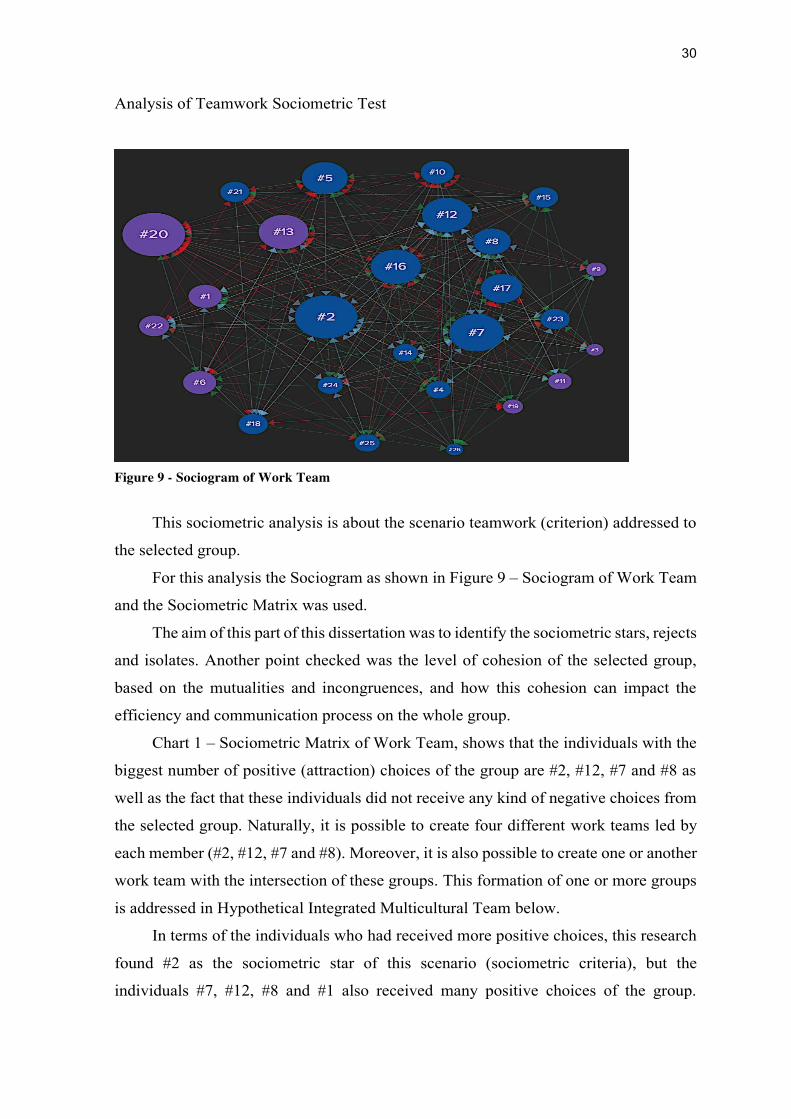
Figure 9 - Sociogram of Work Team
This sociometric analysis is about the scenario teamwork (criterion) addressed to
the selected group.
For this analysis the Sociogram as shown in Figure 9 – Sociogram of Work Team
and the Sociometric Matrix was used.
The aim of this part of this dissertation was to identify the sociometric stars, rejects
and isolates. Another point checked was the level of cohesion of the selected group,
based on the mutualities and incongruences, and how this cohesion can impact the
efficiency and communication process on the whole group.
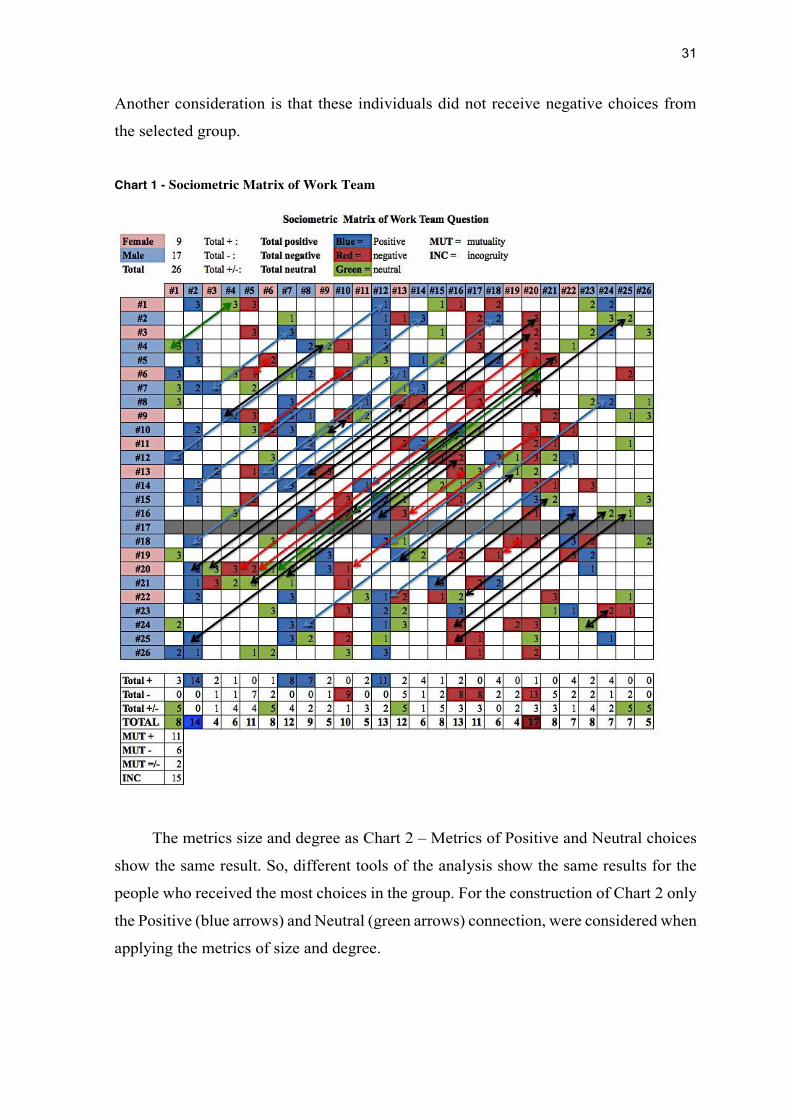
Chart 1 – Sociometric Matrix of Work Team, shows that the individuals with the
biggest number of positive (attraction) choices of the group are #2, #12, #7 and #8 as
well as the fact that these individuals did not receive any kind of negative choices from
the selected group. Naturally, it is possible to create four different work teams led by
each member (#2, #12, #7 and #8). Moreover, it is also possible to create one or another
work team with the intersection of these groups. This formation of one or more groups
is addressed in Hypothetical Integrated Multicultural Team below.
In terms of the individuals who had received more positive choices, this research
found #2 as the sociometric star of this scenario (sociometric criteria), but the
individuals #7, #12, #8 and #1 also received many positive choices of the group.
31
Another consideration is that these individuals did not receive negative choices from
the selected group.
Chart 1 - Sociometric Matrix of Work Team
The metrics size and degree as Chart 2 – Metrics of Positive and Neutral choices
show the same result. So, different tools of the analysis show the same results for the
people who received the most choices in the group. For the construction of Chart 2 only
the Positive (blue arrows) and Neutral (green arrows) connection, were considered when
applying the metrics of size and degree.

32
Chart 2 - Metric of Positive and Neutral choices
RANK SIZE DEGREE #1 #2 #2 #2 #12 #12 #3 #7 #7 #4 #8 #8 #5 #23 #1
According the Sociometric Matrix of Work in Team – Chart 2, the individual
who had been rejected the most by the group was #20, followed by #10, #16, #17 and
#5. These people who were rejected in a group where one or more of the individuals
who had rejected them needs to interact with them could cause a lack of communication
and generate inefficiency within this hypothetical group. For Chart 3 only the Negative
connections of the selected group were considered and applied to the metrics of size and
degree.
Chart 3 - Metric of Negative choices
RANK SIZE DEGREE #1 #20 #20 #2 #16 #10 #3 #10 #16 #4 #17 #5 #5 #21 #17
Regarding neutrality, there was a spread of the choices, without concentration in
four individuals, which had happened with the choices of attraction and rejection. In the
point of view of this researcher, this neutrality did not impact any work groups, as long
as there hadn't any incongruences regarding the choices. Neutrality does not cause a
problem for coexistence because the individual is indifferent to the relationship.
Relationship problems only occur if there is a neutral choice on the part of an individual
and the rejection by the other.
The types of incongruences that can affect teamwork are neutral choices with
negative choices, as represented in Chart 4 Analysis of Mutualities and Incongruences
from Work Team Scenario, in the orange column, as well as negative choices with
positive choices, represented by yellow column.
33
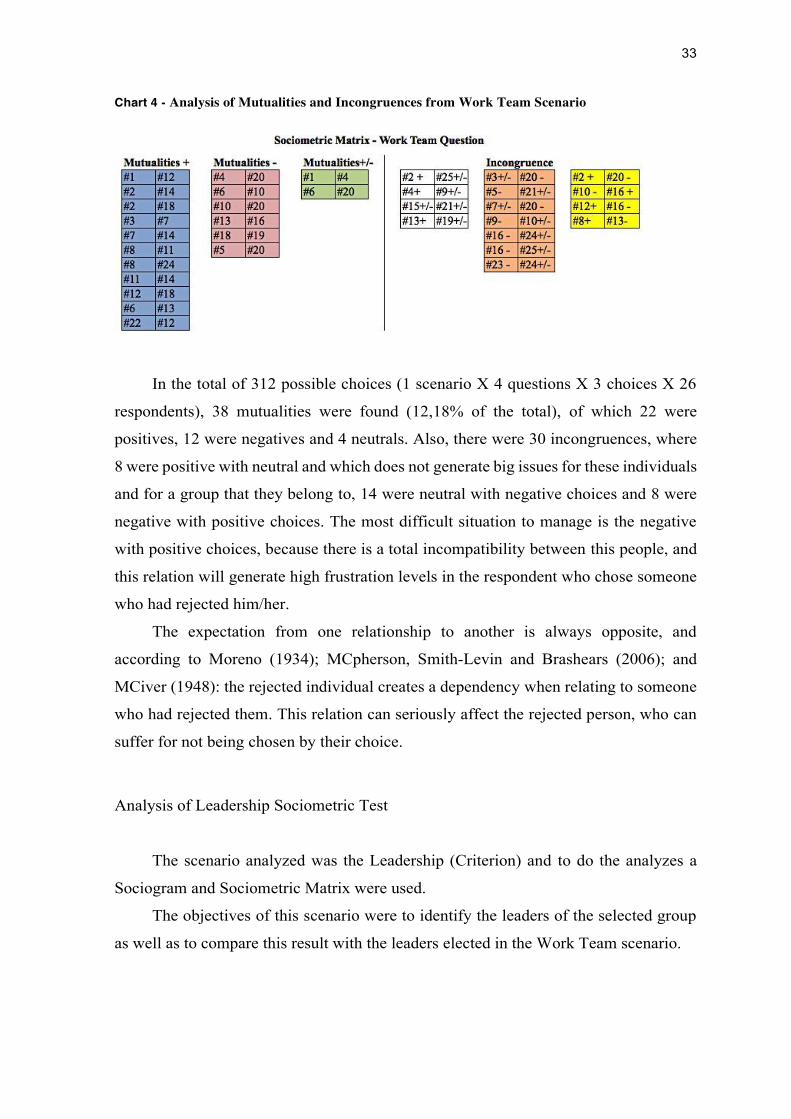
Chart 4 - Analysis of Mutualities and Incongruences from Work Team Scenario
In the total of 312 possible choices (1 scenario X 4 questions X 3 choices X 26
respondents), 38 mutualities were found (12,18% of the total), of which 22 were
positives, 12 were negatives and 4 neutrals. Also, there were 30 incongruences, where
8 were positive with neutral and which does not generate big issues for these individuals
and for a group that they belong to, 14 were neutral with negative choices and 8 were
negative with positive choices. The most difficult situation to manage is the negative
with positive choices, because there is a total incompatibility between this people, and
this relation will generate high frustration levels in the respondent who chose someone
who had rejected him/her.
The expectation from one relationship to another is always opposite, and
according to Moreno (1934); MCpherson, Smith-Levin and Brashears (2006); and
MCiver (1948): the rejected individual creates a dependency when relating to someone
who had rejected them. This relation can seriously affect the rejected person, who can
suffer for not being chosen by their choice.
Analysis of Leadership Sociometric Test
The scenario analyzed was the Leadership (Criterion) and to do the analyzes a
Sociogram and Sociometric Matrix were used.
The objectives of this scenario were to identify the leaders of the selected group
as well as to compare this result with the leaders elected in the Work Team scenario.
34
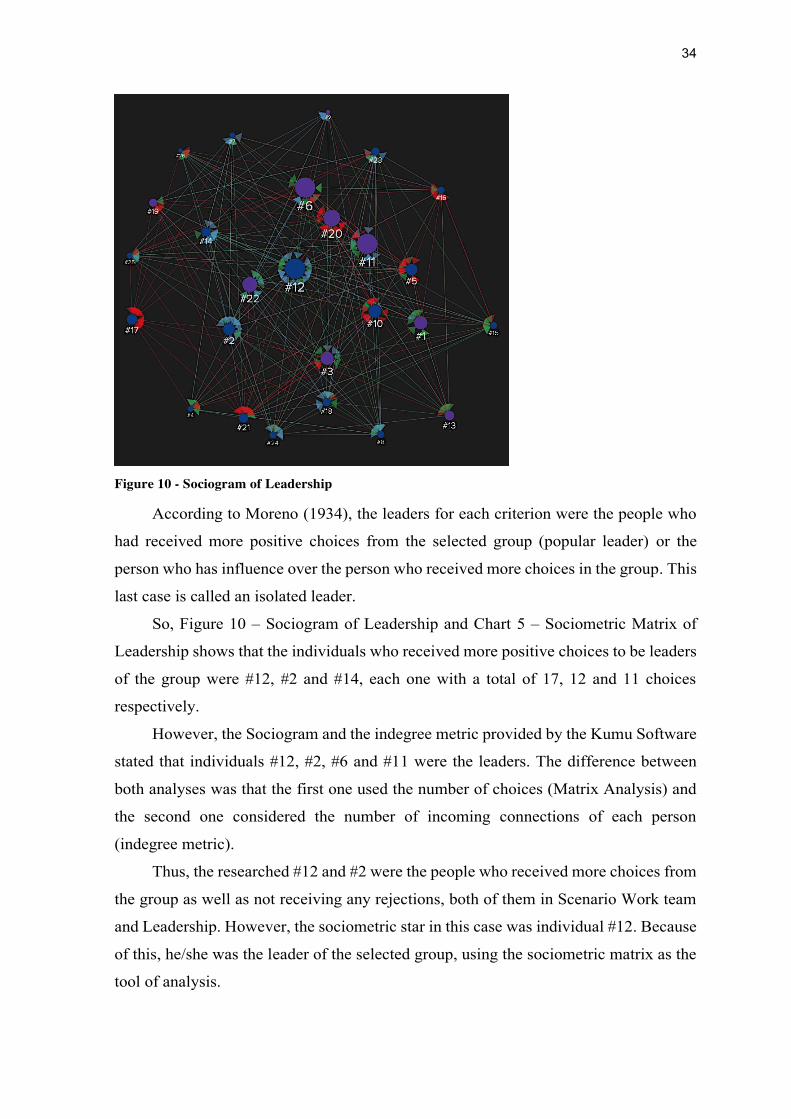
Figure 10 - Sociogram of Leadership
According to Moreno (1934), the leaders for each criterion were the people who
had received more positive choices from the selected group (popular leader) or the
person who has influence over the person who received more choices in the group. This
last case is called an isolated leader.
So, Figure 10 – Sociogram of Leadership and Chart 5 – Sociometric Matrix of
Leadership shows that the individuals who received more positive choices to be leaders
of the group were #12, #2 and #14, each one with a total of 17, 12 and 11 choices
respectively.
However, the Sociogram and the indegree metric provided by the Kumu Software
stated that individuals #12, #2, #6 and #11 were the leaders. The difference between
both analyses was that the first one used the number of choices (Matrix Analysis) and
the second one considered the number of incoming connections of each person
(indegree metric).
Thus, the researched #12 and #2 were the people who received more choices from
the group as well as not receiving any rejections, both of them in Scenario Work team
and Leadership. However, the sociometric star in this case was individual #12. Because
of this, he/she was the leader of the selected group, using the sociometric matrix as the
tool of analysis.
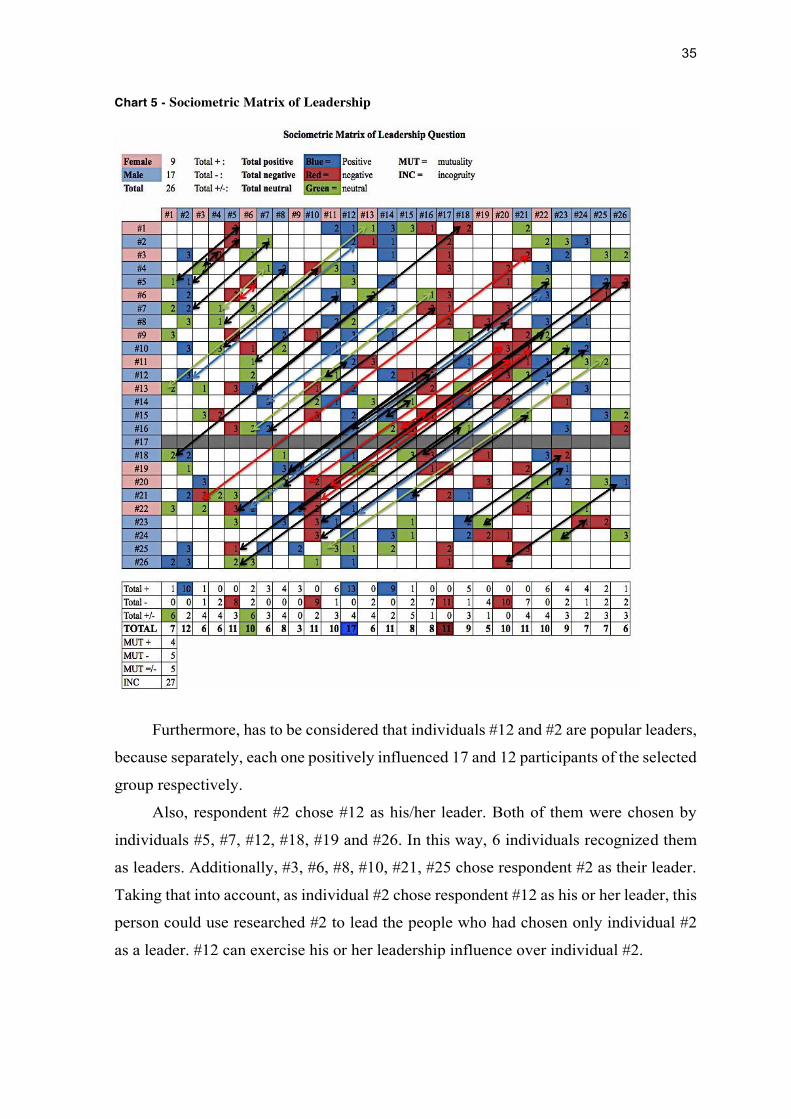
35
Chart 5 - Sociometric Matrix of Leadership
Furthermore, has to be considered that individuals #12 and #2 are popular leaders,
because separately, each one positively influenced 17 and 12 participants of the selected
group respectively.
Also, respondent #2 chose #12 as his/her leader. Both of them were chosen by
individuals #5, #7, #12, #18, #19 and #26. In this way, 6 individuals recognized them
as leaders. Additionally, #3, #6, #8, #10, #21, #25 chose respondent #2 as their leader.
Taking that into account, as individual #2 chose respondent #12 as his or her leader, this
person could use researched #2 to lead the people who had chosen only individual #2
as a leader. #12 can exercise his or her leadership influence over individual #2.
36
The leaders could exercise this indirect influence in many ways inside a specific
group. The only thing that the leaders have to do is to identify the other leaders, mainly
if they are powerful leaders. The sociometric test can help the leader to do this
identification.
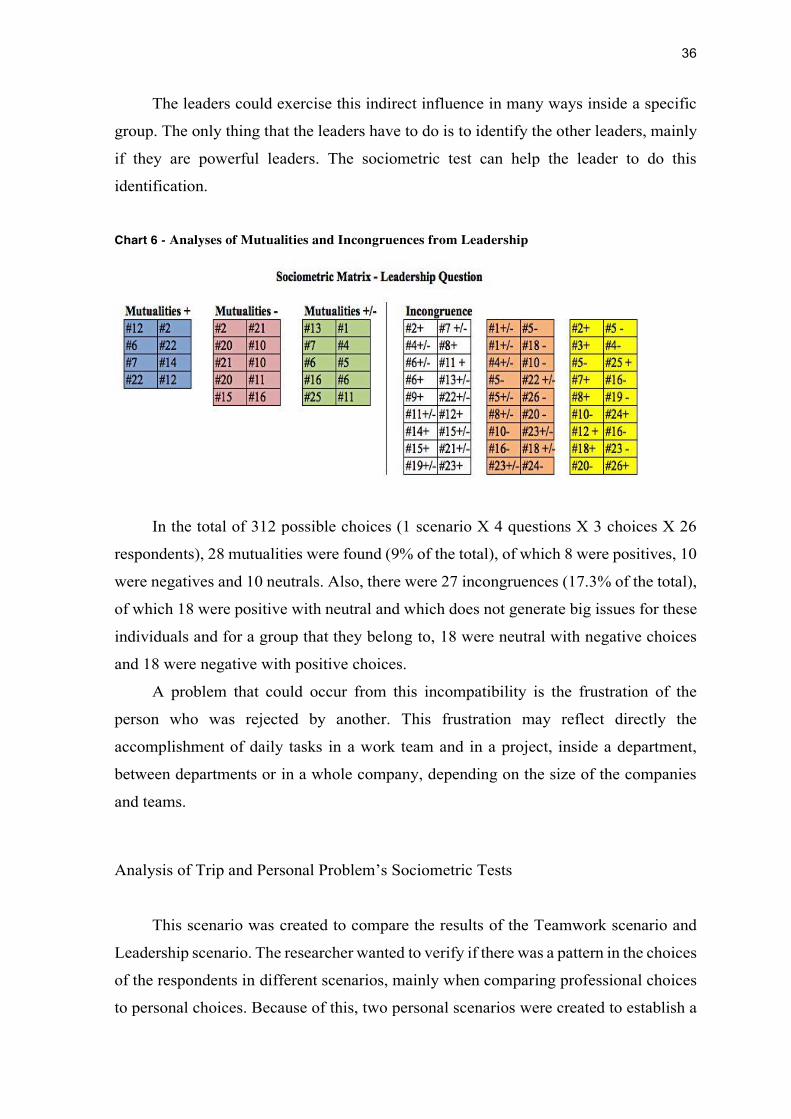
Chart 6 - Analyses of Mutualities and Incongruences from Leadership
In the total of 312 possible choices (1 scenario X 4 questions X 3 choices X 26
respondents), 28 mutualities were found (9% of the total), of which 8 were positives, 10
were negatives and 10 neutrals. Also, there were 27 incongruences (17.3% of the total),
of which 18 were positive with neutral and which does not generate big issues for these
individuals and for a group that they belong to, 18 were neutral with negative choices
and 18 were negative with positive choices.
A problem that could occur from this incompatibility is the frustration of the
person who was rejected by another. This frustration may reflect directly the
accomplishment of daily tasks in a work team and in a project, inside a department,
between departments or in a whole company, depending on the size of the companies
and teams.
Analysis of Trip and Personal Problem’s Sociometric Tests
This scenario was created to compare the results of the Teamwork scenario and
Leadership scenario. The researcher wanted to verify if there was a pattern in the choices
of the respondents in different scenarios, mainly when comparing professional choices
to personal choices. Because of this, two personal scenarios were created to establish a

37
base of comparison with the other two professional scenarios addressed to the selected
group. Chart 7 – Sociometric Matrix of a Trip and Chart 8 – Sociometric Matrix of
Personal Problem and Figures 11, 12, 13 and 14, demonstrated a pattern of rejection
between them and with Chart 1 – Sociometric Matrix of Work Team and Chart 5 –
Sociometric Matrix of Leadership. In all of them, individuals #5, #10, #16, #17 and #20
were among the top 5 rejections.
Figure 11 - Negative choices of work Team
Figure 12 - Negative choices of Leadership
Figure 13 - Negative Choices of Trip
Figure 14 - Negative Choices of Personal Problems
Thus, it is clearly plausible to identify a pattern of rejection in the sample studied
in all of the presented criteria.
38
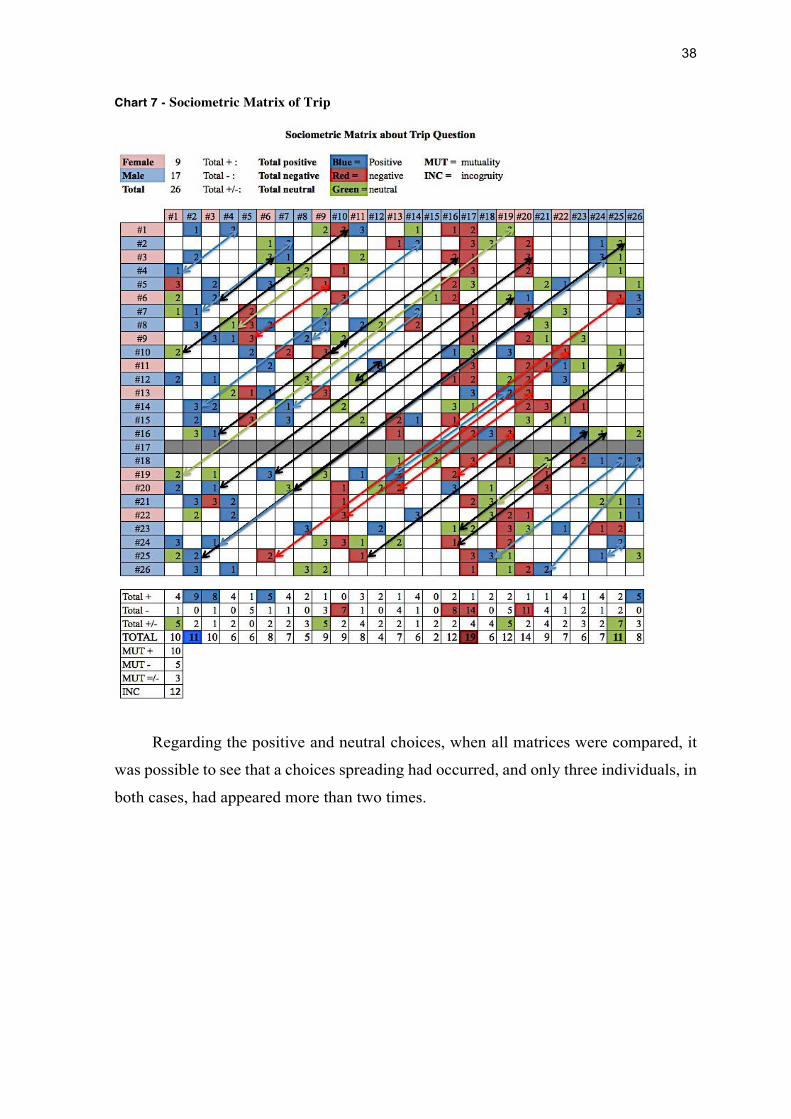
Chart 7 - Sociometric Matrix of Trip
Regarding the positive and neutral choices, when all matrices were compared, it
was possible to see that a choices spreading had occurred, and only three individuals, in
both cases, had appeared more than two times.
39
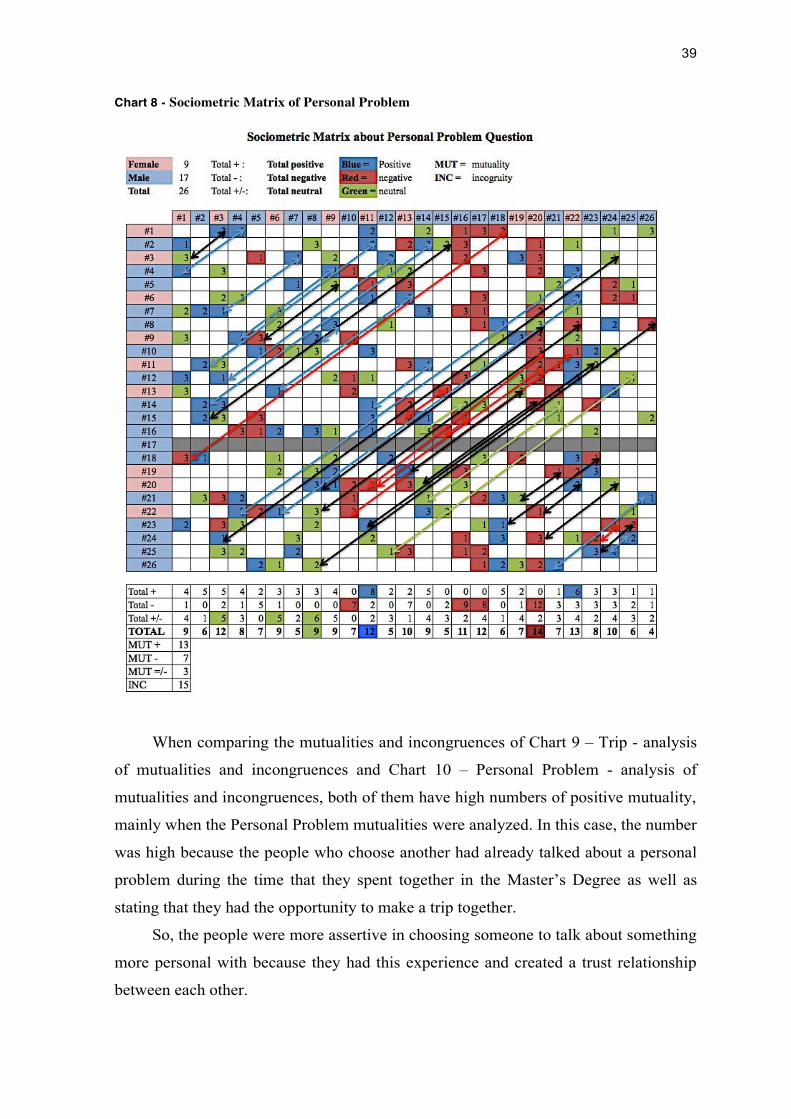
Chart 8 - Sociometric Matrix of Personal Problem
When comparing the mutualities and incongruences of Chart 9 – Trip - analysis
of mutualities and incongruences and Chart 10 – Personal Problem - analysis of
mutualities and incongruences, both of them have high numbers of positive mutuality,
mainly when the Personal Problem mutualities were analyzed. In this case, the number
was high because the people who choose another had already talked about a personal
problem during the time that they spent together in the Master’s Degree as well as
stating that they had the opportunity to make a trip together.
So, the people were more assertive in choosing someone to talk about something
more personal with because they had this experience and created a trust relationship
between each other.
40
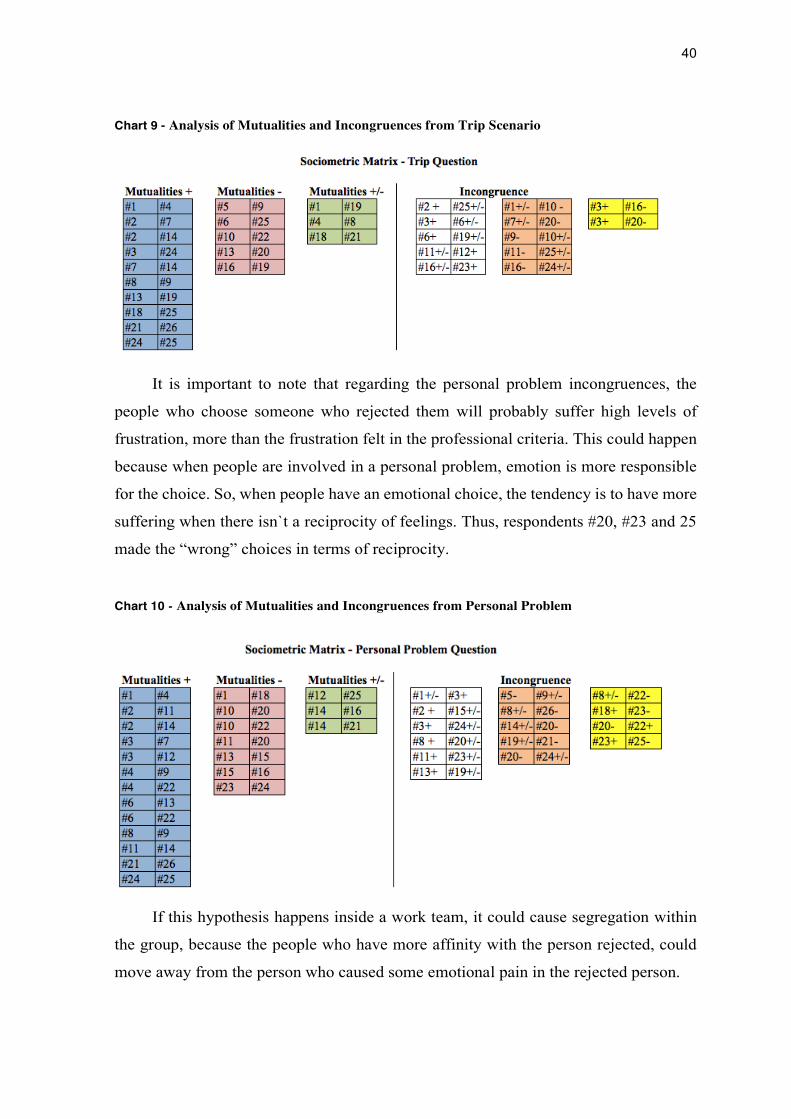
Chart 9 - Analysis of Mutualities and Incongruences from Trip Scenario
It is important to note that regarding the personal problem incongruences, the
people who choose someone who rejected them will probably suffer high levels of
frustration, more than the frustration felt in the professional criteria. This could happen
because when people are involved in a personal problem, emotion is more responsible
for the choice. So, when people have an emotional choice, the tendency is to have more
suffering when there isn`t a reciprocity of feelings. Thus, respondents #20, #23 and 25
made the “wrong” choices in terms of reciprocity. Chart 10 - Analysis of Mutualities and Incongruences from Personal Problem
If this hypothesis happens inside a work team, it could cause segregation within
the group, because the people who have more affinity with the person rejected, could
move away from the person who caused some emotional pain in the rejected person.
41
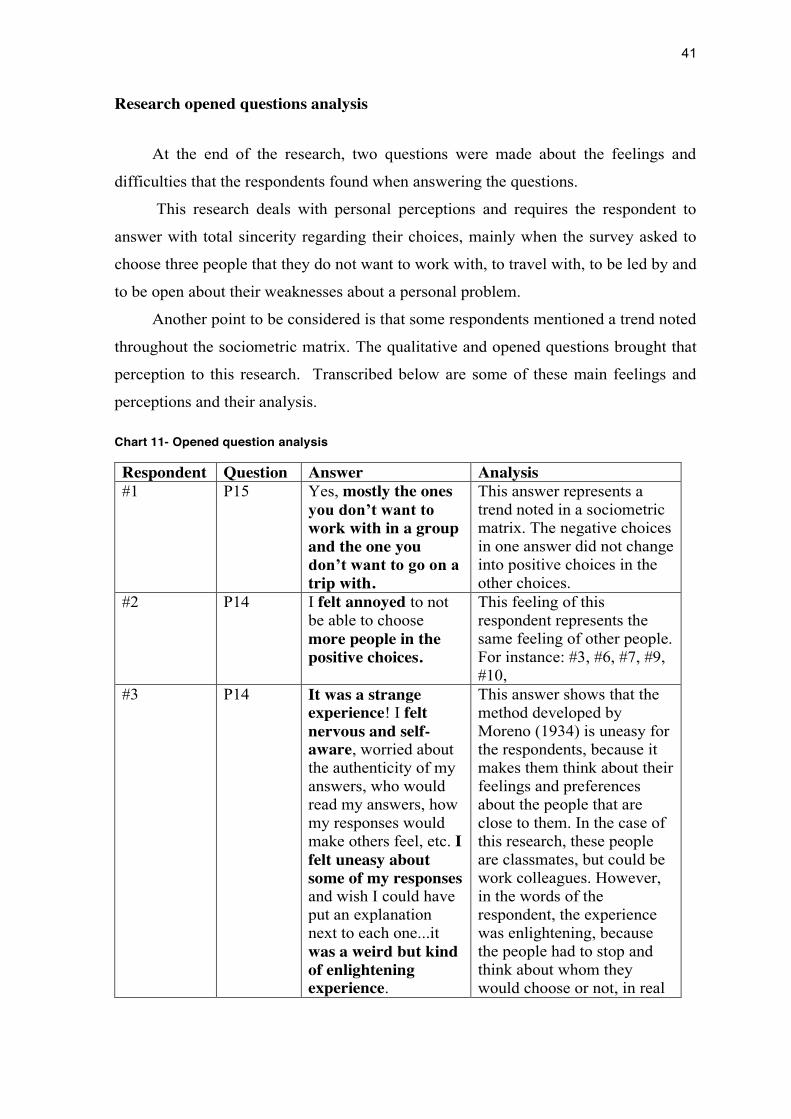
Research opened questions analysis
At the end of the research, two questions were made about the feelings and
difficulties that the respondents found when answering the questions.
This research deals with personal perceptions and requires the respondent to
answer with total sincerity regarding their choices, mainly when the survey asked to
choose three people that they do not want to work with, to travel with, to be led by and
to be open about their weaknesses about a personal problem.
Another point to be considered is that some respondents mentioned a trend noted
throughout the sociometric matrix. The qualitative and opened questions brought that
perception to this research. Transcribed below are some of these main feelings and
perceptions and their analysis. Chart 11- Opened question analysis
Respondent Question Answer Analysis #1 P15 Yes, mostly the ones
you don’t want to work with in a group and the one you don’t want to go on a trip with.
This answer represents a trend noted in a sociometric matrix. The negative choices in one answer did not change into positive choices in the other choices.
#2 P14 I felt annoyed to not be able to choose more people in the positive choices.
This feeling of this respondent represents the same feeling of other people. For instance: #3, #6, #7, #9, #10,
#3 P14 It was a strange experience! I felt nervous and self-aware, worried about the authenticity of my answers, who would read my answers, how my responses would make others feel, etc. I felt uneasy about some of my responses and wish I could have put an explanation next to each one...it was a weird but kind of enlightening experience.
This answer shows that the method developed by Moreno (1934) is uneasy for the respondents, because it makes them think about their feelings and preferences about the people that are close to them. In the case of this research, these people are classmates, but could be work colleagues. However, in the words of the respondent, the experience was enlightening, because the people had to stop and think about whom they would choose or not, in real
42
situations, based on their preferences.
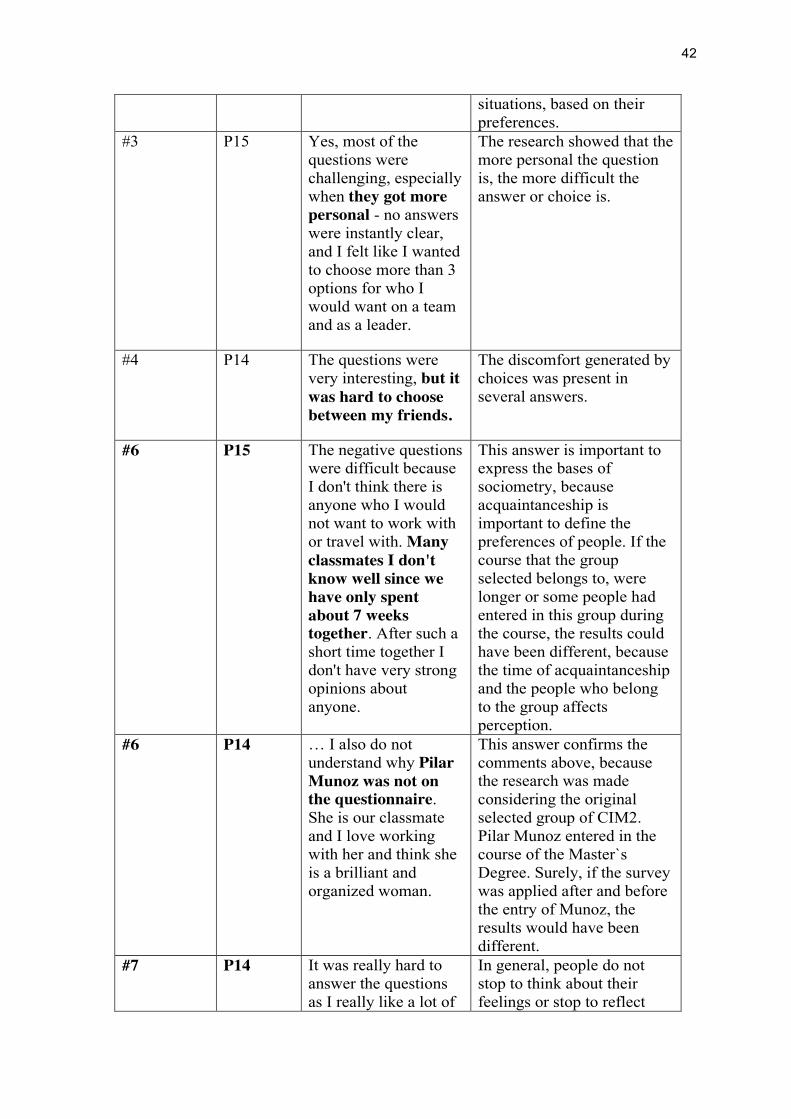
#3 P15 Yes, most of the questions were challenging, especially when they got more personal - no answers were instantly clear, and I felt like I wanted to choose more than 3 options for who I would want on a team and as a leader.
The research showed that the more personal the question is, the more difficult the answer or choice is.
#4 P14 The questions were very interesting, but it was hard to choose between my friends.
The discomfort generated by choices was present in several answers.
#6 P15 The negative questions were difficult because I don't think there is anyone who I would not want to work with or travel with. Many classmates I don't know well since we have only spent about 7 weeks together. After such a short time together I don't have very strong opinions about anyone.
This answer is important to express the bases of sociometry, because acquaintanceship is important to define the preferences of people. If the course that the group selected belongs to, were longer or some people had entered in this group during the course, the results could have been different, because the time of acquaintanceship and the people who belong to the group affects perception.
#6 P14 … I also do not understand why Pilar Munoz was not on the questionnaire. She is our classmate and I love working with her and think she is a brilliant and organized woman.
This answer confirms the comments above, because the research was made considering the original selected group of CIM2. Pilar Munoz entered in the course of the Master`s Degree. Surely, if the survey was applied after and before the entry of Munoz, the results would have been different.
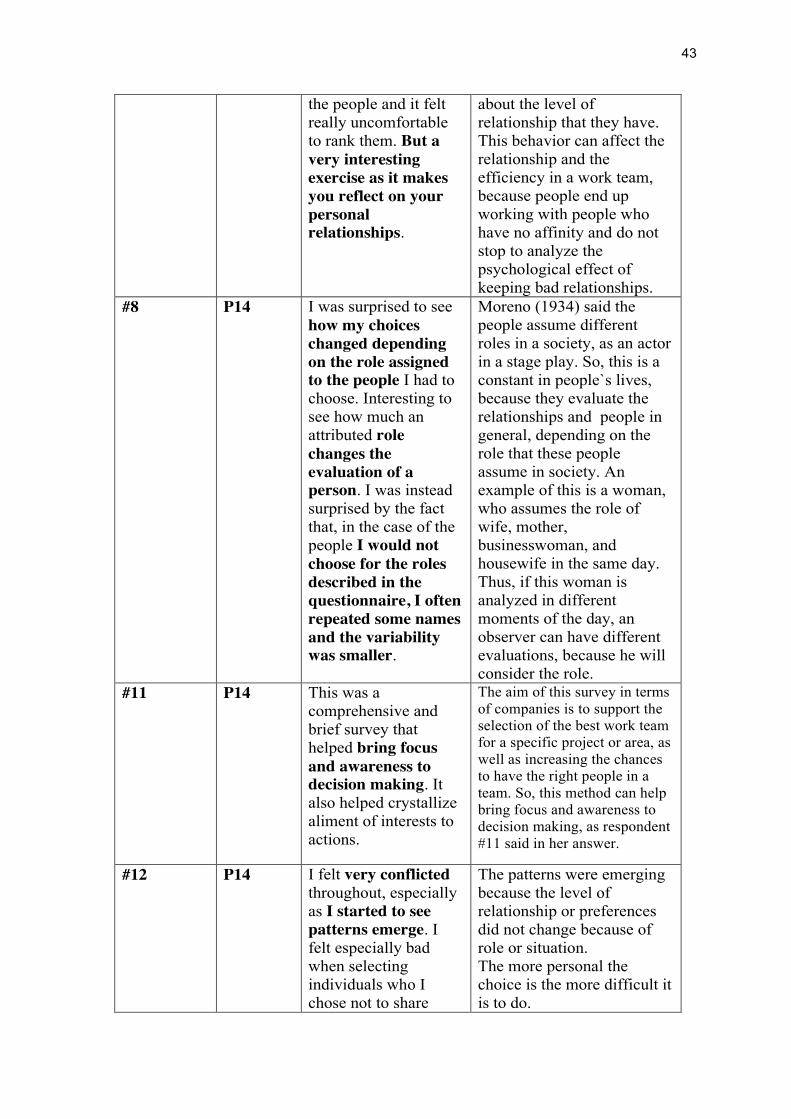
#7 P14 It was really hard to answer the questions as I really like a lot of
In general, people do not stop to think about their feelings or stop to reflect
43
the people and it felt really uncomfortable to rank them. But a very interesting exercise as it makes you reflect on your personal relationships.
about the level of relationship that they have. This behavior can affect the relationship and the efficiency in a work team, because people end up working with people who have no affinity and do not stop to analyze the psychological effect of keeping bad relationships.
#8 P14 I was surprised to see how my choices changed depending on the role assigned to the people I had to choose. Interesting to see how much an attributed role changes the evaluation of a person. I was instead surprised by the fact that, in the case of the people I would not choose for the roles described in the questionnaire, I often repeated some names and the variability was smaller.
Moreno (1934) said the people assume different roles in a society, as an actor in a stage play. So, this is a constant in people`s lives, because they evaluate the relationships and people in general, depending on the role that these people assume in society. An example of this is a woman, who assumes the role of wife, mother, businesswoman, and housewife in the same day. Thus, if this woman is analyzed in different moments of the day, an observer can have different evaluations, because he will consider the role.
#11 P14 This was a comprehensive and brief survey that helped bring focus and awareness to decision making. It also helped crystallize aliment of interests to actions.
The aim of this survey in terms of companies is to support the selection of the best work team for a specific project or area, as well as increasing the chances to have the right people in a team. So, this method can help bring focus and awareness to decision making, as respondent #11 said in her answer.
#12 P14 I felt very conflicted throughout, especially as I started to see patterns emerge. I felt especially bad when selecting individuals who I chose not to share
The patterns were emerging because the level of relationship or preferences did not change because of role or situation. The more personal the choice is the more difficult it is to do.

44
personal problems with or with whom I preferred not to travel with.
#16
P15 The trip question because I haven't been in a traveling situation with many of them and compatible travelers are notoriously difficult to predict.
The answer shows the difficulty of the individual in choosing someone based on a fictional situation, because this respondent did not experience a trip together with some of the people from the selected group. However, he made his choices based on his former experiences in other circumstances. Of course, if he had had any travel experience with the selected group, he would have made a better choice.
#18 P14 Since the beginning of the Program I was almost certain who were the people I wanted to stay distant from. On the other hand the ones I would like to stay close to and trust, it took me almost the entire program to find this out.
When the respondent cites the words close and trust it means that he had established a strong connection with the people who he selected. This feeling of trust and closeness is very important in building a strong work team.
#19 P14
I think the answers to these questions are private and don't need to be shared. I just responded because a good friend … asked me to do it for his thesis. However, the questions regarding "who wouldn't be chosen for...." Is something I've never thought of before.
The answer demonstrates that this process of applying and managing the information obtained from this methodology has been done with care and the results need to be transformed into metrics that the respondents could have the access to. Nevertheless, this is important to know the type of connections between the group and how to manage these connections. The second part of the answer is important to prove
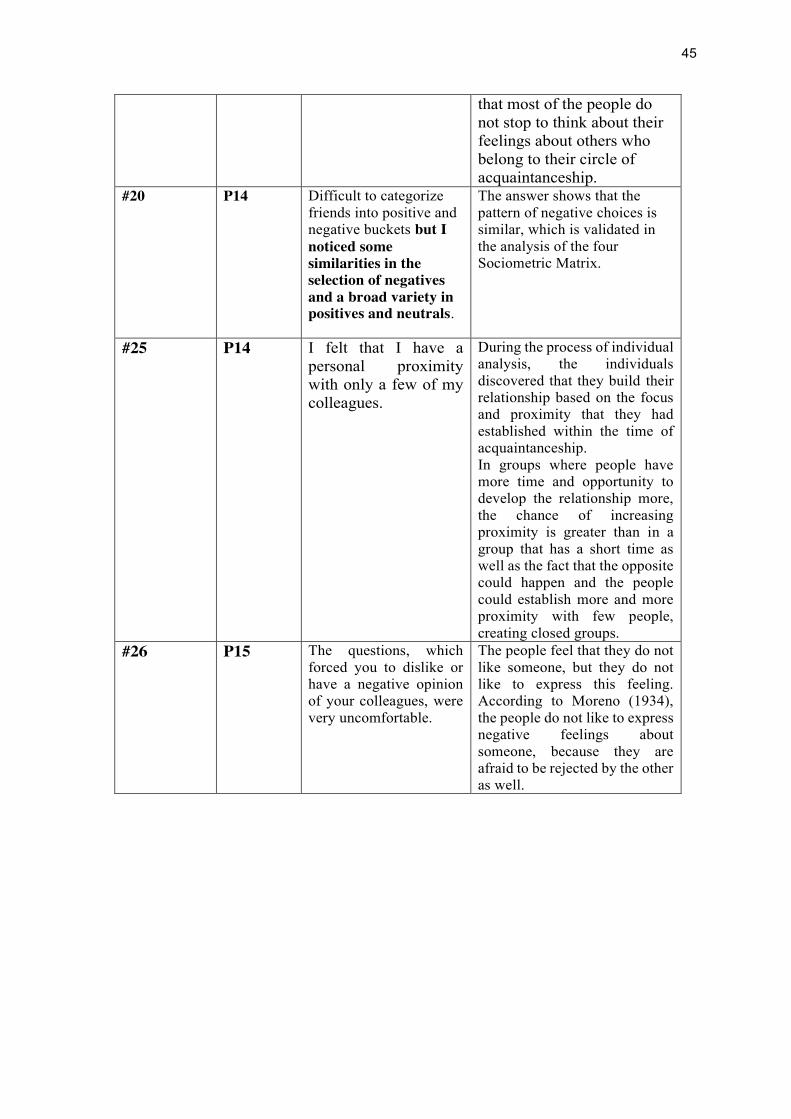
45
that most of the people do not stop to think about their feelings about others who belong to their circle of acquaintanceship.
#20 P14 Difficult to categorize friends into positive and negative buckets but I noticed some similarities in the selection of negatives and a broad variety in positives and neutrals.
The answer shows that the pattern of negative choices is similar, which is validated in the analysis of the four Sociometric Matrix.
#25 P14 I felt that I have a personal proximity with only a few of my colleagues.
During the process of individual analysis, the individuals discovered that they build their relationship based on the focus and proximity that they had established within the time of acquaintanceship. In groups where people have more time and opportunity to develop the relationship more, the chance of increasing proximity is greater than in a group that has a short time as well as the fact that the opposite could happen and the people could establish more and more proximity with few people, creating closed groups.
#26 P15 The questions, which forced you to dislike or have a negative opinion of your colleagues, were very uncomfortable.
The people feel that they do not like someone, but they do not like to express this feeling. According to Moreno (1934), the people do not like to express negative feelings about someone, because they are afraid to be rejected by the other as well.
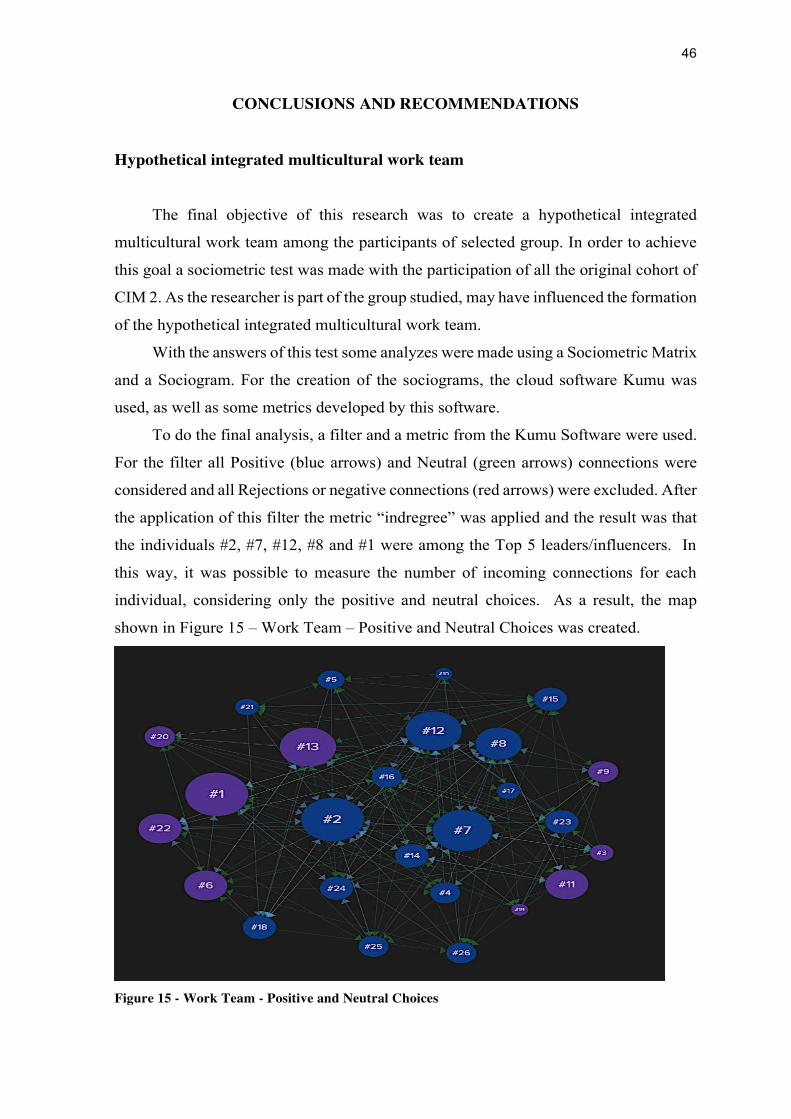
46
CONCLUSIONS AND RECOMMENDATIONS
Hypothetical integrated multicultural work team The final objective of this research was to create a hypothetical integrated
multicultural work team among the participants of selected group. In order to achieve
this goal a sociometric test was made with the participation of all the original cohort of
CIM 2. As the researcher is part of the group studied, may have influenced the formation
of the hypothetical integrated multicultural work team.
With the answers of this test some analyzes were made using a Sociometric Matrix
and a Sociogram. For the creation of the sociograms, the cloud software Kumu was
used, as well as some metrics developed by this software.
To do the final analysis, a filter and a metric from the Kumu Software were used.
For the filter all Positive (blue arrows) and Neutral (green arrows) connections were
considered and all Rejections or negative connections (red arrows) were excluded. After
the application of this filter the metric “indregree” was applied and the result was that
the individuals #2, #7, #12, #8 and #1 were among the Top 5 leaders/influencers. In
this way, it was possible to measure the number of incoming connections for each
individual, considering only the positive and neutral choices. As a result, the map
shown in Figure 15 – Work Team – Positive and Neutral Choices was created.
Figure 15 - Work Team - Positive and Neutral Choices
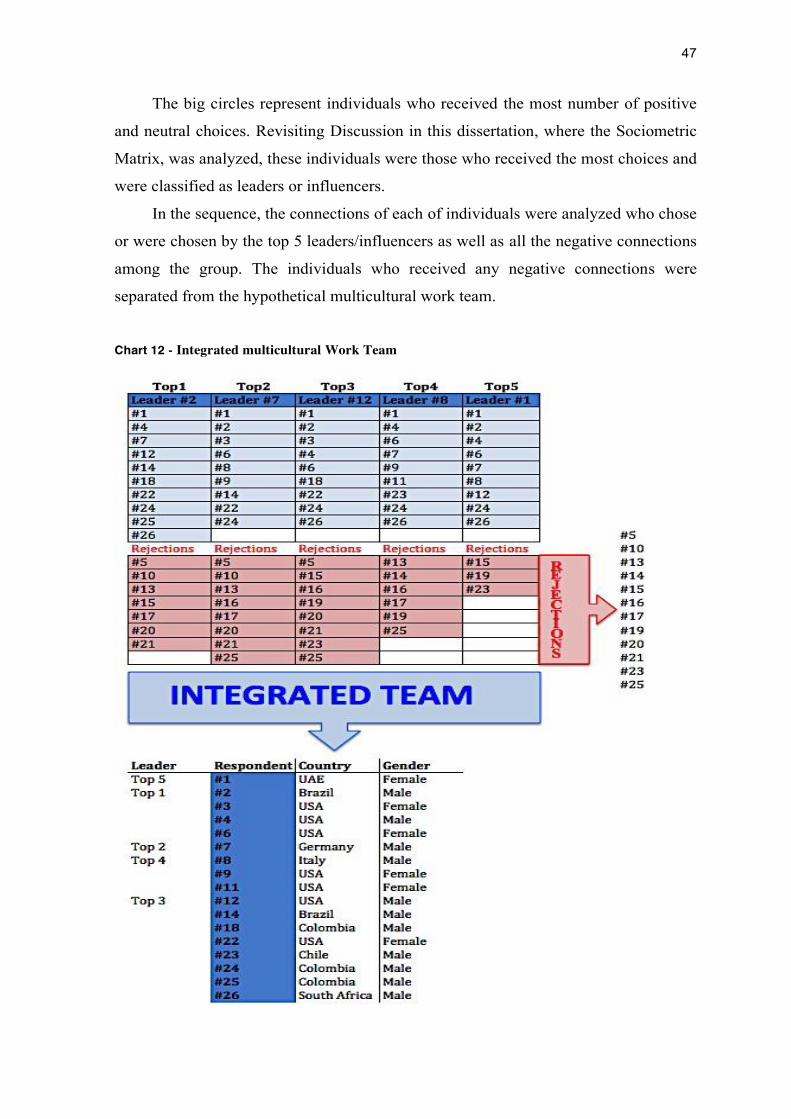
47
The big circles represent individuals who received the most number of positive
and neutral choices. Revisiting Discussion in this dissertation, where the Sociometric
Matrix, was analyzed, these individuals were those who received the most choices and
were classified as leaders or influencers.
In the sequence, the connections of each of individuals were analyzed who chose
or were chosen by the top 5 leaders/influencers as well as all the negative connections
among the group. The individuals who received any negative connections were
separated from the hypothetical multicultural work team.
Chart 12 - Integrated multicultural Work Team
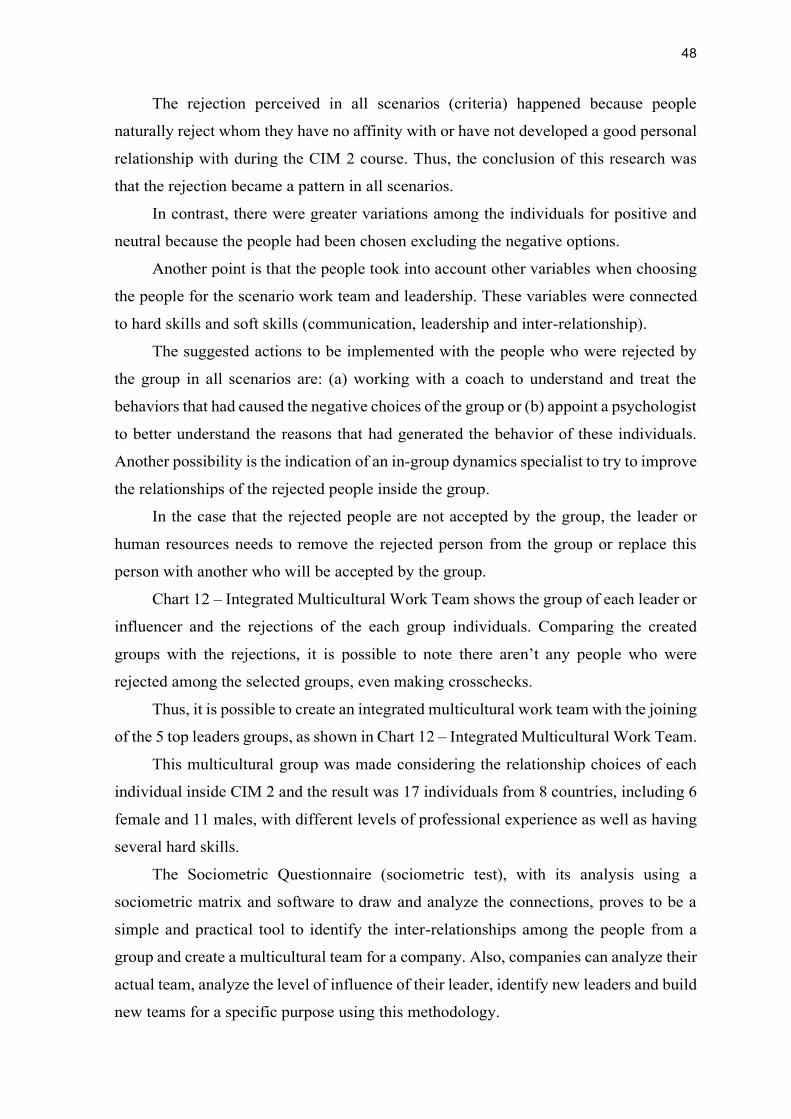
48
The rejection perceived in all scenarios (criteria) happened because people
naturally reject whom they have no affinity with or have not developed a good personal
relationship with during the CIM 2 course. Thus, the conclusion of this research was
that the rejection became a pattern in all scenarios.
In contrast, there were greater variations among the individuals for positive and
neutral because the people had been chosen excluding the negative options.
Another point is that the people took into account other variables when choosing
the people for the scenario work team and leadership. These variables were connected
to hard skills and soft skills (communication, leadership and inter-relationship).
The suggested actions to be implemented with the people who were rejected by
the group in all scenarios are: (a) working with a coach to understand and treat the
behaviors that had caused the negative choices of the group or (b) appoint a psychologist
to better understand the reasons that had generated the behavior of these individuals.
Another possibility is the indication of an in-group dynamics specialist to try to improve
the relationships of the rejected people inside the group.
In the case that the rejected people are not accepted by the group, the leader or
human resources needs to remove the rejected person from the group or replace this
person with another who will be accepted by the group.
Chart 12 – Integrated Multicultural Work Team shows the group of each leader or
influencer and the rejections of the each group individuals. Comparing the created
groups with the rejections, it is possible to note there aren’t any people who were
rejected among the selected groups, even making crosschecks.
Thus, it is possible to create an integrated multicultural work team with the joining
of the 5 top leaders groups, as shown in Chart 12 – Integrated Multicultural Work Team.
This multicultural group was made considering the relationship choices of each
individual inside CIM 2 and the result was 17 individuals from 8 countries, including 6
female and 11 males, with different levels of professional experience as well as having
several hard skills.
The Sociometric Questionnaire (sociometric test), with its analysis using a
sociometric matrix and software to draw and analyze the connections, proves to be a
simple and practical tool to identify the inter-relationships among the people from a
group and create a multicultural team for a company. Also, companies can analyze their
actual team, analyze the level of influence of their leader, identify new leaders and build
new teams for a specific purpose using this methodology.
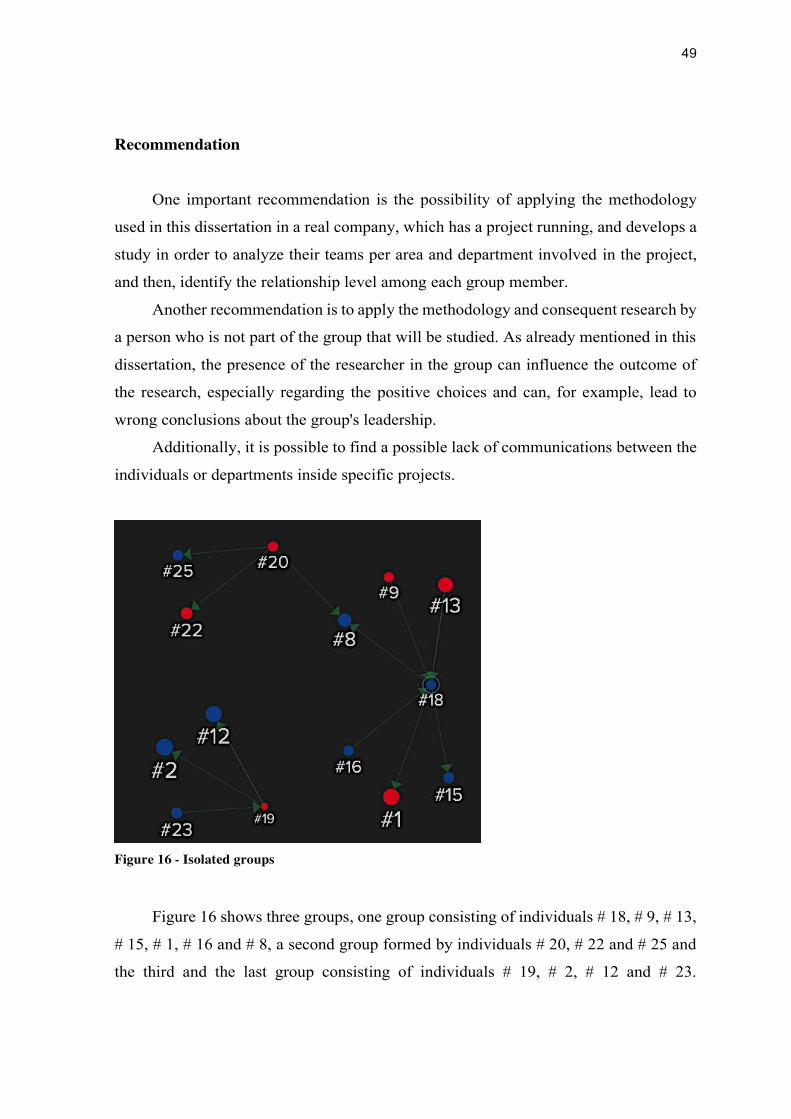
49
Recommendation
One important recommendation is the possibility of applying the methodology
used in this dissertation in a real company, which has a project running, and develops a
study in order to analyze their teams per area and department involved in the project,
and then, identify the relationship level among each group member.
Another recommendation is to apply the methodology and consequent research by
a person who is not part of the group that will be studied. As already mentioned in this
dissertation, the presence of the researcher in the group can influence the outcome of
the research, especially regarding the positive choices and can, for example, lead to
wrong conclusions about the group's leadership.
Additionally, it is possible to find a possible lack of communications between the
individuals or departments inside specific projects.
Figure 16 - Isolated groups
Figure 16 shows three groups, one group consisting of individuals # 18, # 9, # 13,
# 15, # 1, # 16 and # 8, a second group formed by individuals # 20, # 22 and # 25 and
the third and the last group consisting of individuals # 19, # 2, # 12 and # 23.
50
Considering that these three groups are part of a project and must work together to
implement the project.
This sociogram represented by Figure 16 shows that individual # 8, is an important
source of information exchange between the two groups, so, he or she binds the first
two groups. The third group has no individual with a relationship with the first two
groups. Thus we have the three groups isolated within the project. This will certainly
cause problems in execution of the project, causing delays, cost increases, buybacks,
communication problems and so on.
However, the sociometric test developed by Moreno (1934) together with modern
analytical tools of informal networks can be used to improve the selection of people by
the companies to work in an area, department or specific project, since one of the hardest
things is to select people based on soft skills because it is difficult to measure.
Thus, the Sociometric Theory developed a method to measure the soft skills based
on the relationships between people, as well as identifying the relationships effect inside
a group. These effects could be considered as recognized leadership, influencers and
connectors who can improve the communication process, improve teamwork, decrease
internal conflicts, decrease effort with insider trading, better manage human resources,
improve behavior within the project groups and efficiency in carrying out the projects.
However, sociometry applied to the multicultural workgroups selection or
temporary project group, multicultural or not, can increase the efficiency of these groups
based on the interpersonal relationship level.
The application of sociometric tools in selecting a project team with people who
have worked together is more productive than applying the same tools in a new team,
because these people are not yet familiar with each other and therefore have not
established an interpersonal relationship.
The last recommendation is to apply this methodology in a work team or a project
team from time to time in order to identify and map the changes in the relationships of
individuals within the group or project.
Additionally, the project is a temporary group working to accomplish an objective
and all human beings develop roles in society. These roles change according to the need,
place or activity that a person has to throughout the day. That's the roles theory that
Moreno (1934) describes in his book Who Shall Survive?. So if a person changes a
project or daily activity, it changes their behavior that influences their relationship with
others. So, the sociometric test should be applied whenever there is a change of project,
51
work group or activity imposed on a person, because people will change their behavior
or role in every circumstance.
Constant analysis is essential when new players enter the workgroup. According
to Moreno (1934), any new member of a group changes the dynamics of the whole
group. Because of this, interpersonal relationships should be reviewed.
52
REFERENCES
Anonymous Capture Hard Results from Soft Skills (2015). Public Accounting Report, Riverwoods, n. 5, pp. 4-5, 05.
APM Body of Knowledge, Association for Project Management APM (2006),
Princes Risborough. Azim, S. et al. (2010). The importance of soft skills in complex projects.
International Journal of Managing Projects in Business, Bingley, v. 3, n. 3, p. 387-401.
Bastian, M, Heymann, S, Jacony, M. Gephi (2009). An Open Source Software for
Exploring and Manipulating Networks. Association for the Advancement of Artificial Intelligence. Retrieved from https://gephi.org/publications/gephi-bastian-feb09.pdf.
Beck, A.P., Eng, A.M., Brusa, J.A. (1989). The evolution of leadership during
group development, Vol. 13, No. 3/4, THE GROUP-AS-A-WHOLE (Fall/Winter 1989), pp. 155-164, Published by: Eastern Group Psychotherapy Society, Stable Retrieved from URL: http://www.jstor.org/stable/41718523.
Berkowitz, L. (1956). Group Norms Among Bomber Crews: Patterns of Perceived
Crew Attitudes, "Actual" Crew Attitudes, and Crew Liking Related to Aircrew Effectiveness in Far Eastern Combat, Vol. 19, No. 3 (Sep., 1956), pp. 141-153, Retrieved from Stable URL: http://www.jstor.org/stable/2785628.
Blumberg, H.H.(1999). Sociometry Applied to Organizational Analysis: A Review.
The international journal of action methods. 1999-03-22; 52:15. Buckridan, R. (1975) Social acceptance enhancement of low sociometric status
pupils in special classes. 1975. 135. (Order No. DC53362) - University of Ottawa (Canada), Ann Arbor.
Burke, P.J.(1971). Task and Social-Emotional Leadership Role Performance, Vol.
34, No. 1 (Mar., 1971), pp. 22-40, Published by: American Sociological Association, Retrieved from URL: http://www.jstor.org/stable/2786349.
Colarelli, S.M, Boos, A. L.(1992). Sociometric and Ability-Based Assignment to
Work Groups: Some Implications for Personnel Selection. Journal of Organizational Behavior, Vol. 13, No. 2 (Mar., 1992), pp. 187-196, Published by: Wiley, Retrieved from URL: http://www.jstor.org/stable/2488182.
53
Criswell, J.H.(1949) Sociometric Concepts in Personnel Administration, Vol. 12,
No. 4 (Nov., 1949), pp. 287-300, Published by: American Sociological Association, Retrieved from URL: http://www.jstor.org/stable/2785596.
Daugherty, M. Sociometry: An Approach for Assessing Group Dynamics in Web-
Based Courses. Interactive learning environments. 2003-12-01; 11:263-275. Flannes, S. (2015) Effective People Skills for the project Manager: A requirement
for Project Success and Career Advancement. Retrieved from http://www2.sas.com/proceedings/sugi29/131-29.pdf.
Gardner, G.(1956) Functional Leadership and Popularity in Small Groups, Human
Relations, November 1956 9: 491-509, doi: 10.1177/001872675600900407. Gibb, C. A.(1950) The Sociometry of Leadership in Temporary Groups, Vol. 13,
No. 3 (Aug., 1950), pp. 226-243, Published by: American Sociological Association, Retrieved from URL: http://www.jstor.org/stable/2785459.
Hale, A.H.(2009) Moreno’s Sociometry: Exploring Interpersonal Connection, Vol.
33, No. 4, PSYCHODRAMA (DECEMBER 2009), pp. 347-358, Published by: Eastern Group Psychotherapy Society.
Hollander, C.E. (2015) An Introduction to Sociogram Construction, Published by
American Society of Group Psychotherapy and Psychodrama, Retrieved from http://asgpp.org/pdf/carl%20hollander%20sociogram.pdf pp.1-22
Ireland, L.R. (2004). Project manager: the competent professional. Retrieved from
www.pmforum.org/library/papers/2004/irelandcomp.pdf Jennings, H.H.(1947). Leadership and Sociometric Choice, Vol. 10, No. 1 (Feb.,
1947), pp. 32-49, Published by: American Sociological Association, Retrieved from http://www.jstor.org/stable/2785559
Krackhardt, D., & Hanson, J.R.(1993). Informal Networks: The Company Behind
the Chart. July–August 1993 issue of Harvard Business Review.

54
Lucius, R.H., & Kuhnert, K.W. (1997). Using sociometry to predict team performance in the work place. The Journal of psychology, Provincetown, v. 131, n. 1, p. 21-32, 01 1997.
Kumu Software - https://www.kumu.io Marando, A. (2012).Balancing Project Management Hard Skills and Soft Skills,
Brandeis University, 2012. Retrieved from http://projectmgmt.brandeis.edu/downloads/BRU_MSMPP_WP_Feb2012_Balancing_Project_Management.pdf
Marak, JR., G.E. (1964). The Evolution of Leadership Structure, Vol. 27, No. 2
(Jun., 1964), pp. 174-182, Published by: American Sociological Association, Retrieved from URL: http://www.jstor.org/stable/2785714.
Massarik, F., Tannenbaum, R., Kahane, M, Weschler, I. (1953). Sociometric
Choice and Organizational Effectiveness: A Multi-Relational Approach, Vol. 16, No. 3 (Aug., 1953), pp. 211-238, Published by: American Sociological Association, Retrieved from URL: http://www.jstor.org/stable/2786091.
MCiver, A.M.(1948). A sociometric study of inter-personal relations among sixth
and seventh grade pupils. Atlanta University Laboratory School. 1948. 47. (Order No. EP15705) - Atlanta University, Ann Arbor, 1948.
MCpherson, M., Smith-Levin, L., Brashears, M. (2006). Social isolation in
America: Changes in core discussion networks over two decades. American Sociological Review, 71, p. 353-375.
Mendelson, P.(1976). Rethinking Sociometry: Toward the reunification of theory,
philosophy, methodology and praxis. Unpublished doctoral dissertation, Washington University, St. Louis.
Morris, P.W.G., Crawford, L., Hodgson, D., Shepherd, M.M. and Thomas, J.
(2006). Exploring the role of formal bodies of knowledge in defining a profession – the case of project management, International Journal of Project Management, Vol. 24, pp. 710-21.
Moreno, J. L. (1934). Who Shall Survive? Washington, Nervous and Mental
Disease Publishing Cp., 1934.
55
Moreno, J. L.(1941). Foundations of Sociometry: An Introduction, Vol. 4, No. 1 (Feb., 1941), pp. 15-35, Published by: American Sociological Association, Retrieved from URL: http://www.jstor.org/stable/2785363.
Moreno, J. L. (1889-1974). Quem Sobreviverá? : Fundamentos da sociometria, da
psicoterapia de grupos e do sociodrama. Edição de estudante / J.L.Moreno; tradução Moysés Aguiar; Revisão técnica Mariana Kawazoe. – São Paulo: Daimon – Centro de Estudos do Relacionamento, 2008.
Moreno, J. L.(1943). Sociometry and the Cultural Order, Vol. 6, No. 3 (Aug.,
1943), pp. 299-344, Published by: American Sociological Association, Retrieved from URL: http://www.jstor.org/stable/2785184.
Moreno, J. L.(1942). Foundation of the Sociometric Institute, Sociometry, V
(1942), pp. v-ix, Published by: American Sociological Association. Moreno, J. L.(1937). Sociometry in Relation to the Other Social Sciences,
Sociometry, I (1937), p. 217,
Moreno, J. L.(1955). The Sociometric School and the Science of Man, Vol. 18, No. 4, Sociometry and the Science of Man (Nov., 1955), pp. 15-35, pp. 275, Published by: American Sociological Association: Retrieved from http://www.jstor.org/stable/2785839.
Northway, M.L.(1946). Sociometry and Some Challenging Problems of Social
Relationships, Vol. 9, No. 2/3 (May - Aug., 1946), pp. 187-198, Published by: American Sociological Association, Retrieved from URL: http://www.jstor.org/stable/278500.
Pant, I. & Baroudi, B. (2008), Project management education: the human skills
imperative, International Journal of Project Management, Vol. 26, pp. 124-8. Pentland, A.S.(2012). The New Science of Building Great Teams, April 2012 issue
of Harvard Business Review. PMI (2004), A Guide to the Project Management Body of Knowledge: Pmbok
Guide, Project Management Institute, Washington, DC.
56
Read, P.B.(1974). Source of Authority and the Legitimation of Leadership in Small Groups, Vol. 37, No. 2 (Jun., 1974), pp. 189-204, Published by: American Sociological Association, Retrieved from URL:
http://www.jstor.org/stable/2786375. Remer, R.(2002). Chaos Theory links to Morenean theory: a synergistic
relationship. Journal of group psychotherapy, psychodrama and sociometry (2002). 2006-06-22; 59:55.
Smith, E.R.(1950). An Introduction to Sociometry, The American Catholic
Sociological Review, Vol. 11, No. 4 (Dec., 1950), pp. 206-217, Published by: Oxford University Press, Retrieved from URL: http://www.jstor.org/stable/3707339.
Tagiuri, R., Kogan, N.(1957). The Visibility of Interpersonal Preferences. Human
Relations. November 1957 10: 385-390. doi: 10.1177/001872675701000406.
Vierimaa, M.A.(2013). An exploratory examination of sociometric status, athlete
behavior, and sport competence in adolescent female volleyball. 2013. 123. (Order No. MS25671) - Queen's University (Canada), Ann Arbor, 2013.
Whitty, S.J. & Maylor, H. (2009). And then came complex project management
(revised), International Journal of Project Management, Vol. 27, pp. 304-10. Winter, M., Smith, C., Morris, P. & Cicmil, S. (2006). Directions for future
research in project management: the main findings of a UK government-funded research network, International Journal of Project Management, Vol. 24, pp. 638-49.
Zahra, S. , Nazir A., Khalid, A., Raana, A. & Majeed M.N. (2014). Performing
Inquisitive Study of PM Traits Desirable for Project Progress. International Journal of Modern Education and Computer Science, Hong Kong, v. 6, n. 2, p. 41-47, 02 2014.
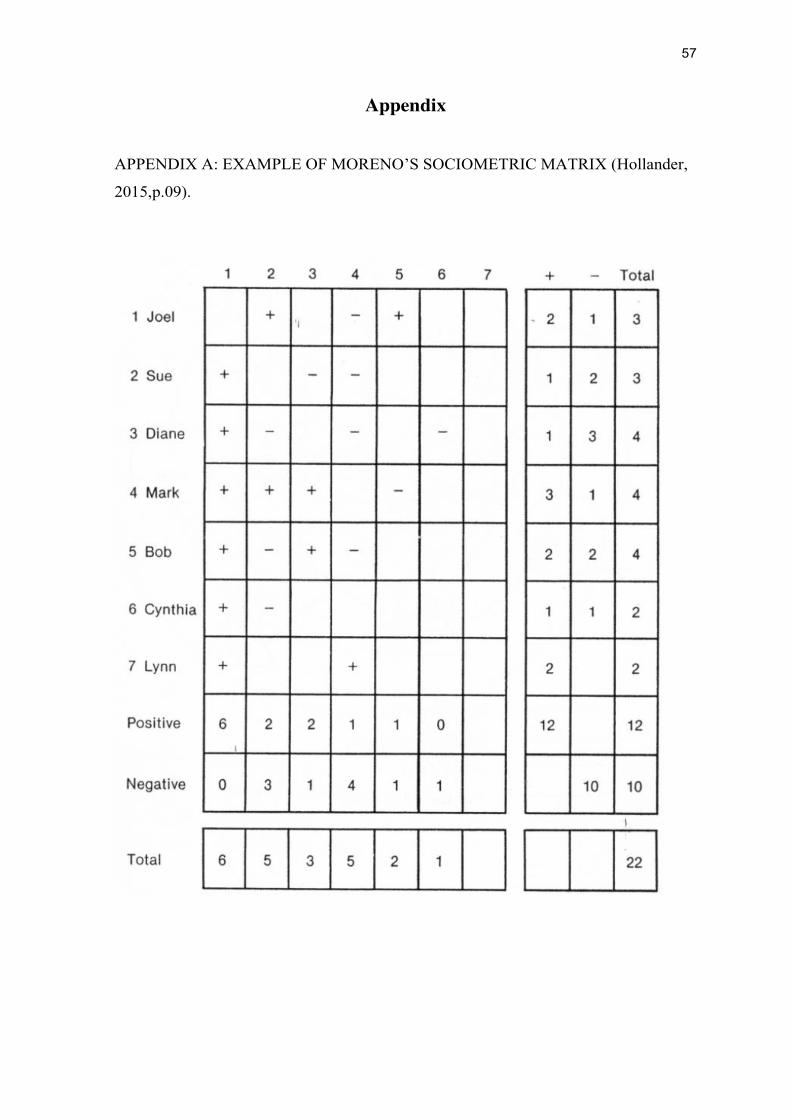
57
Appendix
APPENDIX A: EXAMPLE OF MORENO’S SOCIOMETRIC MATRIX (Hollander,
2015,p.09).
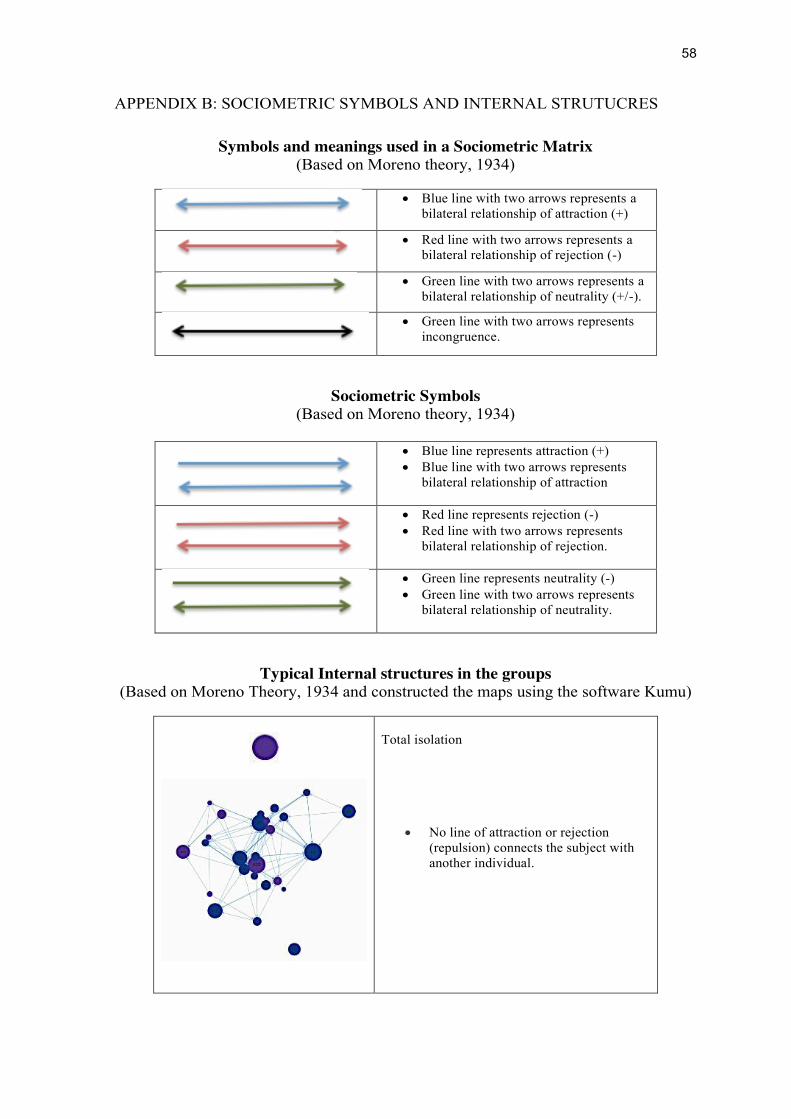
58
APPENDIX B: SOCIOMETRIC SYMBOLS AND INTERNAL STRUTUCRES
Symbols and meanings used in a Sociometric Matrix (Based on Moreno theory, 1934)
x Blue line with two arrows represents a
bilateral relationship of attraction (+)
x Red line with two arrows represents a
bilateral relationship of rejection (-)
x Green line with two arrows represents a
bilateral relationship of neutrality (+/-).
x Green line with two arrows represents incongruence.
Sociometric Symbols (Based on Moreno theory, 1934)
x Blue line represents attraction (+) x Blue line with two arrows represents
bilateral relationship of attraction
x Red line represents rejection (-) x Red line with two arrows represents
bilateral relationship of rejection.
x Green line represents neutrality (-) x Green line with two arrows represents
bilateral relationship of neutrality.
Typical Internal structures in the groups (Based on Moreno Theory, 1934 and constructed the maps using the software Kumu)
Total isolation
x No line of attraction or rejection (repulsion) connects the subject with another individual.

59
Attraction and rejection takes the form of a pair;
x Mutual attraction (blue pair);
x Mutual rejection (red pair);
x Neutrality (indifference) x rejection;
x Attraction x rejection;
x Neutrality (indifference) x attraction.
Mutual rejection and attraction takes the form of a triangle;
x Triangle of mutual rejection;
x Triangle of mutual attraction;
Mutual rejection and attraction takes the form of a square;
x Square of mutual rejection;
x Square of mutual attraction;
Mutual attractions take the form of a center (star)
Mutual rejection take the form of a center (star)