International LPG supply and demand trends AEGPL … · International LPG supply and demand trends...
29
London Houston Washington New York Portland Calgary Santiago Bogota Rio de Janeiro Singapore Beijing Tokyo Sydney Dubai Moscow Astana Kiev Porto Johannesburg Market Reporting Consulting Events International LPG supply and demand trends AEGPL 2015 Nick Black Principal, LPG Argus Consultancy Services Argus Media
Transcript of International LPG supply and demand trends AEGPL … · International LPG supply and demand trends...

London
Houston
Washington
New York
Portland
Calgary
Santiago
Bogota
Rio de Janeiro
Singapore
Beijing
Tokyo
Sydney
Dubai
Moscow
Astana
Kiev
Porto
Johannesburg
Market Reporting
Consulting
Events
International LPG supply and demand trends AEGPL 2015 Nick Black Principal, LPG Argus Consultancy Services Argus Media

illuminating the markets
Argus Consultancy Services analyses global LPG trends…
Copyright © 2015 Argus Media Ltd. All rights reserved.
illuminating the markets
Argus Consultancy Services includes LPG outlook and forecasting
Copyright © 2015 Argus Media Ltd. All rights reserved.
Argus LPG Outlook: Quarterly supply and demand trends Monthly price trends Global and regional balances
illuminating the markets
International LPG supply and demand trends
Copyright © 2015 Argus Media Ltd. All rights reserved.
• 6 signs of strain • Global Trends and anomalies • US • Europe • Asia-Pacific & Middle East • Shipping

illuminating the markets
Signs of strain
Copyright © 2015 Argus Media Ltd. All rights reserved.
• Production outstrips consumption • Infrastructural Strains and stresses • Unusual price relationships
• Between regions • Between products
• Demand not conforming to forecast patterns • Government commitments not as strong as hoped • Shipping
• VLGC expansion, LGC boom times • Different story for pressurised

Market Reporting
Consulting
Events
Global trends and anomalies

US supply has found international buyers
Copyright © 2015 Argus Media Ltd. All rights reserved.
US Export Strength pre-Panama Canal
Latin America soaked up US exports in 2013 and 2014
2013/4: US Gulf Terminal expansion Enterprise: 7.8mn t/yr Targa: 2.1 t/yr Nederlands in January
Europe Petchems began sustained US imports in 2013. Some quality issues at first. Europe+ Med imports 2.7mn t/yr US LPG in 2014 Europe exports to US Northeast in Q1 2014 and 2015

Meanwhile, Russia exports keep growing
Copyright © 2015 Argus Media Ltd. All rights reserved.
• Ust Luga starts up 2013, petchems are mostly the buyers
• Product moves to Ust Luga in 2014 rather than Black Sea
• Russia ports of Taman, Temyruk favoured over Kerch (Crimea): political troubles not over yet
• Sibur makes 73pc of all Russia exports

Asia import patterns have shifted again
Copyright © 2015 Argus Media Ltd. All rights reserved.
China imports rose strongly in 2013 and even more strongly in 2014: Over 7mn t/yr (+68pc yr-on-yr) 2015 import rise continues
US exports head to east Asia before Panama Canal upgrade
Thai imports continue to grow
Japan imports fall in 2014: 10.9mn t/yr (-3pc) Meti forecasts autogas decline, robust household
India imports become a significant influence

“The dog that did not bark”: some anomalies
Copyright © 2015 Argus Media Ltd. All rights reserved.
How have Middle East exporters responded to a threat to their market share of Asian customer base? Why would Asia buyers buy US supply even when arb collapses?
Where is the promised rise in Algerian exports? They are showing up
If the US is such a key exporter, why did it import from Europe in Q1 2013 and 2014?
What happened in Angola when exports were supposed to rise in 2013?
Focus on US has distracted market from the narratives of other key exporters

Market Reporting
Consulting
Events
US trends

Production will outstrip export growth
Copyright © 2015 Argus Media Ltd. All rights reserved.
0
20,000
40,000
60,000
80,000
100,000
120,000
140,000
2006 2007 2008 2009 2010 2011 2012 2013 2014 2015 2016
US NGL production actual + forecast
Gas processing Refinery
0
20,000
40,000
60,000
80,000
100,000
120,000
2006 2007 2008 2009 2010 2011 2012 2013 2014 2015 2016
US output and exports
Total NGL supply US exports Propane Butane Ethane
• Output will rise strongly
• Shale Gas fields still mostly economic at $50/bl oil
• Gas processing is still key source for US NGL output
• Ethane dominates supply growth
• Ethane can be rejected, LPG cannot
• Ethane rejection was about 5.6mn t/yr and could be as much as 8.6 mn t/yr by 2016
• Ethane exports on the way

Arbitrage is not as it was, while US stocks build
Copyright © 2015 Argus Media Ltd. All rights reserved.
$600/t… Asia buyers excited!
US northeast big freeze
Arb settles to range limit of $300/t
Arb range limit now $200/t
0.00
0.10
0.20
0.30
0.40
0.50
0.60
0.70
0.80
0.90
1,000
2,000
3,000
4,000
5,000
6,000
7,000
8,000
9,000
Jan Feb Mar Apr May Jun Jul Aug Sep Oct Nov Dec
C3
/nap
hth
a ra
tio
US
C3
sto
cks
5yr average 2013 2014
2015 C3/naphtha ratio
• Arbitrage drove Asian term deals
• “Glory days” over since 2012
• US winter if cold will always close arb
• US stocks way above 5 year average
• Where will it be stored?
• Brine issues
• US floating storage not an option, unlike crude

• Houston Ship Channel:
◦ Disruptions once again in March (Fog, Collision of Carla Maersk)
• Rapid build up: vessel logjams
• 40 inbound and 32 outbound vessels
• Pacific West Coast:
◦ Pembina runs into pipeline battle
◦ Haven Longview project rejected by port commissioners
• 1.4mn t/yr
• 11 days to East Asia
• Rail:
◦ US rail traffic up 10pc in Q4 2014, highest for 5 years
◦ Rail yards face overcrowding
• Arbitrage:
◦ This is getting squeezed
◦ Terminalling Fee needs to be factored in
◦ Freight rate strength is not always even
US export logistics get more complex
Copyright © 2015 Argus Media Ltd. All rights reserved.

Market Reporting
Consulting
Events
European trends
FRANCE
ANDORRA
GERMANY
POLAND
ROMANIA
BULGARIA
GREECE
TURKEY
BALEARIC
SWITZ.
AUSTRIA
UKRAINE
Crete
Rhodes
Andorra
Rome
Athens
Bucharest
Budapest
Bratislava
Prague
Chisinau
Kiev
Krakow
Rivne
Barcelona
Balearic
Ionian
Sea
Black
Sea
Adriatic
Sea
Ligurian Sea
Mediterranean Sea
Odesa
Palermo
Cagliari
Genoa
Geneva
Naples
ALGERIA
ALB.
TUNISIA
ISLANDS
BELGIUM
LUX.
SERBIA
LIECH
Sicily
Paris
Bern
Tirana
Sofia
Belgrade
Sarajevo
Zagreb
Berlin
Brussels
Sea
Sea
Munich
Leipzig
RUSSIA
RUSSIA
FINLAND
SWEDEN
NETHERLANDS
ISLANDS
ALAND
ISLANDS
DENMARK
ICELAND
BELARUS
UNITED
KINGDOM
Gotland
Oland
Bornholm
Minsk
Riga
Helsinki
Moscow
Stockholm Oslo
Copenhagen
Amsterdam
Luxembourg
London
Doublin
Reykjavik
Murmansk
Gulf of Finland
White Sea
Barents Sea
Gulf
of
Bothnia
Baltic
Sea
Irish
Bay of
Biscay
North
Sea
Norwegian
Sea
Leeds
Bordeaux Lyon
Stavanger
Strasbourg
Bremen
Hamburg
Kaliningrad
Belfast
Goteborg
SPAIN
MOROCCO
NORWAY
MOLDOVA
F.Y.R.O.M.
IRELAND
PORTUGAL
MALTA
ITALY MONACO
BOSNIA AND
HERZEGOVINA
SLOVENIA
HUNGARY
SLOVAKIA CZECH REPUBLIC
NORTHERN
IRELAND
FAROEF
LITHUANIA
LATVIA
ESTONIA
Corsica FRANCE
Sardinia I TALY
La Vella
Madrid
Lisbon
Rabat
Algiers
Tunis Valletta
Vaduz
Podgorica
Pristina
Skopje
CROATIA
Ljubljana
Vienna
Vilnius
Warsaw
Tallin
Brest
MONTENEGRO KOSOVO
Lake Ladoga
Sea
Alborin Sea
Tyrrhenian
Edinburgh
Marseille
Sevilla
Gibralta
Valencia
Gdansk
St. Petersburg
Venice
Porto
Le Havre
Donges
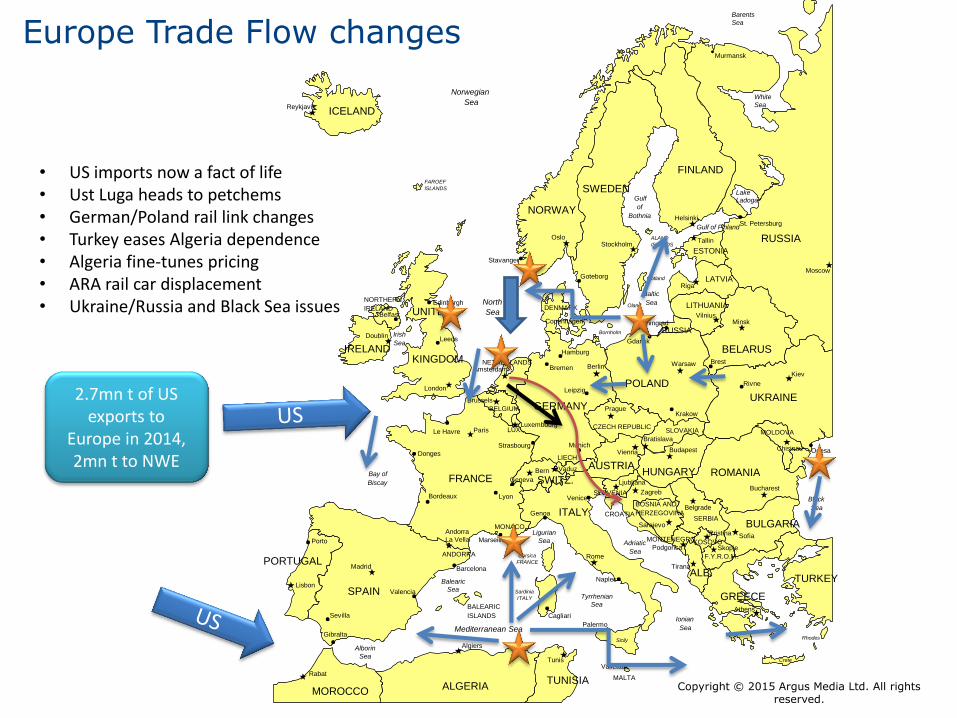
• US imports now a fact of life • Ust Luga heads to petchems • German/Poland rail link changes • Turkey eases Algeria dependence • Algeria fine-tunes pricing • ARA rail car displacement • Ukraine/Russia and Black Sea issues
Europe Trade Flow changes
Copyright © 2015 Argus Media Ltd. All rights reserved.
2.7mn t of US exports to
Europe in 2014, 2mn t to NWE

Cif ARA (C3): the impact of winter
Copyright © 2015 Argus Media Ltd. All rights reserved.
-
200.00
400.00
600.00
800.00
1,000.00
1,200.00
Aug-9
2
Feb-9
3
Aug-9
3
Feb-9
4
Aug-9
4
Feb-9
5
Aug-9
5
Feb-9
6
Aug-9
6
Feb-9
7
Aug-9
7
Feb-9
8
Aug-9
8
Feb-9
9
Aug-9
9
Feb-0
0
Aug-0
0
Feb-0
1
Aug-0
1
Feb-0
2
Aug-0
2
Feb-0
3
Aug-0
3
Feb-0
4
Aug-0
4
Feb-0
5
Aug-0
5
Feb-0
6
Aug-0
6
Feb-0
7
Aug-0
7
Feb-0
8
Aug-0
8
Feb-0
9
Aug-0
9
Feb-1
0
Aug-1
0
Feb-1
1
Aug-1
1
Feb-1
2
Aug-1
2
Feb-1
3
Aug-1
3
Feb-1
4
Aug-1
4
Title
Series2
2012: A transition year when
prices rose in Q3 although
demand was seasonally weak
The age of volatility
Winters used to cause price spikes then sudden collapse in Q4/Q1 and could push LPG to a premium over naphtha
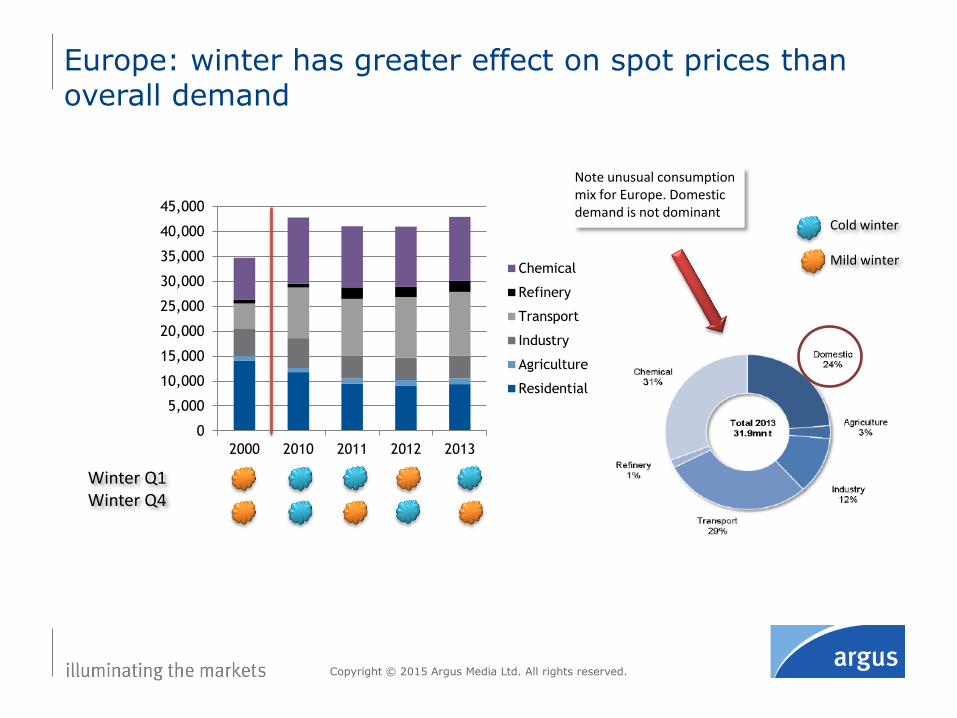
Europe: winter has greater effect on spot prices than overall demand
Copyright © 2015 Argus Media Ltd. All rights reserved.
Winter Q1 Winter Q4
Cold winter Mild winter
0
5,000
10,000
15,000
20,000
25,000
30,000
35,000
40,000
45,000
2000 2010 2011 2012 2013
Chemical
Refinery
Transport
Industry
Agriculture
Residential
Note unusual consumption mix for Europe. Domestic demand is not dominant

• Old rules
• Propane rises above naphtha when cold weather winter demand kicks in
• C3 falls to 95pc of naphtha or below in Q2 or Q3
• New rules
• C3/4/Naph volatility less extreme
• Pro establishes new range of value to naphtha
• Even if C3 at advantage, petchems not necessarily buyers
Europe looks at naphtha, but the rules change
Copyright © 2015 Argus Media Ltd. All rights reserved.
0%
20%
40%
60%
80%
100%
120%
140%
160%
180%
200%
Jan-9
3
Jul-
93
Jan-9
4
Jul-
94
Jan-9
5
Jul-
95
Jan-9
6
Jul-
96
Jan-9
7
Jul-
97
Jan-9
8
Jul-
98
Jan-9
9
Jul-
99
Jan-0
0
Jul-
00
Jan-0
1
Jul-
01
Jan-0
2
Jul-
02
Jan-0
3
Jul-
03
Jan-0
4
Jul-
04
Jan-0
5
Jul-
05
Jan-0
6
Jul-
06
Jan-0
7
Jul-
07
Jan-0
8
Jul-
08
Jan-0
9
Jul-
09
Jan-1
0
Jul-
10
Jan-1
1
Jul-
11
Jan-1
2
Jul-
12
Jan-1
3
Jul-
13
Jan-1
4
Jul-
14
Title
Series2
Sustained
Petchem
Winters used to push LPG to a sharp premium over naphtha

• Butane emerges stronger • Propane below 80pc crude in
April • Winter demand lacklustre
• Petchem buying is key • Petchem demand is main spot
market support and dominant in market discussion, but do not want leadership
• When petchems donm’t buy, prices tumble
• US imports now a fact of life • Even as far as Gdansk, Baltic Sea
in 2014 • Quality issues for petchems:
different specs Targa/Enterprise • Q1 sees US supply head to
Asia/Lat Am not Europe • Q2 seeing similar pattern
• Exports to US northeast • Consequence of last year’s US
winter
• Butane length in ARA • Moerdijk problems takes up to
40,000t/month away from demand
European market: recent developments
Copyright © 2015 Argus Media Ltd. All rights reserved.
Propane diff to Naphtha NWE
Propane and Butane cif ARA
This is odd

European market: looking ahead
Copyright © 2015 Argus Media Ltd. All rights reserved.
0
5,000
10,000
15,000
20,000
25,000
2010 2011 2012 2013 2014 2015 2016
Northwest Europe production and imports
Total NWE NGL supply NGL imports Ethane LPG
• Steady supply
• Northwest Europe (esp Norway) is a key source of supply but production is steady, not growing
• Russia production set to rise to over 17mn t/yr by 2018 and export just under 9mn t/yr. where will it go?
• Europe now produces around 2.4mn t/yr ethane
• US ethane imports start to show this year
• Why imports?
• Two different markets, large/coasters
• Notice growth of imports despite flat demand
• Import growth down to petchems
Ethane imports begin in 2015

Market Reporting
Consulting
Events
Asian and Middle East trends

• China imports
• Resurgent imports
• Nov 2014 record 758,000t
• 2014 68pc higher than 2013 (7.1mn t)
• PDH demand already active, centred in east China
• East China imports up by 78pc
• But also big rise in S China imports
• Competitive international prices vs refinery prices
• US sourced imports up by 600pc
• 773,000t and now 2nd largest source, after UAE and above Qatar, Kuwait, Saudi Arabia
Asia market: import patterns are still shifting
Copyright © 2015 Argus Media Ltd. All rights reserved.
China LPG demand & imports
0
5
10
15
20
25
30
2011 2012 2013 2014
Demand Imports
0
1
2
3
4
5
2005 2006 2007 2008 2009 2010 2011 2012 2013 2014
S China E China
China: E Coast vs S Coast imports The increase in E China demand (PDH) is being matched by S China demand
0
500
1,000
1,500
2,000
2,500
3,000
3,500
4,000
05 06 07 08 09 10 11 12 13 14
China Middle East Imports
UAE Qatar Saudi Arabia Kuwait Iran Bahrain

• Japan imports
• US has not broken Middle East dominance
• Saudi imports dwindle – or do they?
• No Saudi imports in April, but recover by June
• US sourced imports
• 1.4mn t 2014
• Even before Panama Canal
• But buying is erratic
• They are still cheaper!
Why is Japan buying more US LPG?
Copyright © 2015 Argus Media Ltd. All rights reserved.
Japan import costs 2014 ’000Y/t
0
50
100
150
200
250
300
350
400
Jan Feb Mar April May Jun Jul Aug Sept Oct Nov Dec
Saudi Qatar US
84
86
88
90
92
94
96
98
Saudi Arabia Kuwait Qatar UAE USC3 C4
Japan imports from Saudi, US, Qatar 2014 ’000t
1,319,565
3,078,266
1,267,733
2,515,051
0 772,250
1,487,242
516,507
Saudi Arabia
Qatar
Kuwait
UAE
Iran
Australia
US
Others
Japan import share 2014

Asia looking forward
Copyright © 2015 Argus Media Ltd. All rights reserved.
0
20,000
40,000
60,000
80,000
100,000
120,000
2010 2011 2012 2013 2014 2015 2016
Asia Pacific LPG trends
Total NGL supply Consumption Imports
Region with largest demand growth • Imports keep pace with demand • Regional supply growing moderately
◦ Hidden demand in Pakistan and Bangladesh ‐ Pakistan gas crisis
• Thailand and Vietnam strong growth
PDH & Ethane • Already produced regionally • Indian ethane imports begin in 2016 • China PDH demand peaks by 2017
◦ Up to 15mn t/yr? • Australia output rises to up to 3mn t/yr by 2017
◦ Will this now happen?
0
500
1,000
1,500
2,000
2,500
2010 2011 2012 2013 2014 2015 2016
Asia ethane consumption
Ethane

0
20,000
40,000
60,000
80,000
100,000
120,000
2010 2011 2012 2013 2014 2015 2016
Middle East supply/demand
NGL production Exports Consumption Ethane Supply
Middle East looking forward
Copyright © 2015 Argus Media Ltd. All rights reserved.
Production Growth • Modest rises • Unknowns:
◦ Iran (subject to sanctions) ◦ Iraq
• Qatar production will level off in 2016, then recover in 2017
Demand • Rise in Qatari petchem demand • Unknowns:
◦ Stronger than anticipated domestic cylinder demand in Saudi Arabia and UAE

Market Reporting
Consulting
Events
Shipping

0
5
10
15
20
25
1996
1997
1998
1999
2000
2001
2002
2003
2004
2005
2006
2007
2008
2009
2010
2011
2012
2013
2014
2015
2016
2017
2018
2019
2020
2021
%/yr
0
20
40
60
80
100
North Pacific China India Other Asia Pacific
via Cape via Panama
• Shipping rates • Record levels in 2014. Repeatable? • VLGC fleet: 34 new vessels in 2015, 46 in 2016 • What happens when capacity outstrips US
production?
• US exports • Will terminals be built given oil price crash? And
who will buy exports?
• Panama Canal • Will start as promised in 2016? • Tolls agreed Jan 2015 on sliding scale • Widened and deepened, but still depends on vol
of traffic and likely demurrage costs • Can it handle the volume of LPG exports?
• Other vessels will have priority
Shipping rates reflect high utilisation: can it last?
Copyright © 2015 Argus Media Ltd. All rights reserved.
VLGC Fleet growth Ras Tanura/Chiba VLGC rate
Voyage days (RV) to Houston (14 knots)
0.00
20.00
40.00
60.00
80.00
100.00
120.00
140.00
160.00
01/13
02/13
03/13
04/13
05/13
06/13
07/13
08/13
09/13
10/13
11/13
12/13
01/14
02/14
03/14
04/14
05/14
06/14
07/14
08/14
09/14
10/14
11/14
12/14
01/15
02/15
03/15
S/t

Copyright notice Copyright © 2015 Argus Media Ltd. All rights reserved. All intellectual property rights in this presentation and the information herein are the exclusive property of Argus and and/or its licensors and may only be used under licence from Argus. Without limiting the foregoing, by reading this presentation you agree that you will not copy or reproduce any part of its contents (including, but not limited to, single prices or any other individual items of data) in any form or for any purpose whatsoever without the prior written consent of Argus. Trademark notice ARGUS, ARGUS MEDIA, the ARGUS logo, DEWITT, FMB, FUNDALYTICS, METAL-PAGES, JIM JORDAN & ASSOCIATES, JJ&A, ARGUS publication titles and ARGUS index names are trademarks of Argus Media Limited. Disclaimer All data and other information presented (the “Data”) are provided on an “as is” basis. Argus makes no warranties, express or implied, as to the accuracy, adequacy, timeliness, or completeness of the Data or fitness for any particular purpose. Argus shall not be liable for any loss or damage arising from any party’s reliance on the Data and disclaims any and all liability related to or arising out of use of the Data to the full extent permissible by law.
Nick Black Principal, LPG
Email:
Phone:
Office:
Web:
+44 20 7780 4200
London
www.argusmedia.com