INTERNATIONAL JOURNAL OF ZAMBRUT · - Waktu dan Biaya Aktual - BCWS, BCWP, dan ACWP Pengurutan data...
13
International Journal of Engineering & Industry ISSN: 2191-3315, Volume 3, Issue 1, page 19 - 31 Zambrut Zambrut.com. Publication date: June 5, 2019. Komarudin, T., Bahrowi, N., Mayangsari, Y. & Setyowati, A. 2019. Evaluation of Project Control Method of Variance Analysis and Concept Development ................ 19 Evaluation of Project Control Method of Variance Analysis and Concept Development in the Value of the Fish Auction (Studied in Cianjur, West Java, Indonesia) Totok Komarudin 1 , Nasrul Bahrowi 2 , Yuni Mayangsari 3 & Anita Setyowati 4 1 Dr. Totok Komarudin, 2 Dr. Nasrul Bahrowi, 3 Yuni Mayangsari, M.Si. & 4 Anita Setyowati, M.Si. 1 Widya Kartika University, Surabaya 2 Panca Marga University, Probolinggo 3 Technology University, Surabaya 4 Kanjuruhan University, Malang Indonesia 1. Introduction Projects are dynamic, which must respond to changing circumstances if it is to succeed and be successful. This is done in a continuous environmental conditions change, so always needs to establish a policy planning in anticipation of the above circumstances, so that the project can go ahead without delay, Lock [1]. In a planning project to prevent delays in implementation time and waste in the use of cost, the necessary improvement of the schedule of activities and budgeting to a minimum, so the turnaround time and costs used to provide the maximum benefit for the executor, Reksohadiprodjo [2] In fact, often an organization faces difficulties in terms of resources, including materials and labor. Therefore, the planning of the resources should be conducted with respect to the lack of resources Abstract: Control project is afoot to organize and regulate corporate resources to achieve project goals, namely schedule, budget, and quality. There are two methods used, the method of Analysis of Variance and Methods Concepts Value Results. Results of the evaluation on the construction project is a fish auction place schedules and costs that are not in accordance with planning. Variance costs by Rp. 2,929,000, - caused by the accelerated activity giving rise to additional labor costs. Variance project time by 1 (one) day, which is caused by the delay in the project. Keywords: Variance Analysis, Concept of Value Results, Schedule, Budget, Quality.
Transcript of INTERNATIONAL JOURNAL OF ZAMBRUT · - Waktu dan Biaya Aktual - BCWS, BCWP, dan ACWP Pengurutan data...

International Journal of Engineering & Industry ISSN: 2191-3315, Volume 3, Issue 1, page 19 - 31
Zambrut
Zambrut.com. Publication date: June 5, 2019.
Komarudin, T., Bahrowi, N., Mayangsari, Y. & Setyowati, A. 2019. Evaluation of Project Control Method
of Variance Analysis and Concept Development ................
19
Evaluation of Project Control
Method of Variance Analysis
and Concept Development in
the Value of the Fish Auction (Studied in Cianjur, West Java, Indonesia)
Totok Komarudin1, Nasrul Bahrowi
2, Yuni Mayangsari
3 & Anita Setyowati
4
1Dr. Totok Komarudin,
2Dr. Nasrul Bahrowi,
3Yuni Mayangsari, M.Si. &
4Anita Setyowati, M.Si.
1Widya Kartika University, Surabaya
2Panca Marga University, Probolinggo
3Technology University, Surabaya 4Kanjuruhan University, Malang
Indonesia
1. Introduction Projects are dynamic, which must respond to changing circumstances if it is to succeed and be
successful. This is done in a continuous environmental conditions change, so always needs to establish
a policy planning in anticipation of the above circumstances, so that the project can go ahead without
delay, Lock [1].
In a planning project to prevent delays in implementation time and waste in the use of cost, the
necessary improvement of the schedule of activities and budgeting to a minimum, so the turnaround
time and costs used to provide the maximum benefit for the executor, Reksohadiprodjo [2]
In fact, often an organization faces difficulties in terms of resources, including materials and
labor. Therefore, the planning of the resources should be conducted with respect to the lack of resources
Abstract: Control project is afoot to organize and regulate corporate resources to achieve
project goals, namely schedule, budget, and quality. There are two methods used, the
method of Analysis of Variance and Methods Concepts Value Results. Results of the
evaluation on the construction project is a fish auction place schedules and costs that are
not in accordance with planning. Variance costs by Rp. 2,929,000, - caused by the
accelerated activity giving rise to additional labor costs. Variance project time by 1 (one)
day, which is caused by the delay in the project.
Keywords: Variance Analysis, Concept of Value Results, Schedule, Budget, Quality.

International Journal of Engineering & Industry ISSN: 2191-3315, Volume 3, Issue 1, page 19 - 31
Zambrut
Zambrut.com. Publication date: June 5, 2019.
Komarudin, T., Bahrowi, N., Mayangsari, Y. & Setyowati, A. 2019. Evaluation of Project Control Method
of Variance Analysis and Concept Development ................
20
to obtain the optimum schedule. Delays in completion of the project will cause penalty fees that can
reduce the benefits to be gained, Suharto [3].
In addition the project is composed of several activities undertaken one or not continuous, but the
search time can be determined based on past experience. Completion of a project can also be used as
the basis for other similar project in the future. Based on the experiences that have then found to
frequent delays in the completion of a project, this is caused by many factors. It required a better
planning system in the implementation of the project, Ali [4].
Cianjur district with the topography of different types, has marine, reservoirs, rivers, and ponds
nature. In the ecosystem there fishing activities. In coastal areas overlooking the Indian Ocean, many
fishermen who conduct fishing activities in the sea. Currently in District Cidaun already built Jayanti
Fish Landing Base area of 2 ha, with the main facilities and facilities support activities, among others:
the pier, where anchoring, navigation tools, office, mini ice plant capacity of 2.5 tonnes, packing sheds,
shanties marketing fish, workshop machinery, means of communication, and others. In 2008, the
Department of Animal Husbandry and Fisheries Cianjur, has completed building the fish auction place
(TPI) Apra in District Sindangbarang. However, on the implementation of the project there is a delay of
a predetermined schedule and cost overruns that occurred. Department of Animal Husbandry and
Fisheries Cianjur requires an evaluation of the project in 2009 because of a similar project which will
be built in the district Cikakap TPI Agrabinta, Department of Animal Husbandry and Fisheries Cianjur
[5]
Based on the background mentioned above, the problem in this research is how to evaluate the
implementation of development projects TPI. Apra using value analysis method results and methods of
analysis of variance. While the purpose of this study is proposed in the form of project control project
performance measures (cost and schedule) to approach the concept of the value of the results and the
method of analysis of variance, so as to reduce the risk of deviation costs and schedule deviations for
similar projects to be built.
2. METHODOLOGY This study uses PDM (Precedence Diagram Method), with consideration: this method can
describe the operational plan integrally, shows the interrelation of each activity and can show the
critical path. Besides its network is relatively simple, because the activities are done over and over can
be described as a job and are not required dummy.
Data collection was conducted as input for project control processes, such as: working calendar,
list of activities, execution time of each activity, activity dependency logic, planning cost of each
activity, and the actual cost of each activity.
While the Data Processing is done with the following steps:
a. Ordering Data Activity / Activities Project
Sorting kergiatan activities undertaken on the project to construct or create a Network Diagram.
b. Creating network diagrams (Network Diagram)
To create a network can be seen from the description of the activity of a project, ie which activities
can be done simultaneously and which activities must wait previous activities to be completed first.
In the preparation of this network, there are two things that made reference in its manufacture,
which is a natural dependency factor and factor Bar Chart of the company. Natural factors derived
from the logic of the connection an activity with other activities.
Methods of identifying a network of activities that are critical to the project, especially in the
aspects of the schedule and planning. Generally, the critical activity of not more than 20% of the
total project activities, and he knew this part then the manager can give attention.
c. Making the Bar Chart
Making the Bar Chart using data including the time / duration of each activity / activities, the cost
for each activity per day required by each activity. The procedure of making Bar Chart:
1) Arrange the project activities mentioned initial activity and activity end.
2) Calculate the earliest start (ES) and earliest finish (EF) based on the duration and number of
events similarity (activity)
International Journal of Engineering & Industry ISSN: 2191-3315, Volume 3, Issue 1, page 19 - 31
Zambrut
Zambrut.com. Publication date: June 5, 2019.
Komarudin, T., Bahrowi, N., Mayangsari, Y. & Setyowati, A. 2019. Evaluation of Project Control Method
of Variance Analysis and Concept Development ................
21
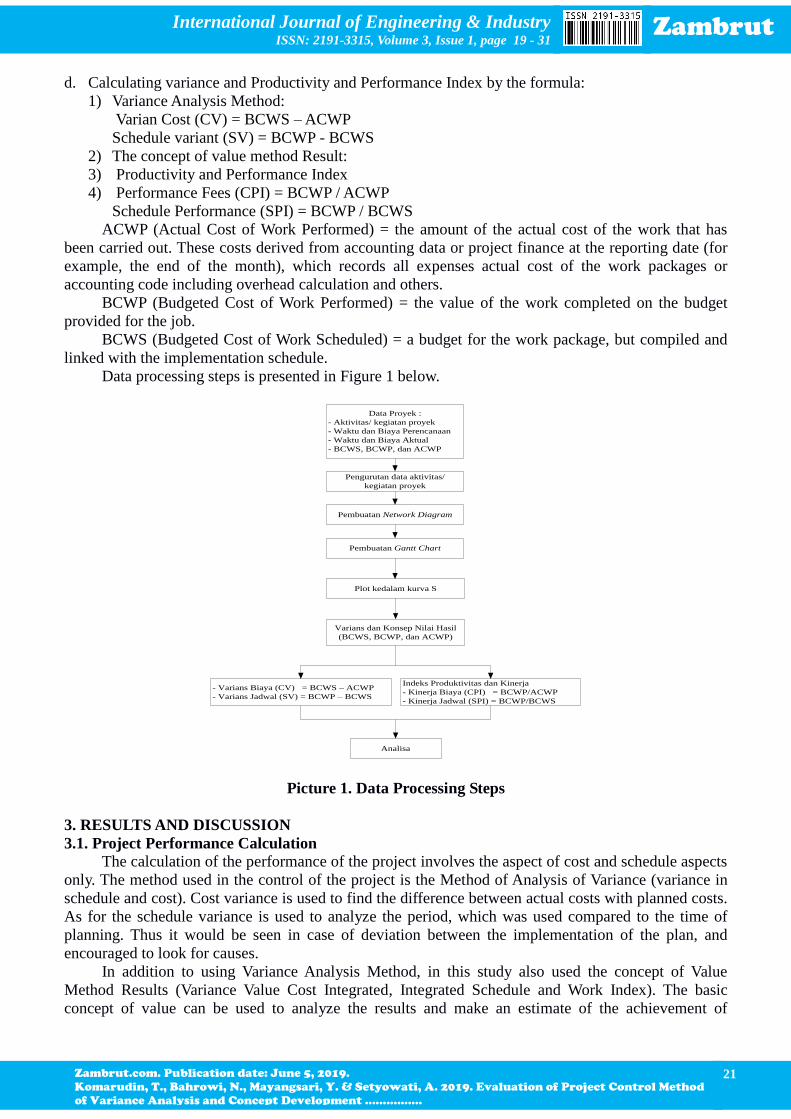
d. Calculating variance and Productivity and Performance Index by the formula:
1) Variance Analysis Method:
Varian Cost (CV) = BCWS – ACWP
Schedule variant (SV) = BCWP - BCWS
2) The concept of value method Result:
3) Productivity and Performance Index
4) Performance Fees (CPI) = BCWP / ACWP
Schedule Performance (SPI) = BCWP / BCWS
ACWP (Actual Cost of Work Performed) = the amount of the actual cost of the work that has
been carried out. These costs derived from accounting data or project finance at the reporting date (for
example, the end of the month), which records all expenses actual cost of the work packages or
accounting code including overhead calculation and others.
BCWP (Budgeted Cost of Work Performed) = the value of the work completed on the budget
provided for the job.
BCWS (Budgeted Cost of Work Scheduled) = a budget for the work package, but compiled and
linked with the implementation schedule.
Data processing steps is presented in Figure 1 below.
Data Proyek :
- Aktivitas/ kegiatan proyek
- Waktu dan Biaya Perencanaan
- Waktu dan Biaya Aktual
- BCWS, BCWP, dan ACWP
Pengurutan data aktivitas/
kegiatan proyek
Pembuatan Network Diagram
Pembuatan Gantt Chart
Plot kedalam kurva S
Varians dan Konsep Nilai Hasil
(BCWS, BCWP, dan ACWP)
- Varians Biaya (CV) = BCWS – ACWP
- Varians Jadwal (SV) = BCWP – BCWS
Indeks Produktivitas dan Kinerja
- Kinerja Biaya (CPI) = BCWP/ACWP
- Kinerja Jadwal (SPI) = BCWP/BCWS
Analisa
Picture 1. Data Processing Steps
3. RESULTS AND DISCUSSION
3.1. Project Performance Calculation The calculation of the performance of the project involves the aspect of cost and schedule aspects
only. The method used in the control of the project is the Method of Analysis of Variance (variance in
schedule and cost). Cost variance is used to find the difference between actual costs with planned costs.
As for the schedule variance is used to analyze the period, which was used compared to the time of
planning. Thus it would be seen in case of deviation between the implementation of the plan, and
encouraged to look for causes.
In addition to using Variance Analysis Method, in this study also used the concept of Value
Method Results (Variance Value Cost Integrated, Integrated Schedule and Work Index). The basic
concept of value can be used to analyze the results and make an estimate of the achievement of
International Journal of Engineering & Industry ISSN: 2191-3315, Volume 3, Issue 1, page 19 - 31
Zambrut
Zambrut.com. Publication date: June 5, 2019.
Komarudin, T., Bahrowi, N., Mayangsari, Y. & Setyowati, A. 2019. Evaluation of Project Control Method
of Variance Analysis and Concept Development ................
22
performance targets. So we use three indicators, namely; ACWP ((Actual Cost of Work Performed),
BCWP (Budgeted Cost of Work Performed) and BCWS (Budgeted Cost of Work Scheduled).
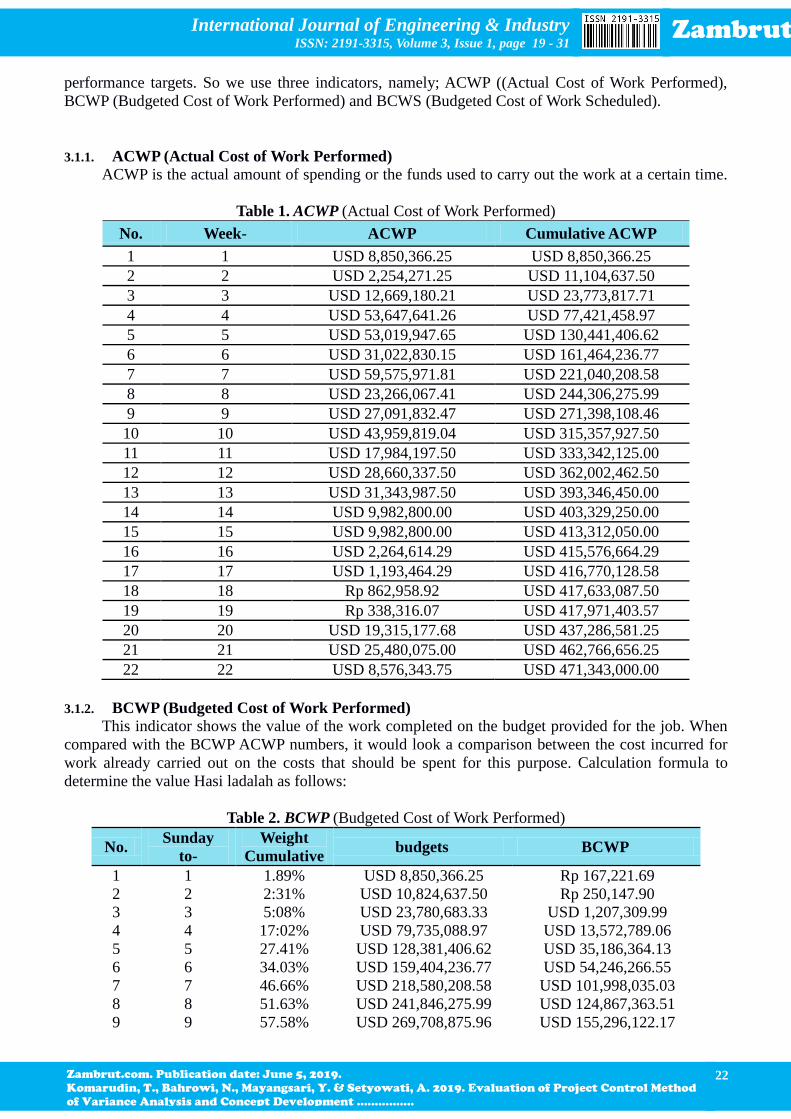
3.1.1. ACWP (Actual Cost of Work Performed)
ACWP is the actual amount of spending or the funds used to carry out the work at a certain time.
Table 1. ACWP (Actual Cost of Work Performed)
No. Week- ACWP Cumulative ACWP
1 1 USD 8,850,366.25 USD 8,850,366.25
2 2 USD 2,254,271.25 USD 11,104,637.50
3 3 USD 12,669,180.21 USD 23,773,817.71
4 4 USD 53,647,641.26 USD 77,421,458.97
5 5 USD 53,019,947.65 USD 130,441,406.62
6 6 USD 31,022,830.15 USD 161,464,236.77
7 7 USD 59,575,971.81 USD 221,040,208.58
8 8 USD 23,266,067.41 USD 244,306,275.99
9 9 USD 27,091,832.47 USD 271,398,108.46
10 10 USD 43,959,819.04 USD 315,357,927.50
11 11 USD 17,984,197.50 USD 333,342,125.00
12 12 USD 28,660,337.50 USD 362,002,462.50
13 13 USD 31,343,987.50 USD 393,346,450.00
14 14 USD 9,982,800.00 USD 403,329,250.00
15 15 USD 9,982,800.00 USD 413,312,050.00
16 16 USD 2,264,614.29 USD 415,576,664.29
17 17 USD 1,193,464.29 USD 416,770,128.58
18 18 Rp 862,958.92 USD 417,633,087.50
19 19 Rp 338,316.07 USD 417,971,403.57
20 20 USD 19,315,177.68 USD 437,286,581.25
21 21 USD 25,480,075.00 USD 462,766,656.25
22 22 USD 8,576,343.75 USD 471,343,000.00
3.1.2. BCWP (Budgeted Cost of Work Performed)
This indicator shows the value of the work completed on the budget provided for the job. When
compared with the BCWP ACWP numbers, it would look a comparison between the cost incurred for
work already carried out on the costs that should be spent for this purpose. Calculation formula to
determine the value Hasi ladalah as follows:
Table 2. BCWP (Budgeted Cost of Work Performed)
No. Sunday
to-
Weight
Cumulative budgets BCWP
1 1 1.89% USD 8,850,366.25 Rp 167,221.69
2 2 2:31% USD 10,824,637.50 Rp 250,147.90
3 3 5:08% USD 23,780,683.33 USD 1,207,309.99
4 4 17:02% USD 79,735,088.97 USD 13,572,789.06
5 5 27.41% USD 128,381,406.62 USD 35,186,364.13
6 6 34.03% USD 159,404,236.77 USD 54,246,266.55
7 7 46.66% USD 218,580,208.58 USD 101,998,035.03
8 8 51.63% USD 241,846,275.99 USD 124,867,363.51
9 9 57.58% USD 269,708,875.96 USD 155,296,122.17
International Journal of Engineering & Industry ISSN: 2191-3315, Volume 3, Issue 1, page 19 - 31
Zambrut
Zambrut.com. Publication date: June 5, 2019.
Komarudin, T., Bahrowi, N., Mayangsari, Y. & Setyowati, A. 2019. Evaluation of Project Control Method
of Variance Analysis and Concept Development ................
23
10 10 66.76% USD 312,696,927.50 USD 208,745,614.92
11 11 70.60% USD 330,681,125.00 USD 233,447,348.78
12 12 76.71% USD 359,341,462.50 USD 275,667,009.68
13 13 83.41% USD 390,685,450.00 USD 325,855,164.11
14 14 85.54% USD 400,668,250.00 USD 342,720,427.99
15 15 87.67% USD 410,651,050.00 USD 360,011,197.07
16 16 88.15% USD 412,915,664.29 USD 363,992,847.81
17 17 88.41% USD 414,109,128.58 USD 366,100,010.62
18 18 88.59% USD 14,972,087.50 USD 367,627,426.60
19 19 88.66% USD 415,310,403.57 USD 368,227,105.32
20 20 93.53% USD 438,116,525.45 USD 409,778,721.12
21 21 99.39% USD 465,555,218.75 USD 462,713,884.95
22 22 100.00% USD 468,414,000.00 USD 468,414,000.00
3.1.3. BCWS (Budgeted Cost of Work Scheduled)
This figure shows the budget for the work package, but compiled and linked with the
implementation schedule. Here, there was a mix between cost, schedule and scope of work, where
every element of the work has been given the allocation of costs and schedules can be a benchmark in
the implementation of the work.
Table 3. BCWS (Budgeted Cost of Work Scheduled)
No. Week- BCWS Cumulative BCWS
1 1 USD 8,850,366.25 USD 8,850,366.25
2 2 USD 1,974,271.25 USD 10,824,637.50
3 3 USD 12,956,045.83 USD 23,780,683.33
4 4 USD 55,954,405.64 USD 79,735,088.97
5 5 USD 48,646,317.65 USD 128,381,406.62
6 6 USD 31,022,830.15 USD 159,404,236.77
7 7 USD 59,175,971.81 USD 218,580,208.58
8 8 USD 23,266,067.41 USD 241,846,275.99
9 9 USD 27,862,599.97 USD 269,708,875.96
10 10 USD 42,988,051.54 USD 312,696,927.50
11 11 USD 17,984,197.50 USD 330,681,125.00
12 12 USD 28,660,337.50 USD 359,341,462.50
13 13 USD 31,343,987.50 USD 390,685,450.00
14 14 USD 9,982,800.00 USD 400,668,250.00
15 15 USD 9,982,800.00 USD 410,651,050.00
16 16 USD 2,264,614.29 USD 412,915,664.29
17 17 USD 1,193,464.29 USD 414,109,128.58
18 18 Rp 862,958.92 USD 414,972,087.50
19 19 Rp 338,316.07 USD 415,310,403.57
20 20 USD 22,806,121.88 USD 438,116,525.45
21 21 USD 27,438,693.30 USD 465,555,218.75
22 22 USD 2,858,781.25 USD 468,414,000.00
After getting the value of the indicators mentioned above, then proceed to make the S-curve
combination.
International Journal of Engineering & Industry ISSN: 2191-3315, Volume 3, Issue 1, page 19 - 31
Zambrut
Zambrut.com. Publication date: June 5, 2019.
Komarudin, T., Bahrowi, N., Mayangsari, Y. & Setyowati, A. 2019. Evaluation of Project Control Method
of Variance Analysis and Concept Development ................
24
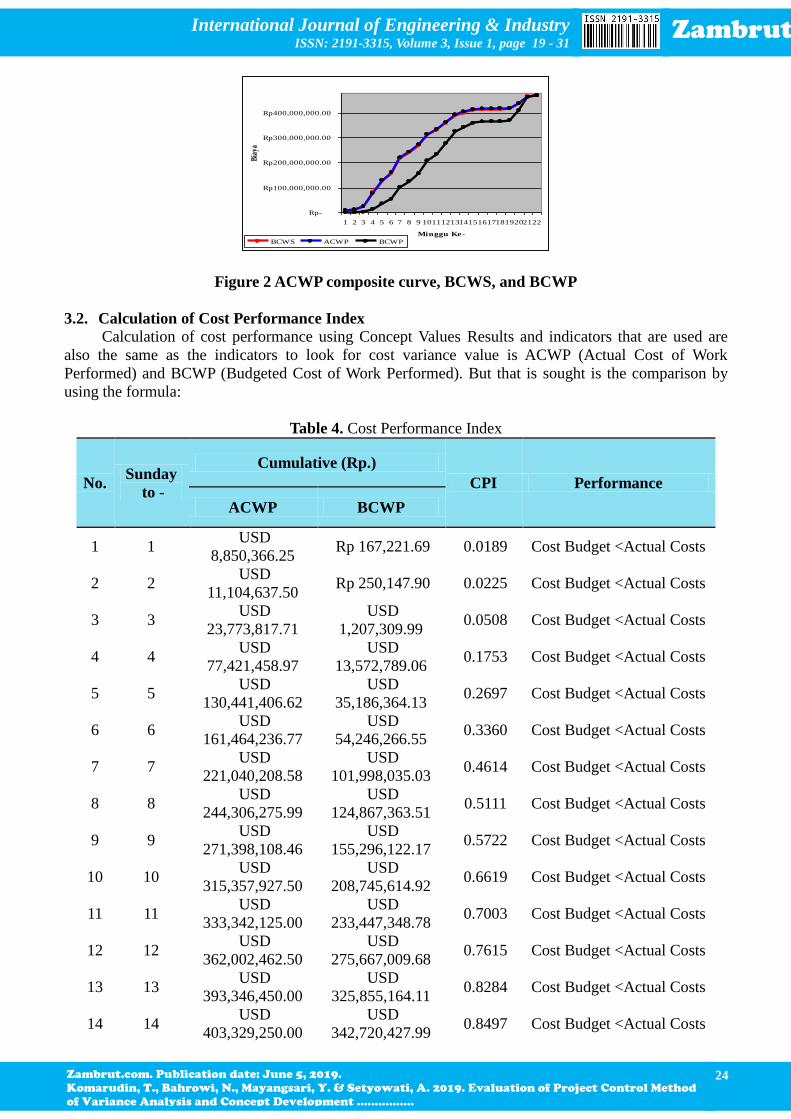
Rp-
Rp100,000,000.00
Rp200,000,000.00
Rp300,000,000.00
Rp400,000,000.00
1 2 3 4 5 6 7 8 9 10111213141516171819202122
Minggu Ke-
Bia
ya
BCWS ACWP BCWP
Figure 2 ACWP composite curve, BCWS, and BCWP
3.2. Calculation of Cost Performance Index Calculation of cost performance using Concept Values Results and indicators that are used are
also the same as the indicators to look for cost variance value is ACWP (Actual Cost of Work
Performed) and BCWP (Budgeted Cost of Work Performed). But that is sought is the comparison by
using the formula:
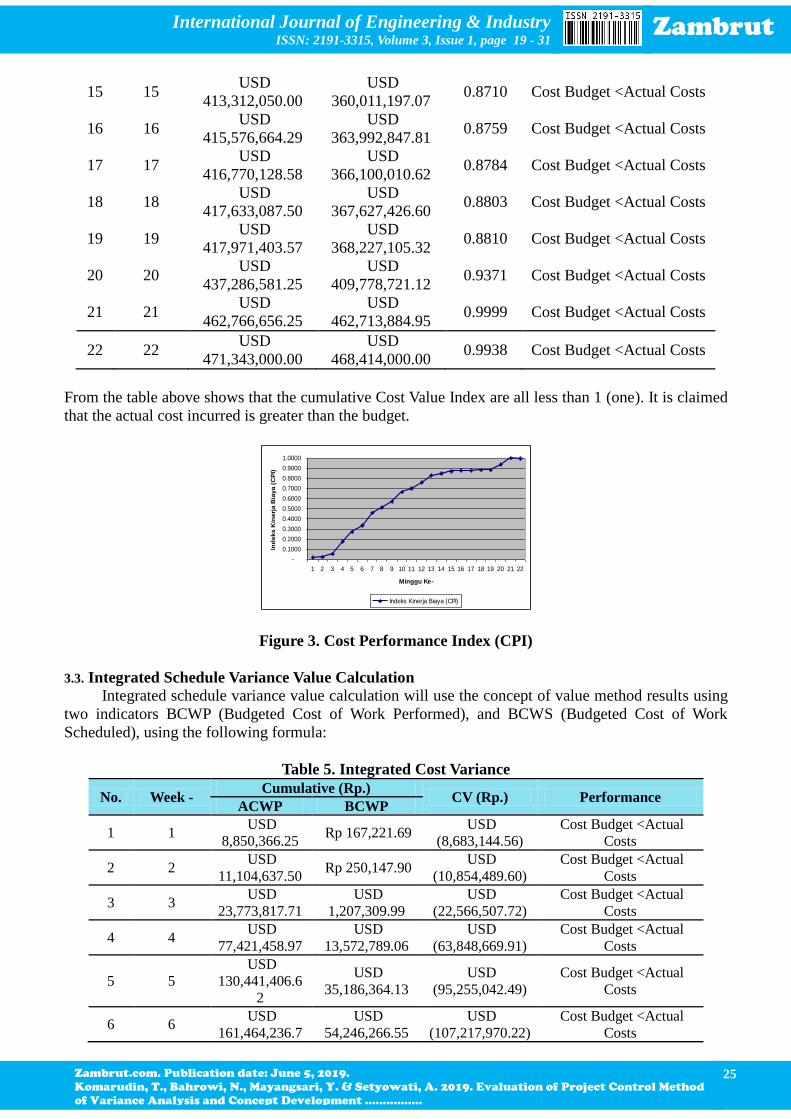
Table 4. Cost Performance Index
No. Sunday
to -
Cumulative (Rp.)
CPI Performance
ACWP BCWP
1 1 USD
8,850,366.25 Rp 167,221.69 0.0189 Cost Budget <Actual Costs
2 2 USD
11,104,637.50 Rp 250,147.90 0.0225 Cost Budget <Actual Costs
3 3 USD
23,773,817.71
USD
1,207,309.99 0.0508 Cost Budget <Actual Costs
4 4 USD
77,421,458.97
USD
13,572,789.06 0.1753 Cost Budget <Actual Costs
5 5 USD
130,441,406.62
USD
35,186,364.13 0.2697 Cost Budget <Actual Costs
6 6 USD
161,464,236.77
USD
54,246,266.55 0.3360 Cost Budget <Actual Costs
7 7 USD
221,040,208.58
USD
101,998,035.03 0.4614 Cost Budget <Actual Costs
8 8 USD
244,306,275.99
USD
124,867,363.51 0.5111 Cost Budget <Actual Costs
9 9 USD
271,398,108.46
USD
155,296,122.17 0.5722 Cost Budget <Actual Costs
10 10 USD
315,357,927.50
USD
208,745,614.92 0.6619 Cost Budget <Actual Costs
11 11 USD
333,342,125.00
USD
233,447,348.78 0.7003 Cost Budget <Actual Costs
12 12 USD
362,002,462.50
USD
275,667,009.68 0.7615 Cost Budget <Actual Costs
13 13 USD
393,346,450.00
USD
325,855,164.11 0.8284 Cost Budget <Actual Costs
14 14 USD
403,329,250.00
USD
342,720,427.99 0.8497 Cost Budget <Actual Costs
International Journal of Engineering & Industry ISSN: 2191-3315, Volume 3, Issue 1, page 19 - 31
Zambrut
Zambrut.com. Publication date: June 5, 2019.
Komarudin, T., Bahrowi, N., Mayangsari, Y. & Setyowati, A. 2019. Evaluation of Project Control Method
of Variance Analysis and Concept Development ................
25
15 15 USD
413,312,050.00
USD
360,011,197.07 0.8710 Cost Budget <Actual Costs
16 16 USD
415,576,664.29
USD
363,992,847.81 0.8759 Cost Budget <Actual Costs
17 17 USD
416,770,128.58
USD
366,100,010.62 0.8784 Cost Budget <Actual Costs
18 18 USD
417,633,087.50
USD
367,627,426.60 0.8803 Cost Budget <Actual Costs
19 19 USD
417,971,403.57
USD
368,227,105.32 0.8810 Cost Budget <Actual Costs
20 20 USD
437,286,581.25
USD
409,778,721.12 0.9371 Cost Budget <Actual Costs
21 21 USD
462,766,656.25
USD
462,713,884.95 0.9999 Cost Budget <Actual Costs
22 22 USD
471,343,000.00
USD
468,414,000.00 0.9938 Cost Budget <Actual Costs
From the table above shows that the cumulative Cost Value Index are all less than 1 (one). It is claimed
that the actual cost incurred is greater than the budget.
-
0.1000
0.2000
0.3000
0.4000
0.5000
0.6000
0.7000
0.8000
0.9000
1.0000
1 2 3 4 5 6 7 8 9 10 11 12 13 14 15 16 17 18 19 20 21 22
Minggu Ke-
Ind
eks K
inerj
a B
iaya (
CP
I)
Indeks Kinerja Biaya (CPI)
Figure 3. Cost Performance Index (CPI)
3.3. Integrated Schedule Variance Value Calculation
Integrated schedule variance value calculation will use the concept of value method results using
two indicators BCWP (Budgeted Cost of Work Performed), and BCWS (Budgeted Cost of Work
Scheduled), using the following formula:
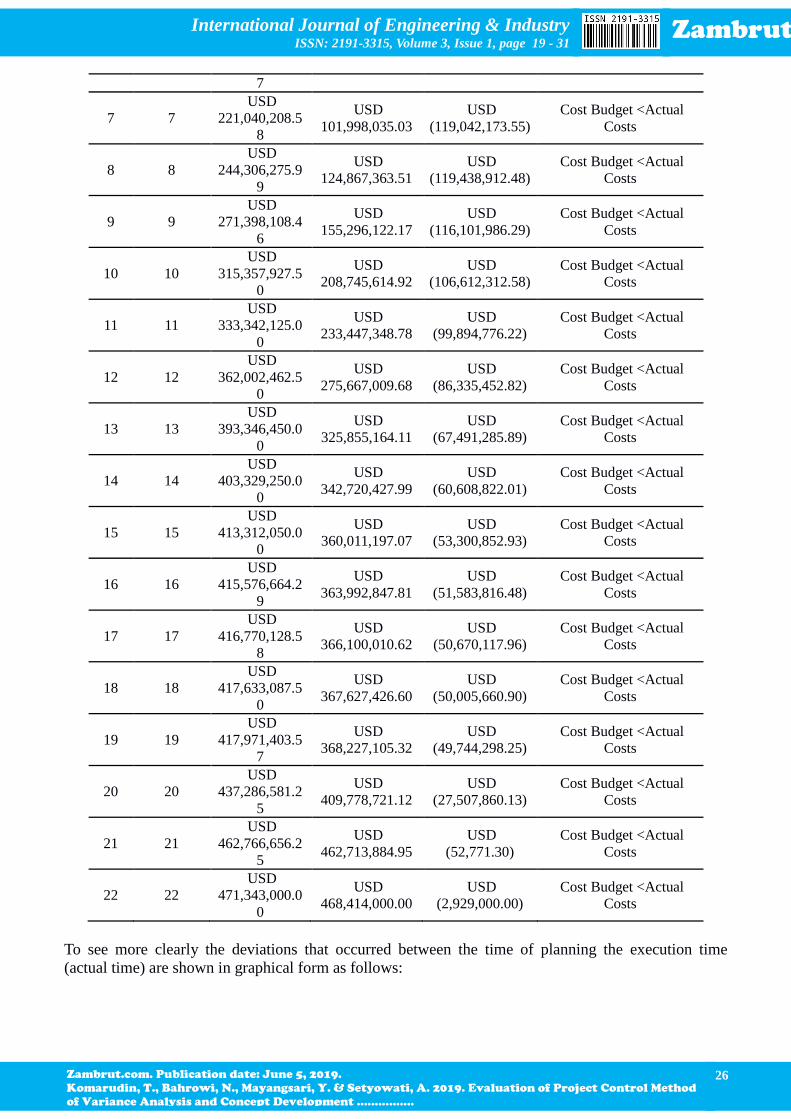
Table 5. Integrated Cost Variance
No. Week - Cumulative (Rp.)
CV (Rp.) Performance ACWP BCWP
1 1 USD
8,850,366.25 Rp 167,221.69
USD
(8,683,144.56)
Cost Budget <Actual
Costs
2 2 USD
11,104,637.50 Rp 250,147.90
USD
(10,854,489.60)
Cost Budget <Actual
Costs
3 3 USD
23,773,817.71
USD
1,207,309.99
USD
(22,566,507.72)
Cost Budget <Actual
Costs
4 4 USD
77,421,458.97
USD
13,572,789.06
USD
(63,848,669.91)
Cost Budget <Actual
Costs
5 5
USD
130,441,406.6
2
USD
35,186,364.13
USD
(95,255,042.49)
Cost Budget <Actual
Costs
6 6 USD
161,464,236.7
USD
54,246,266.55
USD
(107,217,970.22)
Cost Budget <Actual
Costs
International Journal of Engineering & Industry ISSN: 2191-3315, Volume 3, Issue 1, page 19 - 31
Zambrut
Zambrut.com. Publication date: June 5, 2019.
Komarudin, T., Bahrowi, N., Mayangsari, Y. & Setyowati, A. 2019. Evaluation of Project Control Method
of Variance Analysis and Concept Development ................
26
7
7 7
USD
221,040,208.5
8
USD
101,998,035.03
USD
(119,042,173.55)
Cost Budget <Actual
Costs
8 8
USD
244,306,275.9
9
USD
124,867,363.51
USD
(119,438,912.48)
Cost Budget <Actual
Costs
9 9
USD
271,398,108.4
6
USD
155,296,122.17
USD
(116,101,986.29)
Cost Budget <Actual
Costs
10 10
USD
315,357,927.5
0
USD
208,745,614.92
USD
(106,612,312.58)
Cost Budget <Actual
Costs
11 11
USD
333,342,125.0
0
USD
233,447,348.78
USD
(99,894,776.22)
Cost Budget <Actual
Costs
12 12
USD
362,002,462.5
0
USD
275,667,009.68
USD
(86,335,452.82)
Cost Budget <Actual
Costs
13 13
USD
393,346,450.0
0
USD
325,855,164.11
USD
(67,491,285.89)
Cost Budget <Actual
Costs
14 14
USD
403,329,250.0
0
USD
342,720,427.99
USD
(60,608,822.01)
Cost Budget <Actual
Costs
15 15
USD
413,312,050.0
0
USD
360,011,197.07
USD
(53,300,852.93)
Cost Budget <Actual
Costs
16 16
USD
415,576,664.2
9
USD
363,992,847.81
USD
(51,583,816.48)
Cost Budget <Actual
Costs
17 17
USD
416,770,128.5
8
USD
366,100,010.62
USD
(50,670,117.96)
Cost Budget <Actual
Costs
18 18
USD
417,633,087.5
0
USD
367,627,426.60
USD
(50,005,660.90)
Cost Budget <Actual
Costs
19 19
USD
417,971,403.5
7
USD
368,227,105.32
USD
(49,744,298.25)
Cost Budget <Actual
Costs
20 20
USD
437,286,581.2
5
USD
409,778,721.12
USD
(27,507,860.13)
Cost Budget <Actual
Costs
21 21
USD
462,766,656.2
5
USD
462,713,884.95
USD
(52,771.30)
Cost Budget <Actual
Costs
22 22
USD
471,343,000.0
0
USD
468,414,000.00
USD
(2,929,000.00)
Cost Budget <Actual
Costs
To see more clearly the deviations that occurred between the time of planning the execution time
(actual time) are shown in graphical form as follows:
International Journal of Engineering & Industry ISSN: 2191-3315, Volume 3, Issue 1, page 19 - 31
Zambrut
Zambrut.com. Publication date: June 5, 2019.
Komarudin, T., Bahrowi, N., Mayangsari, Y. & Setyowati, A. 2019. Evaluation of Project Control Method
of Variance Analysis and Concept Development ................
27
Rp(120,000,000.00)
Rp(100,000,000.00)
Rp(80,000,000.00)
Rp(60,000,000.00)
Rp(40,000,000.00)
Rp(20,000,000.00)
Rp-
1 2 3 4 5 6 7 8 9 10 11 12 13 14 15 16 17 18 19 20 21 22
Minggu Ke-
Bia
ya
Varians Jadw al (SV)
Figure 4. Value of Integrated Schedule Variance (SV)
3.4. Calculation Schedule Performance Index The schedule performance index calculation also menggunakanMetode concept of value results,
which sought here is the same, namely ACWP ((Actual Cost of Work Performed) and BCWS
(Budgeted Cost of Work Scheduled).
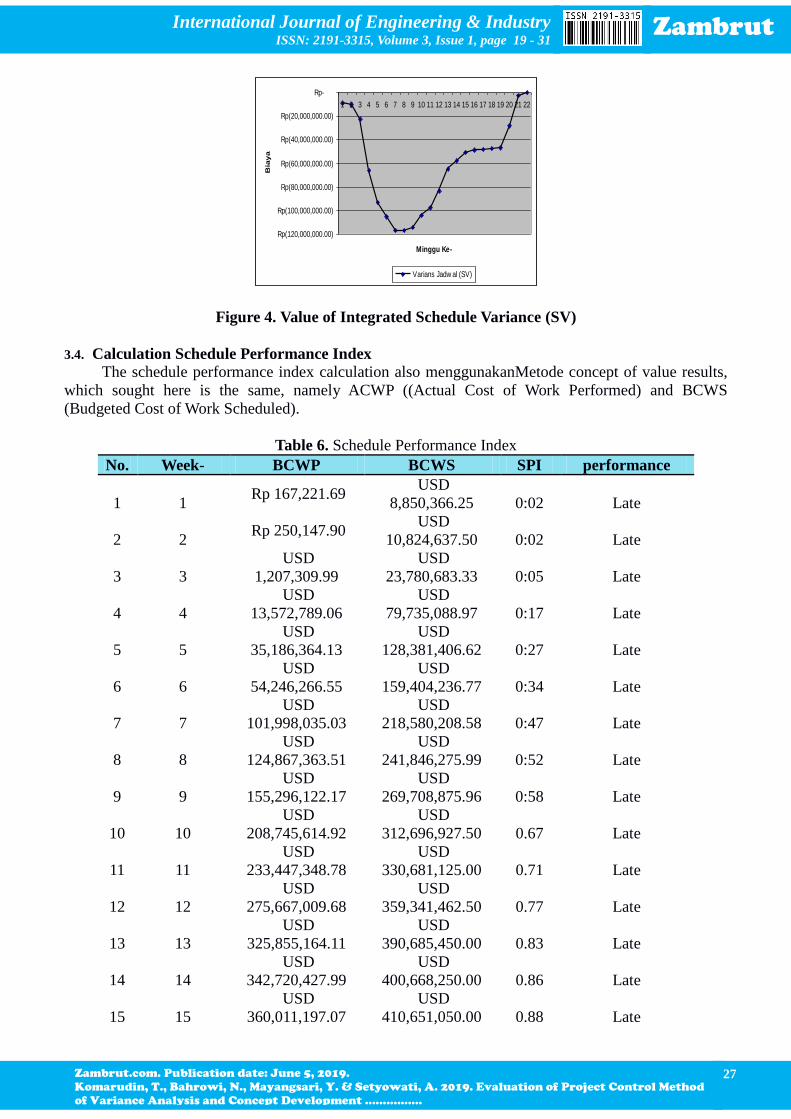
Table 6. Schedule Performance Index
No. Week- BCWP BCWS SPI performance
1 1 Rp 167,221.69
USD
8,850,366.25 0:02 Late
2 2 Rp 250,147.90
USD
10,824,637.50 0:02 Late
3 3
USD
1,207,309.99
USD
23,780,683.33 0:05 Late
4 4
USD
13,572,789.06
USD
79,735,088.97 0:17 Late
5 5
USD
35,186,364.13
USD
128,381,406.62 0:27 Late
6 6
USD
54,246,266.55
USD
159,404,236.77 0:34 Late
7 7
USD
101,998,035.03
USD
218,580,208.58 0:47 Late
8 8
USD
124,867,363.51
USD
241,846,275.99 0:52 Late
9 9
USD
155,296,122.17
USD
269,708,875.96 0:58 Late
10 10
USD
208,745,614.92
USD
312,696,927.50 0.67 Late
11 11
USD
233,447,348.78
USD
330,681,125.00 0.71 Late
12 12
USD
275,667,009.68
USD
359,341,462.50 0.77 Late
13 13
USD
325,855,164.11
USD
390,685,450.00 0.83 Late
14 14
USD
342,720,427.99
USD
400,668,250.00 0.86 Late
15 15
USD
360,011,197.07
USD
410,651,050.00 0.88 Late

International Journal of Engineering & Industry ISSN: 2191-3315, Volume 3, Issue 1, page 19 - 31
Zambrut
Zambrut.com. Publication date: June 5, 2019.
Komarudin, T., Bahrowi, N., Mayangsari, Y. & Setyowati, A. 2019. Evaluation of Project Control Method
of Variance Analysis and Concept Development ................
28
16 16
USD
363,992,847.81
USD
412,915,664.29 0.88 Late
17 17
USD
366,100,010.62
USD
414,109,128.58 0.88 Late
18 18
USD
367,627,426.60
USD
414,972,087.50 0.89 Late
19 19
USD
368,227,105.32
USD
415,310,403.57 0.89 Late
20 20
USD
409,778,721.12
USD
438,116,525.45 0.94 Late
21 21
USD
462,713,884.95
USD
465,555,218.75 0.99 Late
22 22
USD
468,414,000.00
USD
468,414,000.00 1:00 Right
To see more clearly the deviations that occurred between the time of planning the execution time
(actual time) are shown in graphical form as follows:
0.0000
0.2000
0.4000
0.6000
0.8000
1.0000
1 2 3 4 5 6 7 8 9 10 11 12 13 14 15 16
Minggu ke-
In
dek
s K
inerja
Ja
dw
al
Indeks Kinerja Jadwal (SPI)
Figure 5. Schedule Performance Index
3.5. Project Performance Analysis per Sunday
Performance analysis of the project include cost and schedule performance. Because the unit of
time used in the Schedule Variance Variance Analysis Method is a day, whereas in this analysis units
used are the week, the schedule variance analysis will be done separately. On the Method of Analysis of
Variance, Cost Variance value obtained from a direct comparison between the costs used in the
implementation of the project with the budgeted costs. For example, Project Performance analysis
presented Sunday All 3 are presented in Table 7.
International Journal of Engineering & Industry ISSN: 2191-3315, Volume 3, Issue 1, page 19 - 31
Zambrut
Zambrut.com. Publication date: June 5, 2019.
Komarudin, T., Bahrowi, N., Mayangsari, Y. & Setyowati, A. 2019. Evaluation of Project Control Method
of Variance Analysis and Concept Development ................
29
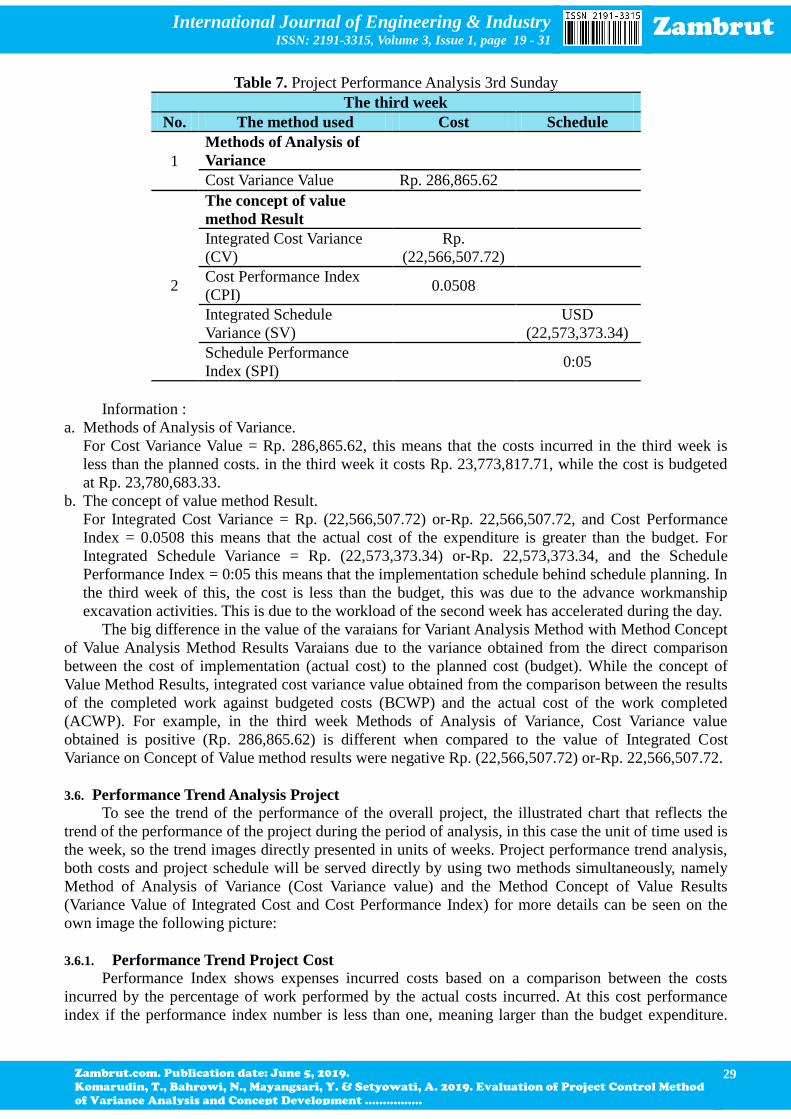
Table 7. Project Performance Analysis 3rd Sunday
The third week
No. The method used Cost Schedule
1
Methods of Analysis of
Variance
Cost Variance Value Rp. 286,865.62
2
The concept of value
method Result
Integrated Cost Variance
(CV)
Rp.
(22,566,507.72)
Cost Performance Index
(CPI) 0.0508
Integrated Schedule
Variance (SV)
USD
(22,573,373.34)
Schedule Performance
Index (SPI) 0:05
Information :
a. Methods of Analysis of Variance.
For Cost Variance Value = Rp. 286,865.62, this means that the costs incurred in the third week is
less than the planned costs. in the third week it costs Rp. 23,773,817.71, while the cost is budgeted
at Rp. 23,780,683.33.
b. The concept of value method Result.
For Integrated Cost Variance = Rp. (22,566,507.72) or-Rp. 22,566,507.72, and Cost Performance
Index = 0.0508 this means that the actual cost of the expenditure is greater than the budget. For
Integrated Schedule Variance = Rp. (22,573,373.34) or-Rp. 22,573,373.34, and the Schedule
Performance Index = 0:05 this means that the implementation schedule behind schedule planning. In
the third week of this, the cost is less than the budget, this was due to the advance workmanship
excavation activities. This is due to the workload of the second week has accelerated during the day.
The big difference in the value of the varaians for Variant Analysis Method with Method Concept
of Value Analysis Method Results Varaians due to the variance obtained from the direct comparison
between the cost of implementation (actual cost) to the planned cost (budget). While the concept of
Value Method Results, integrated cost variance value obtained from the comparison between the results
of the completed work against budgeted costs (BCWP) and the actual cost of the work completed
(ACWP). For example, in the third week Methods of Analysis of Variance, Cost Variance value
obtained is positive (Rp. 286,865.62) is different when compared to the value of Integrated Cost
Variance on Concept of Value method results were negative Rp. (22,566,507.72) or-Rp. 22,566,507.72.
3.6. Performance Trend Analysis Project To see the trend of the performance of the overall project, the illustrated chart that reflects the
trend of the performance of the project during the period of analysis, in this case the unit of time used is
the week, so the trend images directly presented in units of weeks. Project performance trend analysis,
both costs and project schedule will be served directly by using two methods simultaneously, namely
Method of Analysis of Variance (Cost Variance value) and the Method Concept of Value Results
(Variance Value of Integrated Cost and Cost Performance Index) for more details can be seen on the
own image the following picture:
3.6.1. Performance Trend Project Cost Performance Index shows expenses incurred costs based on a comparison between the costs
incurred by the percentage of work performed by the actual costs incurred. At this cost performance
index if the performance index number is less than one, meaning larger than the budget expenditure.
International Journal of Engineering & Industry ISSN: 2191-3315, Volume 3, Issue 1, page 19 - 31
Zambrut
Zambrut.com. Publication date: June 5, 2019.
Komarudin, T., Bahrowi, N., Mayangsari, Y. & Setyowati, A. 2019. Evaluation of Project Control Method
of Variance Analysis and Concept Development ................
30
While anglka zero indicates that the cost is equal to the budgeted costs. And if the performance index
indicates the number is greater than one, then this means that the cost is less than the budget.
From Figure 3 The performance index cost (CPI) can be seen that the performance index
indicates the number is less than one, it indicates the cost is greater than the budget, while at week 21,
the performance index indicates the number the same as the one that means the cost was the same as
budget.
3.6.2. Performance Trend Project Schedule In the integrated schedule variance negative number indicates a late work completed, the zero
indicates the work carried out in accordance with the planning schedule. While a positive number
indicates the job done more quickly resolved than with planning.
From Figure 4 Value unified schedule variance (SV) shows that the work being done from the
beginning (first week) to week 21 showed negative figures, as has been described above that a negative
number indicates delays in the project when compared to the plans made. While at week 22 showed
zero which means work performed in accordance with the planned schedule. Schedule Performance
Index (SPI) shows the work schedule that is based on a comparison between a schedule that is based on
the percentage of the work carried out with the planned schedule. On this schedule performance index
if the performance index number is less than one, meaning larger than the budget expenditure. While
anglka zero indicates that the cost is equal to the budgeted costs. And if the performance index
indicates the number is greater than one, then this means that the cost is less than the budget.
From Figure 5 the performance index of the schedule (SPI) can be seen that the performance
index indicates the number is less than one, it indicates the cost is greater than the budget, while at
week 21, the performance index indicates the number the same as the one that means the project
implementation schedule is equal to the planned schedule. Judging from the results that have been
achieved, both the cost and schedule of the project shows a tendency of irregularities in the use of cost
and schedule for implementation of development projects fish auction place (TPI). This is due to the
acceleration of progress as the activity occurs, such as in work measurement and bouwplank thus
experiencing cost overruns due to additional labor.
In addition to accelerating construction activity, variances occur also due to a delay in
construction activities such as the construction work of the cast sloop concrete, cast concrete columns,
concrete filler steel columns without reinforcement, horses IWF, electrical installations, work sewage,
drainage work has been delayed execution so causing additional labor costs due to a workforce
unemployed.
Broadly speaking, the things that cause such deviations include:
a. The acceleration of workmanship which require additional labor will also add to the cost of the
project.
b. Delays in the delivery of raw materials or the materials needed by suppliers thus causing delays in
the project.
c. Greater expenses incurred because of their unemployed labor force caused by late delivery of raw
materials or material.
The cause of the deviation between the implementation of the planning project mentioned above can be
reduced by providing additional working hours (overtime).
4. CONCLUSION The conclusion of this study are as follows:
a. The concept of the value of the results of a project control method that can analyze cost variance
and schedule variance simultaneously able to demonstrate the performance index of the cost and
schedule performance index at each reporting, so the project can be seen by reporting progress.
b. In the first week of reporting, cost variance is zero and schedule variance equal to zero, this means
the work is completed the same schedule with the planned schedule at a cost within budget. In
reporting its second week, a negative sign cost variance and schedule variance indicates a positive
number, it means that the job is completed earlier than planned and cost greater than the budget.
International Journal of Engineering & Industry ISSN: 2191-3315, Volume 3, Issue 1, page 19 - 31
Zambrut
Zambrut.com. Publication date: June 5, 2019.
Komarudin, T., Bahrowi, N., Mayangsari, Y. & Setyowati, A. 2019. Evaluation of Project Control Method
of Variance Analysis and Concept Development ................
31
While in the third week of reporting, cost variance value of positive and schedule variance value of
zero, it indicates that the work accomplished in accordance with the schedule and cost less than the
budget. The amount that exceeds the cost of the project budget is 0.01% of the available budget.
5. REFERENCES [1] Lock, Dennis, (1987), Project management, Third Edition, Erland, Jakarta.
[2] Reksohadiprodjo, Sukanto, (1987), Project Management, Second Edition, BPFE, Yogyakarta.
[3] Suharto, Faith, (1998), Project Management (From Conceptual Up Operations), Volume 1, Second
Edition, PT. Erland, Jakarta.
[4] Ali, Tubagus Haedar, (1995), Principles of Network Planning, PT. Gramedia, Jakarta.
[5] Department of Livestock and Fisheries Cianjur (2008). Fisheries Production Development.
Zambrut Journal, Link Access;
https://zambrut.com
https://zambrut.com/development-value/
© Copyright International Journal of Zambrut | Zambrut, Inc.