International Journal of Remote Sensing The multispectral ... · PDF fileThe multispectral...
26
PLEASE SCROLL DOWN FOR ARTICLE This article was downloaded by: [Northern Arizona University] On: 23 July 2010 Access details: Access Details: [subscription number 776363596] Publisher Taylor & Francis Informa Ltd Registered in England and Wales Registered Number: 1072954 Registered office: Mortimer House, 37- 41 Mortimer Street, London W1T 3JH, UK International Journal of Remote Sensing Publication details, including instructions for authors and subscription information: http://www.informaworld.com/smpp/title~content=t713722504 The multispectral separability of Costa Rican rainforest types with support vector machines and Random Forest decision trees Steven E. Sesnie ab ; Bryan Finegan b ; Paul E. Gessler ac ; Sirpa Thessler d ; Zayra Ramos Bendana b ; Alistair M. S. Smith ac a Department of Forest Resources, PO Box 441133, University of Idaho, Moscow, ID, USA b Centro Agronómico Tropical de Investigación y Enseñanza (CATIE), Turriabla, Costa Rica c Geospatial Laboratory for Environmental Dynamics, University of Idaho, Moscow, ID, USA d Finnish Forest Research Institute (Metla), Helsinki, Finland Online publication date: 19 July 2010 To cite this Article Sesnie, Steven E. , Finegan, Bryan , Gessler, Paul E. , Thessler, Sirpa , Bendana, Zayra Ramos and Smith, Alistair M. S.(2010) 'The multispectral separability of Costa Rican rainforest types with support vector machines and Random Forest decision trees', International Journal of Remote Sensing, 31: 11, 2885 — 2909 To link to this Article: DOI: 10.1080/01431160903140803 URL: http://dx.doi.org/10.1080/01431160903140803 Full terms and conditions of use: http://www.informaworld.com/terms-and-conditions-of-access.pdf This article may be used for research, teaching and private study purposes. Any substantial or systematic reproduction, re-distribution, re-selling, loan or sub-licensing, systematic supply or distribution in any form to anyone is expressly forbidden. The publisher does not give any warranty express or implied or make any representation that the contents will be complete or accurate or up to date. The accuracy of any instructions, formulae and drug doses should be independently verified with primary sources. The publisher shall not be liable for any loss, actions, claims, proceedings, demand or costs or damages whatsoever or howsoever caused arising directly or indirectly in connection with or arising out of the use of this material.
Transcript of International Journal of Remote Sensing The multispectral ... · PDF fileThe multispectral...
PLEASE SCROLL DOWN FOR ARTICLE
This article was downloaded by: [Northern Arizona University]On: 23 July 2010Access details: Access Details: [subscription number 776363596]Publisher Taylor & FrancisInforma Ltd Registered in England and Wales Registered Number: 1072954 Registered office: Mortimer House, 37-41 Mortimer Street, London W1T 3JH, UK
International Journal of Remote SensingPublication details, including instructions for authors and subscription information:http://www.informaworld.com/smpp/title~content=t713722504
The multispectral separability of Costa Rican rainforest types with supportvector machines and Random Forest decision treesSteven E. Sesnieab; Bryan Fineganb; Paul E. Gesslerac; Sirpa Thesslerd; Zayra Ramos Bendanab; AlistairM. S. Smithac
a Department of Forest Resources, PO Box 441133, University of Idaho, Moscow, ID, USA b CentroAgronómico Tropical de Investigación y Enseñanza (CATIE), Turriabla, Costa Rica c GeospatialLaboratory for Environmental Dynamics, University of Idaho, Moscow, ID, USA d Finnish ForestResearch Institute (Metla), Helsinki, Finland
Online publication date: 19 July 2010
To cite this Article Sesnie, Steven E. , Finegan, Bryan , Gessler, Paul E. , Thessler, Sirpa , Bendana, Zayra Ramos andSmith, Alistair M. S.(2010) 'The multispectral separability of Costa Rican rainforest types with support vector machinesand Random Forest decision trees', International Journal of Remote Sensing, 31: 11, 2885 — 2909To link to this Article: DOI: 10.1080/01431160903140803URL: http://dx.doi.org/10.1080/01431160903140803
Full terms and conditions of use: http://www.informaworld.com/terms-and-conditions-of-access.pdf
This article may be used for research, teaching and private study purposes. Any substantial orsystematic reproduction, re-distribution, re-selling, loan or sub-licensing, systematic supply ordistribution in any form to anyone is expressly forbidden.
The publisher does not give any warranty express or implied or make any representation that the contentswill be complete or accurate or up to date. The accuracy of any instructions, formulae and drug dosesshould be independently verified with primary sources. The publisher shall not be liable for any loss,actions, claims, proceedings, demand or costs or damages whatsoever or howsoever caused arising directlyor indirectly in connection with or arising out of the use of this material.
The multispectral separability of Costa Rican rainforest types withsupport vector machines and Random Forest decision trees
STEVEN E. SESNIE*†‡, BRYAN FINEGAN‡, PAUL E. GESSLER†¶,
SIRPA THESSLER§, ZAYRA RAMOS BENDANA‡ and
ALISTAIR M. S. SMITH†¶
†Department of Forest Resources, PO Box 441133, University of Idaho,
Moscow, ID, 83844-1133, USA
‡Centro Agronomico Tropical de Investigacion y Ensenanza (CATIE),
Turriabla 7170, Costa Rica
§Finnish Forest Research Institute (Metla), Unioninkatu 40 A, 00170 Helsinki, Finland
¶Geospatial Laboratory for Environmental Dynamics,
University of Idaho, Moscow, ID, 83844, USA
(Received 7 January 2008; in final form 19 September 2008)
Estimating the extent of tropical rainforest types is needed for biodiversity assess-
ment and carbon accounting. In this study, we used statistical comparisons to
determine the ability of Landsat Thematic Mapper (TM) bands and spectral
vegetation indices to discriminate composition and structural types. A total of
144 old-growth forest plots established in northern Costa Rica were categorized
via cluster analysis and ordination. Locations for palm swamps, forest regrowth
and tree plantations were also acquired, making 11 forest types for separability
analysis. Forest types classified using support vector machines (SVM), a theoreti-
cally superior method for solving complex classification problems, were compared
with the random forest decision tree classifier (RF). Separability comparisons
demonstrate that spectral data are sensitive to differences among forest types
when tree species and structural similarity is low. SVM class accuracy was 66.6%
for all forest types, minimally higher than the RF classifier (65.3%). TM bands and
the Normalized Difference Vegetation Index (NDVI) combined with digital eleva-
tion data notably increased accuracies for SVM (84.3%) and RF (86.7%) classi-
fiers. Rainforest types discriminated here are typically limited to one or two
categories for remote sensing classifications. Our results indicate that TM bands
and ancillary data combined via machine learning algorithms can yield accurate
and ecologically meaningful rainforest classifications important to national and
international forest monitoring protocols.
1. Introduction
Floristic differences among rainforest types are poorly defined for wet tropical
areas, but are relevant to conservation planning for areas of high plant diversity
(Tuomisto et al. 1995, Chust et al. 2006). Human land use threatens to reduce the
number of tropical vegetation types and forest carbon stocks (Mayaux et al. 2005),
while increasing landscape heterogeneity via secondary forest and tree plantation
*Corresponding author. Email: [email protected]
International Journal of Remote SensingISSN 0143-1161 print/ISSN 1366-5901 online # 2010 Taylor & Francis
http://www.tandf.co.uk/journalsDOI: 10.1080/01431160903140803
International Journal of Remote Sensing
Vol. 31, No. 11, 10 June 2010, 2885–2909
Downloaded By: [Northern Arizona University] At: 21:20 23 July 2010
establishment (Castro et al. 2003). Reforestation plays an important role in biomass
production and carbon fixation in addition to restoration of degraded landscapes
(Lamb et al. 2005). In the absence of extensive ground data, remotely sensed
information is needed for characterizing forest conditions important to national
and international environmental agreements and monitoring programs (UNEP1992, UNFCCC 1994).
Classification methods to determine differing rainforest types are continually
sought after to assess their potential to store carbon and recover forest habitat over
large areas (Vieira et al. 2004). Central to this effort is estimating the extent to which
floristic detail and structural features can be determined at the spatial and spectral
resolution of remote sensing systems (Kerr and Ostovsky 2003). Neotropical rain-
forest types are typically characterized by physiognomic distinctiveness and macro-
climatic conditions (Holdridge 1967, UNESCO 1973) at scales many times morecoarse than local floristic variation (Tuomisto et al. 1995).
Tropical studies reveal that terrain and soil characteristics influence forest compo-
sition at patch scales from a few hundred metres to several square kilometres in size
(Tuomisto et al. 1995, Phillips et al. 2003). Clark et al. (1999) report that topography
and soil drainage conditions affect the spatial distribution for as many as 30% of
rainforest tree and palm species. Disturbance, dispersal limitations and biogeogra-
phically dependent factors may also influence rainforest composition and beta-
diversity (Condit 1996, Condit et al. 2002). The amount of variation in rainforestcomposition that is explained by environmental or random factors remains difficult to
quantify (Duivenvoorden et al. 2002, Ruokolainen and Tuomisto 2002). These con-
straints pose practical limits for predicting the spatial distribution of tropical forest
types from field data or models of potential vegetation (Condit 1996).
Alternatively, multispectral satellite images provide a means of measuring existing
rainforest beta-diversity that has been linked to differences in forest composition and
structure (Tuomisto 1998, Lu et al. 2003a, 2003b). The Landsat program’s long-term
archives cover most humid tropical forests and are easy to obtain relative to otherenvironmental data. Investigations at broad spatial scales confirm accurate discrimi-
nation among rainforest types using Landsat imagery, though often for highly con-
trasting structural types such as broad-leaf forest, palm swamps, bamboo and
savannas (Hill and Foody 1994, Foody and Hill 1996, Lobo and Gullison 1998,
Nagendra and Gadgil 1999, Pedroni 2003) or distinctive vegetation on poor fertility
soils (Tuomisto et al. 1995).
Amazonian studies have demonstrated that previously unrecognized rainforest
types show a statistically significant relationship with Landsat Thematic Mapper(TM) and Enhanced Thematic Mapper (ETMþ) spectral bands (Tuomisto et al.
2003a, Salovaara et al. 2005). Tuomisto et al. (2003b) report that vegetation associa-
tions derived from indicator plants were significantly correlated with soil factors and
TM bands in the near-(NIR) and mid-infrared (MIR) spectral regions. Salovaara
et al. (2005) further verify relationships between understorey ferns and related species,
soil conditions and spectral reflectance. Chust et al. (2006) found a significant corre-
lation between overstorey tree species composition measured from Panamanian forest
plots and Landsat TM bands. However, comparisons were made from a dry seasonimage enhancing differences related to deciduousness. Temperate and tropical studies
have demonstrated that seasonal climate patterns affecting plant phenology can be
exploited to enhance discrimination between vegetation types with Landsat data
(Townsend and Walsh 2001, Thenkabail et al. 2003).
2886 S. E. Sesnie et al.
Downloaded By: [Northern Arizona University] At: 21:20 23 July 2010
The level of spectral separability between upland forest types in areas with con-
sistently high rainfall is less well known. Few studies have focused directly on broad-
leaf evergreen rainforest to determine the linkage between canopy tree composition
and spectral reflectance from Landsat bands. Canopy trees provide most of the
reflected electromagnetic radiation obtained from optical remote sensing instruments(Tuomisto et al. 2003b). Moreover, advanced machine learning algorithms such as
support vector machines (SVM; Cortes and Vapnik 1995) and Random Forest
decision trees (RF; Breiman 2001) have not been widely applied for discriminating
tropical forest types. Recent comparisons suggest that non-parametric machine learn-
ing classifiers are superior to parametric methods for land cover classification (Boyd
et al. 2006, Sanchez-Hernandez et al. 2007).
For this study, we sought to identify the degree to which differences in canopy tree
composition and structure are linked to spectral reflectance. Our objectives were (1) toderive old-growth forest types from a multivariate analysis of forest plots and tree
species data; and (2) to assess the spectral ‘separability’ or ability to statistically
discriminate among forest types. Rainforest types derived from forest plots were
compared with spectral reflectance and vegetation indices from Landsat TM bands.
The separabilty for palm dominated swamps, tree plantations and secondary forest
re-growth structural types were also compared because of their importance to forest
management, carbon cycling and biodiversity (Castro et al. 2003). A third objective
was to determine classification accuracy for all forest types using SVMs. SVMclassifiers, detailed in §2, provide a robust mechanism to integrate field observations
with spectral and spatial predictors for discriminating diverse land cover types
(Huang et al. 2002, Pal 2005, Pal and Mather 2005, Boyd et al. 2006). Classification
accuracy of SVMs were compared to RF decision trees as each of the two classifiers
are known to be effective with sparse training data (Ham et al. 2005, Gislason et al.
2006) that is typical for tropical vegetation.
2. Data and methods
2.1 Study area
The study area covers the 3000 km2 San Juan–La Selva portion of the Mesoamerican
Biological Corridor (figure 1). Land cover is comprised of privately owned forest
remnants and farmland that connect protected areas in Costa Rica’s CentralMountain Range to lowland rainforest in south-eastern Nicaragua. Rapid land use
change in the Corridor area since the1950s has created mixed forest composition and
structural types (Butterfield 1994). Much of the original forest outside the Corridor
has been converted to pastures, tree plantations and crop lands (Sesnie et al. 2008).
Retaining forest types representative of the region’s floristic diversity and restoring
forest on degraded lands are essential parts of the Corridor initiative (Chassot and
Monge 2002). National programs to establish tree plantations and protect native
forest are aimed at providing environmental services such as carbon fixation,watershed protection and biodiversity (Snider et al. 2003). Costa Rica’s proposal to
sell carbon fixation services to the world market and protect forest habitats (Chomitz
et al. 1999) suggests that spatial data on the status forest types is imperative.
Forest vegetation examined with this study cover three life zones and two transi-
tional zones based on the Holdridge system (Holdridge 1967). Forest environments
were termed humid lowlands (, 300 m), foothills (300–800 m) and premontane
(800–1200 m) systems for discussion purposes. Annual rainfall observed from weather
Multispectral separability of rainforest types 2887
Downloaded By: [Northern Arizona University] At: 21:20 23 July 2010
station data averages 4000 mm per year, though precipitation and temperature vary
with elevation and distance from the Caribbean coast. Monthly precipitation is
typically between 150 mm and 400 mm with drier periods of , 100 mm of rainfall
occurring for one or two months per year in the western part of the study area. Daily
temperatures average as low as 16�C above 2000 m elevation and 26�C at La SelvaBiological Station at 30 m elevation (Sanford et al. 1994). Terrain conditions that
affect soil drainage and slope stability are also known to influence forest vegetation in
the study area (Clark et al. 1999). Topography varies between lowland alluvial flood
plains, terraces and low hills to mountain slopes intersected by steep ravines. Soils are
generally acidic (pH , 4.5), low fertility ultisols and inceptisols of late Tertiary and
Quaternary origin (Sollins et al. 1994).
2.2 Forest plots
Tree species composition was measured in old-growth forest remnants between
January and May 2003 and 2004. An adaptation of gradient-directed sampling by
Sandmann and Lertzmann (2003) was used to select plot locations. Tree species
composition in the study area has been shown to vary along precipitation, tempera-ture and elevation gradients at a landscape scale (100–10 000 km2) (Lieberman et al.
1996). Soil nutrient status and physical properties have also been shown to vary with
elevation for the study area, contributing to forest composition and structural differ-
ences (Sesnie et al. 2009).
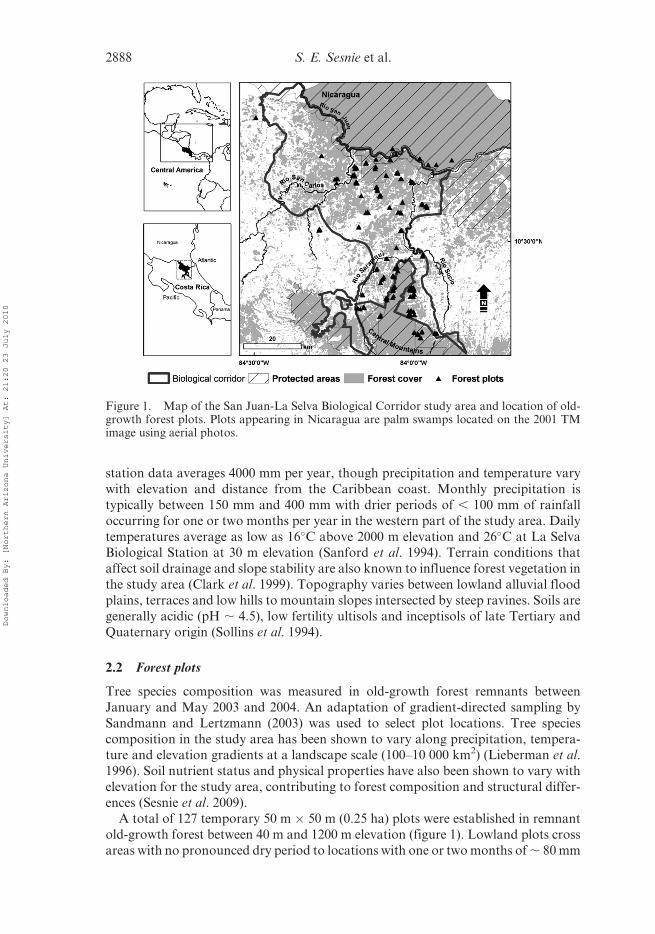
A total of 127 temporary 50 m � 50 m (0.25 ha) plots were established in remnant
old-growth forest between 40 m and 1200 m elevation (figure 1). Lowland plots cross
areas with no pronounced dry period to locations with one or two months of , 80 mm
Figure 1. Map of the San Juan-La Selva Biological Corridor study area and location of old-growth forest plots. Plots appearing in Nicaragua are palm swamps located on the 2001 TMimage using aerial photos.
2888 S. E. Sesnie et al.
Downloaded By: [Northern Arizona University] At: 21:20 23 July 2010
rainfall near the San Carlos River. Two to five plots were established in forest
remnants at a minimum distance of 150 m from a forest edge and 300 m between
plots following a compass bearing from an accessible point. At each plot, a tree species
name and diameter at breast height (dbh ¼ 1.37 m above the base) were recorded for
all trees� 30 cm dbh and palms and ferns� 10 cm dbh. Tree species identification wasconducted on site by individuals trained to identify a large number of species in the
study area. Unidentified trees were tagged for later identification by a local expert or
foliage samples were identified by Nelson Zamora at the National Biodiversity
Institute (INBio) herbarium in San Jose, Costa Rica.
In addition, 17 old-growth forest plots in the lowlands were also included from 50 m
� 50 m (0.25 ha) or 100 � 100 m (1.0 ha) permanent plots, with dbh and full tree
species identification. Therefore, a total of 144 old-growth forest plots were used with
the analyses discussed below. Plots were georeferenced in the field from a canopyopening inside the sampling area with a minimum dilution of precision , 6 (, 12 m
horizontal accuracy).
Palm swamps dominated by Rafia taedigera (Ra, n¼ 11) were georeferenced in the
field with a global positioning system (GPS) or geolocated on a TM image using
1:40 000 false-colour infrared aerial photos from 2003. Only palm swamps . 5 ha
were used that could be visually discriminated from other forest types with aerial
imagery.
Young secondary forest regrowth (Rg, n ¼ 73) and reforested areas of primarilysingle tree species plantations (Pl, n ¼ 67) were georeferenced in the field between
January and May of 2004. A majority of secondary forests in the study areas are , 20
years old on abandoned agricultural lands (Read et al. 2001). Only general informa-
tion was collected for regrowth forests and tree plantations noting dominant tree
species for stands . 2 ha in size.
2.3 Image correction and spectral data
A 14 January 2001 Landsat TM image, World Reference System path 15 and row 53,
was used as the most recent and relatively cloud free image available for the study
area. The 2001 image date was closest to the time of field sampling which was
conducted in areas not affected by disturbance between the image date and vegetation
sampling. Image geometric and radiometric corrections were completed using ENVI
4.3 image processing software (ITT Industries Inc. 2006). To ensure location accuracy
between forest plots and multispectral data, the 2001 TM image was co-registered to a
1996 TM image previously corrected from ground control points collected in the fieldby Pedroni (2003). A nearest neighbour resampling method and 2nd order polynomial
was used for image rectification with a root mean squared error of 2.2 m. Location
accuracy was estimated at less than one half pixel width (15 m) from control points
taken along highways and road intersections with a Trimble GeoXT GPS.
TM bands 1–5 and 7 were converted to top-of-atmosphere reflectance using stan-
dard calibration coefficients (Chander and Markham 2003). The thermal infrared
band 6 was not used because of its larger pixel size (120 m) relative to other TM bands
(30 m). Radiometric characteristics were assessed for atmospheric scattering in eachband using histograms. A minor adjustment to reflectance values offset from zero in
the visible wavelengths (TM 1, 2 and 3) was made using dark object subtraction from
spectra taken from deep water bodies (Jensen 1996). Irregular ‘striping’ visibly present
in TM bands 1, 2 and 3 was corrected using a minimum noise fraction (MNF)
Multispectral separability of rainforest types 2889
Downloaded By: [Northern Arizona University] At: 21:20 23 July 2010
transformation to reduce sensor noise (Green et al. 1988). An MNF transformation
uses a principal components rotation of the spectral data to segregate coherent data
from noise into separate channels. An inverse transformation with noise free MNF
channels was used to restore TM bands to their original image space with the striping
removed.Spectral vegetation indices were used to enhance separability among forest types.
Vegetation indices are commonly applied to characterize physiological and biophy-
sical attributes of vegetation (Gitelson 2004) and reduce the impact of local topogra-
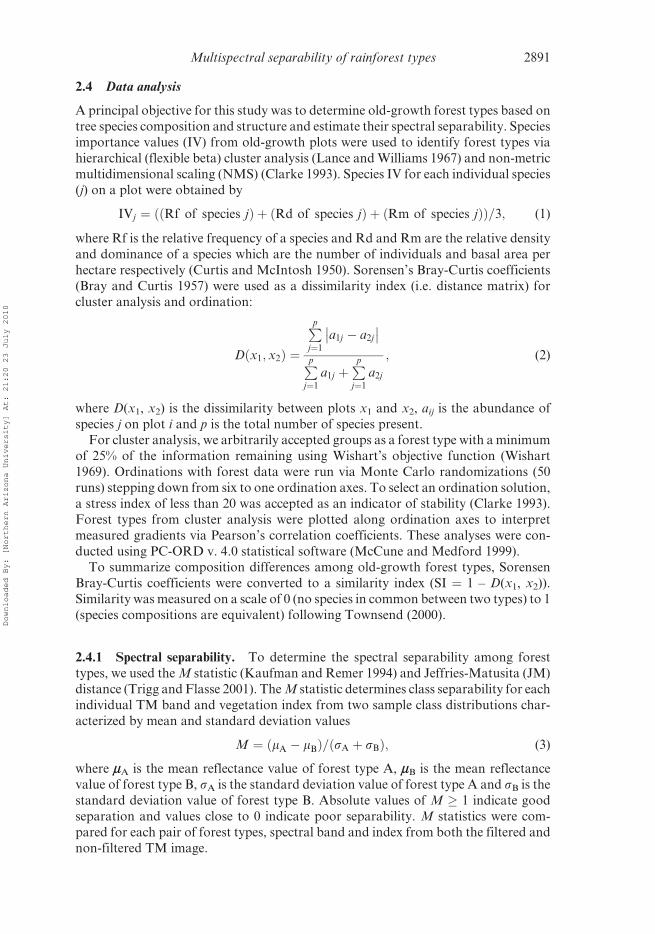
phy on spectral reflectance (Jensen 2000). The normalized difference vegetation index
(NDVI) combines the red (TM 3) and NIR (TM 4) wavelengths (table 1) to distin-
guish differences in plant biomass and leaf area (Jensen 2000). We used an adaptation
of NDVI adding TM5 (MIR) in place of TM4 (table 1) which potentially improves
sensitivity to differences in rainforest canopy reflectance and plant moisture (Lu et al.2004). Enhanced Vegetation Index (EVI) (Huete and Justice 1999) and Wide
Dynamic Range Vegetation Index (WDRVI) (Gitelson 2004) were also used to extend
the spectral dynamic range of indices that can reach maximum values in high biomass
conditions (Gitelson 2004). Indices were compared with separability analyses and
used to aid discrimination of forest types with machine learning classifiers.
To conduct separability comparisons, reflectance values for TM bands and spectral
indices were taken from forest plot locations. Prior to extracting sample pixels, a
texture occurrence filter was used to calculate the weighted mean reflectance for eachplot location and TM band within a 3 � 3 pixel window. An image filter was used to
smooth abrupt changes in spectral reflectance caused by canopy shade and other low
frequency noise (Hill 1999) and adjust for image rectification errors. Comparisons
were made with pixels from both filtered and non-filtered TM bands to assess impacts
on spectral separability of forest types.
For model runs with SVM and RF classifiers, training and validation pixels were
taken from plot locations, using 75–450 pixels to represent each forest type. Variation
in the quantity of pixels reflects the number of plots for each forest type and a fewplots that were eliminated because of terrain and shadow effects. For training runs,
each pixel characterized by forest type was randomly selected from the dataset (two-
thirds of pixels) and a set of validation pixels (one-third of pixels) was set aside
without replacement to estimate the prediction accuracy of each classifier.
Table 1. Vegetation indices derived from Landsat TM bands. Equation symbols and coefficientvalues are: rRed, rNIR, and rMID5 are reflectance values in the red, near-infrared and mid-infraredspectral regions respectively, P denotes reflectances with partial atmospheric correction, a¼ 0.20,
� ¼ 1.0, C1¼ 6.0, C2 ¼ 7.5 and L ¼ 1.0 from the references provided.
Vegetation index Equation Reference
Normalized Difference VegetationIndex
NDVI ¼ rNIR�rRed
rNIRþrRedRouse et al. (1974)
Normalized Difference 53 ND53 ¼ rMID5�rRed
rMID5þrRedLu et al. (2004)
Wide Dynamic Range VegetationIndex
WDRVI ¼ arNIR�rRed
arNIRþrRedGitelson (2004)
Enhanced Vegetation Index EVI ¼ PNIR�PRed
PNIRþC1PRed�C2PBlueþLð1þ LÞ Huete and Justice
(1999)
2890 S. E. Sesnie et al.
Downloaded By: [Northern Arizona University] At: 21:20 23 July 2010
2.4 Data analysis
A principal objective for this study was to determine old-growth forest types based on
tree species composition and structure and estimate their spectral separability. Species
importance values (IV) from old-growth plots were used to identify forest types via
hierarchical (flexible beta) cluster analysis (Lance and Williams 1967) and non-metric
multidimensional scaling (NMS) (Clarke 1993). Species IV for each individual species
(j) on a plot were obtained by
IVj ¼ ððRf of species jÞ þ ðRd of species jÞ þ ðRm of species jÞÞ=3; (1)
where Rf is the relative frequency of a species and Rd and Rm are the relative density
and dominance of a species which are the number of individuals and basal area per
hectare respectively (Curtis and McIntosh 1950). Sorensen’s Bray-Curtis coefficients
(Bray and Curtis 1957) were used as a dissimilarity index (i.e. distance matrix) for
cluster analysis and ordination:
Dðx1; x2Þ ¼
Ppj¼1
a1j � a2j
�� ��Ppj¼1
a1j þPpj¼1
a2j
; (2)
where D(x1, x2) is the dissimilarity between plots x1 and x2, aij is the abundance of
species j on plot i and p is the total number of species present.For cluster analysis, we arbitrarily accepted groups as a forest type with a minimum
of 25% of the information remaining using Wishart’s objective function (Wishart
1969). Ordinations with forest data were run via Monte Carlo randomizations (50
runs) stepping down from six to one ordination axes. To select an ordination solution,
a stress index of less than 20 was accepted as an indicator of stability (Clarke 1993).
Forest types from cluster analysis were plotted along ordination axes to interpret
measured gradients via Pearson’s correlation coefficients. These analyses were con-
ducted using PC-ORD v. 4.0 statistical software (McCune and Medford 1999).To summarize composition differences among old-growth forest types, Sorensen
Bray-Curtis coefficients were converted to a similarity index (SI ¼ 1 – D(x1, x2)).
Similarity was measured on a scale of 0 (no species in common between two types) to 1
(species compositions are equivalent) following Townsend (2000).
2.4.1 Spectral separability. To determine the spectral separability among forest
types, we used the M statistic (Kaufman and Remer 1994) and Jeffries-Matusita (JM)
distance (Trigg and Flasse 2001). The M statistic determines class separability for each
individual TM band and vegetation index from two sample class distributions char-
acterized by mean and standard deviation values
M ¼ ðmA � mBÞ=ðsA þ sBÞ; (3)
where mA is the mean reflectance value of forest type A, mB is the mean reflectance
value of forest type B, sA is the standard deviation value of forest type A and sB is the
standard deviation value of forest type B. Absolute values of M � 1 indicate good
separation and values close to 0 indicate poor separability. M statistics were com-
pared for each pair of forest types, spectral band and index from both the filtered and
non-filtered TM image.
Multispectral separability of rainforest types 2891
Downloaded By: [Northern Arizona University] At: 21:20 23 July 2010
JM distance evaluates spectral separability of class samples with two or more
spectral bands (Trigg and Flasse 2001). JM distance for two classes u and b is given by
JMub ¼ffiffiffiffiffiffiffiffiffiffiffiffiffiffiffiffiffiffiffiffiffiffiffiffiffiffiffiffiffiffi2ð1� expð�aÞ
p: (4)
and
a ¼ 1
8ðmu � mbÞ
T Cu þ Cb
2
� ��1
ðmu � mbÞ þ1
2ln
12
Cu þ Cbj jffiffiffiffiffiffiffiffiffiffiffiffiffiffiffiffiffiCuj j Cbj j
p" #
(5)
which is to assess multivariate spectral separability among forest types using all bands
simultaneously, mu and mb are mean values for classes u and b, Cu and Cb are the
covariance matrices for classes a and b, and T denotes the transpose of a vector. JMdistance provides an index between 0 and 2 where large values indicate well-separated
categories. Forest types showing a JM distance . 1.7 were considered well separated
(ITT Industries Inc. 2006).
2.4.2 Machine learning classifiers. Our objective was to classify forest types whichare likely to show minor differences in spectral reflectance at the resolution of Landsat
TM data. SVMs are based on statistical learning theory that optimizes separating
boundaries between two class samples, a procedure that has shown to exceed accura-
cies of maximum likelihood and artificial neural networks (Pal and Mather 2005,
Boyd et al. 2006, Sanchez-Hernandez et al. 2007).
SVMs iteratively locate multiple linear, or potentially nonlinear, decision bound-
aries between individual training to discriminate class samples via a variety of kernel
methods (Bennett and Campbell 2000). A separating hyper-plane that maximizes themargin between support vectors is selected for classifying unseen cases. Kernel
methods take on several forms, though polynomial and radial basis functions
(RBF) have shown good results for land cover classification with remotely sensed
data (Huang et al. 2002, Pal and Mather 2005). For this study, RBF was chosen for
classification with the form
exp �� u� vj j2� �
; (6)
where u and v are two points from mapping features with parameter setting gamma (�)
which is (1/(data dimension)) by default. An additional parameter is cost C that is apenalty factor for misclassified samples. We applied a tuning algorithm for RBF that
iteratively combined � and C within a range of values to estimate error using all forest
type pixels. Tuning was implemented systematically by using three combinations of �(0.5, 1.0 and 2.0) and C values, starting with 4 and doubling its value five times for a
total of 18 parameter combinations. Parameter settings with the lowest error rate were
used to train SVM models that were tested for accuracy with validation data. SVMs
were originally limited to solving two-class problems; however, we used a ‘one against
one’ approach for discriminating multiple classes (Pal and Mather 2005).SVM and RF classification trees were run using equivalent training and validation
pixels. RF implements multiple classification trees similar using bootstrap training
samples from approximately two-thirds of the data, with the classifier h described as
{h(x,Qk), k ¼ 1, . . .,} where the {Qk} are independent identically distributed random
vectors and x is the input pattern (Breiman 2001). Class sample data left out of the
training process (one-third) is predicted at each model iteration to evaluate classifica-
tion accuracy. Accuracies from independently derived trees are aggregated to estimate
2892 S. E. Sesnie et al.
Downloaded By: [Northern Arizona University] At: 21:20 23 July 2010
an overall error rate, a process known as bootstrap aggregation or ‘bagging’ (Breiman
2001). Each tree casts a unit vote for the most popular class at input x and a simple
majority vote is used for prediction.
RF trees were considered a valid comparison to SVM as they are not subject to
overfitting (Breiman 2001) and often out-perform other tree based classifiers (Hamet al. 2005, Gislason et al. 2006). Pal (2005) found that SVM produced equally high
accuracies as with RF to classify agricultural land cover types using ETMþ spectral
bands. Parameter settings for the RF classifier are the number of trees grown and
subset of variables selected at each node. We used 1000 trees and a variable subset of
two, as further adjustments typically show little gain in accuracy (Gislason et al.
2006). RF and SVM classifiers were run using the R statistics package v. 2.5.1
(R Foundation for Statistical Computing, Vienna, Austria).
Non-parametric SVM and RF classifiers are also flexible for including continuousvariables without making distributional assumptions about the data. Plot elevation
from a 90-m digital elevation model from the Shutter Radar and Topography Mission
(SRTM-DEM; see http://seamless.usgs.gov/) was added with separate model runs as
elevation is known to be important for classifying rainforest types (Salovaara et al.
2005, Chust et al. 2006, Sesnie et al. 2008). SRTM-DEM data were resampled to a 30-
m pixel resolution and spatially aligned with Landsat TM pixels using ENVI 4.3. The
spatial alignment of elevation and TM pixels was determined to be highly accurate by
visually comparing interpolated 20-m contours with terrain features (e.g. ridge tops,drainages and swamps) in the 2001 TM image. Error matrices were used to quantify
overall per cent agreement and producer’s and user’s accuracy for each forest type and
classifier (c.f. Congalton and Green 1999).
3. Results
3.1 Old-growth forest types
From old-growth forest plots, 462 tree species were identified, 95% to genus and 91% to
the species level. Tree species encountered on more than one plot, 203 species, were used to
derive forest types with multivariate analyses. Trees without a species name were given a
number based on similar taxonomic features for analyses. A cluster analysis of forest plots
resulted in nine forest types from selecting groups with 25% or more information remain-
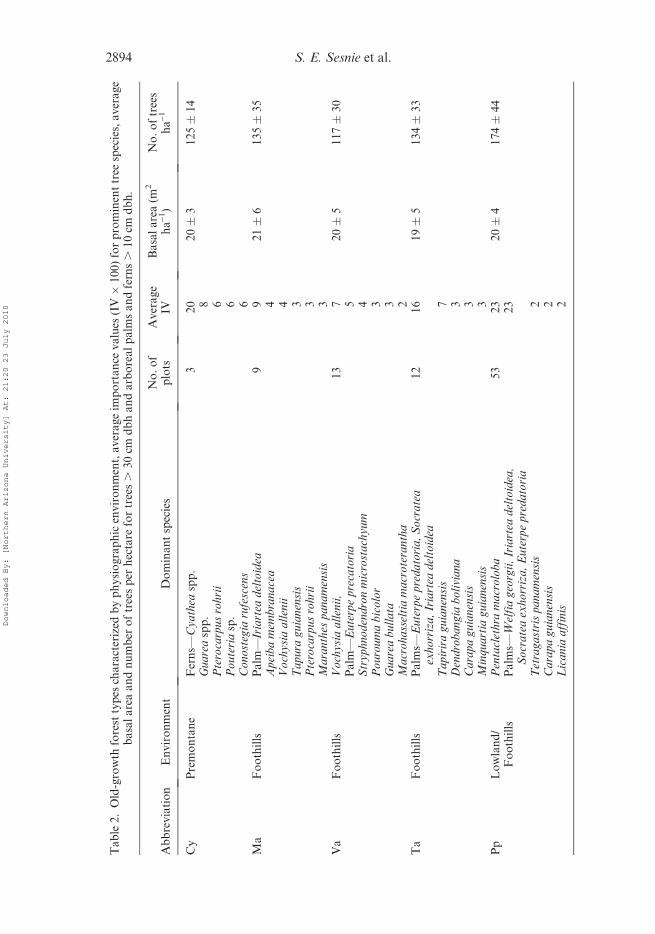
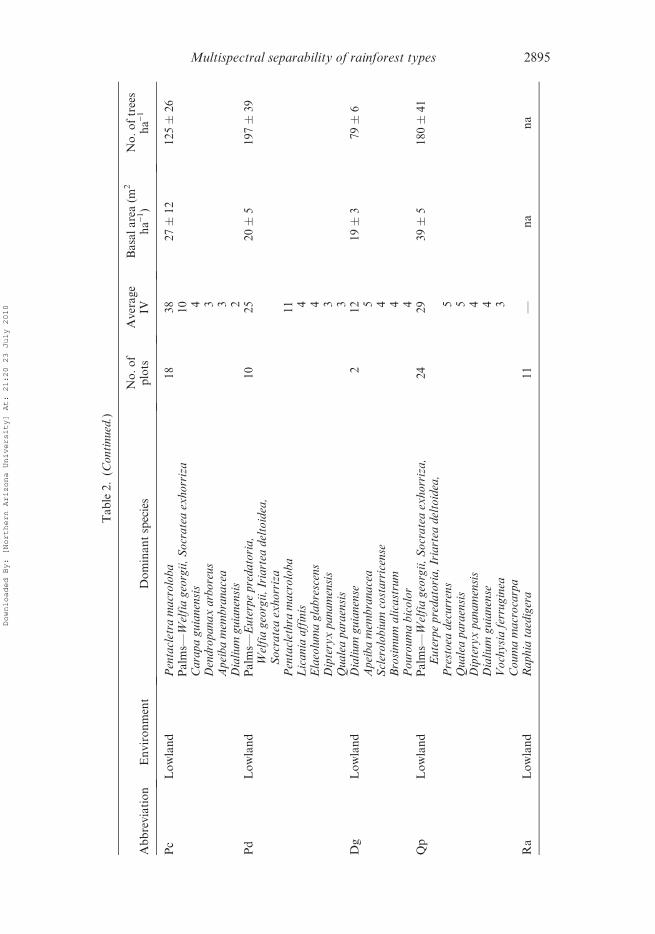
ing in the cluster dendrogram (data not shown). Each forest type was characterized by treespecies with the greatest average importance and forest structural features (table 2).
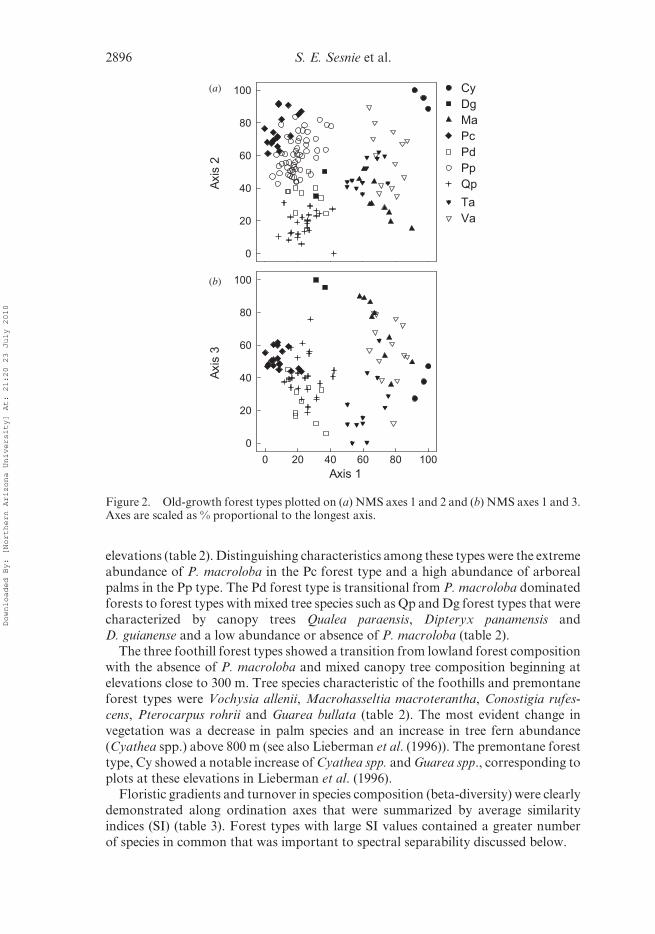
Ordination of plots and species resulted in a three-dimensional solution with a final
average stress level of 17.4 (p¼ 0.024). Axis 1 explained 44% of the variation and axes
2 and 3 explained an additional 38% of the variance, totalling 82% of the variance
explained by the ordination. Plot elevations were highly and positively correlated with
axis 1 (R ¼ 0.87). Forest plots from lowland forest types are aligned to the left along
axis 1 and foothills and premontane forest types to the right (figures 2(a) and 2(b)).
Forest plots descending axis 2 show a strong correlation with driest month precipita-tion (R ¼ 0.50) and total annual precipitation (R ¼ 0.36), taken from WorldClim 1-
km digital bioclimatic grids (Hijmans et al. 2005). Axis 3 indicates two plots where
axis values approach 100 that are the Dg forest type dominated by Dialum guianense
(figure 2(b)). These forests are located in the western part of the study area with
relatively low precipitation (, 80 cm) during the month of March.
Three lowland forest types were characterized by a decreasing abundance of
Pentaclethra macroloba, a mid- to upper-canopy tree species common at low
Multispectral separability of rainforest types 2893
Downloaded By: [Northern Arizona University] At: 21:20 23 July 2010
Ta
ble
2.
Old
-gro
wth
fore
stty
pes
cha
ract
eriz
edb
yp
hy
sio
gra
ph
icen
vir
on
men
t,a
ver
ag
eim
po
rta
nce
va
lues
(IV�
10
0)
for
pro
min
ent
tree
spec
ies,
av
era
ge
ba
sal
are
aa
nd
nu
mb
ero
ftr
ees
per
hec
tare
for
tree
s.
30
cmd
bh
an
da
rbo
rea
lp
alm
sa
nd
fern
s.
10
cmd
bh
.
Ab
bre
via
tio
nE
nv
iro
nm
ent
Do
min
an
tsp
ecie
sN
o.
of
plo
tsA
ver
ag
eIV
Ba
sal
are
a(m
2
ha
-1)
No
.o
ftr
ees
ha
-1
Cy
Pre
mo
nta
ne
Fer
ns—
Cy
ath
easp
p.
32
02
0�
31
25�
14
Gu
are
asp
p.
8P
tero
carp
us
roh
rii
6P
ou
teri
asp
.6
Co
no
steg
iaru
fesc
ens
6M
aF
oo
thil
lsP
alm
—Ir
iart
ead
elto
idea
99
21�
61
35�
35
Ap
eib
am
emb
ran
ace
a4
Vo
chy
sia
all
enii
4T
ap
ura
gu
ian
ensi
s3
Pte
roca
rpu
sro
hri
i3
Ma
ran
thes
pa
na
men
sis
3V
aF
oo
thil
lsV
och
ysi
aa
llen
ii,
13
72
0�
51
17�
30
Pa
lm—
Eu
terp
ep
reca
tori
a5
Str
yp
hn
od
end
ron
mic
rost
ach
yu
m4
Po
uro
um
ab
ico
lor
3G
ua
rea
bu
lla
ta3
Ma
cro
ha
ssel
tia
ma
cro
tera
nth
a2
Ta
Fo
oth
ills
Pa
lms—
Eu
terp
ep
red
ato
ria
,S
ocr
ate
aex
horr
iza,
Iria
rtea
del
toid
ea1
21
61
9�
51
34�
33
Ta
pir
ira
gu
ian
ensi
s7
Den
dro
ba
ng
iab
oli
via
na
3C
ara
pa
gu
ian
ensi
s3
Min
qu
art
iag
uia
nen
sis
3P
pL
ow
lan
d/
Fo
oth
ills
Pen
tacl
eth
ram
acr
olo
ba
53
23
20�
41
74�
44
Pa
lms—
Wel
fia
geo
rgii
,Ir
iart
ead
elto
idea
,S
ocr
ate
aex
ho
rriz
a,
Eu
terp
ep
red
ato
ria
23
Tet
rag
ast
ris
pa
na
men
sis
2C
ara
pa
gu
ian
ensi
s2
Lic
an
iaa
ffin
is2
2894 S. E. Sesnie et al.
Downloaded By: [Northern Arizona University] At: 21:20 23 July 2010
Ta
ble
2.
(Co
nti
nu
ed.)
Ab
bre
via
tio
nE
nv
iro
nm
ent
Do
min
an
tsp
ecie
sN
o.
of
plo
tsA
ver
ag
eIV
Ba
sal
are
a(m
2
ha
-1)
No
.o
ftr
ees
ha
-1
Pc
Lo
wla
nd
Pen
tacl
etra
ma
cro
lob
a1
83
82
7�
12
12
5�
26
Pa
lms—
Wel
fia
geo
rgii
,S
ocr
ate
aex
ho
rriz
a1
0C
ara
pa
gu
ian
ensi
s4
Den
dro
pa
na
xa
rbo
reu
s3
Ap
eib
am
emb
ran
ace
a3
Dia
liu
mg
uia
nen
sis
2P
dL
ow
lan
dP
alm
s—E
ute
rpe
pre
da
tori
a,
Wel
fia
geo
rgii
,Ir
iart
ead
elto
idea
,S
ocr
ate
aex
ho
rriz
a
10
25
20�
51
97�
39
Pen
tacl
eth
ram
acr
olo
ba
11
Lic
an
iaa
ffin
is4
Ela
eolu
ma
gla
bre
scen
s4
Dip
tery
xp
an
am
ensi
s3
Qu
ale
ap
ara
ensi
s3
Dg
Lo
wla
nd
Dia
liu
mg
uia
nen
se2
12
19�
37
9�
6A
pei
ba
mem
bra
na
cea
5S
cler
olo
biu
mco
sta
rric
ense
4B
rosi
mu
ma
lica
stru
m4
Po
uro
um
ab
ico
lor
4Q
pL
ow
lan
dP
alm
s—W
elfi
ag
eorg
ii,
So
cra
tea
exh
orr
iza
,E
ute
rpe
pre
da
tori
a,
Iria
rtea
del
toid
ea,
24
29
39�
51
80�
41
Pre
sto
ead
ecu
rren
s5
Qu
ale
ap
ara
ensi
s5
Dip
tery
xp
an
am
ensi
s4
Dia
liu
mg
uia
nen
se4
Vo
chy
sia
ferr
ug
inea
3C
ou
ma
ma
cro
carp
aR
aL
ow
lan
dR
ap
hia
taed
iger
a1
1—
na
na
Multispectral separability of rainforest types 2895
Downloaded By: [Northern Arizona University] At: 21:20 23 July 2010
elevations (table 2). Distinguishing characteristics among these types were the extreme
abundance of P. macroloba in the Pc forest type and a high abundance of arboreal
palms in the Pp type. The Pd forest type is transitional from P. macroloba dominated
forests to forest types with mixed tree species such as Qp and Dg forest types that were
characterized by canopy trees Qualea paraensis, Dipteryx panamensis and
D. guianense and a low abundance or absence of P. macroloba (table 2).
The three foothill forest types showed a transition from lowland forest compositionwith the absence of P. macroloba and mixed canopy tree composition beginning at
elevations close to 300 m. Tree species characteristic of the foothills and premontane
forest types were Vochysia allenii, Macrohasseltia macroterantha, Conostigia rufes-
cens, Pterocarpus rohrii and Guarea bullata (table 2). The most evident change in
vegetation was a decrease in palm species and an increase in tree fern abundance
(Cyathea spp.) above 800 m (see also Lieberman et al. (1996)). The premontane forest
type, Cy showed a notable increase of Cyathea spp. and Guarea spp., corresponding to
plots at these elevations in Lieberman et al. (1996).Floristic gradients and turnover in species composition (beta-diversity) were clearly
demonstrated along ordination axes that were summarized by average similarity
indices (SI) (table 3). Forest types with large SI values contained a greater number
of species in common that was important to spectral separability discussed below.
(a)
(b)
Axis
2
0
20
40
60
80
100 Cy
Dg
Ma
Pc
Pd
Pp
Qp
Ta
Va
Axis 1
0 20 40 60 80 100
Axis
3
0
20
40
60
80
100
Figure 2. Old-growth forest types plotted on (a) NMS axes 1 and 2 and (b) NMS axes 1 and 3.Axes are scaled as % proportional to the longest axis.
2896 S. E. Sesnie et al.
Downloaded By: [Northern Arizona University] At: 21:20 23 July 2010
3.2 Spectral separability
The M statistic compared each TM band and vegetation indices’ contribution to
spectral separability between 11 forest types for the filtered and non-filtered images.
The Dg forest class, represented by only two plots, was not used for analyses. Imagefiltering increased average M values � 1 by 23% and the number of well-separated
forest types (figures 3(a) and 3(b)). These results are in agreement with other tropical
studies showing improved forest classification accuracies from pre-classification
image filtering (Hill 1999, Salovaara et al. 2005). Further comparisons were con-
ducted with the filtered image.
Landsat bands 1 and 3, the blue and red bands, contributed most substantially to
separability among forest types (figure 3(a)). Approximately 50% of comparisons (n¼55) were well separated from the first three TM bands with lower separability for theNIR and MIR bands. Visible wavelengths are susceptible to atmospheric scattering,
but are also sensitive to differences in plant chlorophyll absorption and forest canopy
structure (Jensen 2000). Of the visible bands, the red band is least susceptible to
scattering and was important to separate forest types (figures 3(a) and 3(b)). These
results differ somewhat from those of Tuomisto et al. (2003b) who found TM bands 4
(NIR) and 5 (MIR) were statistically related to Amazonian forest types; however,
plots from their study were from lowland old-growth forests only. Our data include
contrasting structural types such as palm swamps, regrowth and tree plantations thatdiffered spectrally in the Red and NIR bands.
Indices ND53, WDRVI and NDVI showed similar average M values and number
of well-separated forest types, though EVI performed poorly (figures 3(a) and 3(b)).
ND53 showed a small gain in separability over other indices; however, WDRVI and
NDVI M values were higher for separating reforestation from regrowth types, M ¼0.77 versus M¼ 0.87 and M¼ 0.84 respectively. From JM comparisons, WDRVI and
NDVI increased separability values by as much as 10% for these structural types when
included with TM bands. WDRVI, used to broaden the range of values in highbiomass conditions, did not substantially increase separability above that of NDVI.
NDVI used as a single index primarily discriminated between lowland, foothills and
premontane forest types with low species similarities (tables 3 and 4(a)). However, the
Cy premontane forest type was not spectrally separated from Ma, Ta or Va foothills
types, though species similarity was low (SI ¼ 0.07–0.12). A low number of plots
Table 3. Average tree species similarity between old-growth forest types from Sorensen’s Bray-Curtis dissimilarity coefficient. Similarity index is calculated as SI ¼ 1 – D(x1, x2) with valuesclose to 0 having fewer species in common with another forest type and values closer 1 indicate a
greater number of species are shared between two types.
Type Pc Pp Qp Pd Ma Cy Ta Va Dg
Pc —Pp 0.59 —Qp 0.27 0.51 —Pd 0.36 0.56 0.58 —Ma 0.16 0.26 0.19 0.15 —Cy 0.01 0.02 0.01 0.01 0.13 —Ta 0.28 0.45 0.37 0.36 0.38 0.07 —Va 0.28 0.30 0.22 0.21 0.44 0.12 0.45 —Dg 0.26 0.19 0.19 0.11 0.20 0.03 0.19 0.25 —
Multispectral separability of rainforest types 2897
Downloaded By: [Northern Arizona University] At: 21:20 23 July 2010
sampled for the Cy type (n ¼ 3) potentially explain poor separability observed for
these types. Palm swamps and tree plantations have uniform forest structure and
composition, but were not well separated from a few of the old-growth types with
NDVI (table 4(a)). Dense green tree foliage characteristic of wet tropical environ-
ments likely precludes use of a single vegetation index for discriminating some forest
types, regardless of composition and structural differences.JM distance for TM bands and NDVI resulted in 39 well-separated comparisons
out of 55 with the forest categories (table 4(b)). In general, forest types showing SI .
0.40 were poorly separated (tables 3 and 4(b)), such as forest types dominated by
P. macroloba. These results were not unexpected as forest canopies comprised of
similar tree species are unlikely to be well separated using Landsat bands. More
notably, P. macroloba and mixed composition forest in the lowlands (e.g. Qp) were
well separated. SI was high for lowland forest types in some cases (e.g., Pp versus Qp)
because of a high abundance of arboreal palms occurring in both types (table 2).Floristic differences with respect to principal canopy trees likely enhanced spectral
separability observed for P. macroloba and mixed species forest. Transitional forest
between P. macroloba and mixed compositions (e.g. Pd) were not well separated from
any one lowland old-growth type except for palm swamps (table 4(b)).
(a)
(b)
Mean
M
0.0
0.5
1.0
1.5
2.0
TM image
TM filtered
TM bands & indices
1 2 3 4 5 7 ND53 WDRVI NDVI EVI
Nu
mb
er
of p
airs w
ith
M>
1
0
10
20
30
40
Figure 3. M separability statistic summarized for pair-wise comparisons of 11 forest types (55pairs) with the filtered and non-filtered TM image. Each spectral band and vegetation index issummarized by (a) the mean value of M for each TM band and vegetation index and (b) thenumber of paired comparisons with M � 1.
2898 S. E. Sesnie et al.
Downloaded By: [Northern Arizona University] At: 21:20 23 July 2010
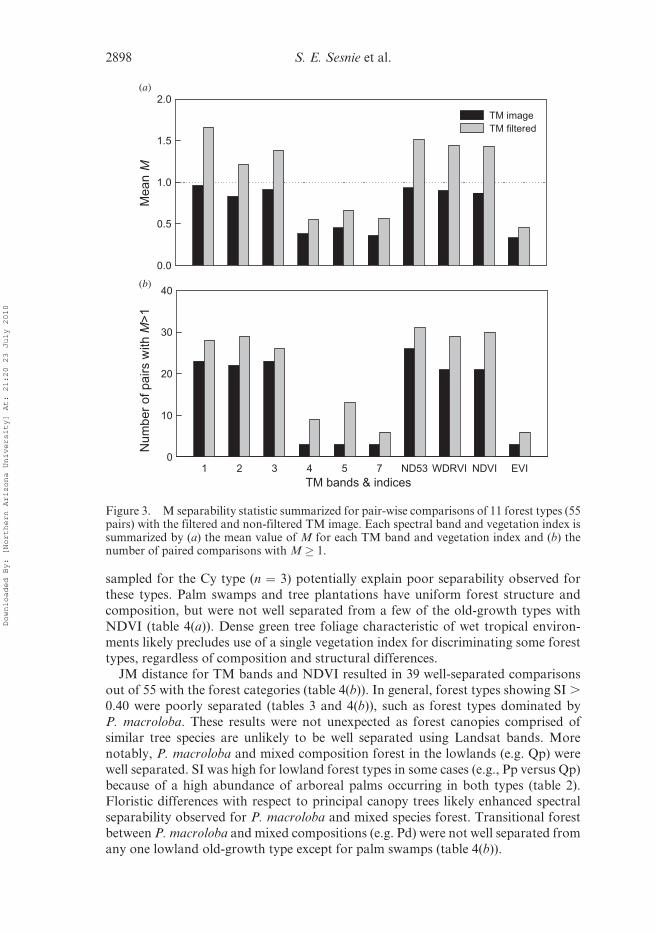
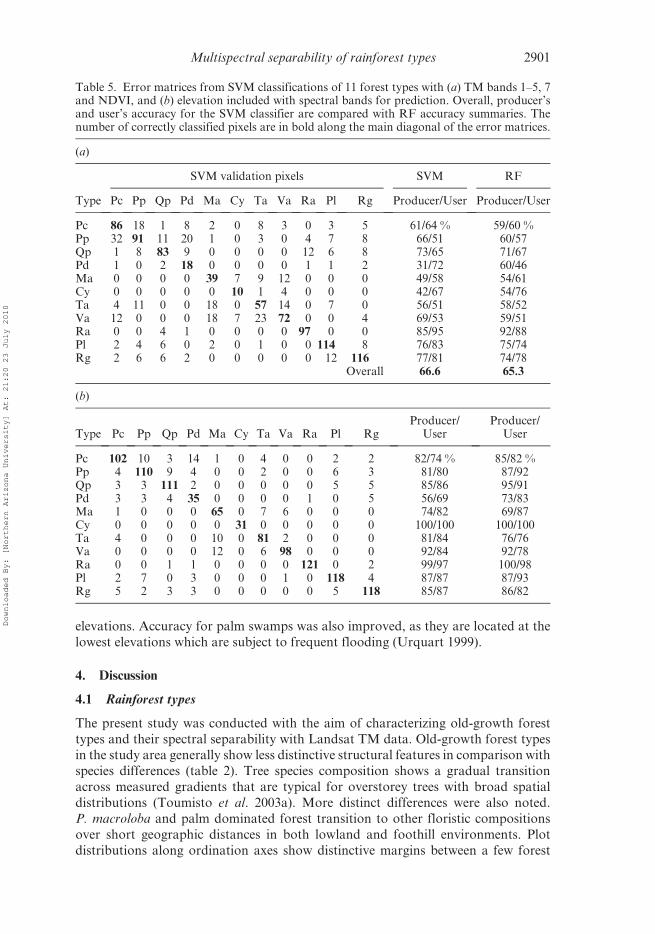
3.3 Classification accuracy
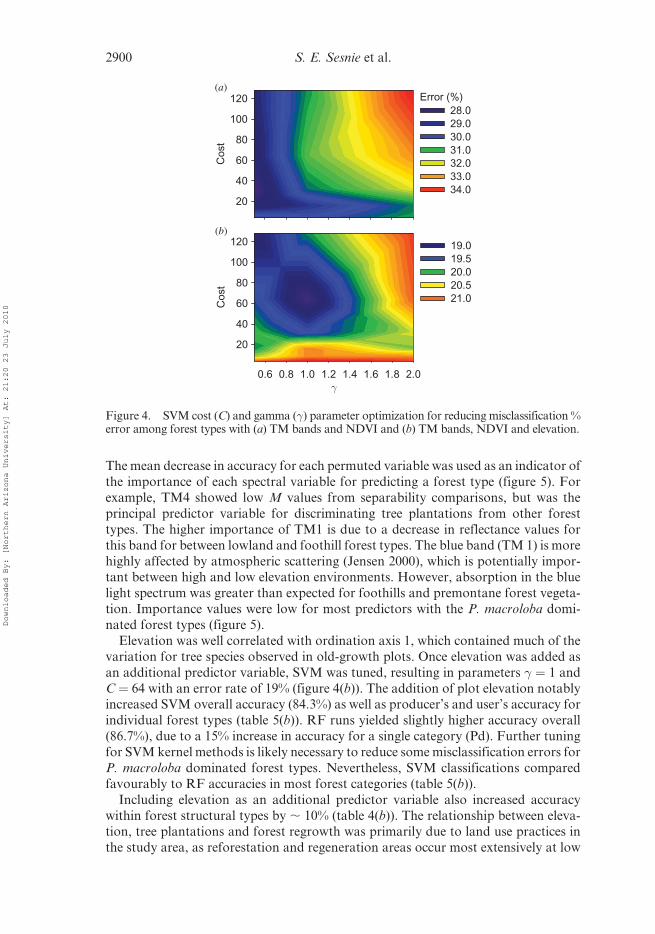
For running the SVM classifier, parameter settings showed the lowest error rate (27%)
with � ¼ 0.05 and C¼ 32 (figure 4(a)). SVM runs with optimized parameters resulted
in an overall accuracy of 66.6% for validation pixels (table 5(a)). RF runs using the
same training and validation pixels showed minor differences in accuracy (65.3%),
indicating that SVM classification results are comparable to other advanced machine
learning algorithms (see also Pal (2005)). Forest types with low spectral separability
and similar tree species composition were confused with one another, producing low
accuracies for most old-growth categories (table 5(a)). Correctly classified pixels wereprincipally among old-growth types showing a large difference in overstorey tree
composition. Classification accuracy was highest for palm swamps, tree plantations
and regrowth types, likely due to greater structural differences between these and old-
growth types.
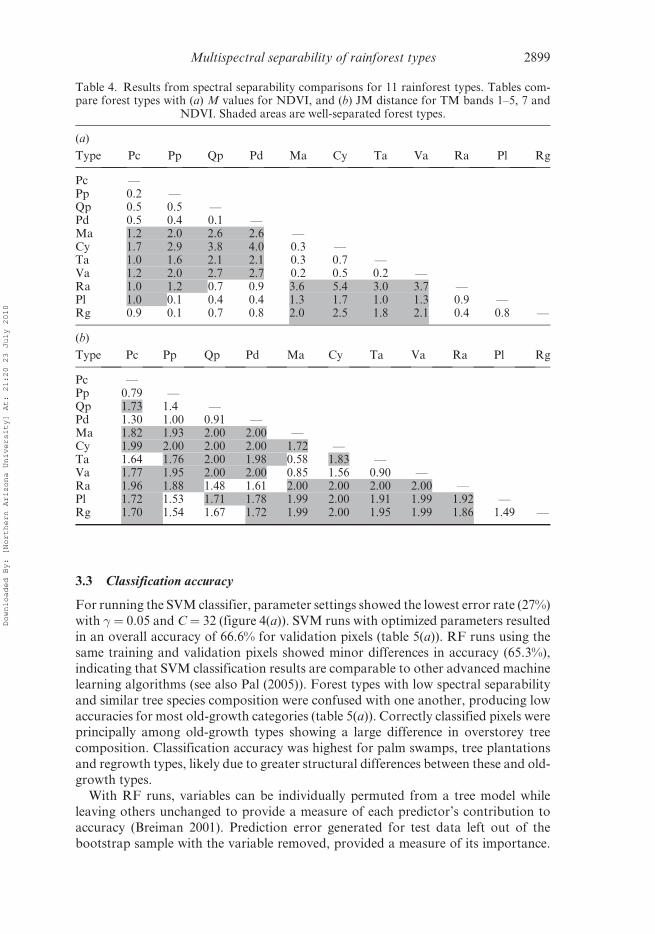
With RF runs, variables can be individually permuted from a tree model while
leaving others unchanged to provide a measure of each predictor’s contribution to
accuracy (Breiman 2001). Prediction error generated for test data left out of the
bootstrap sample with the variable removed, provided a measure of its importance.
Table 4. Results from spectral separability comparisons for 11 rainforest types. Tables com-pare forest types with (a) M values for NDVI, and (b) JM distance for TM bands 1–5, 7 and
NDVI. Shaded areas are well-separated forest types.
(a)
Type Pc Pp Qp Pd Ma Cy Ta Va Ra Pl Rg
Pc —Pp 0.2 —Qp 0.5 0.5 —Pd 0.5 0.4 0.1 —Ma 1.2 2.0 2.6 2.6 —Cy 1.7 2.9 3.8 4.0 0.3 —Ta 1.0 1.6 2.1 2.1 0.3 0.7 —Va 1.2 2.0 2.7 2.7 0.2 0.5 0.2 —Ra 1.0 1.2 0.7 0.9 3.6 5.4 3.0 3.7 —Pl 1.0 0.1 0.4 0.4 1.3 1.7 1.0 1.3 0.9 —Rg 0.9 0.1 0.7 0.8 2.0 2.5 1.8 2.1 0.4 0.8 —
(b)
Type Pc Pp Qp Pd Ma Cy Ta Va Ra Pl Rg
Pc —Pp 0.79 —Qp 1.73 1.4 —Pd 1.30 1.00 0.91 —Ma 1.82 1.93 2.00 2.00 —Cy 1.99 2.00 2.00 2.00 1.72 —Ta 1.64 1.76 2.00 1.98 0.58 1.83 —Va 1.77 1.95 2.00 2.00 0.85 1.56 0.90 —Ra 1.96 1.88 1.48 1.61 2.00 2.00 2.00 2.00 —Pl 1.72 1.53 1.71 1.78 1.99 2.00 1.91 1.99 1.92 —Rg 1.70 1.54 1.67 1.72 1.99 2.00 1.95 1.99 1.86 1.49 —
Multispectral separability of rainforest types 2899
Downloaded By: [Northern Arizona University] At: 21:20 23 July 2010
The mean decrease in accuracy for each permuted variable was used as an indicator of
the importance of each spectral variable for predicting a forest type (figure 5). For
example, TM4 showed low M values from separability comparisons, but was the
principal predictor variable for discriminating tree plantations from other forest
types. The higher importance of TM1 is due to a decrease in reflectance values for
this band for between lowland and foothill forest types. The blue band (TM 1) is more
highly affected by atmospheric scattering (Jensen 2000), which is potentially impor-tant between high and low elevation environments. However, absorption in the blue
light spectrum was greater than expected for foothills and premontane forest vegeta-
tion. Importance values were low for most predictors with the P. macroloba domi-
nated forest types (figure 5).
Elevation was well correlated with ordination axis 1, which contained much of the
variation for tree species observed in old-growth plots. Once elevation was added as
an additional predictor variable, SVM was tuned, resulting in parameters � ¼ 1 and
C ¼ 64 with an error rate of 19% (figure 4(b)). The addition of plot elevation notablyincreased SVM overall accuracy (84.3%) as well as producer’s and user’s accuracy for
individual forest types (table 5(b)). RF runs yielded slightly higher accuracy overall
(86.7%), due to a 15% increase in accuracy for a single category (Pd). Further tuning
for SVM kernel methods is likely necessary to reduce some misclassification errors for
P. macroloba dominated forest types. Nevertheless, SVM classifications compared
favourably to RF accuracies in most forest categories (table 5(b)).
Including elevation as an additional predictor variable also increased accuracy
within forest structural types by , 10% (table 4(b)). The relationship between eleva-tion, tree plantations and forest regrowth was primarily due to land use practices in
the study area, as reforestation and regeneration areas occur most extensively at low
(a)
(b)C
ost
20
40
60
80
100
12028.0
29.0
30.0
31.0
32.0
33.0
34.0
0.6 0.8 1.0 1.2 1.4 1.6 1.8 2.0
γ
Cost
20
40
60
80
100
120 19.0
19.5
20.0
20.5
21.0
Error (%)
Figure 4. SVM cost (C) and gamma (�) parameter optimization for reducing misclassification %error among forest types with (a) TM bands and NDVI and (b) TM bands, NDVI and elevation.
2900 S. E. Sesnie et al.
Downloaded By: [Northern Arizona University] At: 21:20 23 July 2010
elevations. Accuracy for palm swamps was also improved, as they are located at the
lowest elevations which are subject to frequent flooding (Urquart 1999).
4. Discussion
4.1 Rainforest types
The present study was conducted with the aim of characterizing old-growth forest
types and their spectral separability with Landsat TM data. Old-growth forest typesin the study area generally show less distinctive structural features in comparison with
species differences (table 2). Tree species composition shows a gradual transition
across measured gradients that are typical for overstorey trees with broad spatial
distributions (Toumisto et al. 2003a). More distinct differences were also noted.
P. macroloba and palm dominated forest transition to other floristic compositions
over short geographic distances in both lowland and foothill environments. Plot
distributions along ordination axes show distinctive margins between a few forest
Table 5. Error matrices from SVM classifications of 11 forest types with (a) TM bands 1–5, 7and NDVI, and (b) elevation included with spectral bands for prediction. Overall, producer’sand user’s accuracy for the SVM classifier are compared with RF accuracy summaries. Thenumber of correctly classified pixels are in bold along the main diagonal of the error matrices.
(a)
SVM validation pixels SVM RF
Type Pc Pp Qp Pd Ma Cy Ta Va Ra Pl Rg Producer/User Producer/User
Pc 86 18 1 8 2 0 8 3 0 3 5 61/64 % 59/60 %Pp 32 91 11 20 1 0 3 0 4 7 8 66/51 60/57Qp 1 8 83 9 0 0 0 0 12 6 8 73/65 71/67Pd 1 0 2 18 0 0 0 0 1 1 2 31/72 60/46Ma 0 0 0 0 39 7 9 12 0 0 0 49/58 54/61Cy 0 0 0 0 0 10 1 4 0 0 0 42/67 54/76Ta 4 11 0 0 18 0 57 14 0 7 0 56/51 58/52Va 12 0 0 0 18 7 23 72 0 0 4 69/53 59/51Ra 0 0 4 1 0 0 0 0 97 0 0 85/95 92/88Pl 2 4 6 0 2 0 1 0 0 114 8 76/83 75/74Rg 2 6 6 2 0 0 0 0 0 12 116 77/81 74/78
Overall 66.6 65.3
(b)
Type Pc Pp Qp Pd Ma Cy Ta Va Ra Pl RgProducer/
UserProducer/
User
Pc 102 10 3 14 1 0 4 0 0 2 2 82/74 % 85/82 %Pp 4 110 9 4 0 0 2 0 0 6 3 81/80 87/92Qp 3 3 111 2 0 0 0 0 0 5 5 85/86 95/91Pd 3 3 4 35 0 0 0 0 1 0 5 56/69 73/83Ma 1 0 0 0 65 0 7 6 0 0 0 74/82 69/87Cy 0 0 0 0 0 31 0 0 0 0 0 100/100 100/100Ta 4 0 0 0 10 0 81 2 0 0 0 81/84 76/76Va 0 0 0 0 12 0 6 98 0 0 0 92/84 92/78Ra 0 0 1 1 0 0 0 0 121 0 2 99/97 100/98Pl 2 7 0 3 0 0 0 1 0 118 4 87/87 87/93Rg 5 2 3 3 0 0 0 0 0 5 118 85/87 86/82
Multispectral separability of rainforest types 2901
Downloaded By: [Northern Arizona University] At: 21:20 23 July 2010
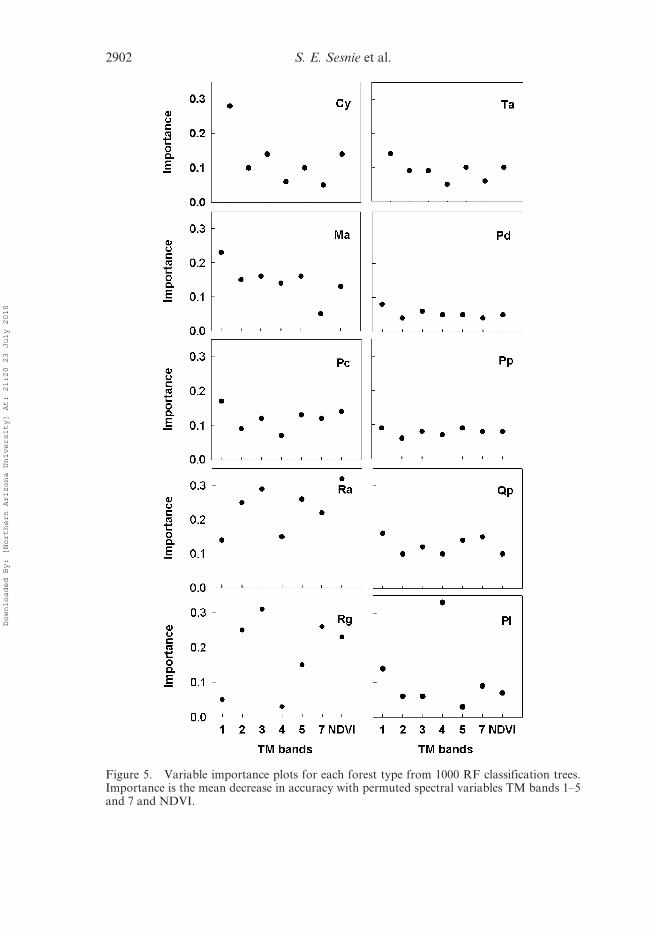
Figure 5. Variable importance plots for each forest type from 1000 RF classification trees.Importance is the mean decrease in accuracy with permuted spectral variables TM bands 1–5and 7 and NDVI.
2902 S. E. Sesnie et al.
Downloaded By: [Northern Arizona University] At: 21:20 23 July 2010
types (e.g. Qp and Pp) from more spatially contiguous and repeated forest plots than
have been compared in previous studies (Lieberman et al. 1996). The rainforest
types above are infrequently included with remote sensing based land cover maps
though they provide critical information to assess forest beta-diversity and regional
carbon accounting (Castro et al. 2003, Chust et al. 2006). Biodiversity assessmentsand improved botanical records have renewed interest in floristic characterizations
for tropical and temperate forest types (Scott and Jennings 1998, Hammel et al.
2004). These data are typically deficient for wet tropical environments due to lack of
forest inventories with tree species composition and structural information.
Extrapolation of forest types from systematically measured permanent measure-
ment plots to unsampled areas via satellite spectral bands can potentially increase
opportunities to map forest composition and structural features. Costa Rica has
recently conducted pilot studies to implement a national forest inventory (Kleinnet al. 2005) that could eventually improve the feasibility of detailed forest mapping
and monitoring programs which incorporate low-cost Landsat data (Klienn et al.
2002). Costa Rica’s recently established forest monitoring protocols for designated
Biological Corridor and protected areas are an integration of ground data,
airborne and satellite based images (Sistema Nacional de Areas de Conservacion
[SINAC] 2007).
4.2 Spectral separation of rainforest types
An increasing number of studies demonstrate that differences in rainforest composi-
tion can be discriminated at the resolution of Landsat imagery (Foody and Hill 1996,
Lobo and Gullison 1998, Tuomisto 1998, Salovaara et al. 2005, Chust et al. 2006).
These studies appear to exploit forest structural and seasonal differences that are less
prevalent in areas of high rainfall. Our results show that TM bands are, to an extent,
sensitive to differences in canopy tree species encountered in broadleaf evergreen
rainforest. TM bands in the visible light spectrum were important to spectral separ-ability between lowland and foothill old-growth types and forest regrowth, as indi-
cated from separability tests. In most cases, differences in forest types were
discriminated by specific spectral bands. For example, the MIR band was highly
important in classifying palm swamps, Q. paraensis and regrowth types, but was not
important for discriminating premontane forest types (figure 5). Palm swamps are
visually identifiable on TM images because of homogeneous composition and struc-
ture (Foody and Hill 1996) which likely lead to greater separability and classification
accuracy than for other old-growth types.Forest regrowth was well separated from most other forest types using a single
category to characterize successional forest. Advanced secondary regrowth stages
were rare in this landscape, as forest regeneration is often returned to agriculture
(Read et al. 2001, Sesnie et al. 2008). A majority of reforested areas are also exten-
sively planted with a single exotic broadleaf tree (Gmelina arborea) that can be visually
identified on TM imagery because of bright green foliage at early development stages
(personal observation). As regrowth forest and tree plantations develop or native
species are planted, it is likely they will become increasingly difficult to discriminatefrom other forest types with Landsat bands (Lu et al. 2003a, 2003b). Separability
tested for tree plantations documented in 2004 was likely enhanced as most were
planted with exotic trees and at earlier development stages in the 2001 TM image. In
this landscape, both G. arborea plantations and early successional forest can quickly
Multispectral separability of rainforest types 2903
Downloaded By: [Northern Arizona University] At: 21:20 23 July 2010
reach advanced developmental stages, increasing canopy closure which may impact
spectral separability at future image dates, assuming limited land use change.
The use of multi-date Landsat images can potentially improve tree plantation and
secondary forest classification, though obtaining cloud-free imagery for wet tropical
areas is a limitation. Thus, discriminating forest types from single image dates isimportant for these environments (Pedroni 2003).
4.3 Machine learning classifiers
Classification accuracy was low for both SVM and RF classifiers because of the poor
spectral separability for some forest types with TM bands. Huang et al. (2002) found
that misclassification errors among forest cover types were a function of the para-
meter setting � and the kernel method, in addition to the number of input variables
used. Further tuning or other kernel methods can potentially enhance accuracies with
the SVM classifier. However, separability tests performed with this study suggest that
limited gains are likely among categories with greater tree species similarity. Low
spectral separability and classification accuracy was linked to higher tree speciessimilarity (SI . 0.40) among forest types. Townsend (2000) found species similarity
. 0.50 (Bray-Curtis index) was a breakpoint for differences in tree species composi-
tion for temperate forest types, leading to misclassification errors with TM data. As
much as 70% of tree basal area on poorly drained sites can be comprised of just three
tree species in the study area (Webb and Peralta 1998). Forest types from our analysis
reflect these conditions, showing high importance values for P. macroloba and its
gradual replacement by other species on better drained sites (table 2). Elevation is
related to drainage and soil moisture conditions that proved useful for accuratelyclassifying P. macroloba dominated forest types.
RF trees have been shown to outperform many other tree-based methods for
vegetation classification with multispectral and hyperspectral data (Ham et al. 2005,
Gislason et al. 2006). Of the two classifiers, RF decision trees have advantages over
SVM, with fewer parameter settings and a method to assess variable importance to
classification accuracy (Pal 2005, Gislason et al. 2006). On the other hand, SVM has
greater flexibility to adjust parameters and kernel methods that may be better suited
to some datasets. SVM and RF trees both provide flexibility to incorporate ancillarypredictor variables such as elevation for enhancing class accuracy (Gislason et al.
2006). We found that by combining elevation and spectral data, classification accu-
racy was increased to what we considered a satisfactory level for most forest types (.
80%). Bioclimatic information was also correlated with canopy tree species composi-
tion. The addition of Worldclim precipitation and temperature surfaces and relation-
ships with tree species composition has also been shown to further enhance
classification accuracy for tropical rainforest types (Sesnie et al. 2008, 2009).
5. Conclusions
Remote sensing based classifications for tropical rainforest types are needed for
biodiversity assessment, monitoring forest practices and regional carbon accounting.
Landsat TM and ETMþ data are readily available and the most cost-effective source
of remotely sensed data for tropical areas. Overstorey trees comprise much of the
radiant energy received by the overhead view of optical satellite sensors. NDVI and a
mean textural filter enhance spectral differences between evergreen rainforest types,
2904 S. E. Sesnie et al.
Downloaded By: [Northern Arizona University] At: 21:20 23 July 2010
but categories were effectively separated only when differences in overstorey tree
composition were large. Greater canopy tree species similarity among forest types
resulted in poor separability, potentially limiting characterizations to a few dominant
categories. SVM and RF decision tree classifiers appear to perform comparatively
well, though class accuracies were low for validation data. Adding elevation as anadditional predictor variable dramatically improved SVM and RF accuracy to levels
. 80% for most forest types. Forest regrowth, tree plantations and palm swamps that
differ in composition and structure also showed considerably improved class accura-
cies. Methods for tuning SVM kernel methods are an advantage with this approach,
but involve additional training time. Overall, advanced machine learning techniques
proved capable for integrating spectral and spatial predictors to improve classifica-
tion accuracy, thereby retaining important information about forest composition and
structural differences. We conclude that SVM and RF classifiers provide an enhancedset of algorithms for discriminating forest types critically important to national and
international conservation and monitoring programs.
Acknowledgements
We are grateful for financial support from NSF-IGERT grant no. 0114304. Field assis-tants Edwin Peirera, Marvin Zamora and Vicente Herrera were critical to this work.
Andres Sanchun, German Obando from the Fundacion para el Dessarollo Sostenible de
la Cordillera Vocanica Central (FUNDECOR) and Jhonny Mendez and Oscar Quiros
from the Comision de Dessarollo Forestal San Carlos (CODEFORSA) also contributed
logistical support for field work. We thank the land owners in the Sarapiquı and San
Carlos region who generously allowed us access to their forests. We also thank two
anonymous reviewers for their comments helpful to revising this manuscript.
References
BENNETT, K.P. and CAMPBELL, C., 2000, Support vector machines: hype or hallelujah? SIGKDD
Explorations, 2, pp. 1–13.
BOYD, D.S., SANCHEZ-HERNANDEZ, C. and FOODY, G.M., 2006, Mapping a specific class for
priority habitats monitoring from satellite sensor data. International Journal of Remote
Sensing, 27, pp. 2631–2644.
BRAY, J.R. and CURTIS, J.T., 1957, An ordination of the upland forest communities of southern
Wisconsin. Ecological Monographs, 27, pp. 325–349.
BREIMAN, L., 2001, Random forests. Machine Learning, 45, pp. 5–32.
BUTTERFIELD, R.P., 1994, The regional context: land colonization and conservation in
Sarapiquı. In La Selva: Ecology and Natural History of a Neotropical Rain Forest,
L.A. McDade, K.S. Bawa, H.A. Hespenheide and G.S. Hartshorn (Eds), pp. 299–306
(Chicago: University of Chicago Press).
CASTRO, K.L., SANCHEZ-AZOFEIFA, G.A. and RIVARD, B., 2003, Monitoring secondary tropical
forest using space-born data: implications for Central America. International Journal of
Remote Sensing, 24, pp. 1853–1894.
CHANDER, G. and MARKHAM, B., 2003, Revised Landsat-5 TM radiometric calibration proce-
dures and postcalibration dynamic ranges. IEEE Transactions on Geoscience and
Remote Sensing, 41, pp. 2674–2677.
CHASSOT, O. and MONGE, G., 2002, Corredor Biologico San Juan – La Selva: Ficha Tecnica. (San
Jose, Costa Rica: Centro Cientifico Tropical).
CHOMITZ, K.M., BRENES, E. and CONSTANTINO, L., 1999, Financing environmental services: the
Costa Rican experience and its implications. The Science of the Total Environment, 240,
pp. 157–169.
Multispectral separability of rainforest types 2905
Downloaded By: [Northern Arizona University] At: 21:20 23 July 2010
CHUST, G., CHAVE, J., CONDIT, R., AGUILAR, S., LAO, S. and PEREZ, R., 2006, Determinants and
spatial modeling of tree ß-diversity in a tropical forest landscape in Panama. Journal of
Vegetation Science, 17, pp. 83–92.
CLARK, D.B., PALMER, M.W. and CLARK, D.A., 1999, Edaphic factors and the landscape-scale
distributions of tropical rainforest trees. Ecology, 80, pp. 2662–2675.
CLARKE, K.R., 1993, Non-parametric multivariate analyses of changes in community structure.
Australian Journal of Ecology, 18, pp. 117–143.
CONDIT, R., 1996, Defining and mapping vegetation types in mega-diverse tropical forests.
Trends in Ecology and Evolution, 11, pp. 4–5.
CONDIT, R., PITMAN, N., LEIGH JR, E.G., CHAVE, J., TERBORGH, J., FOSTER, R.B., NUNEZ, P.,
AGUILAR, S., VALENCIA, R., VILLA, G., MULLER-LANDAU, H.C., LOSOS, E. and HUBBELL,
S.P., 2002, Beta-diversity in tropical forest trees. Science, 295, pp. 666–669.
CONGALTON, R.G. and GREEN, K., 1999, Assessing the Accuracy of Remotely Sensed Data:
Principles and Practices (New York: Lewis Publishers).
CORTES, C. and VAPNIK, V., 1995, Support-vector networks. Machine Learning, 20, pp. 273–297.
CURTIS, J.F. and MCINTOSH, R.P., 1950, The interrelations of certain analytic and synthetic
phytosociological characters. Ecology, 31, pp. 434–450.
DUIVENVOORDEN, L.F., SVENNING, L.C. and WRIGHT, S.J., 2002, Beta diversity in tropical
forests. Science, 295, pp. 636–637.
FOODY, G.M. and HILL, R.A., 1996, Classification of tropical forest classes from Landsat TM
data. International Journal of Remote Sensing, 17, pp. 2353–2367.
GISLASON, P.O., BENEDIKTSSON, J.A. and SVEINSSON, J.R., 2006, Random forests for land cover
classification. Pattern Recognition Letters, 27, pp. 294–300.
GITELSON, A.A., 2004, Wide dynamic range vegetation index for remote quantification of
biophysical characteristics of vegetation. Journal of Plant Physiology, 161, pp.
165–173.
GREEN, A.A., BERMAN, M., SWITZER, P. and CRAIG, M.D., 1988, A transformation for ordering
multispectral data in terms of image quality with implication for noise removal. IEEE
Transactions on Geoscience and Remote Sensing, 26, pp. 65–74.
HAM, J., CHEN, Y., CRAWFORD, M.M. and GHOSH, J., 2005, Investigation of the random forest
framework for classification of hyperspectral data. IEEE Transactions on Geoscience
and Remote Sensing, 43, pp. 492–501.
HAMMEL, B.E., GRAYUM, M.H., HERRERA, C. and ZAMORA, N., 2004, Manual de Plantas de
Costa Rica Volumen I: Introduccion (St. Louis, MI: Missouri Botanical Garden Press).
HIJMANS, R.J., CAMERON, S.E., PARRA, J.L., JONES, P.G. and JARVIS, A., 2005, Very high
resolution interpolated climate surfaces for global land areas. International Journal of
Climatology, 25, pp. 1965–1978.
HILL, R.A., 1999, Image segmentation for humid tropical forest classification in Landsat TM
data. International Journal of Remote Sensing, 20, pp. 1039–1044.
HILL, R.A. and FOODY, G.M., 1994, Separability of tropical rain-forest types in the Tambopata-
Candamo Reserved Zone, Peru. International Journal of Remote Sensing, 15, pp.
2687–2693.
HOLDRIDGE, L.R., 1967, Life Zone Ecology (San Jose, Costa Rica: Tropical Science Center).
HUANG, C., DAVIS, L.S. and TOWNSHEND, J.R.G., 2002, An assessment of support vector machines
for land cover classification. International Journal of Remote Sensing, 23, pp. 725–749.
HUETE, A.R. and JUSTICE, C., 1999, MODIS Vegetation Index (MOD13). Algorithm Theoretical Basis
Document (Greenbelt: NASA Goddard Space Flight Center). Available online at: http://
www.iwmidsp.org/dsp/rs-gis-data/National/Sri-Lanka/01-MODIS-500m-NDVI-single-files/
ReadMe/other-documents/user-guide-modis-ndvi-evi.pdf (accessed 17 February 2010).
ITT INDUSTRIES INC., 2006, The Environment for Visualizing Images (ENVI), Version 4.3
(Boulder, CO: ITT Industries, Inc.).
JENSEN, J.R., 1996, Introductory Digital Image Processing: A Remote Sensing Perspective.
2nd ed. (Upper Saddle River, NJ: Prentice Hall).
2906 S. E. Sesnie et al.
Downloaded By: [Northern Arizona University] At: 21:20 23 July 2010
JENSEN, J.R., 2000, Remote Sensing of the Environment: An Earth Resource Perspective. (Upper
Saddle River, New Jersey: Prentice Hall).
KAUFMAN, Y.J. and REMER, L.A., 1994, Detection of forests using Mid-IR reflectance: an
application for aerosol studies. IEEE Transactions and Geoscience and Remote
Sensing, 32, pp. 672–683.
KERR, J.T. and OSTROVSKY, M., 2003, From space to species: ecological applications for remote
sensing. Trends in Ecology and Evolution, 18, pp. 299–304.
KLEINN, C., CORRALES, L. and MORALES, D., 2002, Forest area in Costa Rica: A comparative
study of tropical forest cover estimates over time. Environmental Monitoring and
Assessment, 73, pp. 17–40.
KLEINN, C., RAMIEZ, C., HOLMGREN, P., VALVERDE, L.S. and CHAVES, G., 2005, A national forest
resource assessment for Costa Rica based on low intensity sampling. Forest Ecology and
Management, 201, pp. 9–23.
LAMB, D., ERSKINE, P.D. and PARROTTA, J.A., 2005, Restoration of degraded tropical forest
landscapes. Science, 310, pp. 1628–1632.
LANCE, G.N. and WILLIAMS, W.T., 1967, A general theory of classification sorting strategies.
I. Hierachical systems. Computer Journal, 9, pp. 271–277.
LIEBERMAN, D., LIEBERMAN, M., PERALTA, R. and HARTSHORN, G.S., 1996, Tropical forest
structure and composition on a large scale altitudinal gradient in Costa Rica. Journal
of Ecology, 84, pp. 137–152.
LOBO, A. and GULLISON, R.E., 1998, Mapping the tropical landscapes of Beni (Bolivia) from
Landsat-TM imagery: beyond the forest/non-forest legend. In Forest Biodiversity,
Monitoring, and Modelling, F. Dallmeier and J.A. Comiskey (Eds.), pp. 159–181
(Paris: UNESCO).
LU, D., MAUSEL, P., BRONDIZIO, E. and MORAN, E., 2003a, Classification of successional forest
stages in the Brazilian Amazon basin. Forest Ecology and Management, 181, pp. 301–312.
LU, D., MORAN, E. and M., BATISTELLA, 2003b, Linear mixture model applied to Amazonian
vegetation classification. Remote Sensing of Environment, 87, pp. 456–469.
LU, D., MAUSEL, P., BRONDIZIO, E. and MORAN, E., 2004, Relationships between forest stand
parameters and Landsat TM spectral responses in the Brazilian Amazon Basin. Forest
Ecology and Management, 198, pp. 149–167.
MAYAUX, P., HOLMGREN, P., ACHARD, F., EVA, H., STIBIG, H. and BRANTHOMME, A., 2005,
Tropical forest cover change in the 1990’s and options for future monitoring.
Philosophical Transaction of the Royal Society B, 360, pp. 373–384.
MCCUNE, B. and MEDFORD, M.J., 1999, PC-ORD. Multivariate Analysis of Ecological Data
Version 4. (Gleneden Beach, OR: MjM Software Design).
NAGENDRA, H. and GADGIL, M., 1999, Satellite imagery as a tool for monitoring species
diversity: an assessment. Journal of Applied Ecology, 36, pp. 388–397.
PAL, M., 2005, Random forest classifier for remote sensing classification. International Journal
of Remote Sensing, 26, pp. 217–222.
PAL, M. and MATHER, P.M., 2005, Support vector machines for classification in remote sensing.
International Journal of Remote Sensing, 26, pp. 1007–1011.
PEDRONI, L., 2003, Improved classification of Landsat Thematic Mapper data using modified
prior probabilities in large and complex landscapes. International Journal of Remote
Sensing, 24, pp. 91–113.
PHILLIPS, O.L., VARGAS, P.N., MONTEAGUDO, A.L., CRUZ, A.P., ZANS, M.C., SANCHEZ, W.G.,
YLI-HALLA, M. and ROSE, S., 2003, Habitat association among Amazonian tree species:
a landscape scale approach. Journal of Ecology, 91, pp. 757–775.
READ, J.M., DENSLOW, J.S. and GUZMAN, S.M., 2001, Documenting land cover history of a
humid tropical environment in northeastern Costa Rica using time-series remotely
sensed data. In GIS and Remote Sensing Applications in Biogeography and Ecology,
A.C. Millington, S.J. Walsh and P.E. Osborne (Eds), pp. 69–89 (Boston: Kluwer
Academic Publishers).
Multispectral separability of rainforest types 2907
Downloaded By: [Northern Arizona University] At: 21:20 23 July 2010
ROUSE, J.W., HAAS, R.H., SCHEL, J.A. and DEERING, D.A., 1974, Monitoring vegetation
systems in the Great Plains with ERTS. In Proceedings of Third Earth Resources
Technology Satellite - 1 Symposium, pp. 3010–3017 (Greenbelt, MD: NASA).
RUOKOLAINEN, K. and TUOMISTO, H., 2002, Beta-diversity in tropical forests. Science, Technical
Comments, 297, p. 1439a.
SALOVAARA, K.J., THESSLER, S., MALIK, R.N. and TUOMISTO, H., 2005, Classification of
Amazonian primary rain forest vegetation using Landsat ETMþ satellite imager.
Remote Sensing of Environment, 97, pp. 39–51.
SANDMANN, H. and LERTZMAN, K.P., 2003, Combining high-resolution aerial photography with
gradient-directed transects to guide field sampling and forest mapping in mountainous
terrain. Forest Science, 49, pp. 249–443.
SANFORD JR, R.L., PAABY, P., LUVALL, J.C. and PILLIPS, E., 1994, Climate, geomorphology and
aquatic systems. In: La Selva: Ecology and Natural History of a Neotropical Rain Forest,
L.A. McDade, K.S. Bawa, H.A. Hespenheide and G.S. Hartshorn (Eds), pp. 19–33
(Chicago, IL: University of Chicago Press).
SCOTT, J.M. and JENNINGS, M.D., 1998, Large-area mapping of biodiversity. Annals of Missouri
Botanical Garden, 85, pp. 34–47.
SESNIE, S.E., GESSLER, P.E., FINEGAN, B. and THESSLER, S., 2008, Integrating Landsat TM and
SRTM-DEM derived variables for habitat classification and change detection with
decision trees in complex neotropical environments. Remote Sensing of Environment,
112, pp. 2145–2159.
SESNIE, S.E., FINEGAN, B., GESSLER, P. and RAMOS, Z., 2009, Landscape-scale environmental
and floristic variation in Costa Rican old-growth rain forest remnants. Biotropica, 41,
pp. 16–26.
SANCHEZ-HERNANDEZ, C., BOYD, D.S. and FOODY, G.M., 2007, Mapping specific habitats
from remotely sensed imagery: support vector machines and support vector data
description based classification of coastal saltmarsh habitats. Ecological
Informatics, 2, pp. 83–88.
SISTEMA NACIONAL DE AREAS DE CONSERVACION (SINAC) DEL MINISTERIO DE AMBIENTE Y
ENERGIA (MINAE), 2007, Programa de monitoreo ecologico Terrestre de las Areas
Protegidas y corredores biologicos de Costa Rica (PROMEC-CR) Etapa I
(2007–2001): Resumen Ejecutivo [in Spanish]. San Jose, Costa Rica. 22 pp.
SNIDER, A.G., PATTANAYAK, S.K., SILLS, E.O. and SCHULER, J.L., 2003, Policy innovations for
private forest management and conservation in Costa Rica. Journal of Forestry, 101,
pp. 18–23.
SOLLINS, P., SANCHO, F., MATA, R. and SANFORD JR, R.L., 1994, Soils and soil process research.
In La Selva: Ecology and Natural History of a Neotropical Rain Forest, L.A. McDade,
K.S. Bawa, H.A. Hespenheide and G.S. Hartshorn (Eds), pp. 34–53 (Chicago, IL.
University of Chicago Press).
THENKABAIL, P.S., HALL, J., LIN, T., ASHTON, M.S., HARRIS, D. and ENCLONA, E.A., 2003,
Detecting floristic structure and pattern across topographic and moisture gradients in a
mixed species Central African forest using IKONOS and Landsat-7 ETMþ images.
International Journal of Applied Earth Observations and Geoinformation, 4, pp. 255–270.
TOWNSEND, P.A., 2000, A quantitative fuzzy approach to assess mapped vegetation classifica-
tions for ecological applications. Remote Sensing of Environment, 72, pp. 253–267.
TOWNSEND, P.A. and WALSH, S.J., 2001, Remote sensing forested wetlands: applications of
multitemporal and multispectral satellite imagery to determine plant community com-
position and structure. Plant Ecology, 157, pp. 129–149.
TRIGG, S. and FLASSE, S., 2001, An evaluation of different bi-spectral spaces discriminating
burned shrub-savannah. International Journal of Remote Sensing, 22, pp. 2641–2647.
TUOMISTO, H., 1998, What satellite imagery and large-scale field studies can tell about biodi-
versity patterns in Amazonian forests. Annals of the Missouri Botanical Gardens,
85, pp. 48–62.
2908 S. E. Sesnie et al.
Downloaded By: [Northern Arizona University] At: 21:20 23 July 2010
TUOMISTO, H., RUOKOLAINEN, K., KALLIOLA, R., LINNA, A., DANJOY, W. and RODRIGUEZ, Z.,
1995, Dissecting Amazonian biodiversity. Science, 269, pp. 63–66.
TUOMISTO, H., RUOKOLAINEN, K., AGUILAR, M. and SARMIENTOS, A., 2003a, Floristic patterns
along a 43-km long transect in an Amazonian rain forest. Journal of Ecology, 91,
pp. 743–756.
TUOMISTO, H., POULSEN, A.D., ROUKOLAINEN, K., MORAN, R.C., QUINTANA, C., CELI, J. and
CANAS, G., 2003b, Linking floristic patterns with soil heterogeneity and satellite ima-
gery in Ecuadorian Amazonia. Ecological Applications, 13, pp. 352–371.
UNEP, 1992, Convention on Biological Diversity, Text and Annexes (Montreal, Canada:
Secretariat of Convention on Biological Diversity).
UNESCO, 1973, International Classification and Mapping of Vegetation (Paris: UNESCO).
UNFCCC, 1994, United Nations Framework Convention on Climate Change. Available
online at http://unfccc.int/2860.php.
URQUHART, G.R., 1999, Long-term persistence of Raphia taedigera Mart. swamps in
Nicaragua. Biotropica, 31, pp. 565–569.
VIEIRA, S., BARBOSA DE CAMARGO, P., SELHORST, D., DA SILVA, R., HUTYRA, L., CHAMBERS, J.Q.,
BROWN, I.F., HIGUCHI, N., DOS SANTOS, J., WOFSY, S.C., TRUMBORE, S.E. and
MARTINELLI, L.A., 2004, Forest structure and carbon dynamics in Amazonian tropical
rain forests. Oecologia, 140, pp. 468–479.
WEBB, E.L. and PERALTA, R., 1998, Tree community diversity in lowland swamp forest in
Northeast Costa Rica, and changes associated with controlled selective logging.
Biodiversity and Conservation, 7, pp. 565–583.
WISHART, D., 1969, An algorithm for hierarchical classifications. Biometrics, 25, pp. 165–170.
Multispectral separability of rainforest types 2909
Downloaded By: [Northern Arizona University] At: 21:20 23 July 2010