International Journal of Lipid Research & Advances · International Journal of Lipid Research &...
21
International Journal of Lipid Research & Advances Odeh MA, et al. Study of the Distribution of the Apolipoproteins A-I and A-Ii, Among Lipoprotein Subclasses in Plasma of Normo- and Hyperlipidemic Subjects. Int J Lipid Res Adv 2019, 1(1): 000103. Copyright© Odeh MA, et al. 1 Appendix A Subjects Age (year) Cholesterol (mg/dL) TAGs (mg/dL) HDL-C (mg/dL) LDL-C (mg/dL) VLDL-C (mg/dL) apoA-I (mg/dL) apoB (mg/dL) apoB/apoAI FB a ( mg/dL) Ng-Nl (n =42 ) (M+F) 40.1 ±16.7 b16.7 b 149.5 ± 25.4 109.2 ± 43.5 41.8 ± 11.5 86.2 ± 21.9 21.2 ± 8.3 128.7 ± 22.2 67 ± 16.9 0.54 ± 0.2 92.2 ± 13 Range c 21 - 77 92 - 198 46 - 203 23 - 70 42 – 121 Sep-40 85 - 184 32 - 98 0.22 – 1.01 74 - 120 Ng-Hl- mixed (n = 20) (M+F) 45.8 ± 12.3 252.1 ± 43.6 342.1 ± 127.5 36.9 ± 5.6 148 ± 35.3 67.9 ± 25.7 141 ±26.9 138 ±35.3 0.99 ± 0.27 98.2 ± 12.1 Range c 29 - 83 201 - 369 202 - 679 23 – 43 85 - 212 40 - 136 88 - 208 79 - 240 0.7 – 1.9 78 - 118 Diff. d 5.7 102.6 h 232.9 h -4.9 61.8 h 46.7 h 12.3 71 h 0.45 h 6 % Diff e 14 69 h 213 h -12 72 h 220 h 10 106 h 83 h 7 Ng-Nl ( n =35) (M+F) 45.9 ± 16.4 151.6 ± 25.8 114.1 ± 43.9 43.4 ± 11.3 85.7 ± 22.2 22.1 ± 8.4 131.5 ± 22.6 66.5 ± 17 0.52 ± 0.2 95.4 ± 15.3 Range c 21 - 77 92- 198 46 - 199 23 - 70 42- 121 Sep-40 85 - 184 32 - 98 0.2 – 0.95 75 - 120 Ng- Hl.chol ( n =17) (M+F) 50.2 ± 15.8 230.8 ± 27.8 135 ± 54.0 61.8 ± 19.3 142.3 ± 25.5 26.7 ± 10.7 169.3 ± 40.8 106.4 ± 20.0 0.66 ± 0.22 95.9 ± 17.6 Range 19 - 79 202 - 302 56 - 200 39 - 112 109 - 200 Nov-39 114 - 239 83 - 149 0.4 – 1.3 57 - 116 Diff a 4.3 79.2 h 20.9 18.4 h 56.6 h 4.6 37.8 h 39.9 h 0.14 g 0.5 % Diff. e 9 52 h 18 42 h 66 h 21 29 h 60 h 27 g 1 Table A1: Total plasma apoA-I, apoB, apoB/apoA-I ratio, and lipid profile of Ng-Hl.mixed subjects are compared with the corresponding age- matched controls of Ng-Nl in the upper half of the table. The lower half of the table compares the Ng-Hl.chol group with Ng-Nl group. a FBG : fasting blood glucose, b Mean ± SD, c Range, d Difference = (Ng – Hl) – (Ng- Nl), e Percent difference of means = {[ (Ng – Hl) – (Ng – Nl)] / (Ng – Nl) } * 100 %, f P < 0.05 , g P < 0.01 h P < 0.001. AI-Lp subclass Ng-Nl (n = 42 ) (21 – 77) f Ng-Hl.mixed (n = 20) (29 – 83) Mean Diff a % Diff. b Ng-Nl ( n = 35) (21 – 77) Ng-Hl.chol. ( n = 17) (19 – 79) Mean Diff a % Diff. 1 Not detected Not detected Not detected Not detected 2 Not detected 10.8± 5.2 c,d (n = 4) e 10.8 Not detected Not detected 3 6.8 ± 0.9 (n = 8) 6.7 ±3.2 (n = 6) -0.1 -2 6.8 ± 0.7 (n = 7) 5.9 ± 1.7 (n = 4) -0.9 -13 4 7.7 ± 1.9 (n =10) 18.0 ± 10.1 (n =11) 10.3 h 134 h 9.2 ± 2.9 (n = 9) 30.1 ± 29.1 (n = 7) 21.9 g 238 g 5 15.1 ± 5.7 (n = 12) 16.6 ± 12.8 (n = 8 ) 1.5 10 17.0 ± 6.7 (n = 11) 19.5 ± 6.7(n = 4) 2.5 15 6 24.6 ± 8.4 (n = 41) 27.6 ± 14.9 (n = 20) 3 12 25.9 ± 9.1(n = 34) 37.2 ± 15.8 (n = 15) 11.3 h 44 h 7 20.6 ± 5.9 (n = 37) 18.7 ± 6.7 (n = 11) -1.9 -9 20.1 ± 7.4 (n = 29) 30.0 ± 6.3 (n = 13) 9.9 h 49 h 8 23.0 ± 8.3 (n = 22) 20.1 ± 6.2 (n = 14) -2.9 -13 23.4 ± 8.5 (n = 18) 32.7 ± 12.9 (n = 8) 9.3 g 40 g 9 26.9 ± 8.5 (n = 23) 26.0 ± 11.1 (n = 10) -0.9 -3 25.9 ± 8.0 (n = 20) 31.1 ± 11.2 (n = 11) 5.2 20
Transcript of International Journal of Lipid Research & Advances · International Journal of Lipid Research &...

International Journal of Lipid Research & Advances
Odeh MA, et al. Study of the Distribution of the Apolipoproteins A-I and A-Ii, Among Lipoprotein Subclasses in Plasma of Normo- and Hyperlipidemic Subjects. Int J Lipid Res Adv 2019, 1(1): 000103.
Copyright© Odeh MA, et al.
1
Appendix A
Subjects Age (year) Cholesterol
(mg/dL) TAGs
(mg/dL) HDL-C
(mg/dL) LDL-C
(mg/dL) VLDL-C
(mg/dL) apoA-I
(mg/dL) apoB
(mg/dL) apoB/apoAI FBa (mg/dL)
Ng-Nl (n =42 ) (M+F)
40.1 ±16.7 b16.7b
149.5 ± 25.4 109.2 ±
43.5 41.8 ± 11.5 86.2 ± 21.9 21.2 ± 8.3 128.7 ± 22.2 67 ± 16.9 0.54 ± 0.2 92.2 ± 13
Range c 21 - 77 92 - 198 46 - 203 23 - 70 42 – 121 Sep-40 85 - 184 32 - 98 0.22 – 1.01 74 - 120 Ng-Hl- mixed (n
= 20) (M+F) 45.8 ± 12.3 252.1 ± 43.6
342.1 ± 127.5
36.9 ± 5.6 148 ± 35.3 67.9 ± 25.7 141 ±26.9 138 ±35.3 0.99 ± 0.27 98.2 ± 12.1
Range c 29 - 83 201 - 369 202 - 679 23 – 43 85 - 212 40 - 136 88 - 208 79 - 240 0.7 – 1.9 78 - 118 Diff. d 5.7 102.6h 232.9h -4.9 61.8h 46.7h 12.3 71h 0.45h 6
% Diffe 14 69h 213h -12 72h 220h 10 106h 83h 7 Ng-Nl ( n =35)
(M+F) 45.9 ± 16.4 151.6 ± 25.8 114.1 ± 43.9 43.4 ± 11.3 85.7 ± 22.2 22.1 ± 8.4 131.5 ± 22.6 66.5 ± 17 0.52 ± 0.2 95.4 ± 15.3
Rangec 21 - 77 92- 198 46 - 199 23 - 70 42- 121 Sep-40 85 - 184 32 - 98 0.2 – 0.95 75 - 120 Ng- Hl.chol ( n
=17) (M+F) 50.2 ± 15.8 230.8 ± 27.8 135 ± 54.0 61.8 ± 19.3 142.3 ± 25.5 26.7 ± 10.7 169.3 ± 40.8 106.4 ± 20.0 0.66 ± 0.22 95.9 ± 17.6
Range 19 - 79 202 - 302 56 - 200 39 - 112 109 - 200 Nov-39 114 - 239 83 - 149 0.4 – 1.3 57 - 116 Diffa 4.3 79.2h 20.9 18.4h 56.6h 4.6 37.8h 39.9h 0.14g 0.5
% Diff. e 9 52h 18 42h 66h 21 29h 60h 27g 1
Table A1: Total plasma apoA-I, apoB, apoB/apoA-I ratio, and lipid profile of Ng-Hl.mixed subjects are compared with the corresponding age- matched controls of Ng-Nl in the upper half of the table. The lower half of the table compares the Ng-Hl.chol group with Ng-Nl group. aFBG : fasting blood glucose, bMean ± SD, cRange, dDifference = (Ng – Hl) – (Ng- Nl),
ePercent difference of means = {[ (Ng – Hl) – (Ng – Nl)] / (Ng – Nl) } *
100 %, f P < 0.05, g P < 0.01 hP < 0.001.
AI-Lp subclass Ng-Nl (n = 42 ) (21 – 77)f Ng-Hl.mixed (n = 20)
(29 – 83) Mean Diffa % Diff.b
Ng-Nl ( n = 35) (21 – 77)
Ng-Hl.chol. ( n = 17) (19 – 79)
Mean Diffa
% Diff.
1 Not detected Not detected
Not detected Not detected
2 Not detected 10.8± 5.2c,d (n = 4)e 10.8
Not detected Not detected
3 6.8 ± 0.9 (n = 8) 6.7 ±3.2 (n = 6) -0.1 -2 6.8 ± 0.7 (n = 7) 5.9 ± 1.7 (n = 4) -0.9 -13 4 7.7 ± 1.9 (n =10) 18.0 ± 10.1 (n =11) 10.3h 134h 9.2 ± 2.9 (n = 9) 30.1 ± 29.1 (n = 7) 21.9g 238g 5 15.1 ± 5.7 (n = 12) 16.6 ± 12.8 (n = 8 ) 1.5 10 17.0 ± 6.7 (n = 11) 19.5 ± 6.7(n = 4) 2.5 15 6 24.6 ± 8.4 (n = 41) 27.6 ± 14.9 (n = 20) 3 12 25.9 ± 9.1(n = 34) 37.2 ± 15.8 (n = 15) 11.3h 44h 7 20.6 ± 5.9 (n = 37) 18.7 ± 6.7 (n = 11) -1.9 -9 20.1 ± 7.4 (n = 29) 30.0 ± 6.3 (n = 13) 9.9h 49h 8 23.0 ± 8.3 (n = 22) 20.1 ± 6.2 (n = 14) -2.9 -13 23.4 ± 8.5 (n = 18) 32.7 ± 12.9 (n = 8) 9.3g 40g 9 26.9 ± 8.5 (n = 23) 26.0 ± 11.1 (n = 10) -0.9 -3 25.9 ± 8.0 (n = 20) 31.1 ± 11.2 (n = 11) 5.2 20

International Journal of Lipid Research & Advances
Odeh MA, et al. Study of the Distribution of the Apolipoproteins A-I and A-Ii, Among Lipoprotein Subclasses in Plasma of Normo- and Hyperlipidemic Subjects. Int J Lipid Res Adv 2019, 1(1): 000103.
Copyright© Odeh MA, et al.
2
10 23.8 ±10.6 (n =29) 23.1 ± 9.1 (n = 14) -0.7 -3 23.5 ± 10.6 (n = 25) 26.6 ± 7.8 (n = 11) 3.1 13 11 22.2 ± 13.2 (n = 9) 20.3 ± (n = 9) -1.9 -9 21.3 ± 8.7 (n = 8) 19.3 ± 1.6 (n = 7) -2 -9 12 20.9 ± 7.7 (n = 35) 19.5 ± 10.3 (n = 14) -1.4 -7 21.1 ± 7.7 (n = 27) 23.4 ± 10.6 (n = 12) 2.3 11 13 9.4 ± 4.6 11.6 ± 4.5 2.2g 23g 10.3 ± 6.1 14.4 ± 7.1 4.1g 40g
Table A2: The apoA-I content of AI-Lp subclasses of Ng-Hl. mixed subjects are compared with the corresponding age-matched controls of Ng-Nl. The left half of the table compares Ng-Hl. mixed group with Hg-Nl group. The right half of the table compares the Ng-Hl. chol group with aDifference = (Ng – Hl.mixed), or (Ng – Hl.chol) – (Ng – Nl),
bPercent difference of means = {[ (Ng – Hl.mixed) – (Ng – Nl)] / (Ng – Nl) } * 100 %,
cMean ± SD,
dvalues are in mg / dL, eNumber of samples that contain this subclass.. fage range , gP < 0.05. hP< 0.01.
Subjects Age (year) Cholesterol
(mg/dL) TAGs
(mg/dL) HDL-C
(mg/dL) LDL-C
(mg/dL) VLDL-C
(mg/dL) apoA-I
(mg/dL) apoB
(mg/dL) apoB/ apoAI
FBa (mg/dL)
Ng - Nl ( n = 32)(M+F) 47.8 ± 15.8b 154.0 ± 24.5 118.8 ±
42.7 43.5 ± 11.2 87.0 ± 20.2 23.0 ± 8.1 132.3 ± 22.4 67.7 ± 15.6 0.53 ± 0.16 94.1 ± 13.8
Rangec 27 - 77 92 - 198 58 - 205 23 - 70 43 - 121 Nov-40 85 - 184 43 - 98 0.32 – 0.95 75 - 120 Ng - Hl.TAG ( n =
14)(M+F) 50.4 ± 12.3 176 ± 19.5
308.5 ± 107.2
33.7 ± 6.4 82.9 ± 28.4 59.8 ± 21.7 129.1 ± 18.1 94.9 ± 15.3 0.75 ± 0.14 101.9 ± 14.9
Rangec 31 - 75 146 - 199 205 - 565 20 - 45 25 - 115 40 - 113 88 - 155 66 - 121 0.6 – 1.1 72 - 119 Diffd 2.6 22 g 189.7 h - 9.8 g -4.1 36.8 h -3.2 27.2 h 0.22 h 7.8
% Diffe 5.4 14g 160h - 23g - 5 160h -2 40h 42h 8
Ng-Nl (n =42 ) (M+F) 40.1 ± 16.7 b 149.5 ± 25.4 109.2 ±
43.5 41.8 ± 11.5 86.2 ± 21.9 21.2 ± 8.3 128.7 ± 22.2 67 ±16.9 0.54 ± 0.2 92.2 ± 13
Rangec 21 - 77 92 - 198 46 - 203 23 - 70 42 – 121 Sep-40 85 - 184 32 - 98 0.22 – 1.01 74 - 120 Ng - (Hl.chol+
Hl.TAG+Hl.mixed) ( n = 43)(M+F)
45.5 ± 10.7 223.4 ± 43.4 264.6 ± 121.3
42.4 ± 16.4 128.6 ± 43.3 52.5 ± 24.3 143.9 ± 33.1 115.6 ± 30.8 0.83 ± 0.26 96.4 ± 13.9
Rangec 19 - 64 146 - 347 75 - 571 20 - 112 25 - 212 15 - 114 88 - 239 66 - 240 0.38 – 1.85 57 - 118 Diffa 5.4 73.5h 155.4h 0.6 42.4h 31.3h 15.2f 49h 0.29h 4.2
% Diffe 14 49h 142h 1 49h 148h 12f 73h 54h 5
Table A3: Total plasma apoA-I, apoB, apoB/apoA-I ratio, and lipid profile of Ng-Hl.TAG subjects are compared with the corresponding age- matched controls of Ng-Nl in the upper half of the table. The lower half of the table compares the Ng-(Hl.chol + Hl.TAG + Hl.mixed) group with Ng-Nl group. aFBG : fasting blood glucose, bMean ± SD, cRange, dDifference = (Ng – Hl.TAG) – (Ng- Nl),
ePercent difference of means = {[ (Ng – Hl.TAG) – (Ng – Nl)] / (Ng –
Nl) } * 100 %, f P < 0.05g P < 0.01, hP < 0.001.

International Journal of Lipid Research & Advances
Odeh MA, et al. Study of the Distribution of the Apolipoproteins A-I and A-Ii, Among Lipoprotein Subclasses in Plasma of Normo- and Hyperlipidemic Subjects. Int J Lipid Res Adv 2019, 1(1): 000103.
Copyright© Odeh MA, et al.
3
AI-Lp subclass
Ng - Nl ( n = 32) (27 – 77)f
Ng - Hl.TAG ( n = 14) (31 – 75)
Mean Diff.a
% Diff.b
Ng - Nl ( n = 42) (21 – 77) Ng -(Hl.chol+Hl.TAG+Hl) ( n =
43) (19 – 64) Mean Diff.a
% Diff.b
1 Not detected Not detected
Not detected Not detected
2 Not detected 3.5 (n = 1)
Not detected 6.4 ± 2.9 (n = 5)
3 6.8 ± 0.9c, d(n = 7)e 6.9 ± 2.9(n = 5) 0.1 1.5 6.8 ± 0.9 (n = 8) 7.6 ± 2.7 (n =10) 0.8 12 4 9.2 ± 3.1 (n = 8) 21.7 ± 12.7 (n = 8) 12.5g 136g 7.7 ± 1.9 (n =10) 22.8 ± 19.4 (n = 22) 15.1g 196g 5 16.2 ± 7.0 (n = 9) 14.2 ± 9.8 (n = 2) -2 -12 15.1 ± 5.7 (n = 12) 13.7 ± 6.6 ( n = 9) -1.4 -9 6 26.1 ± 9.2 (n =31) 26.9 ± 9.2 (n =12) 0.82 3 24.6 ± 8.4 (n = 41) 29.4± 14.4 (n = 36) 4.8g 20g 7 21.7 ± 9.3 (n=28) 17.9 ± 4.5 (n = 12) -3.7 -18 20.6 ± 5.9 (n = 37) 22.1 ± 10.9 (n = 30) 1.5 7 8 22.9 ± 8.8 (n =16) 14.9 ± 3.6 (n = 7) - 8.0g -35g 23.0 ± 8.3 (n = 22) 23.0 ± 11.2 (n = 24) 0 0 9 26.3 ± 8.0 (n =19) 19.1 ± 7.1 (n = 8) - 7.2g -27g 26.9 ± 8.5 (n = 23) 23.6 ± 8.9 (n = 22) -3.3 -9
10 23.2 ± 11.0(n = 23) 24.1 ± 8.5 (n = 11) 0.9 4 23.8 ±10.6 (n =29) 24.6 ± 8.0 (n =31) 0.8 3 11 22.1 ± 9.1 ( n= 7) 19.4 ± 3.4 (n = 5) -2.7 -12 22.2 ± 13.2 (n = 9) 20.3 ± 4.6 (n = 10) -1.9 -9 12 20.7 ± 7.6 (n = 26) 13.7 ± 5.8 (n = 13) - 7.0h -34h 20.9 ± 7.7 (n = 35) 17.4 ± 6.7 (n = 28) - 3.5g -17g 13 10.1 ± 5.7 10.0 ± 3.5 -0.1 -1 9.4 ± 4.6 12.1 ± 5.7 2.7h 29h
Table A4: The apoA-I content of AI-Lp subclasses of Ng-Hl.TAG subjects are compared with the corresponding age-matched controls of Ng- Nl. The left half of the table compares Ng-Hl.TAG group with Hg-Nl group. The right half of the table compares the Ng-(Hl.chol + Hl.TAG + Hl.mixed) group with Ng-Nl group. aDifference = (Ng – Hl.TAG), or (Ng – (Hl.chol + Hl.TAG + Hl.mixed) – (Ng – Nl).
bPercent difference of means = {[ (Ng – Hl.TAG) – (Ng – Nl)] / (Ng – Nl) } * 100 %, cMean ± SD, dvalues are in mg/dL,
e Number of samples that contain this
subclass., f age range . gP < 0.05. hP< 0.01.
Subjects Age (year) Cholesterol
(mg/dL) TAGs
(mg/dL) HDL-C
(mg/dL) LDL-C
(mg/dL) VLDL-C
(mg/dL) apoA-I
(mg/dL) apoB
(mg/dL) apoB/ apoAI
FBGa
(mg/dL)
Ng-Nl ( n = 26)(M+F) 55.3 ± 11.9 b 159.1 ± 23.0 128.2 ± 41.5 43.1± 11.2 90.7 ± 19.8 24.7 ± 8.0 134.8 ±
22.6 71.2 ± 14.9 0.55 ± 0.17 96.8 ± 13.9
Range c 33 -77 92 - 198 74 - 202 23 - 70 43 - 121 15 - 40 85 - 184 45 - 98 0.36 - 95 75 - 120
Hg-Nl ( n = 13 )(M+F) 60.8 ± 10.7 158.4 ± 25.7 126.7 ± 38.5 41.1 ± 10.3 97.0 ± 26.7 24.9 ± 7.5 136.8 ±
23.2 76.0 ± 17.3 0.58 ± 0.19 198.3 ± 50.5
Range 41 - 77 109 - 189 64 - 199 23 - 62 49 - 134 13 - 39 104 - 181 36 - 96 0.2 – 0.88 147 – 33.4 Diff. d 5.5 -0.7 -1.5 -2 6.3 0.2 2 4.8 0.03 101.5h
% Diff.e 10 -0.4 -1 -5 7 1 2 7 6 105 h
Ng – Nl (n = 33)(M+F) 46.3 ± 17.0 148.2 ± 26.1 111.8 ± 43.2 44.0 ± 11.4 82.1 ± 21.9 21.6 ± 8.2 127.7 ±
23.4 64.3 ± 16.8 0.52 ± 0.19 90.6 ± 13.1
Range 27 - 77 92 - 198 46 - 202 23 - 70 42 - 121 9 – 40 85 - 184 32 - 98 0.2 – 1.01 74 - 120 Hg-(Hl.chol +
Hl.TAG+Hl.mixed) (n = 50.9 ± 9.4 230.4 ± 87.8 367.7 ± 282.5 36.6 ± 12.1 120.0 ± 76.0 73.2 ± 57.2
137.3 ± 24.2
110.6 ± 37.6 0.81 ± 0.23 217.2 ± 81.3

International Journal of Lipid Research & Advances
Odeh MA, et al. Study of the Distribution of the Apolipoproteins A-I and A-Ii, Among Lipoprotein Subclasses in Plasma of Normo- and Hyperlipidemic Subjects. Int J Lipid Res Adv 2019, 1(1): 000103.
Copyright© Odeh MA, et al.
4
28)(M+F) Range 26 - 69 135 - 544 181 - 1754 23 - 82 37 - 455 36 - 351 99 - 210 54 - 228 0.36 – 1.3 124 - 449 Diff. a 4.6 82.2h 255.9 h - 7.4f 37.9f 51.6h 9.6 46.3h 0. 29h 126.6 h
% Diff. 10 56h 229h - 17f 46f 239h 8 72h 56h 140h
Table A5: Total plasma apoA-I, apoB, apoB/apoA-I ratio, and lipid profile of Hg-Nl subjects are compared with the corresponding age-matched controls of Ng-Nl in the upper half of the table. The lower half of the table compares the Hg-(Hl.chol + Hl.TAG + Hl.mixed) group with Ng-Nl group. aFBG : fasting blood glucose, bMean ± SD, cRange, dDifference = (Hg – Nl), or (Hg – (Hl.chol + Hl.TAG + Hl.mixed)) - (Ng- Nl),
ePercent difference of means =
{[ (Hg – Nl) – (Ng – Nl)] / (Ng – Nl) } * 100 %, f P < 0.05 , gP < 0.01, hP < 0.001.
AI-Lp subclass
Ng-Nl ( n = 26) (33 -77)f Hg-Nl ( n = 13 ) (41 – 77) Mean Diff.a
% Diff.b
Ng-Nl (n = 33) (27 – 77)
Hg- (Hl.chol+Hl.TAG+Hl) (n = 28) (26 – 69)
Mean Diff.a % Diff.
1 Not detected Not detected
Not detected 8.6 (n = 1) 8.6
2 Not detected Not detected
Not detected 4.5 ± 1.7 (n =2) 4.5
3 6.8 ± 0.95 c,d(n = 6)e 4.16 (n = 1) -2.6 -39 7.0 ± 1.2 (n = 3) 5.4 ± 1.6 (n =7) -1.6 -23 4 11.5 ± 6.1 (n = 7) 11.7 ± 6.4 (n = 4) 0.2 2 8.7 ± 3.7 (n = 9) 19.3 ± 13.3 (n =11) 10.6 g 122g 5 16.2 ± 7.0 (n = 9) 16.5 ± 7.5 (n = 3) 0.3 2 17.4 ± 7.6 (n = 6) 14.2 ± 9.5 (n =7) -3.2 -18 6 26.7 ±9.5 (n = 25) 29.8 ± 9.3 (n = 13) 3.1 12 24.1 ± 7.8 (n = 30) 30.0 ± 12.7 (n = 24) 5.9g 25g 7 21.6 ± 8.1 (n = 22) 28.3 ± 10.1 (n =12) 6.7g 31g 19.4 ± 7.1 (n = 30) 24.6 ± 10.1 (n = 21) 5.2g 27g 8 23.7 ± 9.6 (n = 13) 25.0 ± 6.1 (n = 6) 1.3 6 22.3 ± 9.0 (n = 17) 23.4 ± 11.9 (n = 20) 1.1 5 9 25.7 ± 8.5 (n = 14) 27.8 ± 15.3 (n =2) 2.1 8 24.3 ± 7.1 (n = 17) 24.8 ± 5.6 (n = 14) 0.5 2
10 23.3 ± 10.1 (n = 19) 25.8 ± 18.2 (n = 9) 2.5 11 24.1 ± 11.9 (n = 25) 23.8 ± 8.9 (n = 18) -0.3 -1 11 23.9 ± 8.4 (n=6) 17.2 ± 4.8 (n = 3) -6.7 -23 20.1 ± 8.8 (n = 9) 18.2 ± 7.4 (n = 11) -1.9 -10 12 19.1 ± 7.1 (n = 21) 19.4 ± 6.8 (n =13) 0.3 2 21.2 ± 7.5 (n = 25) 15.8 ± 7.1 (n = 18) - 5.4g - 26g 13 9.4 ± 4.4 12.1 ± 4.8 2.7g 29g 10.5 ± 6.1 8.2 ± 3.8 - 2.4g - 22g
Table A6: The apoA-I content of AI-Lp subclasses of Hg-Nl subjects are compared with the corresponding age-matched controls of Ng-Nl. The left half of the table compares Hg-Nl group with Ng-Nl group. The right half of the table compares the Hg-(Hl.chol + Hl.TAG + Hl.mixed) group with Ng-Nl group.
aDifference = (Hg – Nl) – (Ng – Nl), bPercent difference of means = {[ (Ng – Hl) – (cMean ± SD, dvalues are in mg / dL, eNumber of samples that contain this
subclass, fage range , gP < 0.05.

International Journal of Lipid Research & Advances
Odeh MA, et al. Study of the Distribution of the Apolipoproteins A-I and A-Ii, Among Lipoprotein Subclasses in Plasma of Normo- and Hyperlipidemic Subjects. Int J Lipid Res Adv 2019, 1(1): 000103.
Copyright© Odeh MA, et al.
5
Subjects Age (year) Cholesterol
(mg/dL) TAGs
(mg/dL) HDL-C
(mg/dL) LDL-C
(mg/dL) VLDL-C
(mg/dL) apoA-I
(mg/dL) apoB
(mg/dL) apoB/apoAI FBa (mg/dL)
Ng-( Nl+ Hl.chol + Hl.TAG +Hl) (n = 38 )
(male)
48.0 ± 13.8 b
196.0 ± 53.8 232.8 ± 135.5 42.1 ± 15.8 108.5 ± 42.3 46.2 ± 27.1 137.8 ± 27.4 100.4 ±
36.8 0.74 ± 0.25 96.3 ± 12.7
Rangec 29 - 77 92 - 347 74 - 571 20 - 112 25 - 198 15-114 88 - 239 45 - 240 0.4 – 1.3 57 - 116 Hg- (Nl +Hl.chol +
Hl.TAG +Hl) (n = 25) (male)
53.2 ± 8.3 203.9 ± 82.8 243.6 ± 112.5
37.7 ± 11.5
118 ± 77.7 48.6 ± 22.9 136.6 ± 27.5 101.8 ±
38.6 0.76 ± 0.26 182.6 ± 78.7
Range 37 - 69 117 - 544 76 - 470 23 - 82 55 - 455 15 - 94 85 - 210 54 - 228 0.4 – 1.3 120 - 449 Diff.d 5.2 7.9 10.8 -4.4 9.5 2.4 -1.2 1.8 0.02 86.3h
% Diffe 11 4 5 -11 9 5 -1 2 3 90h Ng- (Nl + Hl.chol +
Hl.TAG + Hl) ( n =30) (female)
51.3 ± 13.5 214.1 ± 48.0 209.2 ± 130.4 47.5 ± 14.9 124.2 ± 40.0 40.9 ± 26.3 150.1 ± 34.9 101.2 ±
34.1 0.70 ± 0.3 94.6 ± 13.9
Range 25 - 83 138 - 369 56.1 - 679 23 - 87 48-212 11.0- 136 88-283 46 - 188 0.3 – 1.85 63 - 117 Hg- (Nl + Hl.chol +
Hl.TAG+ Hl) ( n =27) (female)
56.6 ± 11.5 192 ± 43.2 249.5 ± 122.2 40.7 ± 13.5 105.5 ± 32.6 49.2 ± 24.1 142.8 ± 25.3 97.0 ± 29.6 0.70 ± 0.22 195.6 ± 67.9
Rangec 26 - 81 109 - 280 64 - 556 23 - 82 37 - 181 13 - 109 99 - 198 36 - 158 0.21 – 1.13 124 - 418 Diff.d 5.3 -22.1 40.3 -6.8 -18.7 8.3 -7.3 -4.2 0 101h
% Diff.e 10 -10 19 -14 -15 20 -5 -4 0 10h
Table A7: Total plasma apoA-I, apoB, apoB/apoA-I ratio, and lipid profile of Hg-(Hl.chol + Hl.TAG + Hl.mixed) male subjects are compared with the corresponding age-matched Ng-(Hl.chol + Hl.TAG + Hl.mixed) male subjects in the upper half of the table. The lower half of the table compares the Hg-(Hl.chol + Hl.TAG + Hl.mixed) females group with Ng-(Hl.chol + Hl.TAG + Hl.mixed) females group. aFBG: fasting blood glucose, bMean ± SD , cRange, dDifference = (Hg) – (Nl), ePercent difference of means = {[(Hg) – (Ng)] / (Ng)} * 100 %,
hP < 0.001.
AI-Lp subclass
Ng-( Nl+ Hl.chol + Hl.TAG +Hl.mixed) (n = 38 )
(male) (29 – 77)f
Hg- (Nl +Hl.chol + Hl.TAG +Hl.mixed) (n = 25)
(male) (37 – 69)
Mean Diff.a
% Diff.b
Ng- (Nl + Hl.chol + Hl.TAG + Hl.mixed) ( n =30) (female)
(25 – 83)
Hg- (Nl + Hl.chol + Hl.TAG+Hl.mixed) ( n =27)
(female) (26 – 81)
Mean Diff.a
% Diff.
1 Not detected Not detected
Not detected 8.6 (n = 1) 8.6
2 8.7 ± 3.5c,d (n = 2)e 5.5 ± 3.2 (n = 2) -3.2 -37 10.7 ± 10.3 (n = 2) Not detected 10.7
3 8.4 ± 2.2 (n = 7) 4.9 ± 1.6 (n = 3) - 3.5g - 42g 5.4 ± 1.3 (n = 7) 7.9 ± 4.5 (n = 7) 2.5 46 4 25.0 ± 20.5 (n=15) 19.6 ± 10.9 (n = 12) -5.4 -22 15.5 ± 13.4 (n = 13) 16.8 ± 12.2 (n = 11) 1.3 8 5 16.0 ± 6.2 (n = 10) 17.6 ± 9.7 (n = 5) 1.6 10 11.7 ± 4.9 (n = 9) 18.8 ± 7.5 (n = 5) 7.1g 61g 6 26.6 ± 13.2 (n = 34) 27.3 ± 11.8 (n = 24) 0.7 3 30.8 ± 11.0 (n = 29) 31.6 ± 14.2 (n = 26) 0.8 3 7 22.0 ± 11.6 (n = 28) 22.9 ± 9.3 (n = 21) 0.9 4 23.3 ± 8.3 (n = 25) 26.7 ± 10.3 (n = 21) 3.4 15

International Journal of Lipid Research & Advances
Odeh MA, et al. Study of the Distribution of the Apolipoproteins A-I and A-Ii, Among Lipoprotein Subclasses in Plasma of Normo- and Hyperlipidemic Subjects. Int J Lipid Res Adv 2019, 1(1): 000103.
Copyright© Odeh MA, et al.
6
8 21.7 ± 10.0 (n = 23) 24.2 ± 13.4 (n = 14) 2.5 12 24.9 ± 11.5 (n = 16) 24.4 ± 10.5 (n = 18) -0.5 -2 9 24.8 ± 10.2 (n = 21) 23.3 ± 5.6 (n = 13) -1.5 -6 29.0 ± 10.5 (n = 16) 28.3 ± 8.0 (n = 8) -0.7 -2
10 22.8 ± 9.2 (n = 26) 23.6 ± 9.9 (n = 17) 0.8 4 24.9 ± 8.5 (n = 22) 26.9 ± 13.8 (n = 19) 2 8 11 21.8 ± 6.4 (n = 13) 21.6 ± 6.5 (n = 9) -0.2 -1 18.7 ± 4.7 (n = 11) 19.8 ± 8.7 (n = 10) 1.1 6 12 17.4 ± 6.3 (n = 28) 17.8 ± 9.1 (n = 20) 0.4 2 21.0 ± 11.5 (n = 24) 20.2 ± 8.3 (n = 20) -0.8 -4 13 12.2 ± 5.7 9.6 ± 3.9 - 2.6g - 21g 12.1 ± 6.4 9.4 ± 4.1 - 2.7g -22g
Table A8: aDifference = Hg- (Nl +Hl.chol + Hl.TAG +Hl.Mixed), male, or female - Ng-(Nl+ Hl.chol + Hl.TAG +Hl.Mixed), male, or female,
bPercent difference of
means = { [male (n = 25) – male (n = 38)] / male ( n = 38)} * 100 %,cMean ± SD, dvalues are in mg / dL , .eNumber of samples that contain this subclass.
fage range , gP < 0.05.
Subjects Age (year) Cholesterol
(mg/dL) TAGs
(mg/dL) HDL-C
(mg/dL) LDL-C
(mg/dL) VLDL-C
(mg/dL) apoA-I
(mg/dL) apoB
(mg/dL) apoB/ apoAI
FBa
(mg/dL) Ng-( Nl+ Hl.chol + Hl.TAG
+Hl.mixed) (n = 38 ) (male) 48.0 ± 13.8b
196.0 ± 53.8
232.8 ± 135.5
42.1 ± 15.8 108.5 ± 42.3 46.2 ± 27.1 137.8 ± 27.4 100.4 ± 36.8 0.74 ± 0.25 96.3 ± 12.7
Rangec 29 - 77 92 - 347 74 - 571 20 - 112 25 - 198 15 - 114 88 - 239 45 - 240 0.4 – 1.3 57 - 116 Ng-(Nl+Hl.chol + Hl.TAG+
Hl.mixed) (n=30) (female) 51.3 ± 13.5
214.1 ± 48.0
209.2 ± 130.4
47.5 ± 14.9 124.2 ± 40.0 40.9 ± 26.3 150.1 ±
34.9 101.2 ± 34.1 0.70 ± 0.3 94.6 ± 13.9
Rangec 25 - 83 138 - 369 56.1 - 679 23 - 87 48 - 212 11.0 - 136 88 - 283 46 - 188 0.3 – 1.85 63 - 117 Diff.d 3.3 18.1 -23.6 5.4 15.7 -5.3 12.3 0.8 -0.04 -1.7
% Diff.e 7 9 -10 13 15 -12 9 1 -5 -2 Hg-(Nl+Hl.chol + Hl.TAG + Hl.mixed) (n = 25) (male)
53.2 ± 8.3 203.9 ±
82.8 243.6 ± 112.5
37.7 ± 11.5 118 ± 77.7 48.6 ± 22.9 136.6 ±
27.5 101.8 ± 38.6 0.76 ± 0.26
182.6 ± 78.7
Range 37 - 69 117 - 544 76 - 470 23 - 82 55 - 455 15 - 94 85 - 210 54 - 228 0.4 – 1.3 120 - 449 Hg-(Nl +Hl.chol + Hl.TAG + Hl.mixed) (n =27)(female)
56.6 ± 11.5 192 ± 43.2 249.5 ± 122.2
40.7 ± 13.5 105.5 ±
32.6 49.2 ± 24.1
142.8 ± 25.3
97.0 ± 29.6 0.70 ± 0.22 195.6 ±
67.9 Rangec 26 - 81 109 - 280 64 - 556 23 - 82 37 - 181 13 - 109 99 - 198 36 - 158 0.21 – 1.13 124 - 418 Diff.d 3.4 -11.9 5.9 3 -12.5 0.6 6.2 -4.8 -0.06 13
% Diff.e 6 -6 2 8 -11 1 5 -5 -8 7
Table A9: Total plasma apoA-I, apoB, apoB/apoA-I ratio, and lipid profile of Ng-(Hl.chol + Hl.TAG + Hl.mixed) female subjects are compared with the corresponding age-matched Ng-(Hl.chol + Hl.TAG + Hl.mixed) male subjects in the upper half of the table. The lower half of the table compares the Hg- (Hl.chol + Hl.TAG + Hl.mixed) females group with Hg-(Hl.chol + Hl.TAG + Hl.mixed) males group aFBG :fasting blood glucose , bMean ± SD, cRange, dDifference = female – male, ePerc. Diff. of means = [(female – male ) / male ] * 100 %.

International Journal of Lipid Research & Advances
Odeh MA, et al. Study of the Distribution of the Apolipoproteins A-I and A-Ii, Among Lipoprotein Subclasses in Plasma of Normo- and Hyperlipidemic Subjects. Int J Lipid Res Adv 2019, 1(1): 000103.
Copyright© Odeh MA, et al.
7
AI-Lp subclass
Ng-( Nl+ Hl.chol + Hl.TAG +Hl.mixed) (n = 38 ) (male)
(29 – 77)f
Ng- (Nl + Hl.chol + Hl.TAG + Hl.mixed) ( n =30) (female)
(25 – 83)
Mean Diff.a
% Diff.b
Hg- (Nl +Hl.chol + Hl.TAG + Hl.mixed) (n = 25) (male)
(37 – 69)
Hg- (Nl + Hl.chol + Hl.TAG+ Hl.mixed) ( n =27) (female) (26 – 81)
Mean Diff.a
% Diff.b
1 Not detected Not detected
Not detected 8.6 (n = 1) 8.6
2 8.7 ± 3.5c,d (n =2)e 10.7 ± 10.3 (n = 2) 2 23 5.5 ± 3.2 (n = 2) Not detected 5.5
3 8.4 ± 2.2 (n = 7) 5.4 ± 1.3 (n = 7) - 3.3h - 38h 4.9 ± 1.6 (n = 3) 7.9 ± 4.5 (n = 7) 3 61 4 25.0 ± 20.5 (n=15) 15.5 ± 13.4 (n = 13) -9.5 -38 19.6 ± 10.9 (n = 12) 16.8 ± 12.2 (n = 11) -2.8 -14 5 16.0 ± 6.2 (n = 10) 11.7 ± 4.9 (n = 9) -4.3 -27 17.6 ± 9.7 (n = 5) 18.8 ± 7.5 (n = 5) 1.2 7 6 26.6 ± 13.2 (n =34) 30.8 ± 11.0 (n = 29) 4.2 16 27.3 ± 11.8 (n = 24) 31.6 ± 14.2 (n = 26) 4.3 16 7 22.0 ± 11.6 (n =28) 23.3 ± 8.3 (n = 25) 1.3 6 22.9 ± 9.3 (n = 21) 26.7 ± 10.3 (n = 21) 3.8 17 8 21.7 ± 10.0 (n =23) 24.9 ± 11.5 (n = 16) 3.2 15 24.2 ± 13.4 (n = 14) 24.4 ± 10.5 (n = 18) 0.2 0.8 9 24.8 ± 10.2 (n =21) 29.0 ± 10.5 (n = 16) 4.2 17 23.3 ± 5.6 (n = 13) 28.3 ± 8.0 (n = 8) 5 22
10 22.8 ± 9.2 (n = 26) 24.9 ± 8.5 (n = 22) 2.1 9 23.6 ± 9.9 (n = 17) 26.9 ± 13.8 (n = 19) 3.3 14 11 21.8 ± 6.4 (n = 13) 18.7 ± 4.7 (n = 11) -3.1 -14 21.6 ± 6.5 (n = 9) 19.8 ± 8.7 (n = 10) -1.8 -8 12 17.4 ± 6.3 (n = 28) 21.0 ± 11.5 (n = 24) 3.6 21 17.8 ± 9.1 (n = 20) 20.2 ± 8.3 (n = 20) 2.4 14 13 12.2 ± 5.7 12.1 ± 6.4 -0.1 0.8 9.6 ± 3.9 9.4 ± 4.1 -0.2 -2
Table A10: The apoA-I content of AI-Lp subclasses of Ng-(Hl.chol + Hl.TAG + Hl.mixed) female subjects are compared with the corresponding age-matched of Ng-(Hl.chol + Hl.TAG + Hl.mixed) male subjects in the left half of the table. The right half of the table compares the Hg-(Hl.chol + Hl.TAG + Hl.mixed) females group with Hg-(Hl.chol + Hl.TAG + Hl.mixed) males group aDifference = female – male , bPercent difference of means = [ female – male ] / male * 100 %, cMean ± SD, dvalues are in mg / dL. eNumber of samples that
contain this subclass., fage range, hP< 0.01.
Subjects Ng-Hl.chol ( n =17)
(M+F)
Age (year)
Cholesterol (mg/dL)
TAGs(mg/dL) HDL-C
(mg/dL) LDL-C
(mg/dL) VLDL-C
(mg/dL) apoA-I
(mg/dL) apoB
(mg/dL) apoB/apoAI
FBa
(mg/dL)
50.2 ± 15.8b
230.8 ± 27.8 135.0 ± 54.0 61.8 ± 19.3 142.3 ± 25.5 26.7 ± 10.7 169.3 ± 40.8 106.4 ± 20.0 0.66 ± 0.22 95.9 ± 17.6
Rangec Ng - Hl.TAG 19 - 79 202 - 302 56 - 200 39 - 112 109 - 200 Nov-39 114 - 239 83 - 149 0.4 – 1.3 57 - 116
( n = 14)(M+F) 50.4 ± 12.3
176.0 ± 19.5 308.5 ± 107.2 33.7 ± 6.4 82.9 ± 28.4 59.8 ± 21.7 129.1 ± 18.1 94.9 ± 15.3 0.75 ± 0.14 101.9 ±
14.9 Rangec 31 - 75 146 - 199 205 - 565 20 - 45 25 - 115 40 - 113 88 - 155 66 - 121 0.6 – 1.1 72 - 119 Diff.d 0.2 - 54.8h 173.5h - 28.1h - 59.4h 33.1 h - 40.2h - 11.5g 0.09 6
% Diff.e < 1 - 24h 129h - 46h - 42h 124.0h - 24h - 11g 13 6 Ng-Hl.chol ( n =17)
(M+F) 50.2 ± 15.8b
230.8 ± 27.8 135.0 ± 54.0 61.8 ± 19.3 142.3 ± 25.5 26.7 ± 10.7 169.3 ± 40.8 106.4 ± 20.0 0.66 ± 0.22 95.9 ± 17.6
Range c 19 - 79 202 - 302 56 - 200 39 - 112 109 - 200 Nov-39 114 - 239 83 - 149 0.4 – 1.3 57 - 116

International Journal of Lipid Research & Advances
Odeh MA, et al. Study of the Distribution of the Apolipoproteins A-I and A-Ii, Among Lipoprotein Subclasses in Plasma of Normo- and Hyperlipidemic Subjects. Int J Lipid Res Adv 2019, 1(1): 000103.
Copyright© Odeh MA, et al.
8
Ng- Hl.mixed (n = 20) (M+F)
45.8 ± 12.3
252.1 ± 43.6 342.1 ± 127.5 36.9 ± 5.6 148.0 ± 35.3 67.9 ± 25.7 141.0 ± 26.9 138.0 ± 35.3 0.99 ± 0.27 98.2 ± 12.1
Range c 29 - 83 201 - 369 202 - 679 23 – 43 85 - 212 40 - 136 88 - 208 79 - 240 0.7 – 1.9 78 - 118 Diff.d -4.4 21.3 207.1h - 24.9h 5.7 41.2h - 28.3f 31.6h 0.33h 2.3
% Diff.e -10 8 61h - 68h 4 61h - 20f 23h 33h 2
Table A11: Total plasma apoA-I, apoB, apoB/apoA-I ratio, and lipid profile of Ng-Hl.TAG subjects are compared with the corresponding age- matched Ng-Hl.chol subjects in the upper half of the table. The lower half of the table compares the Ng- Hl.mixed) group with Ng-Hl.chol group. aFBG : fasting blood glucose, bMean ± SD, cRange, dDifference = (Ng – H.TAG) – (Ng – H. chol), or, (Ng – Hl) - (Ng – H.chol),
ePerc. Diff. of means ={[(Ng – H.TAG)
– (Ng – H.chol)] / (Ng – H.chol)} * 100 % , fP < 0.05g P < 0.01, hP < 0.001.
AI-Lp subclass Ng-Hl.chol. ( n = 17)
(19 – 79)f Ng - Hl.TAG ( n = 14)
(31 – 75) Mean Diff.a
% Diff.b
Ng-Hl.chol. ( n = 17) (19 – 79)
Ng-Hl.mixed (n = 20) (29 – 83)
Mean Diff.a
% Diff.b
1 Not detected Not detected
Not detected Not detected
2 Not detected 3.5 (n = 1) 3.5
Not detected 10.8± 5.2c,d(n = 4)e 10.8
3 5.9 ± 1.7c,d (n = 4)e 6.9 ± 2.9(n = 5) 1 17 5.9 ± 1.7 (n = 4) 6.7 ±3.2 (n = 6) 0.8 14 4 30.1 ± 29.1 (n = 7) 21.7 ± 12.7 (n =8) -8.4 -28 30.1 ± 29.1 (n = 7) 18.0 ± 10.1 (n =11) -12.1 -40 5 19.5 ± 6.7(n = 4) 14.2 ± 9.8 (n = 2) -5.3 -27 19.5 ± 6.7 (n = 4) 16.6 ± 12.8 (n = 8 ) -2.9 -15 6 37.2 ± 15.8 (n = 15) 26.9 ± 9.2 (n =12) -10.3 -28 37.2 ± 15.8 (n = 15) 27.6 ± 14.9 (n = 20) -9.6 -26 7 30.0 ± 6.3 (n = 13) 17.9 ± 4.5 (n =12) - 12.1h - 40h 30.0 ± 6.3 (n = 13) 18.7 ± 6.7 (n = 11) - 11.3g - 38g 8 32.7 ± 12.9 (n = 8) 14.9 ± 3.6 (n = 7) - 17.8h - 54h 32.7 ± 12.9 (n = 8) 20.1 ± 6.2 (n = 14) - 12.6h - 39h 9 31.1 ± 11.2 (n = 11) 19.1 ± 7.1 (n = 8) - 12 g - 39g 31.1 ± 11.2 (n = 11) 26.0 ± 11.1 (n = 10) -5.1 -16
10 26.6 ± 7.8 (n = 11) 24.1 ± 8.5 (n =11) -2.5 -9 26.6 ± 7.8 (n = 11) 23.1 ± 9.1 (n = 14) -3.5 -13 11 19.3 ± 1.6 (n = 7) 19.4 ± 3.4 (n = 5) 0.1 1 19.3 ± 1.6 (n = 7) 20.3 ± (n = 9) 1 5 12 23.4 ± 10.6 (n = 12) 13.7 ± 5.8 (n =13) - 9.7h - 42h 23.4 ± 10.6 (n = 12) 19.5 ± 10.3 (n = 14) -3.9 -17 13 14.4 ± 7.1 10.0 ± 3.5 - 4.4g - 31g 14.4 ± 7.1 11.6 ± 4.5 -2.8 -19
Table A12: The apoA-I content of AI-Lp subclasses of Ng-Hl.TAG subjects are compared with the corresponding age-matched of Ng-Hl.chol subjects in the left half of the table. The right half of the table compares the Ng-Hl.mixed group with Ng-Hl.chol group aDifference = (Ng – Hl.TAG) – (Ng – Hl.chol), or (Ng – Hl.mixed) – (Ng – Hl.chol)
bPercent difference of means = {[ (Ng – Hl.TAG) – (Ng – Hl.chol) ] / (Ng – Hl.chol)} * 100 %, cMean ± SD, dvalues are in mg / dL,
eNumber of samples that
contain this subclass, fage range , gP < 0.05, hP< 0.01.

International Journal of Lipid Research & Advances
Odeh MA, et al. Study of the Distribution of the Apolipoproteins A-I and A-Ii, Among Lipoprotein Subclasses in Plasma of Normo- and Hyperlipidemic Subjects. Int J Lipid Res Adv 2019, 1(1): 000103.
Copyright© Odeh MA, et al.
9
Subjects Age (year) Cholesterol
(mg/dL) TAGs (mg/dL)
HDL-C (mg/dL)
LDL-C (mg/dL)
VLDL-C (mg/dL)
apoA-I (mg/dL)
apoB (mg/dL)
apoB/ apoAI
FBa
(mg/dL) Ng – Hl.TAG ( n = 14)(M+F) Range c
50.4 ± 12.3b
31 - 75 176 ± 19.5 146 - 199
308.5±107.2 205 - 565
33.7 ± 6.4 82.9 ± 28.4 59.8 ± 21.7 129.1 ± 18.1 94.9 ± 15.3 0.75 ± 0.14 101.9 ±
14.9
20 - 45 25 - 115 40 - 113 88 - 155 66 - 121 0.6 – 1.1 72 - 119
Ng-Hl.mixed (n = 20) (M+F)
45.8 ± 12.3 252.1 ± 43.6 342.1 ± 127.5 36.9 ± 5.6 148.0 ±
35.3 67.9 ± 25.7
141.0 ± 26.9
138.0 ± 35.3 0.99 ± 0.27 98.2 ± 12.1
Range c 29 – 83 201 – 369 202 – 679 23 – 43 85 – 212 40 – 136 88 – 208 79 – 240 0.7 – 1.9 78 – 118 Diff. d -4.6 76.1h 33.6 3.2 65.1h 8.1 11.9 43.1h 24g -3.7
% Diff. e -10 30h 10 9 44h 12 8 31h 23g -4 Ng- (Hl.chol + Hl.TAG +
Hl.mixed) ( n = 43)(M+F)
45.5 ± 10.7 223.4 ± 43.4 264.6 ± 121.3 42.4 ± 16.4 128.6 ± 43.3 52.5 ± 24.3 143.9 ± 33.1 115.6 ± 30.8 0.83 ± 0.26 96.4 ± 13.9
Range c 19 - 64 146 - 347 75 - 571 20 - 112 25 - 212 15 - 114 88 - 239 66 - 240 0.38 – 1.85 57 - 118 Hg- (Hl.chol + Hl.TAG+
Hl.mixed)(n = 28)(M+F) 50.9 ± 9.4 230.4 ± 87.8 367.7 ± 282.5 36.6 ± 12.1
120.0 ± 76.0
73.2 ± 57.2 137.3 ±
24.2 110.6 ± 37.6 0.81 ± 0.23
217.2 ± 81.3
Range 26 - 69 135 - 544 181 - 1754 23 - 82 37 - 455 36 - 351 99 - 210 54 - 228 0.36 – 1.3 124 -449 Diff. 5.4 7 103.1f -5.8 -8.6 20.7 f -6.6 -5 -0.02 120.8h
% Diff. 12 3 39f -14 -7 39f -5 -4 -2 125h
Table A13: Total plasma apoA-I, apoB, apoB/apoA-I ratio, and lipid profile of Ng-Hl.mixed subjects are compared with the corresponding age- matched Ng-Hl.TAG subjects in the upper half of the table. The lower half of the table compares the Hg-(Hl.chol + Hl.TAG + Hl.mixed) group with Ng-(Hl.chol + Hl.TAG + Hl.mixed) group. aFBG : fasting blood glucose, bMean ± SD .cRange, dDifference = (Ng – Hl) - (Ng – H.TAG),
ePercent difference of means ={[(Ng – H.TAG) – (Ng – Hl)] / (Ng – Hl)}
* 100 %fP < 0.05 g P < 0.01 , hP < 0.001.
AI-Lp
subclass Ng - Hl.TAG ( n = 14)
(31 – 75) Ng-Hl.mixed (n = 20)
(29 – 83)f Mean Diff.a
% Diff.b
Hg- (Hl.chol +Hl.TAG + Hl.mixed)(n = 28) (26 – 69) 8.6 (n = 1)
Ng - (Hl.chol + Hl.TAG + Hl.mixed)( n = 43) (19 – 64)
Mean Diff.a
% Diff.b
1 Not detected Not detected
Not detected
2 3.5 (n = 1) 10.8± 5.2c, d (n =4)e 7.3
4.5 ± 1.7 (n =2) 6.4 ± 2.9 (n = 5) 1.9 42 3 6.9 ± 2.9 (n = 5) 6.7 ±3.2 (n = 6) -0.2 -3 5.4 ± 1.6 (n =7) 7.6 ± 2.7 (n =10) 2.2 41 4 21.7 ± 12.7 (n = 8) 18.0 ± 10.1 (n =11) -3.7 -21 19.3 ± 13.3 (n =11) 22.8 ± 19.4 (n = 22) 3.5 18 5 14.2 ± 9.8 (n = 2) 16.6 ± 12.8 (n = 8 ) 2.4 15 14.2 ± 9.5 (n =7) 13.7 ± 6.6 ( n = 9) -0.5 -4 6 26.9 ± 9.2 (n =12) 27.6 ± 14.9 (n = 20) 0.7 3 30.0 ± 12.7 (n = 24) 29.4± 14.4 (n = 36) -0.6 -2 7 17.9 ± 4.5 (n = 12) 18.7 ± 6.7 (n = 11) 0.8 4 24.6 ± 10.1 (n = 21) 22.1 ± 10.9 (n = 30) -2.5 -10 8 14.9 ± 3.6 (n = 7) 20.1 ± 6.2 (n = 14) 5.2 26 23.4 ± 11.9 (n = 20) 23.0 ± 11.2 (n = 24) -0.4 -2 9 19.1 ± 7.1 (n = 8) 26.0 ± 11.1 (n = 10) 6.9 27 24.8 ± 5.6 (n = 14) 23.6 ± 8.9 (n = 22) -1.2 -5
10 24.1 ± 8.5 (n = 11) 23.1 ± 9.1 (n = 14) -1 -4 23.8 ± 8.9 (n = 18) 24.6 ± 8.0 (n =31) 0.8 3
International Journal of Lipid Research & Advances
Odeh MA, et al. Study of the Distribution of the Apolipoproteins A-I and A-Ii, Among Lipoprotein Subclasses in Plasma of Normo- and Hyperlipidemic Subjects. Int J Lipid Res Adv 2019, 1(1): 000103.
Copyright© Odeh MA, et al.
10
11 19.4 ± 3.4 (n = 5) 20.3 ± (n = 9) 0.9 4 18.2 ± 7.4 (n = 11) 20.3 ± 4.6 (n = 10) 2.1 12 12 13.7 ± 5.8 (n = 13) 19.5 ± 10.3 (n = 14) 5.8 30 15.8 ± 7.1 (n = 18) 17.4 ± 6.7 (n = 28) 1.6 10 13 10.0 ± 3.5 11.6 ± 4.5 1.6 14 8.2 ± 3.8 12.1 ± 5.7 3.9h 48h
Table A14: The apoA-I content of AI-Lp subclasses of Ng-Hl.mixed subjects are compared with the corresponding age-matched of Ng-Hl.TAG subjects in the left half of the table. The right half of the table compares the Ng-(Hl.chol + Hl.TAG + Hl.mixed) group with Hg-(Hl.chol + Hl.TAG + Hl.mixed) group. aDifference =(Ng – Hl.mixed) - (Ng – Hl.TAG) , bPercent difference of means = {[(Ng – Hl.mixed) - (Ng – Hl.TAG) ] / (Ng – Hl.TAG)} * 100 %, cMean ± SD,
dvalues are in mg / dL., eNumber of samples that contain this subclass, fage range , hP< 0.01.
Appendix B
AII-Lp Subclass
Normolipidemic (M + F) n = 57 (21 – 77)f
Hyperlipidemic (M + F) n = 51 (19 – 69)
Diff.a %
Diff.b Normoglycemic (M + F) n =
72 (19 – 69) Hyperglycemic (M + F) n =
36 (37 – 77) Diff.a
% Diff.b
I Not detected 3.1 ± 1.8 (n = 2) 3.1
3.1 ± 1.8 (n = 2) Not detected
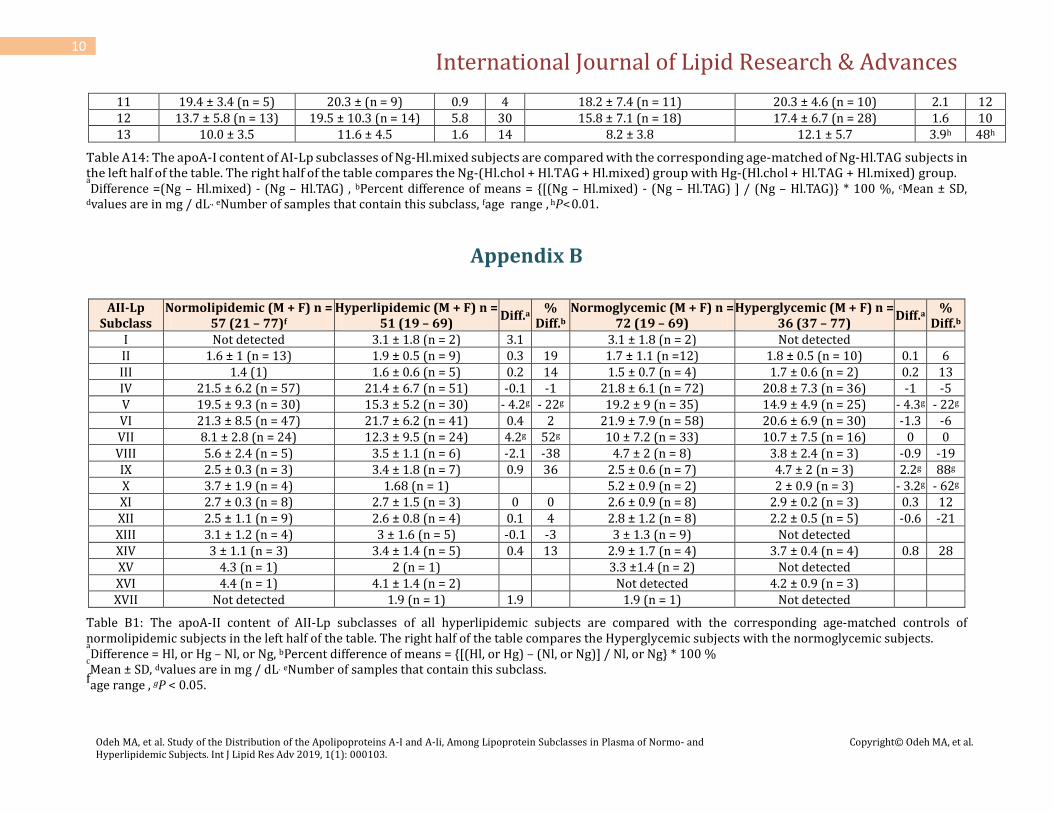
II 1.6 ± 1 (n = 13) 1.9 ± 0.5 (n = 9) 0.3 19 1.7 ± 1.1 (n =12) 1.8 ± 0.5 (n = 10) 0.1 6 III 1.4 (1) 1.6 ± 0.6 (n = 5) 0.2 14 1.5 ± 0.7 (n = 4) 1.7 ± 0.6 (n = 2) 0.2 13 IV 21.5 ± 6.2 (n = 57) 21.4 ± 6.7 (n = 51) -0.1 -1 21.8 ± 6.1 (n = 72) 20.8 ± 7.3 (n = 36) -1 -5 V 19.5 ± 9.3 (n = 30) 15.3 ± 5.2 (n = 30) - 4.2g - 22g 19.2 ± 9 (n = 35) 14.9 ± 4.9 (n = 25) - 4.3g - 22g VI 21.3 ± 8.5 (n = 47) 21.7 ± 6.2 (n = 41) 0.4 2 21.9 ± 7.9 (n = 58) 20.6 ± 6.9 (n = 30) -1.3 -6 VII 8.1 ± 2.8 (n = 24) 12.3 ± 9.5 (n = 24) 4.2g 52g 10 ± 7.2 (n = 33) 10.7 ± 7.5 (n = 16) 0 0 VIII 5.6 ± 2.4 (n = 5) 3.5 ± 1.1 (n = 6) -2.1 -38 4.7 ± 2 (n = 8) 3.8 ± 2.4 (n = 3) -0.9 -19 IX 2.5 ± 0.3 (n = 3) 3.4 ± 1.8 (n = 7) 0.9 36 2.5 ± 0.6 (n = 7) 4.7 ± 2 (n = 3) 2.2g 88g X 3.7 ± 1.9 (n = 4) 1.68 (n = 1)
5.2 ± 0.9 (n = 2) 2 ± 0.9 (n = 3) - 3.2g - 62g
XI 2.7 ± 0.3 (n = 8) 2.7 ± 1.5 (n = 3) 0 0 2.6 ± 0.9 (n = 8) 2.9 ± 0.2 (n = 3) 0.3 12 XII 2.5 ± 1.1 (n = 9) 2.6 ± 0.8 (n = 4) 0.1 4 2.8 ± 1.2 (n = 8) 2.2 ± 0.5 (n = 5) -0.6 -21 XIII 3.1 ± 1.2 (n = 4) 3 ± 1.6 (n = 5) -0.1 -3 3 ± 1.3 (n = 9) Not detected
XIV 3 ± 1.1 (n = 3) 3.4 ± 1.4 (n = 5) 0.4 13 2.9 ± 1.7 (n = 4) 3.7 ± 0.4 (n = 4) 0.8 28 XV 4.3 (n = 1) 2 (n = 1)
3.3 ±1.4 (n = 2) Not detected
XVI 4.4 (n = 1) 4.1 ± 1.4 (n = 2)
Not detected 4.2 ± 0.9 (n = 3)
XVII Not detected 1.9 (n = 1) 1.9
1.9 (n = 1) Not detected
Table B1: The apoA-II content of AII-Lp subclasses of all hyperlipidemic subjects are compared with the corresponding age-matched controls of normolipidemic subjects in the left half of the table. The right half of the table compares the Hyperglycemic subjects with the normoglycemic subjects. aDifference = Hl, or Hg – Nl, or Ng, bPercent difference of means = {[(Hl, or Hg) – (Nl, or Ng)] / Nl, or Ng} * 100 %
cMean ± SD, dvalues are in mg / dL. eNumber of samples that contain this subclass.
fage range , gP < 0.05.

International Journal of Lipid Research & Advances
Odeh MA, et al. Study of the Distribution of the Apolipoproteins A-I and A-Ii, Among Lipoprotein Subclasses in Plasma of Normo- and Hyperlipidemic Subjects. Int J Lipid Res Adv 2019, 1(1): 000103.
Copyright© Odeh MA, et al.
11
AII-Lp
Subclass Ng-Nl (n =44 )(M+F) (21 –
77)f Ng-(Hl.chol +Hl.TAG) (n=
23) (M+F) Diff.a
% Diff.b
Ng-Nl (n=26) (M+F) (33 -77)
Hg-Nl ( n = 13 )(M+F) (41 – 77)
Diffa %
Diff. I Not detected 1.83 (n=1)
Not detected Not detected
II 1.6 ± 1.1c,d (n=10)e 2.01 (n=2) 0.4 25 1.9 ± 1.5 (n =5) 1.7 ± 0.7 (n = 4) -0.2 -11 III Not detected 1.8 (n=2)
Not detected Not detected
IV 21.5 ± 6.0 (n = 44) 21.4 ± 6.7 (n=23) -0.1 -1 22.5 ± 6.1 21.6 ± 7.1 (n=13) -0.9 -4 V 19.7 ± 10.4 (n = 23) 15.8 ± 6.4 (n=12) -3.9 -20 19.6 ± 7.4 (n=13) 17.2 ± 6.7 (n=8) -2.4 -12 VI 21.8 ± 8.7 (n = 36) 21.6 ± 6.0 (n =19) -0.2 -1 21.5 ± 8.1 (n=21) 19.5 ± (n=11) -2 -9 VII 8.2 ± 3.0 (n = 19) 13.9 ± 10.4 (n=12) 5.7g 70g 7.2 ± 2.0 (n=10) 8.7 ± 3.0 (n = 6) 1.5 21 VIII 5.4 (n = 4) 4.3 (n = 3) -1.1 -20 5.4 (n=4) 6.6 (n=1)
IX 2.5 (n = 3) 2.2 (n = 3) -0.3 -12 2.5 (n=3) Not detected
X 5.2 (n = 2) Not detected
5.9 (n=1) 2.2 (n=2)
XII 2.6 (n = 5) 4.2 (n = 1)
2.4 (n=3) 2.9 (n=3) 0.5 21
XII 2.7 ± 1.2 (n = 7) 3.3 (n = 2) 0.6 22 2.5 (n=4) 2.01 (n=2) -0.5 -20 XIII 3.1 (n = 4) 3.3 (n = 4) 0.2 7 2.2 (n=2) Not detected
XIV 1.8 (n = 1) 4.7 (n = 2) 2.9 161 Not detected 3.5 (n=2)
XV 4.3 (n = 1) Not detected
Not detected Not detected
XVI Not detected Not deyected
Not detected 4.4 (n=1)
XVII Not detected 1.9 (n = 1)
Not detected Not detected
Table B2: The apoA-II content of AII-Lp subclasses of Ng-(Hl.chol + Hl.TAG) subjects are compared with the corresponding age-matched controls of Ng-Nl subjects in the left half of the table. The right half of the table compares the Hg-Nl subjects with the Ng-Nl subjects. aDifference = [Ng – (Hl.chol + Hl.TAG)], or, [Hg – Nl] – (Ng- Nl) ,bPercent difference of means, cMean ± SD, dvalues are in mg / dL.,
eNumber of samples that contain this subclass. fage range ,gP < 0.05.
AII-Lp Subclass
Ng- (Nl+Hl.mixed) (female) n=23 (28 – 70)f
Hg-(Nl+Hl) (male) n=17 (37 – 69)
Diff.a % Diff.b Ng-(Nl+Hl.mixed) (male) n=26 (29 – 77) 4.3( n = 1)
Hg-(Nl+Hl.mixed) (male) n=17 (37 – 69) 1.83 ( n =
1) Diff.a
% Diff
I Not detected 1.83 (n = 1)
II 2.4 (n =3 ) 1.6 (n = 4) -0.8 -33 1.5 ± 0.6 (n = 5) 1.6 (n = 4) 0.1 7 III 0.84 (n = 1) 1.26 (n = 1)
1.26 (n = 1) 1.26 (n = 1)
IV 22.7 ± 6.0c,d (n = 23)e 21.7 ± 8.4 (n =17) -1 -4 22.1 ± 6.3 (n = 26) 21.7 ± 8.4 (n = 17) -0.4 -2 V 20.9 ± 7.0 (n = 9) 12.3 ± 2.3 (n = 7) -7.2h - 34h 18.0 ± 6.8 (n = 13) 12.3 ± 2.3 (n = 7) -5.7g - 32g VI 20.9 ± 5.4 (n = 18) 20.6 ± 8.1 (n = 15) -0.3 -1 22.6 ± 8.2 (n = 21) 20.6 ± 8.1 (n = 15) -2 -9 VII 13.4 ± 10.7 (n = 11) 11.8 ± 11.9 (n = 6) -1.6 -12 7.6 ± 3.9 (n = 12) 11.8 ± 11.9 (n = 6) 4.2 55 VIII 3.3 (n = 4) Not detected
6.1 (n = 4) Not detected
IX 1.54 (n = 1) 3.5 (n = 1)
2.7 ± 0.5 (n = 6) 3.5 (n = 1)

International Journal of Lipid Research & Advances
Odeh MA, et al. Study of the Distribution of the Apolipoproteins A-I and A-Ii, Among Lipoprotein Subclasses in Plasma of Normo- and Hyperlipidemic Subjects. Int J Lipid Res Adv 2019, 1(1): 000103.
Copyright© Odeh MA, et al.
12
X 5.85 (n = 1) 2.4 (n = 2)
Not detected 2.4 (n = 2)
XII 1.8 (n = 2) 2.8 (n = 2) 1 56 3.03 ± (n=3) 2.8 (n = 3) -0.18 -6 XII 3.3 (n = 3) 2.01(n = 3) -1.29g - 39g 2.4 ± (n=3) 2.01 ± (n = 3)
XIII 2.8 ± 1.7 (n = 5) 2.4 ( n = 1)
Not detected 2.4 (n = 1)
XIV 3.2 (n = 3) 3.5 (n = 2) 0.3 9 Not detected 3.5 (n = 2)
XV Not detected Not detected
2.3 (n = 1) Not detected
XVI Not detected Not detected
Not detected Not detected
XVII Not detected Not detected
1.9 (n = 1) Not detected
Table B3: The apoA-II content of AII-Lp subclasses of Hg-(Nl + Hl.mixed) male subjects are compared with the corresponding age- matched of Ng-(Nl + Hl.mixed) female subjects in the left half of the table. The right half of the table compares the Hg-(Nl + Hl.mixed) male subjects with the Ng-(Nl + Hl.mixed) male subjects aDifference = male – female or, male ,bPercent difference of means = {(male – female) / female } * 100 %,cMean ± SD, dvalues are in mg/dL. eNumber of
samples that contain this subclass. fage range , gP < 0.05., hP < 0.01.
AII-Lp Subclass Ng-(Nl+Hl.mixed) (female) N=23 (28 – 70) Hg-(Nl+Hl.mixed) (female) n= 22 (39 – 66) Diffa % Diffb I Not detected Not detected
II 2.4 (n = 3) 2.1 ± 0.3(n = 5) -0.3 -13 III 0.84 (n = 1) 2.07 (n = 1)
IV 22.7 ±6.0c,d (n = 23)e 20.4 ± 6.5 (n =22) -2.2 -10 V 20.9 ± 7.0 (n = 9) 15.9 ± 5.3 (n = 19) -5g - 24g VI 20.9 ± 5.4 (n =18) 21.1 ± 6.8 (n = 17) 0.2 1 VII 13.4 ± 10.7(n =11) 10.2 ± 3.5 ( n = 10) -3.2 -24 VIII 3.3 (n = 4) 3.8 (n = 3) 0.5 15 IX 1.54 (n = 1) 5.2 (n = 2)
X 5.85 (n = 1) 1.4 (n = 1)
XII 1.8 (n = 2) 2.8 (n = 1)
XII 3.3 (n = 3) 2.4 ( n = 2) -0.9 -27 XIII 2.8 ± 1.7 ( n = 5) Not detected
XIV 3.2 (n = 3) 3.8 (n = 2) 0.6 19 XV Not detected Not detected
XVI Not detected 4.2 (n = 3)
Table B4: The apoA-II content of AII-Lp subclasses of Hg-(Nl + Hl.mixed) female subjects are compared with the corresponding age-matched of Ng-(Nl + Hl.mixed) female subjects. In the left half of the table. aDifference = female (Hg) – female (Ng), bPercent difference of means, cMean ± SD, dvalues are in mg / dL.
eNumber of samples that contain this subclass. fage
range gP < 0.05.

International Journal of Lipid Research & Advances
Odeh MA, et al. Study of the Distribution of the Apolipoproteins A-I and A-Ii, Among Lipoprotein Subclasses in Plasma of Normo- and Hyperlipidemic Subjects. Int J Lipid Res Adv 2019, 1(1): 000103.
Copyright© Odeh MA, et al.
13
Supplementary Figures
Supplementary figure s1 Related to Figure 1: Distribution of AI-Lp subclasses in several hyperlipidemic subjects. The plasma was run in 4-25% gPAGE, followed by immunoblotting against anti-apoA-I. Lanes A & B: normolipidemic subjects. Lanes C & D Hyperglycemic-Hyperlipidemic subjects. Lane F: Normoglycemic-Hypercholesterolemic subject. Lane G: Normoglycemic- Hypertriacylglycerols subject. Lane E: molecular mass standared. The numbers 1-5 represent: 1 = urease hexamer (545,000), 2 = urease trimer (272,000), 3 = bovine serum albumin (BSA) dimer (133,000), 4 = BSA monomer (66,500), 5 = ova albumin (45,000).
Supplementary Figure S2: Distribution of AI-Lp subclasses in samples from hyperlipidemic subjects. The plasma was run in 4-25% gPAGE, followed by immunoblotting adainst anti-apoA-I. Lane B: notmoglycemic- hyperlipidemic (sever) subject. Lane C: normoglycemic- hyperlipidemic (moderate) subject. Lane D: hyperglycemic-hypertriacylglycerols. Lane E: hyperglycemic –normolipidemic subject. Lane A: molecular massstandards.Thenumbers1-5represent: 1 = urease hexamer (545,000), 2 = urease trimer (272,000), 3 = bovine serum albumin (BSA) dimer (133,000), 4 = BSA monomer (66,500), 5 = ova albumin (45,000).

International Journal of Lipid Research & Advances
Odeh MA, et al. Study of the Distribution of the Apolipoproteins A-I and A-Ii, Among Lipoprotein Subclasses in Plasma of Normo- and Hyperlipidemic Subjects. Int J Lipid Res Adv 2019, 1(1): 000103.
Copyright© Odeh MA, et al.
14
Supplementary Figure 3: Distribution of AI-Lp and AII-Lp subclasses in a subject with normoglycemica and mixed hyperlipidemia (Ng-Hl.mixed). the plasma was run in 4-25% gPAGE, followed by immunoblotting as follow: Lanes A & B: the plasma was immunoblotted against anti-apoA-I. Lanes C & D: the plasma was immunoblotted against anti-apoA-II. The smallest AII-Lp subclass I of relative molecular mass of 50,000 is appeared without corresponding LpA-I. The numbers 1-5 represent molecular mass standard: 1 = urease hexamer (545,000), 2 = urease trimer (272,000), 3 = bovine serum albumin (BSA) dimer (133,000), 4 = BSA monomer (66,500), 5 = ova albumin (45,000).
Supplementary Figure 4: Distribution of AI-Lp and AII-Lp subclasses in a subject with normoglycemia-normplipidemia (Ng-Nl). The plasma was run in 4-25% gPAGE, followed by immunoblotting as follow: Lanes A & B: the plasma was immunoblotted against anti- apoA-I. Lanes C & D: the plasma was immunoblotted against anti-apoA-II. The numbers 1-5 represent molecular mass standard: 1 = urease hexamer (545,000), 2 = urease trimer (272,000), 3 = bovine serum albumin (BSA) dimer (133,000), 4 = BSA monomer (66,500), 5 = ova albumin (45,000).

International Journal of Lipid Research & Advances
Odeh MA, et al. Study of the Distribution of the Apolipoproteins A-I and A-Ii, Among Lipoprotein Subclasses in Plasma of Normo- and Hyperlipidemic Subjects. Int J Lipid Res Adv 2019, 1(1): 000103.
Copyright© Odeh MA, et al.
15
Supplementary Figure s5: Distribution of AI-Lp and AII-Lp subclasses in a subject with severe hyperglycemia and moderate mixed hyperlipedemia. The plasma was run in 4-25% gPAGE followed by immunoblotting as follows: Lanes A & B: the plasma was immunoblotted against anti-apoA-I. Lanes C & D: the plasma was immunoblotted against anti-apoA-II. Lp(AI+AII) of relative molecular mass of 70,000 is appeared. The numbers 1-5 represent molecular mass standard: 1 = urease hexamer (545,000), 2 = urease trimer (272,000), 3 = bovine serum albumin (BSA) dimer (133,000), 4 = BSA monomer (66,500), 5 = ova albumin (45,000).
Supplementary Figure s6: Distribution of AI-Lp and AII-Lp subclasses in a 65 years old male with normoglycemia and slightly elevated TAGs. The plasma was run in 4-25% gPAGE, followed by immunoblotting as follows: Lanes A & B: the plasma was immunoblotted against anti-apoA-I. Lanes C & D: the plasma was immunoblotted against anti-apoA-II. As shown in the figure, the AII-Lp subclass XVII of highest molecular mass of 900,000 with its corresponding AI-Lp. The numbers 1-5 represent molecular mass standard: 1 = urease hexamer (545,000), 2 = urease trimer (272,000), 3 = bovine serum albumin (BSA) dimer (133,000), 4 = BSA monomer (66,500), 5 = ova albumin (45,000).

International Journal of Lipid Research & Advances
Odeh MA, et al. Study of the Distribution of the Apolipoproteins A-I and A-Ii, Among Lipoprotein Subclasses in Plasma of Normo- and Hyperlipidemic Subjects. Int J Lipid Res Adv 2019, 1(1): 000103.
Copyright© Odeh MA, et al.
16
Subjects Age (year) Cholesterol
(mg/dL) TAGs
(mg/dL) HDL-C
(mg/dL) LDL-C
(mg/dL) VLDL-C
(mg/dL) apoA-I
(mg/dL) apoB
(mg/dL) apoB/apoAI
ratio FBa
(mg/dL) All normolipidemic (M +
F) n = 56 47.0 ± 17.7b 151.4 ± 25.2 112.1 ± 40.7 41.7 – 11.1 88.7 ± 23.4 21.8 - ± 7.8 131.1 ± 22.6 68.8 ± 17 0.55 ± 0.18 118.2 ± 52
Rangec 21- 77 92 - 198 46 - 199 23 - 70 42 – 134 Sep-39 85 - 184 32 - 98 0.21 – 1.01 74 - 334 All hyperlipidemic (M +
F) n = 85 50.5 ± 12.6 223.4 ± 62 298.9 ± 200 41.8 ± 15.6 122.8 ± 55.1 59.4 ± 40.1 144.6 ± 31.4 112.5 ± 32.8 0.8 ± 0.25
139.4 ± 72.9
Rangec 19 - 83 135 - 544 56 - 1754 20- 112 25 – 455 11 - 351 88 - 239 54 - 240 0.37 – 1.9 57 - 449 Diff.d 3.5 72g 186.8g 0.1 34.1g 37.6g 13.5f 43.7g 0.25g 21.2
% Diff.e 7 48g 167g < 1 38 g 172g 10f 64g 45g 18
Table 7a: Total plasma apoA-I, apoB, apoB/apoA-I ratio, and lipid profile of all hyperlipidemic subjects are compared with the corresponding age-matched controls of normolipidemic. FBG: fasting blood glucose, Mean ± SD, Range, Difference = Hl – Nl. Percent difference of means = [(Hl – Nl) / Nl] * 100 % fP < 0.01 gP < 0.001
AI-Lp subclass Normolipidemic n = 56 (21- 77)f Hyperlipidemic n = 85 (19 – 83) Mean Diff.a % Diff.b 1 Not detected 8.6 (n = 1) 8.6
2 Not detected 7.9 ± (n = 7) 7.9
3 6.1 ± 1.4c,d (n = 9)e 6.9 ± 3.4 (n = 21) 0.8 13 4 10.4 ± 5.5 (n = 15) 20.6 ± 16.5 (n= 49) 10.2g 98g 5 16 ± 6.2 (n = 16) 16.7 ± 9.9 (n = 21) 0.7 4 6 26.2 ± 9 (n = 55) 29.2 ± 13.7 (n= 80) 3 11 7 22.6 ± 9.3 (n = 50) 22.8 ± 9.8 (n = 64) 0.2 1 8 23.4 ± 7.7 (n = 29) 23.4 ± 11.1 (n= 55) 0 0 9 26.7 ± 8.8 (n = 24) 25.8 ± 9.2 (n = 47) -0.9 -3
10 25.1 ± 13.1 (n = 38) 24 ± 8.3 (n = 58) -1.1 -4 11 21.8 ± 11.6 (n = 13) 20 ± 6.2 (n = 37) -1.8 -8 12 20.4 ± 7.4 (n = 48) 18.4 ± 9.4 (n = 62) -2 10 13 10.9 ± 5.7 10.6 ± 5.4 -0.2 -2
Table 7b: The apoA-I content of AI-Lp subclasses of all hyperlipidemic subjects are compared with the corresponding age-matched controls of normolipidemic subjects. Difference = Hl – Nl Percent difference of means = [(Hl – Nl) / Nl] * 100 % Mean ± SD, values are in mg / dL Number of samples that contain this subclass. age range gP < 0.05.

International Journal of Lipid Research & Advances
Odeh MA, et al. Study of the Distribution of the Apolipoproteins A-I and A-Ii, Among Lipoprotein Subclasses in Plasma of Normo- and Hyperlipidemic Subjects. Int J Lipid Res Adv 2019, 1(1): 000103.
Copyright© Odeh MA, et al.
17
Subjects Age (year) Cholesterol
(mg/dL) TAGs
(mg/dL) HDL-C
(mg/dL) LDL-C
(mg/dL) VLDL-C
(mg/dL) apoA-I
(mg/dL) apoB
(mg/dL) apoB/ apoAI
FBa
(mg/dL) All normoglycemic (M + F)
n = 92 48.2 ± 13.8b 190.3 ± 53.2
195.5 ± 130.4
42.7 ± 14.5 108.8 ± 40 38.6 ± 26.1 137.6 ± 30.2 93.4 ± 35.3 0.69 ± 0.27 95.4 ± 13.9
Rangec 27 - 83 92 - 369 46 - 679 20- 112 25 – 212 9 - 136 85 - 239 32 - 240 0.22 – 1.9 57 - 120 All hyperglycemic (M + F)
n = 49 52.8 ± 9.5 203.4 ± 75
279.5 ± 243.9
39.9 ± 12.7 110 ±60.9 55.5 ± 48.9 142.3 ± 26.4 98.6 ± 34.4 0.71 ± 0.24 197.8 ±
73.3 Range 26 - 77 109 - 544 64-1754 23 - 82 37 – 455 13 - 351 99 - 210 36 - 228 0.21 – 1.3 121- 449 Diff.d 4.6 13.1 85g -2.8 1.2 16.9g 4.7 5.2 0.02 102.4h
% Diff.e 10 7 43g -7 1 44g 3 6 3 10h
Tables 8a: Total plasma apoA-I, apoB, apoB/apoA-I ratio, and lipid profile of all hyperglycemic subjects are compared with the corresponding age-matched controls of normoglycemic. FBG: fasting blood glucose, Mean ± SD, values are in mg/dL Range, Difference = Hg – Ng Percent difference of means = [Hg - Ng) / Ng] * 100 % g P < 0.01 h P < 0.001
AI-Lp subclass Normoglycemic n = 92 Hyperglycemic n = 49 Mean Diff.a % Diff.b 1 Not detected 8.6 (n = 1) 8.6
2 9.3 ± 5.6c,d (n = 5)e 4.5 ± 1.7 (n = 2) -4.8 -52 3 6.6 ± 2.2 (n = 20) 6.7 ± 4.1 (n = 10) 0.1 2 4 17.2 ± 16 (n = 40) 19.8 ± 14 (n = 24) 2.6 15 5 16.1 ± 8.5 (n = 26) 17 ± 8.6 (n = 11) 0.9 6 6 27.1 ± 11.4 (n =88) 29.8 ± 13.1 (n=47) 2.7 10 7 21.4 ± 9.1 (n = 74) 25.4 ± 9.9 (n = 39) 4f 19f 8 22.8 ± 9.6 (n = 51) 24.4 ± 10.7 (n=33) 1.6 7 9 26.6 ± 9.8 (n = 52) 24.8 ± 6.2 (n = 19) -1.8 -7
10 23.9 ± 9.1 (n = 64) 25.5 ± 12.8 (n=32) 1.6 7 11 20.8 ± 8.1 (n = 30) 20 ± 7.6 (n = 20) -0.8 -4 12 19.5 ± 8.7 (n = 74) 18.9 ± 8.6 (n = 36) -0.6 -3 13 10.9 ± 5.9 10 ± 4.8 -0.9 -8
Table 8b: The apoA-I content of AI-Lp subclasses of all hyperglycemic subjects are compared with the corresponding age-matched controls of normoglycemic subjects. Difference = Hg – Ng Percent difference of means = {[(Hg –Ng) / Ng] * 100 % Mean ± SD, values are in mg / dL Number of samples that contain this subclass. fP < 0.05.

International Journal of Lipid Research & Advances
Odeh MA, et al. Study of the Distribution of the Apolipoproteins A-I and A-Ii, Among Lipoprotein Subclasses in Plasma of Normo- and Hyperlipidemic Subjects. Int J Lipid Res Adv 2019, 1(1): 000103.
Copyright© Odeh MA, et al.
18
Subjects Age (year) Cholesterol
(mg/dL) TAGs
(mg/dL) HDL-C
(mg/dL) LDL-C
(mg/dL) VLDL-C
(mg/dL) apoA-I
(mg/dL) apoB
(mg/dL apoB/ apoAI
FBa (mg/dL)
Ng-Nl (n =42) 40.1 ± 16.7 b 149.5 ± 25.4 109.2 ± 43.5
86.2 ± 21.9 21.2 ± 8.3
67 ± 16.9 0.54 ± 0.2
Ng-Hl mixed (n = 20) 45.8 ± 12.3 252.1 ± 43.6 342.1 ± 127.5
148 ± 35.3 67.9 ± 25.7
138 ± 35.3 0.99 ± 0.27
% Diff.c 14 69g 213g
72g 220g
106g 83g
Ng-Nl ( n =35) 45.9 ± 16.4 151.6 ± 25.8
43.4 ± 11.3 85.7 ± 22.2
131.5 ± 22.6 66.5 ± 17 0.52 ± 0.2
(M+F)Ng Hl.chol ( n =17) (M+F) 50.2 ± 15.8 230.8 ± 27.8
61.8 ± 19.3 142.3 ± 25.5
169.3 ± 40.8 106.4 ± 20 0.66 ± 0.22
% Diff. c 9 52g
42g 66g
29g 60g 27e
Ng - Nl ( n = 32) (M+F) 47.8 ± 15.8b 154.0 ± 24.5 118.8 ± 42.7 43.5 ± 11.2
23.0 ± 8.1
67.7 ± 15.6 0.53 ± 0.16
Ng - Hl.TAG ( n = 14) (M+F) 50.4 ± 12.3 176 ± 19.5 308.5 ± 107.2 33.7 ± 6.4
59.8 ± 21.7
94.9 ± 15.3 0.75 ± 0.14
% Diff. 5.4 14e 160g - 23e
160g
40g 42g
Ng-Nl (n =42 ) 40.1 ± 16.7 149.5 ± 25.4 109.2 ± 43.5
86.2 ± 21.9 21.2 ± 8.3 128.7 ± 22.2 67 ±16.9 0.54 ± 0.2
Ng - (Hl.cho+ Hl.TAG+Hl.mixed)(n= 43) 45.5 ± 10.7 223.4 ± 43.4 264.6 ± 121.3
128.6 ± 43.3 52.5 ± 24.3 143.9 ± 33.1 115.6 ± 30.8 0.83 ± 0.26
% Diff.c 14 49g 142g
49g 148g 12f 73g 54g
Ng-Nl (n=26) 55.3 ± 11.9 b
96.8 ± 13.9 Hg-Nl ( n = 13 ) 60.8 ± 10.7
198.3 ± 50.5
% Diff.c 10
105g Ng – Nl (n = 33) 46.3 ± 17 148.2 ± 26.1 111.8 ± 43.2 44.0 ± 11.4 82.1 ± 21.9 21.6 ± 8.2
64.3 ± 16.8 0.52 ± 0.19 90.6 ± 13.1
Hg-(Hl.cho+ Hl.TAG+Hl. mixed) (n=28) 50.9 ± 9.4 230.4 ± 87.8 367.7 ± 282.5 36.6 ± 12.1 120.0 ± 76 73.2 ± 57.2
110.6 ± 37.6 0.81 ± 0.23 217.2 ± 81.3 % Diff. 10 56g 229g - 17f 46f 239g
72g 56g 140g
Ng-( Nl+ Hl.chol + Hl.TAG +Hl)(n=38) (male)
48.0 ± 13.8 b
96.3 ± 12.7
Hg- (Nl +Hl.chol+Hl.T AG +Hl) (n = 25) (male)
53.2 ± 8.3
182.6 ± 78.7
% Diff.c 11
90 g Ng- (Nl + Hl.chol +Hl.TAG + Hl) ( n =30)
(female) 51.3 ± 13.5
94.6 ± 13.9
Hg- (Nl +Hl.chol +Hl.TAG+ Hl)( n =27) (female)
56.6 ± 11.5
195.6 ± 67.9
% Diff. c 10
107g Ng-( Nl+ Hl.chol + Hl.TAG+Hl.mixed)
(n=38) (male) 48.0 ± 13.8 b
Ng-(Nl+Hl.chol + Hl.TAG+ Hl.mixed) ( n
=30) (female) 51.3 ± 13.5
% Diff.c 7
Hg-(Nl+Hl.chol + Hl.TAG + Hl.mixed) (n
= 25) (male) 53.2 ± 8.3

International Journal of Lipid Research & Advances
Odeh MA, et al. Study of the Distribution of the Apolipoproteins A-I and A-Ii, Among Lipoprotein Subclasses in Plasma of Normo- and Hyperlipidemic Subjects. Int J Lipid Res Adv 2019, 1(1): 000103.
Copyright© Odeh MA, et al.
19
Hg-(Nl +Hl.chol +Hl.TAG + Hl.mixed) (n =27) (female)
56.6 ± 11.5
% Diff.c 6
Ng Hl.chol ( n =17) 50.2 ± 15.8 b 230.8 ± 27.8 135.0 ± 54 61.8 ± 19.3 142.3 ± 25.5 26.7 ± 10.7 169.3 ± 40.8 106.4 ± 20
Ng - Hl.TAG ( n = 14) 50.4 ± 12.3 176.0 ± 19.5 308.5 ± 107.2 33.7 ± 6.4 82.9 ± 28.4 59.8 ± 21.7 129.1 ± 18.1 94.9 ± 15.3
% Diff.c < 1 - 24g 129g - 46g - 42g 124.0g - 24g - 11e
Ng Hl.chol ( n =17) 50.2 ± 15.8 b
135.0 ± 54 61.8 ± 19.3
26.7 ± 10.7 169.3 ±40.8 106.4 ±20 0.66 ± 0.22
NgHl.mixed (n = 20) 45.8 ± 12.3
342.1 ± 127.5 36.9 ± 5.6
67.9 ± 25.7 141.0 ± 26.9 138.0 ± 35.3 0.99 ± 0.27
% Diff.c -10
61g - 68g
61g - 20f 23g 33g
Ng – Hl.TAG ( n = 14) 50.4 ± 12.3 b 176 ± 19.5
82.9 ± 28.4
94.9 ± 15.3 0.75 ± 0.14
NgHl.mixed (n = 20) 45.8 ± 12.3 252.1 ± 43.6
148.0 ± 35.3
138.0 ±35.3 0.99 ± 0.27
% Diff.c -10 30g
44g
31g 23e
Table 9a: The apoA-I, apoB, apoB/apoA ratio, and lipid profile, of the groups subjects which are compared with the corresponding age-matched group. The components that are differ significantly are shown below in this table, the detailed information of the compared groups are present in appendix A (Tables A 1,3,5,7,9,11,13). FBG = Fasting Blood Glucose, mean ± SD c percent difference of the mean = [(next group – first group) / first group] * 100% eP < 0.05, fP < 0.01, gP < 0.001.
AI-Lp subclasses Subjects 1 2 3 4 5 6 7 8 9 12 13
Ng-Nl (n = 42 ) N.Da N.D 6.8 ± 0.9 b (n =
8)c 7.7 ± 1.9 (n = 10)
9.4 ± 4.6
Ng-Hl.mixed (n = 20) N.D 10.8± 5.2 (n = 4) 6.7 ±3.2 (n = 6) 18.0 ± 10.1 (n = 11)
11.6 ± 4.5 % Diff.d
-2 134f
40e
Ng-Nl ( n = 35) N.D N.D 6.8 ± 0.7 (n = 7) 9.2 ± 2.9 (n = 9) 25.9 ± 9.1 (n
= 34) 20.1 ± 7.4 (n = 29)
23.4 ± 8.5 (n =18)
10.3 ± 6.1
Ng-Hl.chol. ( n = 17) N.D N.D 5.9 ± 1.7 (n = 4) 30.1 ± 29.1 (n = 7) 37.2 ± 15.8
(n = 15) 30.0 ± 6.3 (n = 13)
32.7 ± 12.9 (n = 8
14.4 ± 7.1
% Diff.d
-13 238e 44f 49f 40e
40e
Ng - Nl ( n = 32) N.D N.D 6.8 ± 0.9 (n = 7) 9.2 ± 3.1 (n = 8)
22.9 ±8.8(n =16)
26.3 ±8 (n =19)
20.7 ±7.6(n =26)
Ng - Hl.TAG ( n = 14) N.D 3.5 (n = 1) 6.9 ± 2.9 (n = 5) 21.7 ± 12.7 (n = 8)
14.9 ± 3.6 (n = 7)
19.1 ± 7.1 (n = 8)
13.7 ± 5.8 (n=13)
% Diff.d
1.5 136e
-35e -27e -34f
Ng - Nl ( n = 42) N.D N.D 6.8 ± 0.9 (n = 8) 7.7 ± 1.9 (n =10)
24.6 ± 8.4 (n = 41)
20.9 ± 7.7 (n = 35)
9.4 ± 4.6

International Journal of Lipid Research & Advances
Odeh MA, et al. Study of the Distribution of the Apolipoproteins A-I and A-Ii, Among Lipoprotein Subclasses in Plasma of Normo- and Hyperlipidemic Subjects. Int J Lipid Res Adv 2019, 1(1): 000103.
Copyright© Odeh MA, et al.
20
Ng -(Hl.chol+ Hl.TAG+Hl) ( n = 43)
N.D 6.4 ± 2.9 (n = 5) 7.6 ± 2.7 (n =10) 22.8 ± 19.4 (n = 22)
29.4± 14.4 (n = 36)
17.4 ± 6.7 (n = 28)
12.1 ± 5.7
% Diff.d
12 196e
20e
-17e 29f
Ng-Nl ( n = 26) N.D N.D 6.8 ± 0.95 (n = 6) 11.5 ± 6.1 (n = 7)
21.6 ± 8.1 (n =22)
9.4 ± 4.4
Hg-Nl ( n = 13 ) N.D N.D 4.16 (n = 1) 11.7 ± 6.4 (n = 4)
28.3 ± 10.1 (n =12)
12.1 ± 4.8
% Diff.d
-39 2
31e
29e
Ng-Nl (n = 33) N.D N.D 7.0 ± 1.2 (n = 3) 8.7 ± 3.7 (n = 9)
24.1 ± 7.8 (n = 30)
19.4 ± 7.1 (n =30)
21.2 ± 7.5 (n = 25)
10.5 ± 6.1
Hg- (Hl.chol+ Hl.TAG+Hl) (n = 28)
8.6 (n = 1) 4.5 ± 1.7 (n = 2) 5.4 ± 1.6 (n = 7) 19.3 ± 13.3 (n = 11)
30.0 ± 12.7 (n = 24)
24.6 ± 10.1 (n=21)
15.8 ± 7.1 (n = 18)
8.2 ± 3.8
% Diff.d
-23 122e
25e 27e
- 26e - 22e Ng-( Nl+ Hl.chol + Hl.TAG+Hl.mixed)
(n=38)(male) N.D 8.7 ± 3.5 (n=2) 8.4 ± 2.2 (n = 7) 25.0 ± 20.5 (n=15)
12.2 ± 5.7
Hg- (Nl +Hl.chol + Hl.TAG+Hl.mixed)
(n=25)(male) N.D 5.5 ± 3.2 (n = 2) 4.9 ± 1.6 (n = 3) 19.6 ± 10.9 (n=12)
9.6 ± 3.9
% Diff.d
-37 - 42e - 22
- 21e Ng- (Nl + Hl.chol + Hl.TAG+Hl.mixed)
(n=30)(female) N.D
10.7 ± 10.3 (n = 2)
5.4 ± 1.3 (n = 7) 15.5 ± 13.4 (n=13) 11.7 ± 4.9 (n
= 9) 12.1 ± 6.4
Hg- (Nl + Hl.chol + Hl.TAG+Hl.mixed) ( n =27)
(female) 8.6 (n = 1) N.D 7.9 ± 4.5 (n = 7) 16.8 ± 12.2 (n=11)
18.8 ± 7.5 (n = 5)
9.4 ± 4.1
% Diff.d
46 8 61e
- 22e Ng-( Nl+ Hl.chol +
Hl.TAG+Hl.mixed) (n = 38 ) (male)
N.D 8.7 ± 3.5 (n = 2) 8.4 ± 2.2 (n = 7) 25.0 ± 20.5 (n =15)
Ng- (Nl + Hl.chol + Hl.TAG+Hl.mixed) ( n =30)
(female) N.D
10.7 ± 10.3 (n = 2)
5.4 ± 1.3 (n = 7) 15.5 ± 13.4 (n =13)
% Diff.d
23 - 38f - 38
Hg- (Nl +Hl.chol + Hl.TAG+Hl.mixed) (n = 25)
(male) N.D 5.5 ± 3.2 (n = 2) 4.9 ± 1.6 (n = 3) 19.6 ± 10.9 (n =12)
Hg- (Nl + Hl.chol + 8.6 (n = 1) N.D 7.9 ± 4.5 (n = 7) 16.8 ± 12.2 (n =11)
International Journal of Lipid Research & Advances
Odeh MA, et al. Study of the Distribution of the Apolipoproteins A-I and A-Ii, Among Lipoprotein Subclasses in Plasma of Normo- and Hyperlipidemic Subjects. Int J Lipid Res Adv 2019, 1(1): 000103.
Copyright© Odeh MA, et al.
21
Hl.TAG+Hl.mixed) ( n =27) (female) % Diff.d
61 -14
Ng-Hl.chol. ( n = 17) N.D N.D 5.9 ± 1.7 (n = 4) 30.1 ± 29.1 (n = 7)
30.0 ± 6.3 (n =13)
32.7± 12.9 (n = 8)
31.1± 11.2 (n =11)
23.4 ± 10.6(n =12)
14.4 ±7.1
Ng - Hl.TAG ( n = 14) N.D 3.5 (n =1) 6.9 ± 2.9 (n = 5) 21.7 ± 12.7 (n = 8)
17.9 ± 4.5 (n =12)
14.9 ± 3.6 (n =7)
19.1 ± 7.1 (n = 8)
13.7 ± 5.8 (n =13)
10.0 ± 3.5
% Diff.d
17 -28
- 40f - 54f 39e - 42f -31e
Ng-Hl.chol. ( n = 17) N.D N.D 5.9 ±1.7 (n = 4) 30.1 ± 29.1 (n = 7)
30.0 ± 6.3 (n =13)
32.7± 12.9 (n =8)
Ng-Hl.mixed (n = 20) N.D 10.8± 5.2 (n = 4) 6.7 ±3.2 (n = 6) 18.0 ± 10.1 (n=11)
18.7 ± 6.7 (n =11)
20.1 ± 6.2 (n =14)
% Diff.d
14 -40
- 38e - 39f
Ng - Hl.TAG ( n = 14) N.D 3.5 (n = 1) 6.9 ± 2.9 (n = 5) 21.7 ± 12.7 (n = 8)
Ng-Hl.mixrd (n = 20) N.D 10.8± 5.2 (n = 4) 6.7 ±3.2 (n = 6) 18.0 ± 10.1 (n =11)
% Diff.d
-3 -21
Hg- (Hl.chol +Hl.TAG+Hl.mixed) (n = 28)
8.6 (n = 1) 4.5 ± 1.7 (n =2) 5.4 ± 1.6 (n = 7) 19.3 ± 13.3 (n = 11)
Ng - (Hl.chol + Hl.TAG+ Hl.mixed) ( n = 43)
N.D 6.4 ± 2.9 (n = 5) 7.6 ± 2.7 (n =10) 22.8 ± 19.4 (n = 22)
% Diff.d
42 41 18
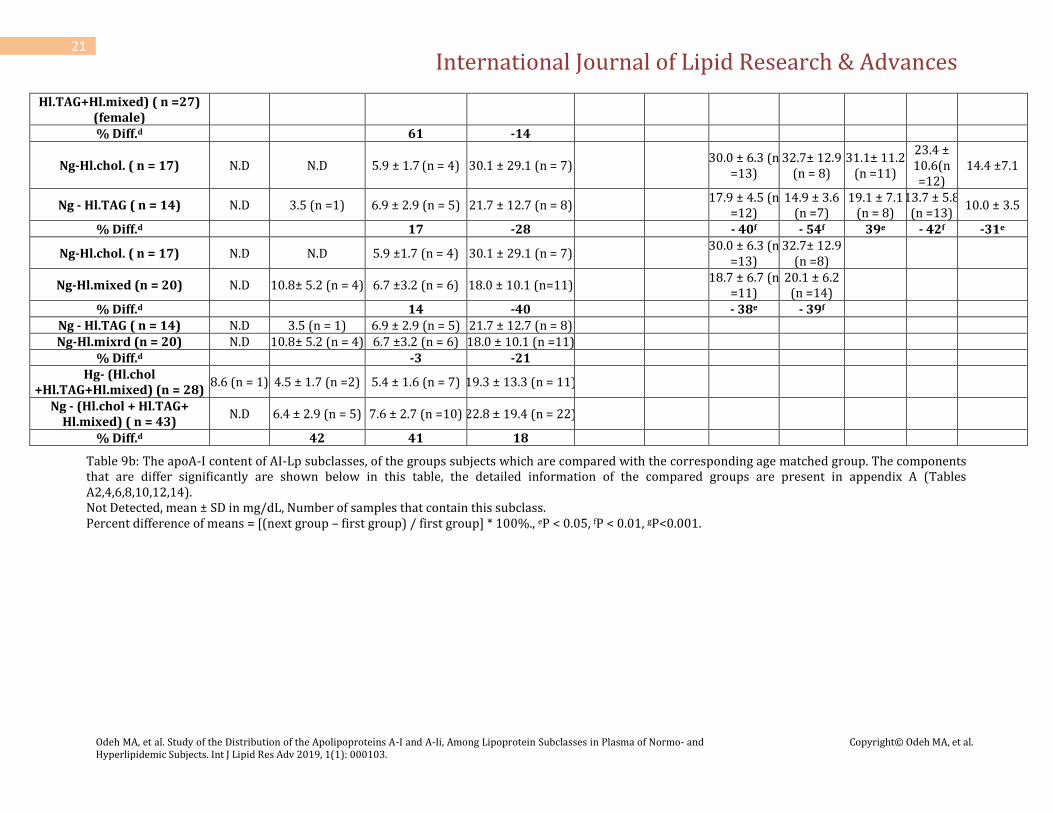
Table 9b: The apoA-I content of AI-Lp subclasses, of the groups subjects which are compared with the corresponding age matched group. The components that are differ significantly are shown below in this table, the detailed information of the compared groups are present in appendix A (Tables A2,4,6,8,10,12,14). Not Detected, mean ± SD in mg/dL, Number of samples that contain this subclass. Percent difference of means = [(next group – first group) / first group] * 100%., eP < 0.05, fP < 0.01, gP<0.001.


![Lipid-Based Nanoparticles: Application and Recent Advances ... · cancer treatment [1]. Nanoparticles present sizes between 1 and 1000 nm and they improve drug bioavailability as](https://static.fdocuments.us/doc/165x107/6004b7a03e26d32e95490970/lipid-based-nanoparticles-application-and-recent-advances-cancer-treatment.jpg)