International Journal of Mathematical Combinatorics, Vol. 2, 2012

Influence of Adulteration Agents on Physico-
Chemical and Spectral Profile of Different Honey
Types
Mircea Oroian, Vlad Olariu, and Sorina Ropciuc Faculty of Food Engineering, Stefan cel Mare University, 13
th University Street, 720229, Suceava, Romania
Email: [email protected]
Abstract—The aim of this study is to evaluate the influence of
some adulteration agents (fructose and hydrolysed inulin syrup)
on physico-chemical parameters (pH, electrical conductivity,
water activity and CIEL*a*b* parameters) and Raman spectra
of some honey types (acacia, tilia and polyfloral) from the North
East part of Romania. The physico-chemical parameters (pH,
water activity, electrical conductivity and color) of the honey
adulterated varied depending on the degree of substitution of
honey by adulteration agent. Unlike physico-chemical analyses
and color analysis, which determine only the degree of
falsification of honey, Raman analysis enables identification of
falsification agent based on specific vibrational bands recorded.
Index Terms–honey, physico-chemical parameters, spectral
profile, adulteration
I. INTRODUCTION
Honey is defined as the natural sweet substance
produced by bees [1]. Food fraud, in particular,
adulteration, is a practice which is in steady progress.
Adulteration consists in adding external chemicals in
food that contain naturally similar substances.
Adulterated honey appeared on the world market in the
1970s, when corn syrup and high fructose were
introduced in honey. Honey has a high potential to be
deliberately adulterated because it has a high cost, being
produced in large fluctuations of weather and its
harvesting is particularly sensitive. Although honey
adulteration is not harmful to health, it affects adversely
the market growth by influencing consumer’s confidence.
Lately, certified quality of honey has become
increasingly important for consumers, producers and
regulators so that the European Commission encourages
the use of analytical methods and modern classics to
determine the authenticity of honey [2].
Honey is subjected to cheap adulteration with
sweeteners such as aspartame, saccharin, cyclamates,
molasses, corn syrups, high fructose corn syrup, invert
syrup and inulin syrup with high fructose. This form of
adulteration is made use of in order to correct the sweet
taste after water addition and to maximize the profit.
Honey adulterated by sugar or inverted sugar cannot be
easily detected by direct analysis of sugars, because its
components are the main components of honey and so the
Manuscript received March 18, 2017; revised August 30, 2017.
altered product may also have similar physical properties
as the natural honey. Depending on their origin, added
sugars are divided into two types: C3 and C4. Sugars and
sucrose are of C3 type, while the sugar cane sugar and
corn starch hydrolysis products are of C4. There have
been proposed various methods for detecting counterfeit
honey sugar, but most of them do not have utility in
practice. Corn and sugar cane metabolism is on the Hatch
- Slack or C4 pathway. As a result, sugar syrups derived
from cereals shall report a 13
C / 12
C, expressed as the
value of G, which is different from the honey value,
where the sugar is derived via a C3 pathway. The G value
for C4 syrups C4 value is lost to 10 ‰, while the average
value of honey is 25.4‰. The original method of
measuring the ratio 13C / 12C13
C / 12
C has been
improved by the introduction of the intern protein test.
The method currently used enables the detection of honey
with 7-10% syrups from sugar cane or corn. In addition to
measuring the ratio 13
C / 12
C, the NMR method with
deuterium can be decisive in achieving greater certainty
in the interpretation of measurement ratio 13C / 12C [2].
The aim of this study is to investigate the possibility to
discriminate the adulterated honey based on the physico-
chemical parameters (pH, electrical conductivity, water
activity and CIEL*a*b* parameters) and Raman spectra.
II. MATERIALS AND METHODS
A. Materials
Honey samples (tilia, acacia and polyfloral) have been
purchased from local beekeepers of Suceava County.
The samples have been liquefied at 50°C prior the
decrystallization process and normalised at 60 °Brix by
water to reduce the spectral interference normally
occurring in sugar concentration. The adulteration agents
(fructose and hydrolysed inulin syrup) were prepared at
60 °Brix, too. The honeys were adulterated in different
concentration as follows: 10%, 20%, 30%, 40% and 50%,
respectively.
B. Physico-Chemical Properties Determination
Moisture content, pH, refraction index, Brix
concentration and electrical conductivity have been
determined using the Harmonised methods of the
international honey commission [3]. Water activity was
International Journal of Food Engineering Vol. 4, No. 1, March 2018
©2018 International Journal of Food Engineering 66doi: 10.18178/ijfe.4.1.66-70
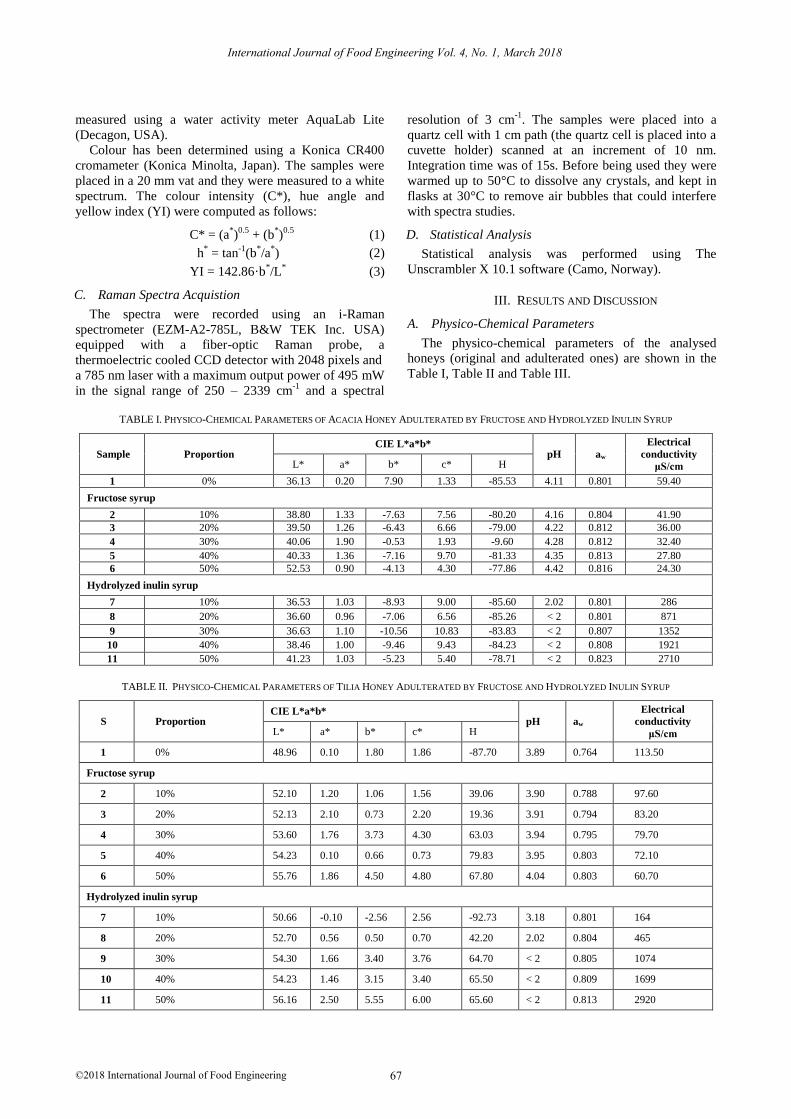
measured using a water activity meter AquaLab Lite
(Decagon, USA).
Colour has been determined using a Konica CR400
cromameter (Konica Minolta, Japan). The samples were
placed in a 20 mm vat and they were measured to a white
spectrum. The colour intensity (C*), hue angle and
yellow index (YI) were computed as follows:
C* = (a*)
0.5 + (b
*)
0.5 (1)
h* = tan
-1(b
*/a
*) (2)
YI = 142.86·b*/L
* (3)
C. Raman Spectra Acquistion
The spectra were recorded using an i-Raman
spectrometer (EZM-A2-785L, B&W TEK Inc. USA)
equipped with a fiber-optic Raman probe, a
thermoelectric cooled CCD detector with 2048 pixels and
a 785 nm laser with a maximum output power of 495 mW
in the signal range of 250 – 2339 cm-1
and a spectral
resolution of 3 cm-1
. The samples were placed into a
quartz cell with 1 cm path (the quartz cell is placed into a
cuvette holder) scanned at an increment of 10 nm.
Integration time was of 15s. Before being used they were
warmed up to 50°C to dissolve any crystals, and kept in
flasks at 30°C to remove air bubbles that could interfere
with spectra studies.
D. Statistical Analysis
Statistical analysis was performed using The
Unscrambler X 10.1 software (Camo, Norway).
III. RESULTS AND DISCUSSION
A. Physico-Chemical Parameters
The physico-chemical parameters of the analysed
honeys (original and adulterated ones) are shown in the
Table I, Table II and Table III.
TABLE I. PHYSICO-CHEMICAL PARAMETERS OF ACACIA HONEY ADULTERATED BY FRUCTOSE AND HYDROLYZED INULIN SYRUP
Sample Proportion CIE L*a*b*
pH aw
Electrical
conductivity
μS/cm L* a* b* c* H
1 0% 36.13 0.20 7.90 1.33 -85.53 4.11 0.801 59.40
Fructose syrup
2 10% 38.80 1.33 -7.63 7.56 -80.20 4.16 0.804 41.90
3 20% 39.50 1.26 -6.43 6.66 -79.00 4.22 0.812 36.00
4 30% 40.06 1.90 -0.53 1.93 -9.60 4.28 0.812 32.40
5 40% 40.33 1.36 -7.16 9.70 -81.33 4.35 0.813 27.80
6 50% 52.53 0.90 -4.13 4.30 -77.86 4.42 0.816 24.30
Hydrolyzed inulin syrup
7 10% 36.53 1.03 -8.93 9.00 -85.60 2.02 0.801 286
8 20% 36.60 0.96 -7.06 6.56 -85.26 < 2 0.801 871
9 30% 36.63 1.10 -10.56 10.83 -83.83 < 2 0.807 1352
10 40% 38.46 1.00 -9.46 9.43 -84.23 < 2 0.808 1921
11 50% 41.23 1.03 -5.23 5.40 -78.71 < 2 0.823 2710
TABLE II. PHYSICO-CHEMICAL PARAMETERS OF TILIA HONEY ADULTERATED BY FRUCTOSE AND HYDROLYZED INULIN SYRUP
S Proportion CIE L*a*b*
pH aw
Electrical
conductivity
μS/cm L* a* b* c* H
1 0% 48.96 0.10 1.80 1.86 -87.70 3.89 0.764 113.50
Fructose syrup
2 10% 52.10 1.20 1.06 1.56 39.06 3.90 0.788 97.60
3 20% 52.13 2.10 0.73 2.20 19.36 3.91 0.794 83.20
4 30% 53.60 1.76 3.73 4.30 63.03 3.94 0.795 79.70
5 40% 54.23 0.10 0.66 0.73 79.83 3.95 0.803 72.10
6 50% 55.76 1.86 4.50 4.80 67.80 4.04 0.803 60.70
Hydrolyzed inulin syrup
7 10% 50.66 -0.10 -2.56 2.56 -92.73 3.18 0.801 164
8 20% 52.70 0.56 0.50 0.70 42.20 2.02 0.804 465
9 30% 54.30 1.66 3.40 3.76 64.70 < 2 0.805 1074
10 40% 54.23 1.46 3.15 3.40 65.50 < 2 0.809 1699
11 50% 56.16 2.50 5.55 6.00 65.60 < 2 0.813 2920
International Journal of Food Engineering Vol. 4, No. 1, March 2018
©2018 International Journal of Food Engineering 67

TABLE III. PHYSICO-CHEMICAL PARAMETERS OF POLYFLORAL HONEY ADULTERATED BY FRUCTOSE AND HYDROLYZED INULIN SYRUP
Sample Proportion CIAL*a*b*
pH aw
Electrical
conductivity
μS/cm L* a* b* c* H
1 0% 37.90 0.30 3.40 3.40 85.10 3.72 0.806 107.10
Fructose syrup
2 10% 38.73 2.16 8.80 9.10 76.26 3.82 0.806 91.50
3 20% 41.70 1.43 8.03 8.16 80.16 3.83 0.807 79.20
4 30% 42.30 1.90 9.90 10.10 79.06 3.84 0.810 67.90
5 40% 42.33 1.03 7.53 7.52 82.10 3.86 0.810 57.30
6 50% 43.30 0.26 3.33 3.33 85.56 3.88 0.811 46.60
Hydrolyzed inulin syrup
7 10% 38.73 1.33 3.66 3.90 69.43 2.82 0.808 178
8 20% 38.96 1.40 3.36 3.63 67.46 2.01 0.810 501
9 30% 39.83 1.93 4.76 4.96 69.36 < 2 0.810 1045
10 40% 40.16 3.46 6.30 7.26 61.63 < 2 0.814 1565
11 50% 40.80 1.36 4.46 4.66 73.26 < 2 0.816 2250
B. Water Activity
Water is the second component as importance for
honey. Water activity is a proportional unit of the free
water in food products; in the case of lower water activity
than 0.60, the food product involved can be considered
microbiologically stable. At present, water activity is
considered a better parameter than the moisture content
for honey. Accordingly to Chirife, Zamora & Motoo [4]
there is a linear correlation between the moisture content
and water activity. Thus, for the honey samples
adulterated by fructose and hydrolyzed inulin syrup, an
increase in water activity proportionally with the
proportion of the adulteration agent can be observed.
The water activity was of 0.801 for acacia honey,
0.764 for the tilia honey and 0.806 for the polyfloral
honey, respectively. There can be observed in the tables
1-3 that water activity is increasing together with the
proportion of the adulteration agent. Ribeiro et al. [5]
observed similar values for the honey adulterated by corn
syrup which is reach in fructose.
C. pH
The acidic content of honey is relatively low, but it is
important for taste, stability and microbiological
resistance. This parameter is important for the honey
extraction and keeping, influencing the honey texture,
stability and term of validity (Gomes et al., 2010) [6]. A
low pH ensures the microorganisms inhibition and
prevents their development.
Honey acidity is given by the presence of organic acids,
as gluconic acid and other anorganic acids, as chloride.
The values of pH are lower than 4.57 (Table I-Table III).
The values are in agreement with those reported by
Cimpoiu et al. [7], Oroian [8] and Oroian et al. [9].
The adulteration of honey with fructose increased the
pH values of the samples, while the adulteration of honey
with hydrolyzed inulin syrup decreased the pH values of
the samples. The decreasing of pH values of the samples
adulterated with hydrolyzed inulin syrup is as the result
of the acidic nature of the syrup (the syrup is hydrolyzed
with HCl at pH between 1 - 2). Ribeiro et al. [5] observed
the same evolution of the pH.
D. Electrical Conductivity
The electrical conductivity is influenced by the
botanical origin, and is depending on the ash content,
organic acids, proteins, some sugars and poliols. The
values of the electrical conductivity ranged between
24.30 – 2920 μS/cm (tab. 1 -3). The samples adulterated
by fructose have lower electrical conductivity than the
original ones because fructose decreases conductivity,
while the samples adulterated by hydrolyzed inulin syrup
have higher electrical conductivity than the original ones
because of the acidic nature of the syrup.
E. Colour
Honey colour is influenced by the phenolic compounds,
pollen and minerals [11]. The acacia honey had the
highest colour purity (Table I), the same finding was
observed by the Kadar et al. (2010) [10] for acacia honey
from Romania and Spain. The polyfloral honey presented
the highest yellow components (high values of b*) (tab.
3), and by the hue angle. The adulteration of honey by
hydrolyzed inulin syrup is decreasing the values of b*.
The highest luminosity was observed in the case of tilia
honey, and is increasing with the adulteration percentage
(Table II). The increasing of the adulteration agent is
increasing the values of chroma (c*). The luminosity is
influenced by the addition of fructose.
F. Raman Spectra
Fig. 1 - Fig. 4 show the spectra of a sample adulterated
by fructose and one adulterated by hydrolyzed inulin
syrup. The principal bands are in the wave numbers 400 -
640 cm-1
and 1200-1430 cm-1
.
International Journal of Food Engineering Vol. 4, No. 1, March 2018
©2018 International Journal of Food Engineering 68
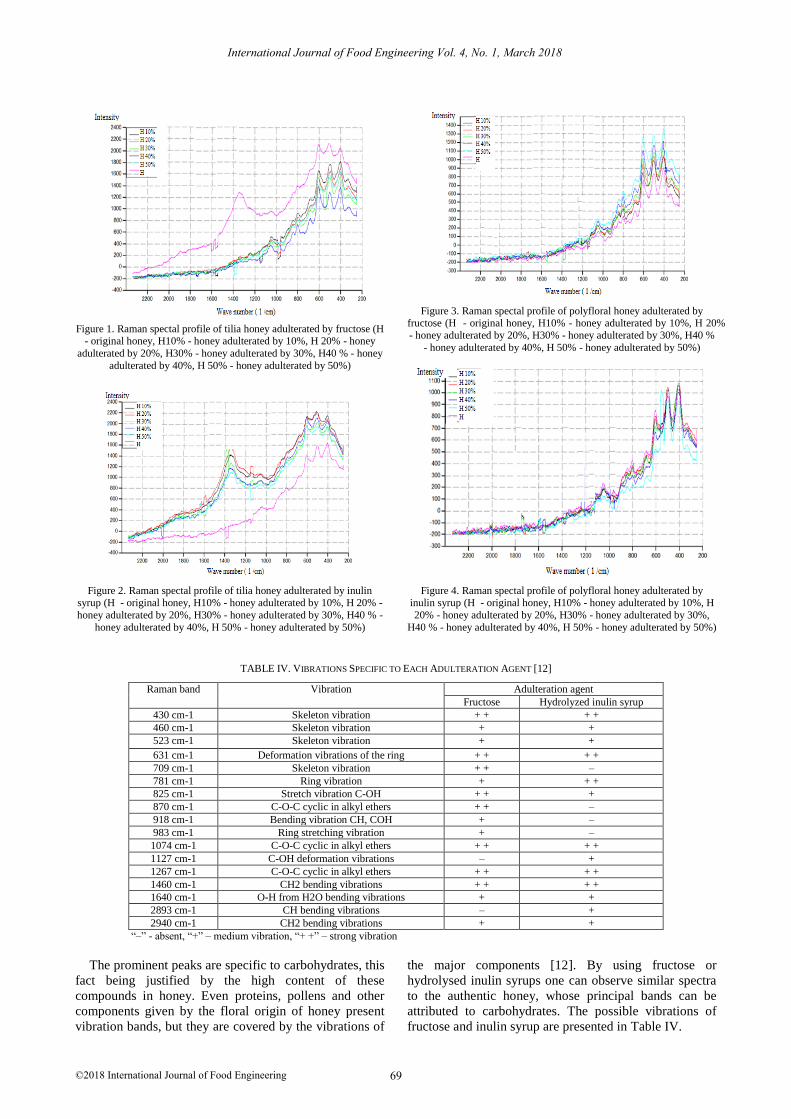
Figure 1. Raman spectal profile of tilia honey adulterated by fructose (H - original honey, H10% - honey adulterated by 10%, H 20% - honey
adulterated by 20%, H30% - honey adulterated by 30%, H40 % - honey
adulterated by 40%, H 50% - honey adulterated by 50%)
Figure 2. Raman spectal profile of tilia honey adulterated by inulin syrup (H - original honey, H10% - honey adulterated by 10%, H 20% -
honey adulterated by 20%, H30% - honey adulterated by 30%, H40 % -
honey adulterated by 40%, H 50% - honey adulterated by 50%)
Figure 3. Raman spectal profile of polyfloral honey adulterated by fructose (H - original honey, H10% - honey adulterated by 10%, H 20%
- honey adulterated by 20%, H30% - honey adulterated by 30%, H40 %
- honey adulterated by 40%, H 50% - honey adulterated by 50%)
Figure 4. Raman spectal profile of polyfloral honey adulterated by inulin syrup (H - original honey, H10% - honey adulterated by 10%, H
20% - honey adulterated by 20%, H30% - honey adulterated by 30%,
H40 % - honey adulterated by 40%, H 50% - honey adulterated by 50%)
TABLE IV. VIBRATIONS SPECIFIC TO EACH ADULTERATION AGENT [12]
Raman band Vibration Adulteration agent
Fructose Hydrolyzed inulin syrup
430 cm-1 Skeleton vibration + + + +
460 cm-1 Skeleton vibration + +
523 cm-1 Skeleton vibration + +
631 cm-1 Deformation vibrations of the ring + + + +
709 cm-1 Skeleton vibration + + –
781 cm-1 Ring vibration + + +
825 cm-1 Stretch vibration C-OH + + +
870 cm-1 C-O-C cyclic in alkyl ethers + + –
918 cm-1 Bending vibration CH, COH + –
983 cm-1 Ring stretching vibration + –
1074 cm-1 C-O-C cyclic in alkyl ethers + + + +
1127 cm-1 C-OH deformation vibrations – +
1267 cm-1 C-O-C cyclic in alkyl ethers + + + +
1460 cm-1 CH2 bending vibrations + + + +
1640 cm-1 O-H from H2O bending vibrations + +
2893 cm-1 CH bending vibrations – +
2940 cm-1 CH2 bending vibrations + +
“–” - absent, “+” – medium vibration, “+ +” – strong vibration
The prominent peaks are specific to carbohydrates, this
fact being justified by the high content of these
compounds in honey. Even proteins, pollens and other
components given by the floral origin of honey present
vibration bands, but they are covered by the vibrations of
the major components [12]. By using fructose or
hydrolysed inulin syrups one can observe similar spectra
to the authentic honey, whose principal bands can be
attributed to carbohydrates. The possible vibrations of
fructose and inulin syrup are presented in Table IV.
International Journal of Food Engineering Vol. 4, No. 1, March 2018
©2018 International Journal of Food Engineering 69
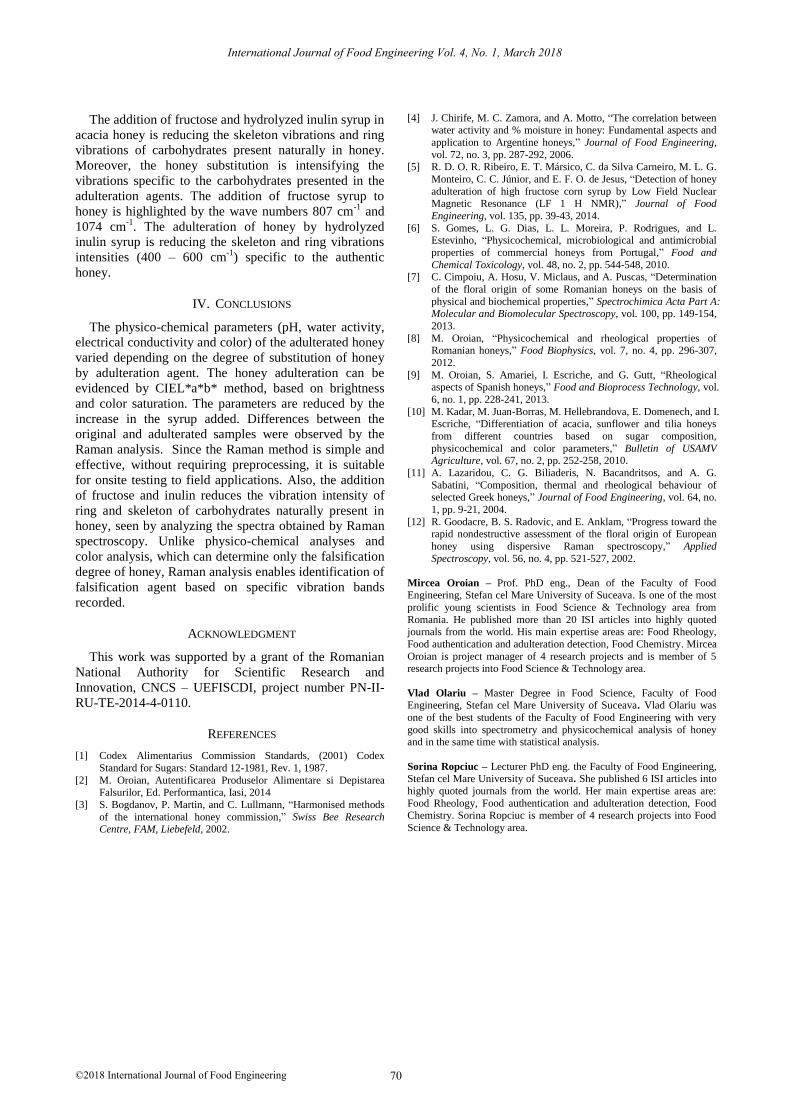
The addition of fructose and hydrolyzed inulin syrup in
acacia honey is reducing the skeleton vibrations and ring
vibrations of carbohydrates present naturally in honey.
Moreover, the honey substitution is intensifying the
vibrations specific to the carbohydrates presented in the
adulteration agents. The addition of fructose syrup to
honey is highlighted by the wave numbers 807 cm-1
and
1074 cm-1
. The adulteration of honey by hydrolyzed
inulin syrup is reducing the skeleton and ring vibrations
intensities (400 – 600 cm-1
) specific to the authentic
honey.
IV. CONCLUSIONS
The physico-chemical parameters (pH, water activity,
electrical conductivity and color) of the adulterated honey
varied depending on the degree of substitution of honey
by adulteration agent. The honey adulteration can be
evidenced by CIEL*a*b* method, based on brightness
and color saturation. The parameters are reduced by the
increase in the syrup added. Differences between the
original and adulterated samples were observed by the
Raman analysis. Since the Raman method is simple and
effective, without requiring preprocessing, it is suitable
for onsite testing to field applications. Also, the addition
of fructose and inulin reduces the vibration intensity of
ring and skeleton of carbohydrates naturally present in
honey, seen by analyzing the spectra obtained by Raman
spectroscopy. Unlike physico-chemical analyses and
color analysis, which can determine only the falsification
degree of honey, Raman analysis enables identification of
falsification agent based on specific vibration bands
recorded.
ACKNOWLEDGMENT
This work was supported by a grant of the Romanian
National Authority for Scientific Research and
Innovation, CNCS – UEFISCDI, project number PN-II-
RU-TE-2014-4-0110.
REFERENCES
[1] Codex Alimentarius Commission Standards, (2001) Codex
Standard for Sugars: Standard 12-1981, Rev. 1, 1987.
[2] M. Oroian, Autentificarea Produselor Alimentare si Depistarea Falsurilor, Ed. Performantica, Iasi, 2014
[3] S. Bogdanov, P. Martin, and C. Lullmann, “Harmonised methods
of the international honey commission,” Swiss Bee Research Centre, FAM, Liebefeld, 2002.
[4] J. Chirife, M. C. Zamora, and A. Motto, “The correlation between water activity and % moisture in honey: Fundamental aspects and
application to Argentine honeys,” Journal of Food Engineering,
vol. 72, no. 3, pp. 287-292, 2006. [5] R. D. O. R. Ribeiro, E. T. Mársico, C. da Silva Carneiro, M. L. G.
Monteiro, C. C. Júnior, and E. F. O. de Jesus, “Detection of honey
adulteration of high fructose corn syrup by Low Field Nuclear Magnetic Resonance (LF 1 H NMR),” Journal of Food
Engineering, vol. 135, pp. 39-43, 2014.
[6] S. Gomes, L. G. Dias, L. L. Moreira, P. Rodrigues, and L. Estevinho, “Physicochemical, microbiological and antimicrobial
properties of commercial honeys from Portugal,” Food and
Chemical Toxicology, vol. 48, no. 2, pp. 544-548, 2010. [7] C. Cimpoiu, A. Hosu, V. Miclaus, and A. Puscas, “Determination
of the floral origin of some Romanian honeys on the basis of
physical and biochemical properties,” Spectrochimica Acta Part A: Molecular and Biomolecular Spectroscopy, vol. 100, pp. 149-154,
2013.
[8] M. Oroian, “Physicochemical and rheological properties of Romanian honeys,” Food Biophysics, vol. 7, no. 4, pp. 296-307,
2012.
[9] M. Oroian, S. Amariei, I. Escriche, and G. Gutt, “Rheological aspects of Spanish honeys,” Food and Bioprocess Technology, vol.
6, no. 1, pp. 228-241, 2013.
[10] M. Kadar, M. Juan-Borras, M. Hellebrandova, E. Domenech, and I. Escriche, “Differentiation of acacia, sunflower and tilia honeys
from different countries based on sugar composition,
physicochemical and color parameters,” Bulletin of USAMV Agriculture, vol. 67, no. 2, pp. 252-258, 2010.
[11] A. Lazaridou, C. G. Biliaderis, N. Bacandritsos, and A. G.
Sabatini, “Composition, thermal and rheological behaviour of selected Greek honeys,” Journal of Food Engineering, vol. 64, no.
1, pp. 9-21, 2004.
[12] R. Goodacre, B. S. Radovic, and E. Anklam, “Progress toward the rapid nondestructive assessment of the floral origin of European
honey using dispersive Raman spectroscopy,” Applied
Spectroscopy, vol. 56, no. 4, pp. 521-527, 2002.
Mircea Oroian – Prof. PhD eng., Dean of the Faculty of Food Engineering, Stefan cel Mare University of Suceava. Is one of the most
prolific young scientists in Food Science & Technology area from
Romania. He published more than 20 ISI articles into highly quoted journals from the world. His main expertise areas are: Food Rheology,
Food authentication and adulteration detection, Food Chemistry. Mircea
Oroian is project manager of 4 research projects and is member of 5 research projects into Food Science & Technology area.
Vlad Olariu – Master Degree in Food Science, Faculty of Food Engineering, Stefan cel Mare University of Suceava. Vlad Olariu was
one of the best students of the Faculty of Food Engineering with very
good skills into spectrometry and physicochemical analysis of honey and in the same time with statistical analysis.
Sorina Ropciuc – Lecturer PhD eng. the Faculty of Food Engineering, Stefan cel Mare University of Suceava. She published 6 ISI articles into
highly quoted journals from the world. Her main expertise areas are:
Food Rheology, Food authentication and adulteration detection, Food Chemistry. Sorina Ropciuc is member of 4 research projects into Food
Science & Technology area.
International Journal of Food Engineering Vol. 4, No. 1, March 2018
©2018 International Journal of Food Engineering 70