INTERNATIONAL JOURNAL OF ENVIRONMENT
13
International Journal of Environment ISSN 2091-2854 32 | Page INTERNATIONAL JOURNAL OF ENVIRONMENT Volume-5, Issue-1, Dec-Feb 2015/16 ISSN 2091-2854 Received:11 December 2015 Revised:26 December 2015 Accepted:05 February 2016 ASSESSMENT OF SURFACE WATER QUALITY USING HIERARCHICAL CLUSTER ANALYSIS Dheeraj Kumar Dabgerwal 1 , Shailendra Kumar Tripathi 2* 1 Environmental Science, Department of Botany, Allahabad University, Allahabad, India 2 Department of Science, Sampurnanand Sanskrit University, Varanasi, India * Corresponding author: [email protected] Abstract This study was carried out to assess the physicochemical quality river Varuna in Varanasi, India. Water samples were collected from 10 sites during January-June 2015. Pearson correlation analysis was used to assess the direction and strength of relationship between physicochemical parameters. Hierarchical Cluster analysis was also performed to determine the sources of pollution in the river Varuna. The result showed quite high value of DO, Nitrate, BOD, COD and Total Alkalinity, above the BIS permissible limit. The results of correlation analysis identified key water parameters as pH, electrical conductivity, total alkalinity and nitrate, which influence the concentration of other water parameters. Cluster analysis identified three major clusters of sampling sites out of total 10 sites, according to the similarity in water quality. This study illustrated the usefulness of correlation and cluster analysis for getting better information about the river water quality. Key words: Correlation analysis, Cluster analysis, BOD, COD, River Varuna, Sampling sites.
Transcript of INTERNATIONAL JOURNAL OF ENVIRONMENT
International Journal of Environment ISSN 2091-2854 32 | P a g e
INTERNATIONAL JOURNAL OF ENVIRONMENT Volume-5, Issue-1, Dec-Feb 2015/16 ISSN 2091-2854
Received:11 December 2015 Revised:26 December 2015 Accepted:05 February 2016
ASSESSMENT OF SURFACE WATER QUALITY USING HIERARCHICAL CLUSTER
ANALYSIS
Dheeraj Kumar Dabgerwal1, Shailendra Kumar Tripathi
2*
1Environmental Science, Department of Botany, Allahabad University, Allahabad, India
2Department of Science, Sampurnanand Sanskrit University, Varanasi, India
*Corresponding author: [email protected]
Abstract
This study was carried out to assess the physicochemical quality river Varuna in Varanasi, India.
Water samples were collected from 10 sites during January-June 2015. Pearson correlation
analysis was used to assess the direction and strength of relationship between physicochemical
parameters. Hierarchical Cluster analysis was also performed to determine the sources of
pollution in the river Varuna. The result showed quite high value of DO, Nitrate, BOD, COD and
Total Alkalinity, above the BIS permissible limit. The results of correlation analysis identified
key water parameters as pH, electrical conductivity, total alkalinity and nitrate, which influence
the concentration of other water parameters. Cluster analysis identified three major clusters of
sampling sites out of total 10 sites, according to the similarity in water quality. This study
illustrated the usefulness of correlation and cluster analysis for getting better information about
the river water quality.
Key words: Correlation analysis, Cluster analysis, BOD, COD, River Varuna, Sampling sites.
International Journal of Environment ISSN 2091-2854 33 | P a g e
Introduction
Water is a most abundant natural resource and is a prime necessity for all living beings.
Its quality plays an important role in promoting agricultural production and standard of human
health. The rapid population growth, accelerated pace of industrialization, lack of ecological
education and over exploitation of natural resources has severely affected the water resources by
increasing the pressure on urban hydrology (Misra, 2011; Barai and Kumar, 2013;
Ramakrishnaiah et al., 2009; Sinha, 2003).These factors have deteriorated the quality of surface
water for drinking purposes and cause great damage to riverine biota (Singh et al., 2015; Varol,
2013). Therefore, constant monitoring of a river system is required to evaluate the effects of
environmental factors on water quality for proper utilization and sustainable development of the
resource (Cosmas and Samuel, 2011).
In present study the physico-chemical characteristics of River Varuna a minor tributary of
river Ganga was monitored at Varanasi, India. Varuna River originates from Manahan (a place
near Phulpur, Allahabad) and flows from west to east for about 100 Km and join River Ganga in
down stream of Varanasi at Rajghat (Kumar et al., 2015). The river water consumption in urban
areas for municipal, agricultural and industrial purposes is estimated between 100-1500
lit/person/day. The 80% of the municipal water supply is discharged into river Varuna as waste
water through 22 municipal drains located on both sides of river (Singh et al., 2015; Singh et al.,
2010; Singh et al., 2007; Kumar et al., 2012). Therefore, the objective of the present study was to
assess the physico-chemical characteristics of River Varuna at Varanasi and to establish
correlation between various water parameters and sampling sites on the basis of Pearson
correlation analysis and cluster analysis.
Materials and Methods
River Varuna flowing through Varanasi was selected as a study area. It is tributary of
river Ganga and originates from Jhignatal (Phulpur) near Allahabad (Barai and Kumar 2013;
Singh et al., 2015; Kumar et al., 2015). River flows east-to-southeast for some 100 km and joins
the Ganges at Rajghat, just downstream of Varanasi. Water samples were collected from ten
predetermined sites every month during the period of January to June 2015. The details of these
sampling sites are listed in Figure 1 and Table 1.

International Journal of Environment ISSN 2091-2854 34 | P a g e
Figure 1: Sampling locations at Varuna River Stretch
The selected water quality parameter were Temperature, pH, Electrical Conductivity (EC),
Biological Oxygen Demand (BOD), Chemical Oxygen Demand (COD), Total dissolved Solids
(TDS), Total Hardness (TH), Dissolved Oxygen (DO), Total Alkalinity (TA), Total Acidity
(TA), Chloride, Nitrate following the standard protocols of APHA (2005) (Rana and Chhetri
2015).
Table 1: Description of the Sampling Stations
Sampling
stations
Geographical
Coordinates Description
S-1 25°20'14.2"N
82°57'34.4"E Phulwariya: It is situated in cantonment area of Varanasi.
S-2 25°20'26.3"N
82°58'52.8"E
Shastri bridge: It is 1st road bridge over Varuna in Varanasi. The
bridge connects Kachehari (trans Varuna region) to old Varanasi
(cis- Varuna region).
S-3 25°20'04.7"N
82°59'47.8"E
Chaukaghat Bridge: It is the 2nd
bridge over Varuna in Varanasi. It
also connect Pahadia (trans Varuna region) to old Varanasi
(cisVaruna region)
S-4 25°20'28.7"N
83°00'33.0"E
Nakkhighat: It is the 3rd
bridge over Varuna in Varanasi. It is
situated near Varanasi city railway station and connect Pandeypur
(trans Varuna region) to Old Varanasi. The site was used earlies for
solid waste disposal by municipality.
S-5 25°20'28.9"N
83°01'21.7"E
Before Old Bridge: It is the 4th bridge over Varuna in Varanasi. It
connect Sarnath, Ashapur (trans Varuna region) to Golgadda bus
stand, Kashi railway station.
S-6 25°20'31.0"N
83°01'23.2"E
After Old Bridge: It is located near municipal solid waste dumping
site.

International Journal of Environment ISSN 2091-2854 35 | P a g e
S-7 25°20'26.3"N
83°01'42.6"E Konia: It is located near Jalalipura village on GT road.
S-8 25°20'07.6"N
83°02'12.2"E
Khalispur Rail Bridge: It is located near Aadikeshavmandir,
khalispur, Aadikeshavghat.
S-9 25°19'52.3"N
83°02'15.0"E
Raj Ghat :It is located near VasantKanya P.G. College, Varanasi.
S-10 25°19'46.0"N
83°02'39.0"E
Varuna-Ganga Confluence: It is the site, where River Varuna
joins river Ganga in downstream of Varanasi.
The results were subjected to statistical analysis to assess the spatio-temporal variations
in river water quality using Microsoft Excel2007 and SPSS16. Pearson correlation coefficient was
used to determine the interrelationships between physico-chemical parameters. Cluster analysis
(CA) was done for identifying the relatively homogeneous groups of variables based on their
similarities (Shrestha and Kazama, 2007). A dendrogram is constructed, where cohesiveness and
correlations among the variables can be clearly observed (Yongming et al., 2006). It presents a
visual summary of intra-relationship amongst variations in water parameters, which can lead to a
better understanding of governing factors of river water quality (Pejman et al., 2009).
In this study for the assessment of the quality of water, identification of key water parameters,
which influence the other parameters and to determine the sources of pollution in the river
Varuna in Varanasi region, Pearson correlation analysis and cluster analysis was used.
Results and Discussion
Physical and Chemical Characteristics
Physico-chemical parameters results of all ten sampling sites and Indian standard limits
are given in table-1. In the present study Temperature of surface water in study region varied
from 18.250C to 23.4
0C. The site wise results showed an increasing trend from S1 to S10 of the
river may be due to the common effect of intensity of solar radiations, ambient temperature and
urban discharge (Gyananath et al., 2000). In the present study, pH ranges from a minimum value
of 6.30 in S3 and maximum value of 7.32 in S10, which is a safe range 6.5-8.5 for Class-A (As
drinking water source without conventional treatment but after disinfection) purpose suggested
by the Bureau of Indian Standards (IS: 2296-1982). Though the pH value has no direct effect on
health, it can alter the taste of water.
Results of Electrical conductivity in present study showed a gradual increasing trend of
minimum 0.43 µS in S1 and maximum 0.82 µS in S3. This is a safe range (1000 to 2250 µS) for
International Journal of Environment ISSN 2091-2854 36 | P a g e
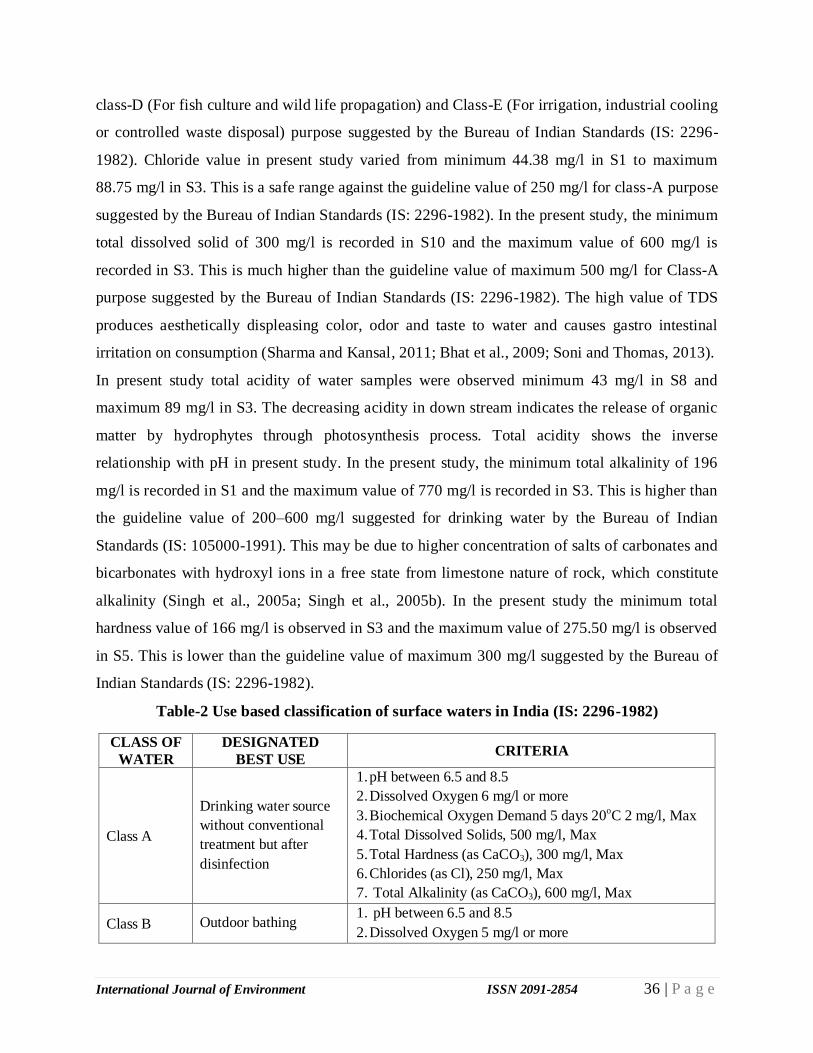
class-D (For fish culture and wild life propagation) and Class-E (For irrigation, industrial cooling
or controlled waste disposal) purpose suggested by the Bureau of Indian Standards (IS: 2296-
1982). Chloride value in present study varied from minimum 44.38 mg/l in S1 to maximum
88.75 mg/l in S3. This is a safe range against the guideline value of 250 mg/l for class-A purpose
suggested by the Bureau of Indian Standards (IS: 2296-1982). In the present study, the minimum
total dissolved solid of 300 mg/l is recorded in S10 and the maximum value of 600 mg/l is
recorded in S3. This is much higher than the guideline value of maximum 500 mg/l for Class-A
purpose suggested by the Bureau of Indian Standards (IS: 2296-1982). The high value of TDS
produces aesthetically displeasing color, odor and taste to water and causes gastro intestinal
irritation on consumption (Sharma and Kansal, 2011; Bhat et al., 2009; Soni and Thomas, 2013).
In present study total acidity of water samples were observed minimum 43 mg/l in S8 and
maximum 89 mg/l in S3. The decreasing acidity in down stream indicates the release of organic
matter by hydrophytes through photosynthesis process. Total acidity shows the inverse
relationship with pH in present study. In the present study, the minimum total alkalinity of 196
mg/l is recorded in S1 and the maximum value of 770 mg/l is recorded in S3. This is higher than
the guideline value of 200–600 mg/l suggested for drinking water by the Bureau of Indian
Standards (IS: 105000-1991). This may be due to higher concentration of salts of carbonates and
bicarbonates with hydroxyl ions in a free state from limestone nature of rock, which constitute
alkalinity (Singh et al., 2005a; Singh et al., 2005b). In the present study the minimum total
hardness value of 166 mg/l is observed in S3 and the maximum value of 275.50 mg/l is observed
in S5. This is lower than the guideline value of maximum 300 mg/l suggested by the Bureau of
Indian Standards (IS: 2296-1982).
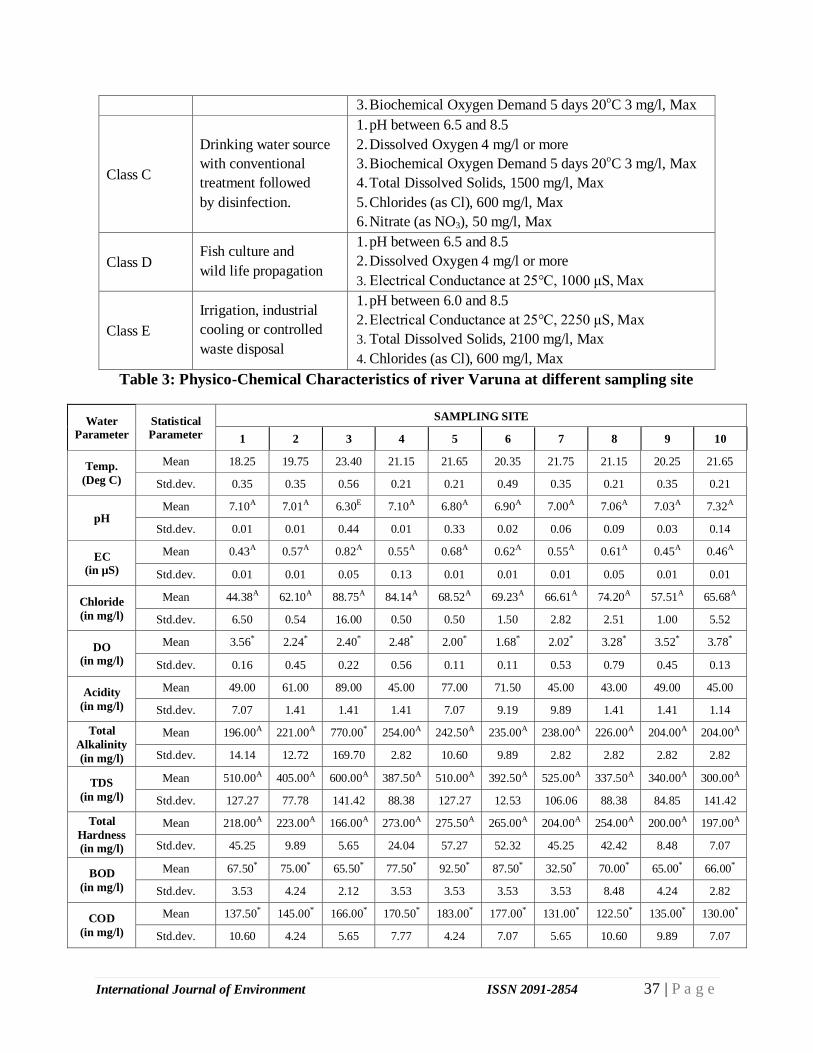
Table-2 Use based classification of surface waters in India (IS: 2296-1982)
CLASS OF
WATER
DESIGNATED
BEST USE CRITERIA
Class A
Drinking water source
without conventional
treatment but after
disinfection
1. pH between 6.5 and 8.5
2. Dissolved Oxygen 6 mg/l or more
3. Biochemical Oxygen Demand 5 days 20oC 2 mg/l, Max
4. Total Dissolved Solids, 500 mg/l, Max
5. Total Hardness (as CaCO3), 300 mg/l, Max
6. Chlorides (as Cl), 250 mg/l, Max
7. Total Alkalinity (as CaCO3), 600 mg/l, Max
Class B Outdoor bathing 1. pH between 6.5 and 8.5
2. Dissolved Oxygen 5 mg/l or more
International Journal of Environment ISSN 2091-2854 37 | P a g e
3. Biochemical Oxygen Demand 5 days 20oC 3 mg/l, Max
Class C
Drinking water source
with conventional
treatment followed
by disinfection.
1. pH between 6.5 and 8.5
2. Dissolved Oxygen 4 mg/l or more
3. Biochemical Oxygen Demand 5 days 20oC 3 mg/l, Max
4. Total Dissolved Solids, 1500 mg/l, Max
5. Chlorides (as Cl), 600 mg/l, Max
6. Nitrate (as NO3), 50 mg/l, Max
Class D Fish culture and
wild life propagation
1. pH between 6.5 and 8.5
2. Dissolved Oxygen 4 mg/l or more
3. Electrical Conductance at 25°C, 1000 μS, Max
Class E
Irrigation, industrial
cooling or controlled
waste disposal
1. pH between 6.0 and 8.5
2. Electrical Conductance at 25°C, 2250 μS, Max
3. Total Dissolved Solids, 2100 mg/l, Max
4. Chlorides (as Cl), 600 mg/l, Max
Table 3: Physico-Chemical Characteristics of river Varuna at different sampling site
Water
Parameter
Statistical
Parameter
SAMPLING SITE
1 2 3 4 5 6 7 8 9 10
Temp.
(Deg C)
Mean 18.25 19.75 23.40 21.15 21.65 20.35 21.75 21.15 20.25 21.65
Std.dev. 0.35 0.35 0.56 0.21 0.21 0.49 0.35 0.21 0.35 0.21
pH Mean 7.10A 7.01A 6.30E 7.10A 6.80A 6.90A 7.00A 7.06A 7.03A 7.32A
Std.dev. 0.01 0.01 0.44 0.01 0.33 0.02 0.06 0.09 0.03 0.14
EC
(in µS)
Mean 0.43A 0.57A 0.82A 0.55A 0.68A 0.62A 0.55A 0.61A 0.45A 0.46A
Std.dev. 0.01 0.01 0.05 0.13 0.01 0.01 0.01 0.05 0.01 0.01
Chloride
(in mg/l)
Mean 44.38A 62.10A 88.75A 84.14A 68.52A 69.23A 66.61A 74.20A 57.51A 65.68A
Std.dev. 6.50 0.54 16.00 0.50 0.50 1.50 2.82 2.51 1.00 5.52
DO
(in mg/l)
Mean 3.56* 2.24* 2.40* 2.48* 2.00* 1.68* 2.02* 3.28* 3.52* 3.78*
Std.dev. 0.16 0.45 0.22 0.56 0.11 0.11 0.53 0.79 0.45 0.13
Acidity
(in mg/l)
Mean 49.00 61.00 89.00 45.00 77.00 71.50 45.00 43.00 49.00 45.00
Std.dev. 7.07 1.41 1.41 1.41 7.07 9.19 9.89 1.41 1.41 1.14
Total
Alkalinity
(in mg/l)
Mean 196.00A 221.00A 770.00* 254.00A 242.50A 235.00A 238.00A 226.00A 204.00A 204.00A
Std.dev. 14.14 12.72 169.70 2.82 10.60 9.89 2.82 2.82 2.82 2.82
TDS
(in mg/l)
Mean 510.00A 405.00A 600.00A 387.50A 510.00A 392.50A 525.00A 337.50A 340.00A 300.00A
Std.dev. 127.27 77.78 141.42 88.38 127.27 12.53 106.06 88.38 84.85 141.42
Total
Hardness
(in mg/l)
Mean 218.00A 223.00A 166.00A 273.00A 275.50A 265.00A 204.00A 254.00A 200.00A 197.00A
Std.dev. 45.25 9.89 5.65 24.04 57.27 52.32 45.25 42.42 8.48 7.07
BOD
(in mg/l)
Mean 67.50* 75.00* 65.50* 77.50* 92.50* 87.50* 32.50* 70.00* 65.00* 66.00*
Std.dev. 3.53 4.24 2.12 3.53 3.53 3.53 3.53 8.48 4.24 2.82
COD
(in mg/l)
Mean 137.50* 145.00* 166.00* 170.50* 183.00* 177.00* 131.00* 122.50* 135.00* 130.00*
Std.dev. 10.60 4.24 5.65 7.77 4.24 7.07 5.65 10.60 9.89 7.07
International Journal of Environment ISSN 2091-2854 38 | P a g e
Nitrate
(in mg/l)
Mean 55.00* 59.00* 65.50* 58.50* 72.00* 67.50* 43.00C 57.00* 51.00* 53.00*
Std.dev. 4.24 4.24 2.12 4.94 5.65 3.53 4.24 7.07 4.24 4.24
A Satisfy class A category, B Satisfy class B category, C Satisfy class C category, D Satisfy class D category, * Higher than the tolerance limit
In the present study the minimum Nitrate value of 43 mg/l is observed in S7 and the maximum
value of 72 mg/l is observed in S5. This is much higher that the tolerance limit of maximum 20
mg/l for class-A purpose suggested by the Bureau of Indian Standards (IS: 2296-1982). The high
value of nitrate is linked to run-off of the organic matter from the agricultural land located at the
bank of river and impeded microbial and bacterial activities (Soni and Thomas, 2013;
Sreenivasulu et al., 2014). The presence of excess nitrate causes health hazards to humans. This
will cause methaemoglobinemia (Blue baby disease) and it influences the growth of algae
(House, 1999; Sharma and Kansal, 2011; Bhat, 2009).
Correlation analysis:
Among the various physiochemical parameters of surface water, only few parameters
exhibited significant correlations (Table 3). In present study the values of electrical conductivity
(EC) shown a statistically significant positive correlation with Temperature (r=0.702, p<0.05),
Chloride (r=0.749, p<0.05), Nitrate (r=0.657, p<0.05), Total Acidity (r=0.787, p<0.01), Total
Alkalinity (r=0.784, p<0.01) and negative correlation with pH (r=-0.880, p<0.01).
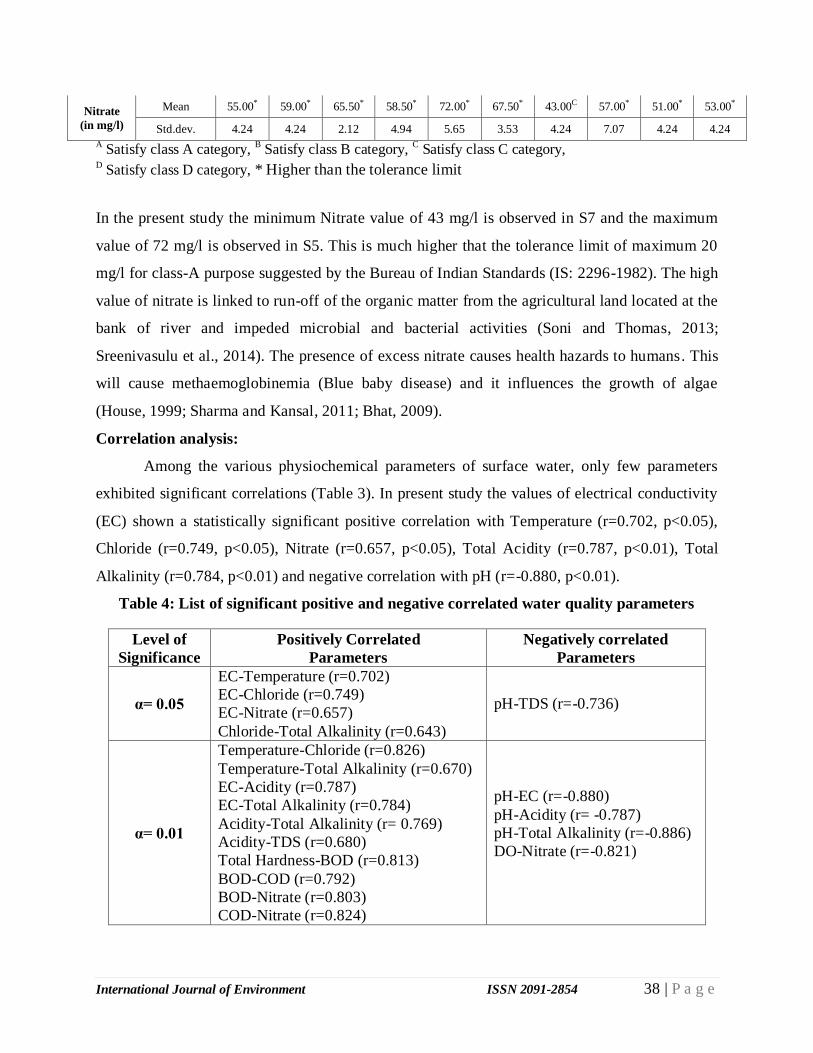
Table 4: List of significant positive and negative correlated water quality parameters
Level of
Significance
Positively Correlated
Parameters
Negatively correlated
Parameters
α= 0.05
EC-Temperature (r=0.702)
EC-Chloride (r=0.749)
EC-Nitrate (r=0.657)
Chloride-Total Alkalinity (r=0.643)
pH-TDS (r=-0.736)
α= 0.01
Temperature-Chloride (r=0.826)
Temperature-Total Alkalinity (r=0.670)
EC-Acidity (r=0.787)
EC-Total Alkalinity (r=0.784)
Acidity-Total Alkalinity (r= 0.769)
Acidity-TDS (r=0.680)
Total Hardness-BOD (r=0.813)
BOD-COD (r=0.792)
BOD-Nitrate (r=0.803)
COD-Nitrate (r=0.824)
pH-EC (r=-0.880)
pH-Acidity (r= -0.787)
pH-Total Alkalinity (r=-0.886)
DO-Nitrate (r=-0.821)
International Journal of Environment ISSN 2091-2854 39 | P a g e
The positive correlation of chloride, nitrate and total alkalinity with EC indicates that an
increase in impurities in surface water enhances the number of free ions in the water leading to
increased EC (Singh et al., 2015).The inverse relationship between EC and pH indicates that the
increased ionic load to water bodies enhance the oxidation of organic matter resulting in nutrient
release and decrease in pH (Watkar and Barbate, 2015). The inverse relationship of pH with TDS
(r=-0.736, p<0.05), Acidity (r=-0.787, p<0.01) and Total Alkalinity (r=-0.886, p<0.01) indicates
that an increased load of dissolved solid influence the pH of water.
Statistically significant positive correlation shown by total alkalinity with Chloride
(r=0.643, p<0.05), Temperature (r=0.670, p<0.01) and Acidity (r=0.769, p<0.01). This indicates
that carbonate, bicarbonate and hydroxide alkalinity of water influence acidity and chloride
content of water (Vishwakarma and Tripathi, 2015).
Nitrate was found to have significant positive correlation with BOD (r=0.803, p<0.01),
COD (r=0.824, p<0.01) and negative correlation with dissolved oxygen (r=-0.821, p<0.01). The
positive correlation of nitrate with BOD and COD indicates that the higher concentration of
nitrate in run off from agricultural land near the bank of river contribute to BOD and COD both.
The oxidation of nitrate consumes dissolved oxygen of water and show inverse relationship
between nitrate and dissolved oxygen. BOD shown significant positive correlation with total
hardness (r=0.813, p<0.01) and COD (r=0.792, p<0.01) indicates that concentration of total
hardness and COD influence BOD value of water. Significant positive correlation between
temperature and chloride (r=0.826, p<0.01) indicates that the solubility of inorganic salts
increases with the increasing temperature of water (Soni and Thomas, 2013).Significant positive
correlation between acidity and TDS (r=0.680, p<0.01) indicates that the oxidation of organic
matter in water release nutrients and enhance acidity.
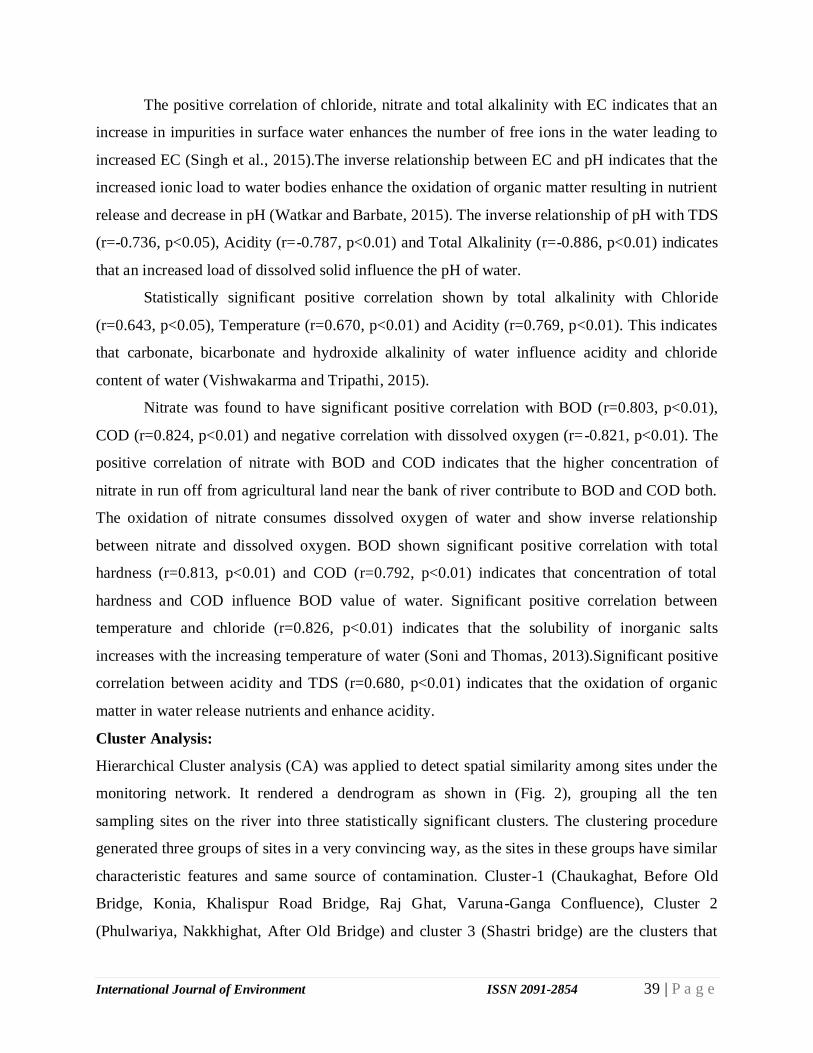
Cluster Analysis:
Hierarchical Cluster analysis (CA) was applied to detect spatial similarity among sites under the
monitoring network. It rendered a dendrogram as shown in (Fig. 2), grouping all the ten
sampling sites on the river into three statistically significant clusters. The clustering procedure
generated three groups of sites in a very convincing way, as the sites in these groups have similar
characteristic features and same source of contamination. Cluster-1 (Chaukaghat, Before Old
Bridge, Konia, Khalispur Road Bridge, Raj Ghat, Varuna-Ganga Confluence), Cluster 2
(Phulwariya, Nakkhighat, After Old Bridge) and cluster 3 (Shastri bridge) are the clusters that
International Journal of Environment ISSN 2091-2854 40 | P a g e
correspond to contamination of water. It is evident that this technique is useful in offering
reliable classification of river water in the whole region. So instead of monitoring ten sites, only
three sites could be selected in future spatial sampling strategy without affecting the result. The
reduction in sampling sites in the monitoring network will be more economical without losing
any significance of the outcome (Bajpai et al., 2013; Vishnu et al., 2014; Sreenivasulu et al.,
2014).
Fig. 2: Dendrogram from Hierarchical Cluster Analysis of Sampling Sites
Conclusion
In this study for the assessment of the quality of water, identification of key water
parameters, which influence the other parameters and to determine the sources of pollution in the
river Varuna in Varanasi region, Pearson correlation analysis and cluster analysis was used. The
result has shown the effect of different pollutant on water quality. Correlation analysis showed
Sa
mp
lin
g s
tati
on
s
International Journal of Environment ISSN 2091-2854 41 | P a g e
that the main parameters responsible for the changes in the quality of water were identified as
pH, electrical conductivity, total alkalinity and nitrate. All the 10 sampling stations were divided
into three clusters using cluster analysis. Cluster I corresponds to relatively less polluted sites,
Cluster II were corresponded to moderately polluted sites and Cluster III corresponds to highly
polluted sites.
The present study revealed that the water quality of river Varuna is declining due to
disposal of city drains carrying polluted water. It is therefore needful to develop a comprehensive
river water quality monitoring program to identify the major polluted spots of a river. The
statistical techniques used in the present study will help in future to water resource managers to
outline the parameters contributing to pollution for every site. This will make the future
monitoring cost more economical and easier without missing much information.
Acknowledgements
The authors are thankful to Head, Department of Science, Sampurnanand Sanskrit University,
Varanasi, India and Head, Environmental Science, Department of Botany, Allahabad University,
Allahabad, India for providing necessary laboratory facilities to perform the research work.
References
Bajpai, O., Mishra, S., Mohan, N., Mohan, J., and Gupta, R. K., 2013. Physico Chemical
Characteristics of Lakhna Devi Temple Water Tank, Lakhna, Bakewar, Etawah, UP with
reference to Cyanobacterial Diversity. International Journal of Environment, 1(1), 20-28.
Barai, S.R. and Kumar Satish, 2013. Evaluation of The physico-chemical characteristics of river
Varuna at Varanasi. Journal of Environmental Biology, Vol.34, 259-265.
Bhat, M. M., Yazdani, T., Narain, K., Yunus, M., and Shukla, R. N., 2009. Water quality status
of some urban ponds of Lucknow, U.P.. Journal of Wetlands Ecology, 2(1), 67-73.
Cosmas, Ahamefula A., and Samuel O., 2011. A comparative assessment of the physico-
chemical and microbial trends in Njaba River, Niger delta basin, Southeastern
Nigeria. Journal of Water Resource and Protection, 3, 686-693.
Gyananath, G., Shewdikar, S. V., and Samiuddin, S., 2000. Water quality analysis of River
Godavari during 'Holi Mela' at Nanded. Pollution Research, 19(4), 673-674.
House, W. A., 1999. The physico-chemical conditions for the precipitation of phosphate with
calcium. Environmental Technology, 20(7), 727–733.
International Journal of Environment ISSN 2091-2854 42 | P a g e
Joshi, J. D., Vora, J. J., Sharma, S., Patel, N. K., Kothari, O. K., and Salvi, K. N., 2005.
Underground Water Quality of Vagdod Taluka, North Gujarat, India. Asian Journal of
Chemistry, 17(1), 103.
Kumar, P., Singh, A. N., Shrivastava, R., and Mohan, D., 2015. Assessment of Seasonal
Variation in Water Quality Dynamics in River Varuna-A Major Tributary of River
Ganga. International Journal of Advanced Research, 3(3), 1176-1193.
Kumar, S., Mishra, P. K., Singh, N. L., Singh, K. K., and Srivastava, P., 2012. Water quality of
river Varuna in Varanasi City, Uttar Pradesh, India. Asian Journal of Biochemical and
Pharmaceutical Research, Vol.2 (2), 231-240.
Misra, A. K., 2011. Impact of urbanization on the hydrology of Ganga Basin (India). Water
resources management, 25(2), 705-719.
Nehme, N., Haydar, C., Koubaissy, B., Fakih, M., Awad, S., Toufaily, J., and Hamieh, T., 2014.
Study of the Correlation of the Physicochemical Characteristics of the Litani Lower
River Basin. Physics Procedia, 55, 451-455.
Pandian, R. K., Banu, G. S., Kumar, G., and Smila, K. H., 2005. Physico-chemical
characteristics of drinking water in selected areas of Namakkal town (Tamil Nadu), India.
Indian J. Environmental Protection, 10(3), 789-792.
Pejman, A. H., Bidhendi, G. N., Karbassi, A. R., Mehrdadi, N., and Bidhendi, M. E., 2009.
Evaluation of spatial and seasonal variations in surface water quality using multivariate
statistical techniques. International Journal of Environmental Science &
Technology, 6(3), 467-476.
Rana, A., and Chhetri, J., 2015. Assessment of river water quality using macro-invertebrates as
indicators: a case study of Bhalu Khola tributary, Budhigandaki river, Gorkha, Nepal.
International Journal of Environment, 4(3), 55-68.
Ramakrishnaiah, C. R., Sadashivaiah, C., and Ranganna, G., 2009. Assessment of water quality
index for the groundwater in Tumkur Taluk, Karnataka State, India. Journal of
Chemistry, 6(2), 523- 530.
Sharma, D., and Kansal, A., 2011. Water quality analysis of river Yamuna using water quality
index in the national capital territory, India. Applied Water Science, 1, 147–157.
International Journal of Environment ISSN 2091-2854 43 | P a g e
Shrestha, S., and Kazama. F., 2007. Assessment of surface water quality using multivariate
statistical techniques: A case study of the Fuji river basin, Japan. Environ. Model.
Software, 22(4), 464-475.
Singh, K. P., Malik, A., and Sinha, S., 2005a. Water quality assessment and apportionment of
pollution sources of Gomti river (India) using multivariate statistical techniques a case
study. Analytica Chimica Acta, 538(1–2), 355–374.
Singh, K. P., Malik, A., Singh, V. K., Mohan, D., andSinha, S., 2005b. Chemometric analysis
of groundwater quality data of alluvial aquifer of Gangetic plain, North India. Analytica
Chimica Acta, 550(1–2), 82–91.
Singh, P., Chaturvedi, R. K., Mishra, A., Kumari, L., Singh, R., Pal, D. B. and Mishra, P. K.,
2015. Assessment of ground and surface water quality along the river Varuna, Varanasi,
India. Environmental monitoring and assessment,187(4), 1-10.
Singh, S. J., and Dwivedi, A. K., 2007. Numerical interdependence in pH, acidity and alkalinity
of a polluted river water. Journal of Environmental Biology, 30(5), 773–775.
Singh, S., and Singh, K. N., 2010. Physico-chemical analysis of sewage discharged into Varuna
river at Varanasi. Current World Environment, 5(1), 201–203.
Singh, S., Singh, K. N., and Singh, K. N., 2010. Physico-chemical analysis of sewage
discharged into Varuna river at Varanasi. Current World Environment, 5(1), 201-203.
Sinha, T. K., 2003. Ground water conditions and its quality in Varanasi city. Indian Jour.
Geomorphology, 8(1-2), 153-154
Soni, H. B., and Thomas, S., 2013. Preliminary assessment of surface water quality of tropical
pilgrimage wetland of Central Gujarat, India. International Journal of Environment, 2(1),
202-223.
Sreenivasulu, K., Hossain, K., and Damodharam, T., 2014. Seasonal variations in water quality
and major threats to Nellore Cheruvu (tank), Nellore district, India. International Journal
of Environment, 3(2), 28-35.
Tamilarasi V, Murugesan S and Pugazhendi V., 2015. Hydro Chemical Evaluation of
Groundwater in Pernampet Block in Palar River Basin at Vellore District, Tamilnadu,
India. Research Journal of Recent Sciences, 4 (6), 37-44.

International Journal of Environment ISSN 2091-2854 44 | P a g e
Varol, M., Gökot, B., Bekleyen, A., and Şen, B., 2013. Geochemistry of the Tigris River basin,
Turkey: spatial and seasonal variations of major ion compositions and their controlling
factors. Quaternary International, 304, 22-32.
Vishnu, S. S., Prince, G., and Mohan, T., 2014. Physico-chemical characteristics of the ground
water table after monsoon: a case study at central Travancore in Kerala. International
Journal of Environment, 3(2), 20-27.
Vishwakarma and Tripathi, 2015. Physico-Chemical and Statistical Evaluation of Bore Well
Water in Two Villages of Varanasi (Up), India. International Journal of Scientific
Research in Environmental Sciences, 3(9), 0314-0321.
Watkar, A. M., and Barbate, M. P., 2015. Seasonal variations in Physico-chemical Properties of
Chandrabhaga River in Dhapewada, Dist. Kalmeshwar Maharashtra, India. Research
Journal of Recent Sciences, 4 (ISC-2014), 1-4.
Yongming, H., Peixuan, D., Junji, C. and Posmentier, E.S., 2006. Multivariate analysis of heavy
metal contamination in urban dusts of Xi’an, Central China. Sci. Total Environ., 355(1-
3):176 – 186.