INTERNATIONAL JOURNAL OF CIVIL ENGINEERING …iaeme.com/MasterAdmin/UploadFolder/MATHEMATICAL MODEL...
14
International Journal of Civil Engineering and Technology (IJCIET), ISSN 0976 – 6308 (Print), ISSN 0976 – 6316(Online) Volume 4, Issue 2, March - April (2013), © IAEME 1 MATHEMATICAL MODEL OF RCC DAM BREAK BASTORA RCC DAM AS A CASE STUDY NajmObaidSalim Alghazali 1 and Dilshad A.H. Alhadrawi 2 (1) Corresponding author, Asst. Prof. Doctor, Civil Engineering Department, Babylon University, Iraq. (2) M.Sc. Student, Civil Engineering Department, Babylon University, Iraq. ABSTRACT This is the first study on the failure of roller compacted concrete (RCC) dams. A mathematical model for over-stressing type of RCC dam failure is presented and a scenario for breach formation is presented. The hypothetical failure of Bastora dam, a RCC dam located north east of Iraq, due to overstress is selected as a case study. The reservoir outflow hydrograph is computed using the proposed mathematical model and then the outflow is routed downstream Bastora dam. The maximum water levels, maximum discharges and rescue level at the available (11) sections of Bastora River downstream Bastora dam are determined. Keywords: HEC- RAS, level pool routing method, mathematical model for RCC dam break, over-stressing failure, roller compacted concrete (RCC) dams 1. INTRODUCTION ACI 207.5R [1] defines Roller-Compacted Concrete (RCC) as "a concrete of no- slump consistency in its unhardened state that is transported, placed, and compacted using earth and rock-fill construction equipment."ICODS [2] defines RCC damas" a concrete gravity dam constructed by the use of a dry mix concrete transported by conventional construction equipment and compacted by rolling, usually with vibratory rollers." RCC is an economical method and accepted material for constructing dams and rehabilitating and modifying existing concrete and embankment dams [1], [3], [4].The worldwide acceptance of RCC dams is due to their low cost, reduction period of construction, and successful performance [5].RCC dams were constructed in all types of climates and in all types of countries from the most developed to the still developing [6].There are more than 250 RCC dams constructed throughout the world [7]. INTERNATIONAL JOURNAL OF CIVIL ENGINEERING AND TECHNOLOGY (IJCIET) ISSN 0976 – 6308 (Print) ISSN 0976 – 6316(Online) Volume 4, Issue 2, March - April (2013), pp. 01-14 © IAEME: www.iaeme.com/ijciet.asp Journal Impact Factor (2013): 5.3277 (Calculated by GISI) www.jifactor.com IJCIET © IAEME
Transcript of INTERNATIONAL JOURNAL OF CIVIL ENGINEERING …iaeme.com/MasterAdmin/UploadFolder/MATHEMATICAL MODEL...
International Journal of Civil Engineering and Technology (IJCIET), ISSN 0976 – 6308
(Print), ISSN 0976 – 6316(Online) Volume 4, Issue 2, March - April (2013), © IAEME
1
MATHEMATICAL MODEL OF RCC DAM BREAK BASTORA RCC
DAM AS A CASE STUDY
NajmObaidSalim Alghazali1
and Dilshad A.H. Alhadrawi2
(1)Corresponding author, Asst. Prof. Doctor, Civil Engineering Department, Babylon
University, Iraq. (2)
M.Sc. Student, Civil Engineering Department, Babylon University, Iraq.
ABSTRACT
This is the first study on the failure of roller compacted concrete (RCC) dams. A
mathematical model for over-stressing type of RCC dam failure is presented and a scenario
for breach formation is presented. The hypothetical failure of Bastora dam, a RCC dam
located north east of Iraq, due to overstress is selected as a case study. The reservoir outflow
hydrograph is computed using the proposed mathematical model and then the outflow is
routed downstream Bastora dam. The maximum water levels, maximum discharges and
rescue level at the available (11) sections of Bastora River downstream Bastora dam are
determined.
Keywords: HEC- RAS, level pool routing method, mathematical model for RCC dam break,
over-stressing failure, roller compacted concrete (RCC) dams
1. INTRODUCTION
ACI 207.5R [1] defines Roller-Compacted Concrete (RCC) as "a concrete of no-
slump consistency in its unhardened state that is transported, placed, and compacted using
earth and rock-fill construction equipment."ICODS [2] defines RCC damas" a concrete
gravity dam constructed by the use of a dry mix concrete transported by conventional
construction equipment and compacted by rolling, usually with vibratory rollers."
RCC is an economical method and accepted material for constructing dams and
rehabilitating and modifying existing concrete and embankment dams [1], [3], [4].The
worldwide acceptance of RCC dams is due to their low cost, reduction period of construction,
and successful performance [5].RCC dams were constructed in all types of climates and in all
types of countries from the most developed to the still developing [6].There are more than
250 RCC dams constructed throughout the world [7].
INTERNATIONAL JOURNAL OF CIVIL ENGINEERING AND
TECHNOLOGY (IJCIET)
ISSN 0976 – 6308 (Print)
ISSN 0976 – 6316(Online)
Volume 4, Issue 2, March - April (2013), pp. 01-14 © IAEME: www.iaeme.com/ijciet.asp
Journal Impact Factor (2013): 5.3277 (Calculated by GISI) www.jifactor.com
IJCIET
© IAEME

International Journal of Civil Engineering and Technology (IJCIET), ISSN 0976 – 6308
(Print), ISSN 0976 – 6316(Online) Volume 4, Issue 2, March - April (2013), © IAEME
2
RCC gravity dams are designed to the same criteria as conventional concrete (CVC)
gravity dams with respect to stability and allowable stresses in the concrete [5], [8], [9].
However, there are differences in the uplift within the body of the dam and the minimum
sliding factors of safety [9].
One significant difference between a RCC dam and a CVC dam is the continuous
placing of a horizontal lift of concrete from one abutment to the other, rather than
constructing the dam in a series of separate monoliths [3].Lift thicknesses depend on the
placement size, production capacity of the concrete batch plant, mixture proportions, and
compaction equipment [9], [10].There is no limited lift thickness used in all RCC dams. The
lift thicknesses used in RCC dams are 0.30 m (1 layer) [11], 0.60 m (composed of four 0.15
m layers) [9], 2 m (composed of eight layers of 0.25 m) [5], and 0.75 to 1 m (0.3 m layers)
[7], [12]. By the use of sloped layer method (SLM), the lift thickness is 3 to 4 m [13].
A dam is a sword of two limits [14]. It is mainly used to supply the necessary quantity
of water downstream it, generates power, and protect from flood. On the other hand flood
resulting from dam failure is considered as a national disaster and classified as first degree
accidents for the damage it causes to human life, properties and economic systems.In many
countries the determination of the wave parameters that would follow the collapse of every
large dam is demanded by law to organize the defense of inhabitants and structures in the
valley downstream [15].
For the knowledge of the researchers there is no study in literature on the failure of
RCC dams. This is the first study on the failure of RCC dams and it opens the door for further
researches.A mathematical model for over-stressing type of RCC dam failure is presented
and a scenario for breach formation is presented.
Bastora dam, located north east of Iraq, is designed as a RCC gravity dam.Fig. (1)
shows the typical section of Bastora dam. The failure of Bastora RCC dam due to over-
stressing is selected as a case study. The wave parameters that would follow the hypothetical
collapse of Bastora dam are determined.
Drainag gallery
No. of steps = 97
All steps with
s:l = 0.9m:0.63m
except the first step with
s:l = 1.1:0.77
73.62m
13mDam crest
EL. 897.5m asl
EL. 810m asl0.7
1
Detail B
0.9
0
0.9
00.9
0
1.1
0
0.630.630.77Detail B
Figure (1): Schematic view of the typical Bastora dam section (All dimensions are in meters)
[16]

International Journal of Civil Engineering and Technology (IJCIET), ISSN 0976 – 6308
(Print), ISSN 0976 – 6316(Online) Volume 4, Issue 2, March - April (2013), © IAEME
3
2. OBJECTIVES OF THE PRESENT STUDY
I. Presenting a mathematical model for RCC dam break due to overstress.
II. Determining the wave parameters that would follow the hypothetical collapse of
Bastora damdue to overstress.
3. MATHEMATICAL MODEL OF CVC DAM BREAK
A study of the different conventional concrete (CVC) gravity dam failures indicates
that concrete gravity dams breach by sudden collapse, overturning, sliding away of the dam
due to inadequate design, earthquakes, enemy attack and over-stressing [17]. Failure of
concrete gravity dams are often more catastrophic, because they have less obvious symptoms
prior to failure, collapse may be very rapid, with little or no advance warning [18].
For the lack of data on the change of breach geometry with time or in order to
simplify the analysis, CVC dams’ break studies were based on the assumption of complete
(or partial) instantaneous removal of the dam [19], [20], [21]. Complete instantaneous failure
of a dam is conservative in the sense of simulating the worst possible downstream flooding
conditions but, in most cases, is unrealistic.
4. MATHEMATICAL MODEL OF RCC DAM BREAK
RCC gravity dams like CVC gravity dams, they may fail due to sudden collapse,
overturning, sliding away of the dam due to inadequate design, earthquakes, enemy attack
and over-stressing. In this study, the failure of RCC gravity dams due to over-stressing is
investigated.
According to the characteristics of RCC gravity dams, mentioned in the introduction,
it cannot be assumed that their failure due to overstressing is instantaneous but it can be
assumed gradual with a short time. The hydraulics of instantaneous and gradual collapse of a
dam is in fact quite different. Instantaneous failure of a dam causes a positive wave in the
downstream direction and a negative wave in the upstream direction. In gradual failure, the
breach dimensions grow with time and the reservoir level drops uniformly. Complete gradual
failure of a RCC dam due to overstressing can be assumed in the sense of simulating the
worst case.
To build a mathematical model for the failure of RCC gravity dams due to
overstressing, the data on the change of breach geometry with time and the breach outflow
equation are required.
In 2010, two studies for the failure of CVC gravity dams were presented. In the first
study, presented by Asrate [22], the breach width should be taken 0.2-0.5 times the crest
length of the dam and the breach development time should be about 0.2 hour. This means that
the failure of CVC gravity dams is gradual with a short time. This can be used for the gradual
failure of RCC gravity dams since for overstress failure type the breach shape and
development for these two types of dams are equal. For other types of failure such as sliding
failure type the breach shape and development for these two types of dams are not equal
because there are differences in the uplift within the body of the dam and the minimum
sliding factors of safety [9]. In the second study, presented by Welch [23], the breach
outflowof CVC gravity dams is computed by using Eq. (1):

International Journal of Civil Engineering and Technology (IJCIET), ISSN 0976 – 6308
(Print), ISSN 0976 – 6316(Online) Volume 4, Issue 2, March - April (2013), © IAEME
4
�� � 0.9 � � � �.� 1�
Where Qd = the discharge at the dam site (m3/s), hd = breach head (m) - defined as a depth of
water, and b = breach width (m).
This study is also for the gradual failure of CVC gravity dams. Based on the assumption that
failure of RCC gravity dams due to over stress is gradual, Eq. (1) can be used to compute the
breach outflowof RCC gravity dams.
In summary, the failure of RCC gravity dams due to overstress is gradual with a short
time. The breach outflow can be computed by using Eq. (1) and the breach width should be
taken 0.2-0.5 times the crest length of the dam and the breach development time should be
about 0.2 hour.
5. THE HYPOTHETICAL FAILURE OF BASTORA DAM DUE TO OVERSTRESS
5.1 Methodology
I. Computing the reservoir outflow hydrograph using the proposed mathematical model
with actual field data.
II. Routing the reservoir outflow hydrograph downstream Bastora dam using the
computer program HEC-RAS 3.1.3 (2005) (The Hydrologic Engineering Center -
River Analysis System) to determine the maximum discharges, maximum stages and
rescue level at selected sections of Bastora River downstream Bastora dam.
5.2 Assumptions
The following assumptions are adopted in this study:
I. The hypothetical failure of Bastora dam is due to overstressing.
II. The breach dimensions grow linearly with time.
III. The beauty of one-dimensional analysis using cross-sectional averaged flow quantities
is that the details of two-or-three-dimensional variations of these variables in the
channel can be avoided in the computation while a reasonable solution of the flow can
be obtained [24]. Therefore, the flow in Bastora River is assumed to be one
dimensional.
IV. The cross sections of Bastora River remain constant during the flood routing.
V. The Manning’s roughness coefficient (n = 0.0255) is assumed to remain constant with
time and distance along the study reach.
6. RESERVOIR OUTFLOW HYDROGRAPH
Determination of the reservoir outflow hydrograph is divided into two tasks:
I. Simulating the dam breach.
II. Routing the reservoir outflow hydrograph through the breached and outlet structures.
International Journal of Civil Engineering and Technology (IJCIET), ISSN 0976 – 6308
(Print), ISSN 0976 – 6316(Online) Volume 4, Issue 2, March - April (2013), © IAEME
5
6.1 Simulating the dam breach
The breach width is taken 0.2-0.5 times the crest length of Bastora dam and the
breach development time is 0.2 hour. The breach side slopes is taken equal to zero.The
breach shape develops in time from initiation to its ultimate configuration.
6.2 Routing the Reservoir Outflow Hydrograph
The reservoir outflow hydrograph is computed using the level pool routing method
[25]. The reservoir flood routing process requires determination of the following:
6.2.1 Bastora reservoir elevation-storage relationship
Eq. (2) represents the Bastora Reservoir Storage-Elevation Relationship [16]:
������ � 9.669 � 10�����.�801.5��.� � 2�
where: El. = reservoir water surface elevation (m asl)
Volume = volume of the reservoir (MCM) at elevation (El.)
6.2.2 The inflow and outflow from the reservoir for the initial condition
The maximum mean monthly outflow from Bastora reservoir was (21.6 m3/s) which occurred
on December 1976 [26]. This flow is assumed to be the initial inflow and outflow from
Bastora reservoir.
6.2.3 The initial elevation of the reservoir water surface before the failure
Bastora reservoir is assumed to be full to its maximum live storage capacity. This
corresponds to spillway sill level of (892.5 m asl).
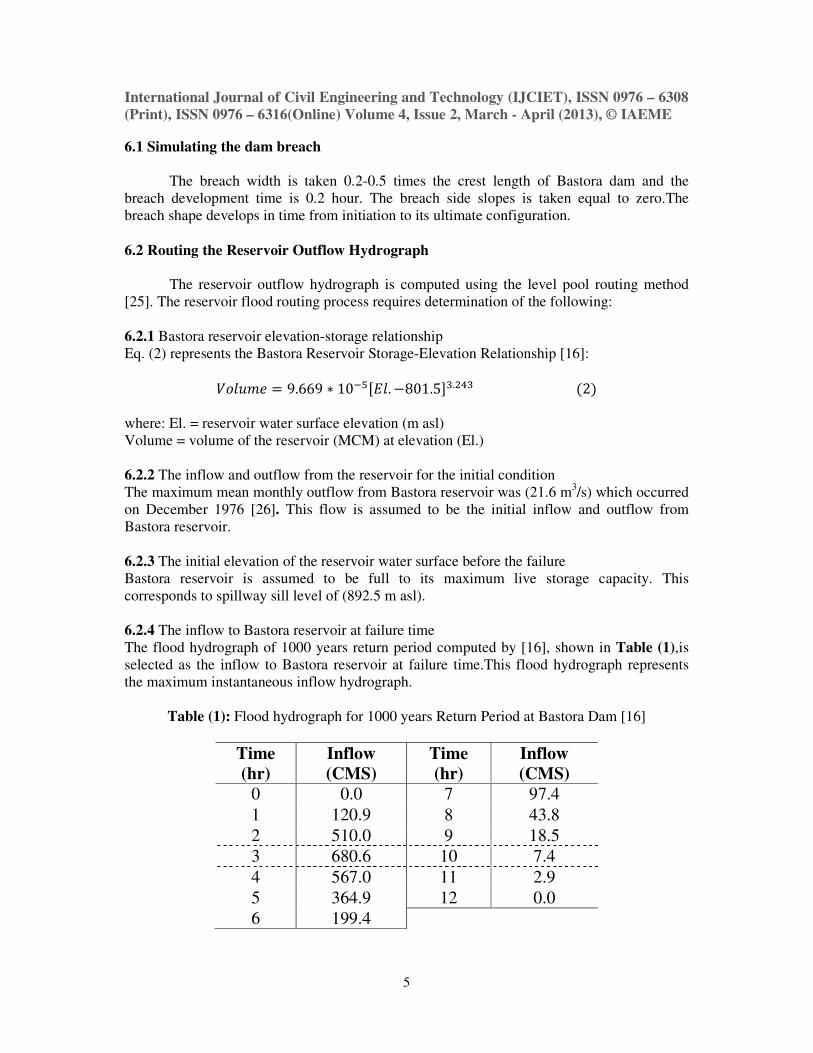
6.2.4 The inflow to Bastora reservoir at failure time
The flood hydrograph of 1000 years return period computed by [16], shown in Table (1),is
selected as the inflow to Bastora reservoir at failure time.This flood hydrograph represents
the maximum instantaneous inflow hydrograph.
Table (1): Flood hydrograph for 1000 years Return Period at Bastora Dam [16]
Time
(hr)
Inflow
(CMS)
Time
(hr)
Inflow
(CMS)
0 0.0 7 97.4
1 120.9 8 43.8
2 510.0 9 18.5
3 680.6 10 7.4
4 567.0 11 2.9
5 364.9 12 0.0
6 199.4

International Journal of Civil Engineering and Technology (IJCIET), ISSN 0976 – 6308
(Print), ISSN 0976 – 6316(Online) Volume 4, Issue 2, March - April (2013), © IAEME
6
6.2.5 Modeling outlet works, spillway and breach flows models
It is assumed that at the onset of failure the outlets are locked for any reason. Therefore, their
flows are not modeled.The reservoir water surface elevation was assumed to be at elevation
(892.5m asl) at the onset of failure which is at the spillway sill level. Therefore, the spillway
flows are not modeled.The breach is defined by its sill elevation and width, both given as a
function of time. Eq. (1) is used to calculate breach outflow.
6.3 Bastora Dam Break Simulation
Five different cases of breach width are investigatedfor the analysis of Bastora dam
break simulations (0.2, 0.3, 0.35, 0.4, and 0.5 times Bastora dam crest length) to determine
the peak outflow. In all these five cases, the initial breach elevation is taken corresponding to
the top of Bastora dam (EL. 897.5 m asl). The final bottom elevation of the breach is taken as
(EL. 810.0 m asl) corresponding to the average foundation level of Bastora dam at the
location of the breach.
The growth of the breach is proceeded vertically down at a rate of 7.3 m/ minute until
the breach reaches its final elevation and horizontally towards the dam sides at the same rate
until the dam destroyed completely except the dam parts that lie above the reservoir water
surface elevation.
The breach parameters for the five cases of failure and discharges through the breach
are shown in Table (2). The outflow hydrographs for various breach widths are shown in Fig.
(2). Based on the results shown in Table (2), the breach parameters corresponding to case 5
are selected because the outflow is maximum which represents the worst case. For case 5,
shown in Fig. (2), after about 16 minutes from the dam failure, the peak breach outflow is
(138023.92 m3/s) and after about 99 minutes from the dam failure, the whole volume of the
reservoir is going out to the river reach, and this indicates that the reservoir was depleted at
the end of the simulation time. The breach formation is assumed to consist of two phases. The
sketch of case (5) is presented in Fig. (3).
Table (2): The Breach Parameters and Discharges
Caseno. Breach width(w)
(m)
Breach elevation(m) Max. dischargethrough the
breach (m3/s)
Initial Final
1 115.46 897.50 810.00 116218.90
2 173.19 897.50 810.00 120890.47
3 202.06 897.50 810.00 124243.07
4 230.92 897.50 810.00 128171.92
5 288.65 897.50 810.00 138023.92

International Journal of Civil Engineering and Technology (IJCIET), ISSN 0976 – 6308
(Print), ISSN 0976 – 6316(Online) Volume 4, Issue 2, March - April (2013), © IAEME
7
International Journal of Civil Engineering and Technology (IJCIET), ISSN 0976 – 6308
(Print), ISSN 0976 – 6316(Online) Volume 4, Issue 2, March - April (2013), © IAEME
8
7. ROUTING THE RESERVOIR OUTFLOW HYDROGRAPH DOWNSTREAM
BASTORA DAM
The (HEC-RAS) computer program is used to route the reservoir outflow hydrograph
downstream Bastora dam. This software is based on the four-point implicit finite difference
solution of the one dimensional unsteady flow equations of Saint-Venant. The derivation of
Saint-Venant equations, the continuity equation (conservation of mass) and momentum
equation (conservation of momentum) are available in most text books of open channel
hydraulics, e.g., [27], [28], [29].
The one dimensional Saint-Venant equations,after neglecting the eddy losses, wind
shear effect and lateral flow, are written as:
"�"# $ "%
"& � 0 3�
"�"& $
" �� %⁄ �"# $ )% *"+"# $ ,-. � 0 4�
where Q = discharge (L3T
-1), A = cross - sectional area of flow (L
2), z = water surface
elevation (L), x = distance along the channel (L), t = time (T), g = gravity - acceleration
constant (LT-2
), Sf = friction slope, defined as
,- � 0���
%�1 �⁄ 5�
in whichn = Manning’s roughness coefficient and R = hydraulic radius (L)
The basic data requirements for performing the one dimensional flow calculations
using HEC-RAS are classified as geometric data and hydraulic data [30].
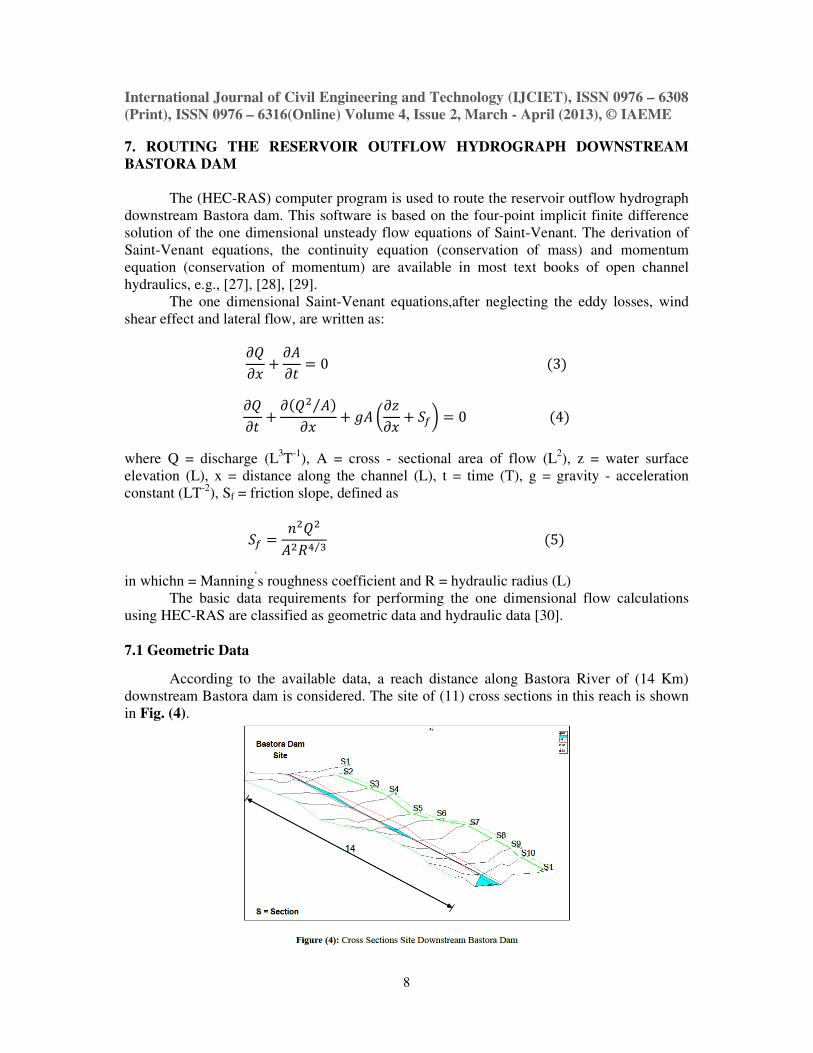
7.1 Geometric Data
According to the available data, a reach distance along Bastora River of (14 Km)
downstream Bastora dam is considered. The site of (11) cross sections in this reach is shown
in Fig. (4).

International Journal of Civil Engineering and Technology (IJCIET), ISSN 0976 – 6308
(Print), ISSN 0976 – 6316(Online) Volume 4, Issue 2, March - April (2013), © IAEME
9
7.2 Hydraulic Data
7.2.1 Manning’s Coefficient
Manning’s roughness coefficient (n = 0.0255) determined by [26] is used in this study
and it is assumed to remain constant with time and distance.
7.2.2 Unsteady Flow Data
7.2.2.1 Initial Condition
As mentioned in paragraph 6.2.2, the inflow to and outflow from Bastora reservoir for
the initial condition is assumed (21.6m3/s) which is the maximum mean monthly. Therefore,
this outflow from Bastora reservoir is the initial flow for the (14 Km) reach along Bastora
River.Table (3) shows the initial water surface elevation along the study reach for the steady
flow of (21.6 m3/s).
.
Table (3): Bed Channel and Water Surface Elevation
Section
No.
Distance Downstream
Bastora Dam (km)
Channel Bed Elevation
(m asl)
Water Surface
Elevation (m asl)
1 0.00 586.20 586.72
2 1.00 575.70 576.33
3 2.50 565.40 565.64
4 4.25 554.90 555.66
5 6.00 544.70 545.27
6 7.00 534.30 534.45
7 8.50 523.90 524.71
8 10.25 513.50 514.20
9 11.50 503.10 503.83
10 12.75 492.80 493.48
11 14.00 482.40 483.47
7.2.2.2 Boundary Conditions
7.2.2.2.1 Upstream Boundary Condition
The reservoir outflow hydrograph for case (5), shown in Fig.(2), is used as the
upstream boundary condition.
7.2.2.2.2 Downstream Boundary Condition
The downstream boundary condition is a rating curve at the last section of the routed reach.
The best fit equation for the discharge - stage data at the last sectionis:
+ � 483.81 $ 0.07471 �3.� � 1.407 exp ��� 6� wherez = water surface elevation (m asl) and Q = discharge (m
3/s). The coefficient of
determination (R2) for Eq. (6) is 0.997.

International Journal of Civil Engineering and Technology (IJCIET), ISSN 0976 – 6308
(Print), ISSN 0976 – 6316(Online) Volume 4, Issue 2, March - April (2013), © IAEME
10
8. RESULTS OF FLOOD ROUTING
The computed discharge hydrographs at the (11) sections in Bastora River are shown
in Fig. (5).The computed peak discharges, maximum water levels and their time of
occurrence at the (11) sections in Bastora River are listed in Table (4). The computed peak
discharges and the computed peak elevations at the (11) sections in Bastora River are shown
in Fig. (6) and Fig. (7)respectively.
Table (4): Peak Discharges, Water Levels and their Time of Occurrence
Section
No.
Peak Discharge
(m3/s)
Time of
Occurrence (min)
Peak Elevation
(m asl)
Time of
Occurrence (min)
1 138023.9 16 593.92 18
2 135916.1 18 591.86 22
3 126939.6 22 576.62 26
4 123507.0 26 576.01 26
5 122401.5 26 561.48 28
6 121650.9 28 548.70 28
7 120092.7 28 538.71 30
8 117398.7 30 528.54 34
9 113848.9 32 516.92 36
10 110360.9 32 508.99 38
11 103945.0 36 508.96 38

International Journal of Civil Engineering and Technology (IJCIET), ISSN 0976 – 6308
(Print), ISSN 0976 – 6316(Online) Volume 4, Issue 2, March - April (2013), © IAEME
11
International Journal of Civil Engineering and Technology (IJCIET), ISSN 0976 – 6308
(Print), ISSN 0976 – 6316(Online) Volume 4, Issue 2, March - April (2013), © IAEME
12
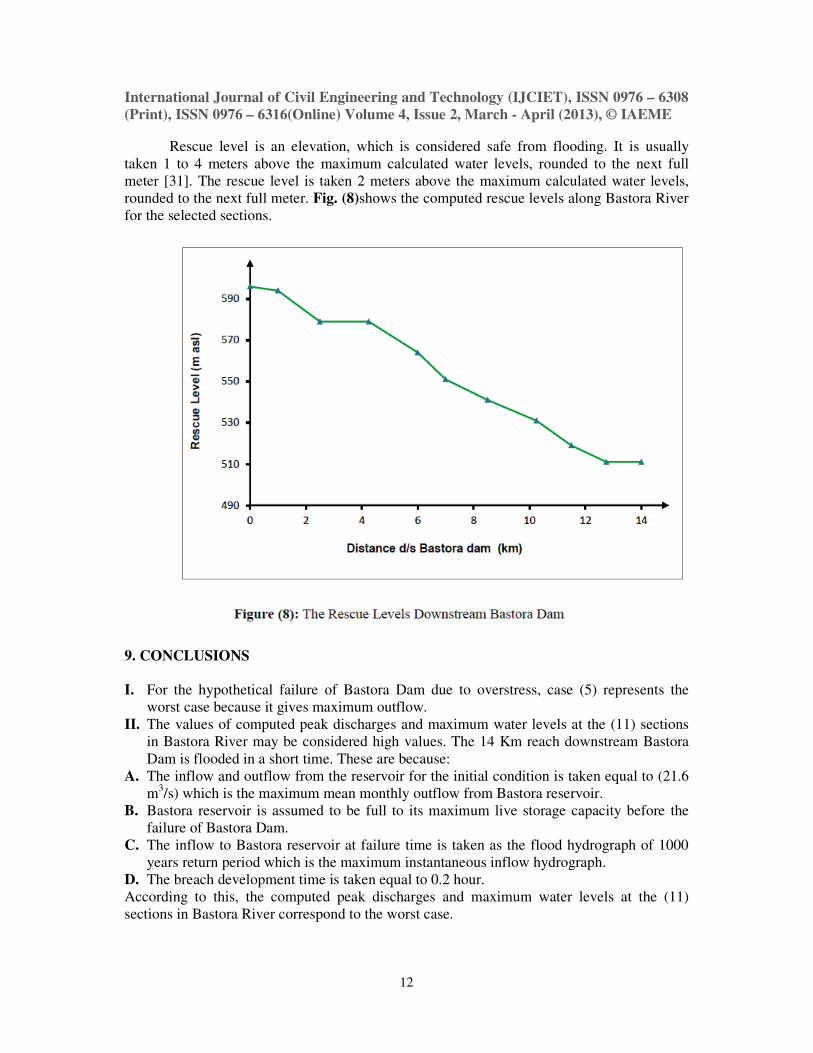
Rescue level is an elevation, which is considered safe from flooding. It is usually
taken 1 to 4 meters above the maximum calculated water levels, rounded to the next full
meter [31]. The rescue level is taken 2 meters above the maximum calculated water levels,
rounded to the next full meter. Fig. (8)shows the computed rescue levels along Bastora River
for the selected sections.
9. CONCLUSIONS
I. For the hypothetical failure of Bastora Dam due to overstress, case (5) represents the
worst case because it gives maximum outflow.
II. The values of computed peak discharges and maximum water levels at the (11) sections
in Bastora River may be considered high values. The 14 Km reach downstream Bastora
Dam is flooded in a short time. These are because:
A. The inflow and outflow from the reservoir for the initial condition is taken equal to (21.6
m3/s) which is the maximum mean monthly outflow from Bastora reservoir.
B. Bastora reservoir is assumed to be full to its maximum live storage capacity before the
failure of Bastora Dam.
C. The inflow to Bastora reservoir at failure time is taken as the flood hydrograph of 1000
years return period which is the maximum instantaneous inflow hydrograph.
D. The breach development time is taken equal to 0.2 hour.
According to this, the computed peak discharges and maximum water levels at the (11)
sections in Bastora River correspond to the worst case.
International Journal of Civil Engineering and Technology (IJCIET), ISSN 0976 – 6308
(Print), ISSN 0976 – 6316(Online) Volume 4, Issue 2, March - April (2013), © IAEME
13
10. RECOMMENDATIONS
I. A physical model based on Bastora dam data is required to show the validity of the
proposed mathematical model.
II. In addition to the overstress failure of RCC gravity dams, they, like CVC gravity
dams, may fail due to overturning, sliding, earthquakes, or enemy attack.
Constructing physical models to investigate these types of failures will led to novel
researches into RCC dams’ failures and new insights into RCC dam breach
mechanisms.
III. The last section (section 11) floods after (36 min); therefore, peoples must evacuate
from this area before this time when the dam breaks.
IV. The rescue level ranged from (596 m asl) at section (1) to (511 m asl) at section
(11). This can be used as a rescue boundary to evacuate peoples from the areas
which are threatened by the flood wave.
V. The rescue level determined in this study should be taken into consideration when it
is planned to construct any building downstream Bastora dam.
VI. When the cross sections within Bastora reservoir are available, the hypothetical
failure of Bastora dam can be studied by using the dynamic model and the results
can be compared with the hydrologic model used in this study.
VII. Cross sections data downstream section (11) are required in order to determine the
peak discharges and maximum water levels at these sections.
VIII. Downstreamwater levels can cause backwater effects into the breach, thus reducing
the outflow considerably. Hence it is required to take into consideration the
backwater effects.
IX. It is assumed that the streambed is fixed without erosion or sedimentation. Erosion
and sedimentation simulation are needed to be investigated.
REFERENCES
[1] ACI 207.5R, “Roller-Compacted Mass Concrete",1999.
[2] ICODS, “Federal Guidelines for Dam Safety: Glossary of Terms", FEMA Publication,
1-28, 2004.
[3] ACI 309.5R, "Compaction of Roller-Compacted Concrete", 2000.
[4] Hansen, K.D., and Reinhardt, W.G., “Roller- Compacted Concrete Dams”, McGraw-
Hill, USA, 1991.
[5] ICOLD, “Roller- Compacted Concrete Dams”, Bulletin 126, ICOLD, 2003.
[6] Dunstan, M.R.H., "The State-of-the-Art of RCC Dams in 2002", Proc. of RCC Dams
Workshop in Iran: 11-22, 2003.
[7] Kimitaka, U., "Roller Compacted Concrete Dam and Utilization of Fly Ash in Japan",
k.uji @ ecomp.metro-u-ac.jp, 2005.
[8] USACE, "Seismic Design Provisions for Roller Compacted Concrete Dams", EP 1110-
2-12, 1995.
[9] USACE, “Roller- Compacted Concrete”, EM 1110- 2- 2006, 2000.
[10] USACE, "Structural Design Using the Roller-Compacted Concrete (RCC) Construction
Process", ETL 1110-2-343, 1993.
International Journal of Civil Engineering and Technology (IJCIET), ISSN 0976 – 6308
(Print), ISSN 0976 – 6316(Online) Volume 4, Issue 2, March - April (2013), © IAEME
14
[11] Batista, E.L., Graca, N.G., Bitten court, R.M. and Andrade, W.P., "First Brazilian
Experience Using the Horizontally Advancing Sloped layer Construction of RCC at
Lajeado Dam", Middle East RCC Conference, Jordan, 102-112, 2002.
[12] Nagayama, I., and Jikan, S., "30 Years' History of Roller-Compacted Concrete Dams in
Japan", 4th International Symposium on RCC Dams, Madrid, 1-14, 2003.
[13] Qiu, T., and Forbes, B.A., "Use of the Sloped Layer Method for Bonded Joints on
Tannur RCC Dam, Jordan", ANCOLD 2003 Conference on Dams, 1-10, 2003.
[14] Alghazali, N.O., “Mathematical Model of Al-Adhaim Dam Break”, M.Sc. Thesis,
College of Engineering, Babylon University, 1999.
[15] Rajar, R., "Mathematical simulation of dam-break flow", J. Hydr. Div., ASCE, 104(7),
1011-1025, 1978.
[16] Alghazali, N.O., “Evaluation of Some Design Parameters of Roller Compacted Concrete
Dams”, Ph.D. Thesis, Building and Construction Engineering Department, University of
Technology, Iraq, 2007.
[17] Centre for Inter disciplinary Study of Mountain and Hill Environmental (CISMHE),
“Dam Break Analysis & Disaster Management Plan Report”, University of Delhi, 2010.
[18] Ministry of Environment, Lands and Parks Water Management Branch (LPWMB),
“Inspection & Maintenance of Dams. Dam Safety Guidelines”, British, Columbia, 1998.
[19] Macdonald, T.C. and Monopolis, J.L., "Breaching characteristics of dam failures", J.
Hydr. Div., ASCE, 110(5), 567-586, 1984.
[20] Wurbs, R. A., “Dam Breach Flood Wave Models”, Journal of Hydraulic Engineering,
Vol. 113, No. 1, pp. 29-46, 1987.
[21] Featherston, R.E. and Nalluri, C., “Civil Engineering Hydraulics”, 3rd
ed., Blackwell
Since, UK, 1995.
[22] Asrate, A.K., “Sensitivity Analysis of Dam Breach Parameters”, M.Sc. Thesis,
Engineering College, California State University, 2010.
[23] Welch, D., “Breach Parameter Estimator and Dam Break Rules of Thumb
Documentation”, V. 2. 30, 2010.
[24] Xia, R. and Yen, B.C., "Significance of averaging coefficients in open channel flow
equations", J. Hydr. Div., ASCE, 120(2), 169-189, 1994.
[25] Chow, V.T., Maidment, D.R. and Mays, L.W., “Applied Hydrology”, McGraw-Hill,
New York, 1988.
[26] El Concorde Consultant Engineers, “Bastora Dam and Irrigation Project”, Planning
Report, Volume-1, Dam Planning Report, Republic of Iraq, Ministry of Water
Resources, General Directorate for Engineering Designs, 2006.
[27] Henderson, F.M., “Open Channel Flow”, Macmillan, New York, 1966.
[28] Attari, J. and Yazdandoost, F., “Hydraulics of Dams & River Structures”, A. A.
Balkema, London, 2004.
[29] Chaudhry, M.H., “Open Channel Flow”, 2nd
ed., Columbia, 2008.
[30] HEC-RAS, “User's Manual”, Version 3.1.3, USACE, Hydrologic Engineering Center,
Davis, California, 2005.
[31] Swiss Consultants, “Mosul Flood Wave”, 1984.
[32] Karim M Pathan, “Finite Element Analysis Of 99.60 M High Roller Compacted
Concrete (RCC) Gravity Dam - Special Emphasis on Dynamic Analysis” International
Journal of Civil Engineering & Technology (IJCIET), Volume 3, Issue 2, 2012,
pp. 387 - 391, ISSN Print: 0976 – 6308, ISSN Online: 0976 – 6316, Published by
IAEME.