International Journal of Business Science and Applied ... · PDF fileInt. Journal of Business...
53
Transcript of International Journal of Business Science and Applied ... · PDF fileInt. Journal of Business...


Int. Journal of Business Science and Applied Management, Volume 4, Issue 1, 2009
Reverse logistics for recycling: The customer service
determinants
Patricia Oom do Valle
Faculty of Economics, University of Algarve
Edificio Ciencias I, Campus de Gambelas, 8005-139 Faro, Portugal
Tel: +351 289800915
Email: [email protected]
Joao Menezes
ISCTE - Business School, Lisbon University Institute
Avenida das Forcas Armadas, 1649-026 Lisbon, Portugal
Tel: +351 217935000
Email: [email protected]
Elizabeth Reis
ISCTE - Business School, Lisbon University Institute
Avenida das Forcas Armadas, 1649-026 Lisbon, Portugal
Tel: +351 217935000
Email: [email protected]
Efigenio Rebelo
Faculty of Economics, University of Algarve
Edificio Ciencias I, Campus de Gambelas, 8005-139 Faro, Portugal
Tel: +351 289800915
Email: [email protected]
Abstract
Customer service is a central concern in the logistics practice and a study topic in the forward logistics
research. This article investigates the elements of customer service and their importance in reverse
logistics for recycling. Since consumer is the first intervenient in any reverse system that aims to
recycle household residues, the provision of an adequate customer service gains an increased
importance. Applying multivariate statistical methods (exploratory factor analysis, confirmatory factor
analysis and discriminant analysis) to the data from a sample of 267 Portuguese citizens, this study
identifies the levels of customer service in this reverse logistics chain and evaluates their relative
importance in achieving consumers’ participation. The study finds that, as in forward logistics, the
customer service in reverse channels for recycling also has a hard and a soft level, being the former
more important than the later. The results of this research suggest important guidelines to improve such
a complex logistics service.
Keywords: reverse logistics, customer service, multivariate statistics
Acknowledgements: The authors acknowledge Susy Rodrigues for providing proofreading support.

Int. Journal of Business Science and Applied Management / Business-and-Management.org
2
1 INTRODUCTION
Reverse logistics is the continuous logistic process through which shipped products move from the
consumer back to the producer for possible reuse, recycling, remanufacturing or disposal (Johnson,
1998). The European Working Group on Reverse Logistics (RevLog, 2002) describes reverse logistics
as “the process of planning, implementing and controlling the flows of raw materials, in process
inventory, and finished goods, from a manufacturing, distribution or usage point to a point of proper
disposal”. The purpose of a reverse logistics process is to regain the value of returned materials or
provide the means for proper disposal (Rogers and Tibben-Lembke, 1999, 2001). Forward logistics, in
contrast to reverse logistics, focuses on the flow of goods from the producer to the consumer.
As Maltz and Maltz (1998) propose, customer service in the forward logistics channels is a
multifaceted concept that can encompass either objective or perceptual elements. Objective elements
correspond to basic customer service (or hard service) such as inventory availability, on time delivery
and order cycle time reliability. Perceptual elements (or soft service) are those related to the suppliers’
ability to respond to specific customer requests such as after-sale service and effective handling of
information requests. Several authors recognize that customer service is an issue of central concern in
logistics research and practice (Byrne and Deeb, 1993; Emerson and Grimm, 1998; Fuller, 1978;
Giuntini and Andel, 1995; Kopicki et al., 1993; Maltz and Maltz, 1998; Marien, 1998; Murphy, 1986;
Stock, 1992; Zikmund and Stanton, 1971).
Reverse logistics systems for recycling begin with the consumer and finishes with the end market
(Jahre, 1995). These systems can be more or less complex depending on whether they possess
intermediate levels, such as, the collection level, the transfer level and the processing level. Consumers
have a particularly important role in this reverse logistics system since they are the first link in the
overall logistics chain. Without consumer participation (through the sorting and disposing of recyclable
materials), this system would not be possible. By providing a convenient system, customer service
becomes the touchstone in creating value for consumers as well as in securing their participation
(Turner et al., 1994).
As recently pointed out, most research in the reverse logistics field is essentially descriptive and
based on subjective evidence rather than on theoretical bases (Alvarez-Gil et al., 2007). In terms of the
reverse logistics systems for recycling, one gap that remains open is the comprehensive investigation of
the main elements of customer service that explain the consumer involvement in selective-collection
programs. This analysis would provide fundamental information about the most important customer
service elements and, thus, that require more attention and investment. The contribution of this study
lies in bridging this research gap.
Data for this research results from the outcome of a structured questionnaire collected from a
random sample of 267 Portuguese citizens. This study uses a three-step procedure to assess the
elements that comprise customer service. First, an exploratory factor analysis identifies the main levels
of customer service (both hard and soft) that shape consumer participation in the Portuguese recycling
program. Second, a confirmatory factor analysis validates the underlying levels and the corresponding
elements. Third, a discriminant analysis identifies the level of customer service that strongly predicts
consumer involvement, in this way offering future guidelines for the reverse logistics system at the
collection stage.
The structure of this paper is as follows. Section 2 summarizes the background literature in terms
of: (1) concept and origins of reverse logistics and (2) reverse logistics for recycling. Section 3
proposes a conceptual model that forms the basis for this research and puts forward a set of research
hypotheses. Section 4 describes the research methods used including data information and statistical
techniques. Section 5 presents the results and provides conclusions based on the research hypotheses.
Section 6 discusses the study’s theoretical and managerial implications, identifies its limitations and
proposes guidelines for further research.
2 BACKGROUND ON REVERSE LOGISTICS FOR RECYCLING
Recycling is a resources recovery option that enables the use of part or all materials from returned
goods, either by their original producer(s) or by other industries (RevLog, 2002). The recycling process
essentially encompasses two stages (Jahre, 1995). The first is the collection service stage and includes
all the necessary procedures that make recyclables possible for further reprocessing. The second is the
reprocessing stage from the collection of materials to the replacement of primary raw materials. Table 1
lists the studies that explore particular issues on reverse logistics for recycling.

Patricia Oom do Valle, Joao Menezes, Elizabeth Reis and Efigenio Rebelo
3
Table 1: Summary of articles on reverse logistics for recycling
Reference Main topics
investigated
Material (in) Material (out) Driver(s)
Guiltinan and
Nwokoye (1975)
Reverse logistics
networks
Recyclables in
general
Materials Social benefits
Economic benefits
Pohlen and Farris
(1992)
Reverse logistics
networks
Transportation
issues
Plastics (*) Environmental
concerns
Bronstad and
Evans-Correia
(1992)
Purchase of
recycled materials
Paper Paper (*)
Kopicki et al.
(1993)
Logistic
implications of
recycling (and
reuse) programs
Recyclables in
general
Materials Social benefits
Economic benefits
Gupta and
Chakraborty (1994)
Planning and
control of recovery
activities
Glass scrap Raw materials Cost savings
Jahre (1995) Reverse logistics
networks
Household waste Substitutes for
primary
materials
Legislation
Faria de Almeida
and Robertson
(1995)
Incentives to
stimulate recovery
(timely and clear
information)
Batteries Materials (*)
Spengler et al.
(1997)
Reverse logistics
networks (private
networks)
Steel products Reusable
products
Disposal cost saving
Public waste
management
Fuller and Allen
(1997)
Reverse logistics
networks
Post-consumer
recyclables
Substitutes for
primary
materials
Legislation
Yender (1998) Incentives to
stimulate recovery
(Easy and simple
method of supply)
Batteries Raw materials
Batteries
(*)
Barros, Dekker and
Scholten (1998)
Reverse logistics
networks (public
networks)
Construction waste Sand Waste disposal
Environmental
regulation
Nagel and Meyer
(1999)
Information and
communication for
reverse logistics
End-of-use
refrigerators
Plastics
Metals
No longer needed
Legislations
Costs savings
Lowers, Kip,
Peters, Souren and
Flapper (1999)
Reverse logistics
networks (private
networks)
Carpets Fibres, etc. Image
Expected legislation
Economic advantages
Realff, Ammons
and Newton (2000)
Reverse logistics
networks (private
networks)
Carpets Fibres (*)
Chang and Wei
(2000)
Reverse logistics
networks (public
networks)
Household waste (*) Waste disposal
Reducing costs
Environmental
concern
Note: (*) Not mentioned.
Although the concept of reverse logistics arises in the 1990s, the discussion on the structure of
logistics channels begins much earlier. Guiltinan and Nwokoye (1975) identify the main types of
logistics structures, functions and members that form part of the distribution channel. The study also
points out a number of key factors for the future development of recycling channels, such as “[the need
to expand] efforts in identifying potential markets and buyers of recycled materials; more extensive
contact with, and promotion to, final buyers; [in expanding] capacity for moving increased volumes of
material to achieve and maintain scale economies; and [in improving] flexibility in transportation”
(Guiltinan and Nwokoye, 1975: 35).
While the study of Guiltinan and Nwokoye (1975) does not focus specific recyclable materials,
Table 1 presents other contributions that address particular reverse logistic networks for recycling.

Int. Journal of Business Science and Applied Management / Business-and-Management.org
4
Pohlen and Farris (1992), for instance, analyze the set-up of recycling networks for plastics and
propose a more complex structure for the reverse channel when compared to the general Guiltinan and
Nwokoye (1975) approach. Pohlen and Farris (1992) discuss the main issues that affect reverse
logistics channels for recycling, namely, efficiency improving factors in terms of existing channels and
common forms of improving recyclables.
As Table 1 shows, some of the studies that address the organization of recycling networks focus
on public networks, while others describe private systems. In the first case, environmental concerns and
waste disposal legislation are the main motivations underlying reverse logistics. Contrary to this notion
are private reverse logistics networks that handle residues or end-of-life products in which recycling is
economically more attractive. Private processors finance the transportation of these materials as well as
the recycling process itself. For recycling to be economically viable, a significant amount of discarded
products (or parts) need to be processed.
The reverse logistics literature for recycling also explores the planning and control of recovery
activities (i.e., the decisions about what to collect, disassemble and process, and in what quantities,
how, when and where), the available information and communication systems (e.g., software, data
requirements), the logistical implications of recycling, and the implementation of programs to increase
the demand of recyclable materials. As Table 1 shows, the studies examining these issues explore only
one type of recyclable material.
Finally, the scope of this research explores the incentives that may stimulate a desired behavior in
specific members who form part of the reverse channels. These incentives look for encourage / impose
cooperation either in terms of reception or delivery of goods for recovery. In the first case, companies
may have some goods that they wish to dispose of, and, through incentives, influence others (e.g., the
goods’ providers) in accepting such requests, in order to avoid high disposable costs. The second case
includes situations in which the purpose is to encourage others (final consumers) to take part in efforts
which allow companies to manage goods (products, parts, packaging) for recovery. Table 1 identifies
three types of non-economic incentives: timely and clear information, general convenience, and an easy
and simple method of supply.
Table 1 evidences that only two studies on reverse logistics for recycling have specifically focused
on household residues and they address the topic of how to design and manage the logistics networks
(Jahre, 1995; Chang and Wei, 2000). In other words, despite the significant amount of research on
reverse logistics during the last years, no study has so far identified what elements of customer service
are important predictors of consumer involvement in the reverse logistics system for recycling. To
fulfil this research gab is the overall objective of the current study.
3 CONCEPTUAL FRAMEWORK AND RESEARCH HYPOTHESES
Incentives are of particular relevance in the context of encouraging consumer to separate and
properly dispose of household packaging residues for recycling. In this case, the consumer is the
starting point of any reverse logistics for recycling household waste and, therefore, his or her
participation is a needed condition for a recycling system to exist. Although this topic has not been
explored in the reverse logistics literature, in the field of environmental social-psychology, some
studies address the predictive effect of a convenient recycling program in articulation with other
potential determinants of environmentally friendly behavior. Essentially, the review of the literature
shows that an increase in consumer involvement can result from the following aspects: (1) closer
proximity of disposal recipients, (2) minimal complexity in storing and storage of recyclable materials,
(3) accessible information on what is recyclable and the location of collection points, and (4) reliable
frequency of collection. Table 2 summarizes the main characteristics and conclusions from these
studies.

Patricia Oom do Valle, Joao Menezes, Elizabeth Reis and Efigenio Rebelo
5
Table 2: Customer service elements as predictors of recycling behavior
Consumer-service
levels
Reference Variable under
analysis
Participants Finding (*)
Proximity of disposal
recipients
De Young (1990) Self-reported
recycling
Residential
households
+
Folz (1991) Participation in
recycling
Residential
households
+
Folz and Hazlett
(1991)
Participation in
recycling
Residential
households
+
Vining and Ebreo
(1992)
Self-reported
recycling
Residential
households
+
Pelton, Strutton,
Barnes and True
(1993)
Willingness to
participate in a
recycling program
Residential
households
+
Margai (1997) Self-reported
frequency of recycling
and observed amount
of collected materials
Residential
households
+
Ludwig, Gray and
Rowell (1997)
Participation in
recycling
College students +
Saphores, Nixon,
Oladele, Ogunseitan
and Shapiro (2006)
Self-reported
recycling
Residential
households
+
Minimal complexity in
separating and storing
Gamba and Oskamp
(1994)
Self-reported
recycling
Residential
households
+
Reliable frequency of
collection
Jacobs, Bailey and
Crews (1984)
Participation in
recycling
Residential
households
+
Foshay and Aitchison
(1991)
Amount of collected
material
Residential
households
+
Folz (1991) Participation in
recycling
Residential
households
0
0’Connor (1993) Amount of collected
material
Residential
households
+
Availability of
information about
Luyben and
Cummings (1981-82)
Amount of collected
material
College students +
what to recycle and
where
Jacobs, Balley and
Crews (1984)
Participation in
recycling
Residential
households
+
Burn and Oskamp
(1986)
Participation in
recycling
Residential
households
+
De Young (1989) Self-reported
recycling
Residential
households
+
De Young (1990) Self-reported
recycling
Households from
communities with
recycling education
programs
+
Diamond and Loewy
(1991)
Observed participation
in recycling
College students +
Hopper and Nielsen
(1991)
Self-reported
frequency of recycling
Residential
households
+
Folz (1991) Participation in
recycling
Residential
households
0
Folz and Hazlett
(1991)
Participation in
recycling
Residential
households
0
Austin, Hatfield,
Grindle and Balley
(1993)
Amount of collected
material
College students +
Thogersen (1994) Self -reported and
observed recycling
Residential
households
+
Nyamwange (1996) Self-reported
frequency of recycling
Residential
households
+
Leroux (2000) Rate of waste
reduction
Residential
households
+
Note:(*) Legend +: significant positive relationship; -: significant negative relationship; 0: non-significant
relationship.

Int. Journal of Business Science and Applied Management / Business-and-Management.org
6
Based on the literature review, Figure 1 depicts the proposed model of consumer involvement in
the reverse logistics system for recycling. The model establishes a direct causal-effect relationship of
customer service in terms of consumer involvement. The following hypothesis establishes this
connection:
Figure 1: Conceptual model of customer service in the reverse logistics system for recycling
Hypothesis 1: Customer service explains consumer involvement in the reverse logistics system
for recycling household packaging.
In terms of forward distributor channels, Maltz and Maltz (1998) state that the concept of
customer service includes two common levels: (1) hard level that corresponds to objective or basic
customer services, and (2) soft level that refers to perceptual customer service elements, besides those
of basic service. The logistics literature widely accepts this classification of customer service levels
(Dadzie et al., 2005; Mentzer et al., 1989; Stock and Lambert, 2001).
Earlier research is clear about the meaning of basic customer service in forward reverse logistics.
As Dadzie et al. (2005) summarize, this construct includes in-stock availability and cycle time. The
literature on reverse logistics for recycling does not address this issue. This study proposes that the hard
elements of customer service lie in the accessibility to the selective collection recipients. By providing
this basic element to consumers, the reverse logistics system for recycling can operate. The remaining
customer service elements that Table 2 presents depend on this element, that is, they are important only
if communities have specific recipients for separated materials at their disposal. Consumers may
perceive the separation process as satisfactory, understand how and why to separate, believe that, in
general, the collection frequency is adequate, but without a collection service in place (well located and
not too distant) they will not participate in the recycling program. The second research hypothesis
represents these considerations:
Hypothesis 2: The hard level of customer service in the reverse logistics system for recycling
household packaging consists in the access to the selective collection facilities.
Identifying the soft elements of customer service in the forward reverse logistics systems is not as
clear as identifying hard elements. According to the definition proposed by Dadzie et al. (2005), soft
elements are those other than in-stock availability or time cycle, that is, those that are not basic service.
These elements are not objective but instead perceptual and result from suppliers’ ability to respond to
specific customer requests (Maltz and Maltz, 1998). In forwards reverse logistics systems, soft
customer service elements include error correction, follow up on customer complaints, after sales
services, and effectiveness in the handling of information (La Londe and Zinszer, 1976).
The current study on the elements of customer service in reverse logistics for recycling follows a
similar approach and considers that the soft elements go beyond just basic service, that is, beyond the
easy access to specific disposal recipients for recyclable materials. As Maltz and Maltz (1998) refer,
soft elements result from consumers’ perceptions about customer service rather than from the objective
characteristics of this service. Therefore, soft elements should necessarily include the perceived
Customer
service
Hard level (Access to disposal
containers)
Consumer
commitment
Soft level (Elements other
than accessibility to
disposal recipients)
H1
H2
H3
H4
H4

Patricia Oom do Valle, Joao Menezes, Elizabeth Reis and Efigenio Rebelo
7
complexity in storing and separating the recyclable materials, the availability of information on how to
recycle and where to dispose of the recyclable materials and a reliable periodic collection. Table 2
summarizes the existing research on these elements. Besides these elements, this study explores
whether hygiene, design and security at the disposal locations, as well as available support and claim
services have an important soft elements of customer service. Based on this discussion, the study
establishes a third research hypothesis:
Hypothesis 3: The soft level of customer service in the reverse logistics system for recycling
household packaging includes all elements beyond accessibility to the selective collection facilities.
As Table 2 shows, research has focused mostly on the proximity element of disposal recipients
and, according to studies, has a consistent and positive effect on consumer participation in terms of
recycling. This Table also suggests that the effect of the remaining elements (soft elements, as this
study looks to show) on consumer participation is only moderately apparent. In fact, some studies show
that the more complex the sorting process is, together with limited recycling information, the lower the
recycling participation rates. However, a small number of studies find a non-significant relationship
between these variables. Given these considerations, and the fact that soft level of customer service can
only exist after the provision of the hard level, the final research hypothesis is as follows:
Hypothesis 4: The hard level of customer service is the main determinant for consumer to commit
to the reverse logistics systems for recycling, followed then by the soft level.
4 METHODS
4.1 Setting
The Green Dot Society (GDS) is a private company, created in 1997 with the purpose of managing
the Integrated Recovery System of Packaging Waste Management (IRSPWM). Currently, GDS is the
only company that develops this type of activity in Portugal. GDS is essentially a reverse logistics
aggregator with a shareholder structure composed of three holdings that represent almost 200
companies. The first holding represents the packagers/importers, the second represents the distribution
and retail trade, and the third represents the manufacturers and recyclers of packaging material. In
compliance with national legislation, GDS aims to recover 60% of the overall packaging weight and
recycle 55% of this material by the end of 2011. Recyclable materials include glass, paper/cardboard,
lightweight packaging (plastic, metal) and wood. With the exception of this last type of material, drop-
off systems, often referred to as eco-points, allows for the collection of packaging residues.
As in other European countries, the IRSPWM relies on the principle of shared environmental
responsibility. Packers and importers finance the system, based on the polluter-pays principle in which
the amount and weight of the corresponding packaging material, commonly known as the green spot
value, regulates the fee they must pay. In turn, packers and importers receive permission to mark their
packaging with the Green Spot symbol, which shows that these companies transfer their recovery
responsibility to GDS and the IRSPWM. The distribution role ensures that their commercial confines
only sell non-reusable packaging through the Integrated System. The GDS’s business structure does not
include municipalities though they are responsible through contract agreement for the multi-material
collection and sorting of household packaging residues.
Consumers should necessarily separate and dispose of their packaging waste at the eco-point. The
packaging manufacturers complete the cycle by securing the recycling of collected household
packaging. The GDS’s overall mission is to manage the reverse supply chain, finance and guarantee the
functioning of the entire system. This corporation invests a major part of its annual overall income to
compensate for the additional costs that municipalities incur with multi-material collection and sorting.
GDS also sub-contracts transportation services that handle packaging residues for recycling companies
and ensures that they receive, store and recycle recovered material.
4.2 Questionnaire
Data of this research result from personal interviews performed in April and May of 2006 based
on a structured questionnaire (appendix 1). The questionnaire design took into account an extensive
review of scientific and practitioner publications on recycling behavior, interviews on key elements of
GDS management and benchmark studies carried out in other European countries (Spain, Italy and
Belgium). The questionnaire encompasses three sections. Section 1 conducts an inquiry of the socio-
demographic characteristics: gender, age, educational qualification, marital status, occupation,

Int. Journal of Business Science and Applied Management / Business-and-Management.org
8
residence type, home ownership and family monthly income. Section 2 involves eleven elements
(included in the earlier study) characterizing customer service in the reverse logistics system for
recycling: (1) location of disposal recipients, (2) frequency of waste collection, (3) distance to the
disposal recipients, (4) number of disposal recipients, (5) cleaning and maintenance of disposal
recipients, (6) local safety, (7) emptying regularity, (8) available information, (9) support and claim
service, (10) system adequacy to lifestyle, and (11) number and type of suitable waste materials. A
Likert five-point scale assesses these elements, ranging from 1 – very unsatisfied to 5 – very satisfied.
Section 3 looks to measure consumer involvement in the recycling program and considers two
questions. The first measures the self-reported household recycling behavior (scale: 1 – separates and
selectively discards recyclable waste, 0 – does not separates and selectively discards recyclable waste).
The second evaluates the frequency of separation and disposal of recyclable materials at the eco-points
(scale: 1 – never, 2 – sometimes, 3 – always).
4.3 Sample and data
The study population encompassed the adult Portuguese citizens living in Faro city. Faro is the
capital of Algarve, located in the southern Portugal, comprehending six parishes. Faro has a total
population of 58 350 inhabitants and its most important economic activities are tourism and services.
From this population, the study selected a random sample of 267 citizens. The calculation of the sample
used the most conservative estimate for a single proportion (p = 0.5), a confidence level of 95% and a
maximum error of 6%. The study used stratified sampling and the distribution of the interviews
according to parishes was proportional to the resident population. In each parish the most important
shopping street was selected as the location to perform the interviews. College students administered
the questionnaires to respondents in those streets, with respondents chosen at random, according to a
systematic procedure. A questionnaire was delivered to the first person (older than 14) passing near the
interviewer at a defined hour. Then, a sampling interval of 5 people was established in order to select
the remaining respondents and, thus, to fill the sample stratum defined to each parish. Each respondent
received an explanation of the nature of the questionnaire.
Table 3 summarizes the socio-demographic characteristics of the respondents along with some
household features and participation patterns. Around 61% of respondents replied as being active
participants in the recycling program. The profile of the respondents corresponds roughly to that in the
previous national study (GDS, 2000). Most respondents were females (59.4%), between the ages of 26–
35 (27.2%) and 36–45 (18.2%), married (51.1%) and university degree holders (34.2%).
Table 3: Characteristics of the sample
Variables Distribution of answers
Gender 59.4 % female 40.6% male
Age 14 – 25: 15.1%
26 – 35: 27.2%
36 – 45: 18.2%
46 – 55: 17.0%
56 – 65 :11.0%
66 – 94: 11.5%
Education level 4 years: 10.1%
6 years: 7.3%
9 years: 9.0%
12 years: 26.7%
technical/ professional: 12.7%
College or higher: 34.2%
Median education level: 12 years
Occupation Farmer/fisher: 1%
Workman: 14.1%
Services worker: 22.4%
Public worker: 8.2%
Teacher: 7.3%
Liberal worker: 5.4%
Manager: 9.2%
Retired: 5.1%
Housewife: 4.3%
Student: 18.0%
Other: 5.1%
Marital status Married: 51.1%
Single: 34.0%
Divorced: 9.8%
Widow:5.1%
Residence type Apartment: 63%
House: 27%
Farm: 10%
Home ownership Own/are buying: 75%
Renting: 18%
Familiar: 7%
Monthly family income Less than 324 €: 2.1%
324 € – 499 €: 10.3%
500 € – 999 €: 39.3%
1000 € – 1999 €: 31.2%
2000 € – 2999 €: 11.7%
At least 3000 €: 5.4%
Self-reported recycling
behavior
Uses to separate and selectively
dispose of: 61%
Do not separate nor selectively
dispose of: 39%
Frequency of separation and
disposal of recyclable materials
Never: 22%
Sometimes: 27%
Always: 51%

Patricia Oom do Valle, Joao Menezes, Elizabeth Reis and Efigenio Rebelo
9
4.4 Data analysis methods
This study uses the following methods of multivariate data analysis: exploratory factor analysis
(EFA), confirmatory factor analysis (CFA) and discriminant analysis (DA). EFA and CFA enable the
assessment of hypotheses 2 and 3. DA permits to test hypotheses 1 and 4.
The application of EFA with varimax rotation on the set of eleven elements of customer service
allows for the reduction of the proposed instrument’s dimensionality (Hair et al., 1998; Reis, 1997).
The computation of the Kaiser-Meyer-Olkin (KMO) statistic and the results from the Bartlett test
establishes whether using EFA is possible in this research. The KMO statistic is a ratio that ranges from
0 to 1, and should be at least 0.7 for EFA be acceptable. The Bartlett test examines whether the
correlation matrix of the variables is significantly different from the identity matrix. The use of EFA is
adequate if this test rejects the null hypothesis that these matrices are equal. The Alfa Cronbach
coefficients evaluate the reliability of the final customer service factors that result from the EFA.
CFA evaluates the factors’ psychometric properties in terms of reliability and validity, based on
the AMOS 6 software package. The prior EFA defines the model that CFA requires to associate the
latent factors to the observed customer service elements (the observed variables). Given the absence of
normality in the data, this analysis uses the weighted least squares estimation method (Schumacker and
Lomax, 1996).
The analysis of the overall model fit relies on three types of measures: absolute fit, incremental fit
and parsimonious fit (Hair et al., 1998). The absolute fit evaluation adopts the Chi-square goodness-of-
fit test, the goodness of fit index (GFI) (Joreskog and Sorbom, 1986) and the root mean square residual
of approximation (RMSEA) (Steiger, 1990). The Chi-square test is a general indicator of how well the
estimated model fits with the data. The Chi-square value should be low and not statistically significant
to achieve goodness of fit. Similarly, the GFI should exceed 0.9 (GFI range from 0 to 1 with 1 meaning
perfect fit) and the RMSEA show be low (zero suggests a perfect fit). This study considers the
following incremental fit measures: the adjusted goodness of fit index (AGFI) (Joreskog and Sorbom
1986), the normed fit index (NFI) (Bentler and Bonnet, 1980), the Tucker and Lewis index (TLI)
(Tucker and Lewis, 1973), the incremental fit index (IFI) (Bollen, 1988) and the comparative fit index
(CFI) (Bentler, 1990). These measures range from 0 (no fit) to 1 (perfect fit). The parsimonious fit
index that this study observes is the normed Chi-square measure (Joreskog, 1969) that should range
from 1 to 5, ideally.
The interpretation of the results of CFA follows with a reliability assessment of the proposed
measurement model. Reliability analysis refers to whether the observed variables (i.e., the customer
service elements), chosen to indicate each latent variable (i.e., each customer service factor or level),
are actually measuring the same concept. This study considers two measures of reliability: composite
reliability and variance extracted. Composite reliability shows the degree to which the observed
variables adequately represent the corresponding latent variable. Variance extracted complements the
composite reliability and expresses the total variance of the observed variables that the latent variable
explains. The latent variables present appropriate levels of reliability if composite reliability and
variance extracted exceeds the acceptance level of 0.7 and 0.5, respectively (Scharma, 1996).
Next, the analysis focuses on the evaluation of the convergent and discriminant validity of each
latent variable (customer service level). Convergent validity evaluates whether the observed variables
really measure the corresponding latent construct. The significance and the size of the observed
variables’ weights permit evaluating of this type of validity (Bollen, 1989). Discriminant validity
focuses on whether strong correlations exist between the latent constructs (which indicates poor
discriminant validity) or weak correlations (which suggests strong discriminant validity). Within the
CFA method, the matrix of standardized correlations between the latent variables allows assessment of
this type of validity. This study expects a significant correlation between the latent constructs since
they represent the dimensions of a general construct, the customer service. Another expected result is
that these correlations, although statistically significant, are not very high, because the latent constructs
should be measuring different levels of customer service (hard and soft). Hair et al. (1998) suggest that,
for purposes of discriminant validity, the correlations between latent variables should not exceed 0.7.
DA uses the final customer service levels that EFA and CFA suggest as discriminant variables.
This study carries out two DAs. In the first one, the dependent variable represents self-reported
recycling behavior, with two categories (1 – separates and selectively discards reusable waste, 0 – does
not separate nor selectively discards reusable waste), giving rise to one discriminant function. For the
second DA, the dependent variable is the frequency of separation and disposal of recyclable materials
at the eco-points, which is tri-categorical (1 – never, 2 – sometimes, 3 – always), producing two
discriminant functions. In each case, the Box M’s test assesses the underlying assumption of the DA,
that is, that the matrices of variances and covariances for all groups that the dependent variable defines
are equal.

Int. Journal of Business Science and Applied Management / Business-and-Management.org
10
For each DA, the estimation of the discriminant functions uses a random sample of half of the
cases (the analysis sample). The other half (holdout sample) allows validation of DA (Fernández and
Martinez, 2000). For each analysis, the Wilks’s lambda statistics test whether the discriminating
function(s) significantly differentiates the groups defined by the dependent variable. In this test, the
null hypothesis is that the groups defined by the dependent variable have the same mean in the
discriminating function(s).
To assess the predictive ability of the discriminant function(s), this study analyses the
classification matrix that results from each DA. Inside this matrix, the number of cases that the analysis
correctly classifies within each group appears on the principal diagonal. The overall hit ratio is the
global percentage of correct classifications in all the groups.
Two procedures evaluate the classification accuracy of the discriminant functions (Huberty, 1994;
Klecka, 1980). The first procedure compares the overall hit ratio for both samples (the analysis sample
and the validation sample) either with the maximum chance criterion or with the proportional chance
criterion. The maximum chance criterion is the percentage of cases in the larger group. Alternatively,
the proportional chance criterion takes into account the proportion of cases in all groups. In particular,
for a dependent variable with k categories (i.e., k groups), the expression is as follows: k
2
pro i
i 1
C p
where pi is the percentage of cases in group i (i=1,2,…k). The second procedure is to establish and
evaluate the Press' Q statistic. This statistic tests the null hypothesis which states that the discriminating
ability of the classification function(s) is not significantly different than the classification by chance.
The null hypothesis in this test is that the number of cases correctly classified resulting from the
discriminant analysis does not exceed the number of cases correctly classified by chance. The Press' Q
statistic should be high and statistically significant for the purpose of DA’s validation.
5 RESULTS
5.1 Exploratory factor analysis
EFA allows the reduction of the original eleven elements into two factors, in which both account
for 71.3% of the total variance (KMO = 0.87; Bartlett test p = 0). Table 4 summarizes the main results
of this analysis. The observation of the elements with higher loadings for each factor justifies the
corresponding chosen label. Factor 1, hard level, gathers the customer services elements (CSE) that
reflect the availability and accessibility to selective collection recipients: the distance to the disposal
recipients, their location and the available quantity. Factor 2, soft level, includes the remaining elements
such as aspects relating to disposal conditions (indicated by local safety, cleaning and maintenance and
frequency of waste collection), available information on recycling (indicated by information
availability, support and claim services) and system adequacy (indicated by system adequacy to
lifestyle and number and type of accepted materials). The high Cronbach’s alpha coefficients for each
factor suggest that they have a very good degree of internal consistency. The factors take into account
the hypothesized customer service elements, a sign in support of hypotheses 2 and 3.
Table 4: Customer service elements (CSE) and factors (After varimax rotation)
Factors Loadings % of Explained Variance
and Cronbach
Factor 1 – Hard level
CSE3 – Distance to the disposal recipients 0.86 42.1%
CSE1 – Location of disposal recipients 0.78 Cronbach =0.92
CSE4 – Number of disposal recipients 0.56
Factor 2 – Soft level
CSE2 – Frequency of waste collection 0.84 29.2%
CSE6 – Local safety 0.81 Cronbach =0.87
CSE11 – Number and type of accepted waste materials 0.73
CSE7 – Emptying regularity 0.71
CSE5– Cleaning and maintenance of disposal recipients 0.69
CSE8 – Available information 0.64
CSE9 – Support and claim service 0.62
CSE10 – System adequacy to lifestyle 0.59

Patricia Oom do Valle, Joao Menezes, Elizabeth Reis and Efigenio Rebelo
11
5.2 Confirmatory factor analysis
Figure 2 shows the standardized estimates on the CFA model. Regarding the absolute fit
evaluation, the Chi-square statistic reports a low and not statistically significant value (p > 0.05),
suggesting that the model adequately describes the data. The remaining measures of overall fit also
present favorable results, indicating an adequate incremental and parsimonious fit: the GFI exceeds 0.9
and the RMSEA are close to 0; the AGFI, the NFI, the TLI, the IFI and the CLI exceed 0.9; the normed
Chi-square lies in the 1 to 5 interval.
For the latent variable hard level, the composite reliability coefficient is 0.76 and the variance
extracted is 0.51. For the soft level, the reliability measures are 0.89 and 0.50, correspondingly. For
both latent variables, these values exceed the minimum threshold of 0.7, in terms of composite
reliability, and are at least 0.5, in terms of the variance extracted. These results support the EFA
findings concerning the factors’ reliability, according to the Cronbach’s alpha coefficients. In terms of
the convergent validity analysis, Figure 2 shows that all observed variables have positive weights that
exceed the acceptable level of 0.4 (Hair et al., 1998). All weights are statistically significant (t tests: p =
0.00). In terms of discriminant validity, Figure 2 reveals that the correlation level between the latent
variables is 0.58. This correlation is moderately high, indicating a correlation between the two latent
variables (i.e., both represent levels of the same construct: customer service) which is not too strong
(i.e., each level captures a somewhat different perspective of the customer service construct).
Thus, EFA and CFA specify two final customer services levels whose contents provide support to
research hypotheses 2 and 3.
Figure 2: Confirmatory factor analysis of customer service elements. Standardized estimates
Note: Chi-square = 59.6 (p = 0.07), GFI = 0.94, RMSEA = 0.03, AGFI = 0.91, NFI = 0.89, TLI = 0.97, IFI =
0.97, CFI = 0.98, Normed Chi-square = 1.32.
5.3 Discriminant analysis
The first DA uses the two factors produced by the EFA as independent or discriminating variables
and the self-reported recycling behavior as the dependent variable (Box’s M test p = 0.17). For the
second DA, the dependent variable indicates participation frequency (Box’s M test p = 0.08). In both
cases, the Wilks’s lambda tests reveal that the groups, defined by the dependent variables, are
statistically different in terms of the customer service satisfaction level (Wilks’s lambda tests: p = 0).
The two discriminant functions arising from the second DA, are both significant in separating the
groups (canonical correlation for the first discriminant function = 0.93; canonical correlation for the
second discriminant function = 0.86; explained variance for the first discriminant function = 68.8%;
explained variance for the first discriminant function = 31.2%). Thus, these findings support the
research hypothesis that variables related to customer service elements determine consumer
involvement in the reverse logistics system for recycling (Hypothesis 1).
The overall hit ratio for both the analysis and holdout samples evaluates the predictive accuracy of
the discriminant functions (one in the first DA, two in the second DA). These ratios (72% and 68.2%,
respectively, in the first DA and 69% and 65.4%, in the second DA) significantly exceed the levels of
the proportional chance criterion and the maximum chance criterion (in both analyses, and in terms of
both criteria, Press Q statistic > χ2
(1) for a significance level of 0.05).
Table 5 reports the structural coefficients, representing the correlations between the discriminating
variables and the discriminant functions. Both levels are statistically significant in discriminating the
Hard level
CSE1
Soft level
CSE3 CSE2 CSE6 CSE11 CSE7 CSE5 CSE4 CSE8 CSE9 CSE10
0.89 0.87 0.60 0.81 0.77 0.87 0.86 0.78 0.52 0.56 0.63
0.58
e3 e1 e4 e2 e6 e11 e7 e5 e8 e9 e10
0.48 0..61 0.71 0.52 0.48 0.42 0.59 0.61 0.65 0.54 0.50

Int. Journal of Business Science and Applied Management / Business-and-Management.org
12
groups because in the both DAs and in all the discriminant functions, the structural coefficients exceed
the minimum absolute value of 0.3 (Hair et al., 1998). However, as this table shows, of the two
variables in the first DA, the hard level has the highest structural coefficient and, thus, this factor
discriminates the most; on the contrary, the soft level reports the lowest structural coefficient and,
therefore, this factor discriminates the least. The same finding occurs in the second DA in terms of the
first discriminant function, this of which is the most important. In other words, the fourth research
hypothesis (Hypothesis 4) should not be rejected.
Table 5: Structure matrix of discriminant analyses
Discriminating Variables Structural Coefficients
DA1 DA2
Discriminant function 1 Discriminant function 2
Hard level 0.75 0.71 -0.33
Soft level 0.62 0.54 0.68
6 DISCUSSION AND CONCLUSION
Consumers are the foremost and decisive link in a reverse logistics chain that aims to recycle
household packaging residues. In fact, without consumers’ involvement and continuous collaboration,
this system cannot exist. This article explores the importance of consumer motivation to participate in
the IRSPWM by ensuring that the recyclable materials are available for the recycling industries. By
using a combination of multivariate statistical methods, this study shows the importance of providing
consumer convenience in order to gain greater involvement in reverse logistics systems for recycling.
On the whole, the research supports the conceptual model of customer service (Figure 1). As in the
traditional forward logistics systems, customer service in the reverse logistics system for recycling
comprises hard and soft levels (hypotheses 2 and 3). As hypothesized, both levels explain consumer
involvement (hypothesis 1), with the hard level representing the most important predictor (hypothesis
4).
This study has theoretical contributions and managerial implications.
Previous studies in forward logistics identify the elements that form the customer service construct
and explore the importance of providing an adequate level of customer service. The first theoretical
contribution of this article lies in exploring this issue in the specific context of reverse logistics for
recycling. The EFA and CFA that this study employs show that the hard level of customer service in
the reverse logistics chain also corresponds to the basic service, which, in this case, means easy access
to specific disposal recipients for recyclable materials. These analyses also show that other customer
service elements form the soft level. These findings support those found in the forward logistics
research. The second theoretical contribution of this study concerns a comprehensive analysis of a
service based on convenience in order to enhance recycling behavior. In fact, existing literature in the
field of environmental social psychology addresses some customer service elements individually
(Table 2). This study focuses on the various elements as a whole, combining them into a single
analysis, and adding new elements (hygiene, security at the disposal sites and the existence of support
and claim services), revealing to be significant factors.
Overall, this study substantiates that consumers are sensitive to several customer service elements
and that their evaluation of this service determines the current self-reported recycling behavior and the
frequency of involvement. These results have managerial implications. The first one is that meeting
customer service demands in terms of customer service requirements must be a priority in planning this
type of reverse logistics networks. This is not difficult to carry out because the customer service
elements of the reverse logistics system for household packaging are manageable variables. Therefore,
their evaluation reveals opportunities and insight to improve the effectiveness of the customer service
concept and, as a consequence, increase consumer involvement in the system.
The study also observes the customer service levels by taking into account their relative
importance in fostering consumer involvement: the hard level is relatively more important than the soft
level. This finding also has managerial implications since it helps prioritize the overall logistics needs
for a more effective selective-collection system. Although the overall organization and performance of
the Portuguese reverse logistics system for recycling requires global improvement, an important
priority us defining the location of the eco-points in terms of easier and more convenient population
access. In establishing this, focus should turn to aspects such as available support and claim service,
more recycling awareness campaigns, and general disposal conditions (cleaning, maintenance, safety,
etc).

Patricia Oom do Valle, Joao Menezes, Elizabeth Reis and Efigenio Rebelo
13
Reverse logistics systems with centralized the disposal facilities (as is the case with the eco-points
in Portugal) are more inconvenient because consumers must transport and deposit recyclable materials
at drop-off points. However, these systems are also less expensive than the curbside alternative. In
curbside schemes, collection is door-to-door, which increases convenience but also collection costs and
ultimately the overall cost of the system. A less expensive collection option is to maintain eco-points
and invest in more convenient locations. However, considering the relative importance of the hard
customer service level as the main determinant of consumer involvement, the possibility of providing
curbside collection, at least temporarily and in a few municipalities, should be considered. As this study
shows, shortening the distance that consumers have to travel to reach the collection points is the best
way to obtain greater involvement. The improvement of the quality and quantity of the collected
materials may compensate the additional collection costs of curbside collection. This is as aspect that
clearly deserves further investigation.
As this study demonstrates, the soft level also explains consumer involvement in the reverse
logistics system. Systems based on eco-points reduce the monetary separation costs because consumers
do not receive financial compensation for their sorting and discarding activities. Given that the current
system demands significant efforts on the part of consumers, this may reduce their willingness to
recycle. A more convenient alternative would be not to expect consumers to separate recyclables, that
is, to allow them to discard all the recyclable materials into a single recipient and assign the
responsibility of the separation process to Material Recovery Facilities. Although such a strategy can
reduce the system’s complexity from the consumer perspective this substantially increases separation
costs and, thus, the total cost of the system. A similar problem would incur if the improvement of
customer service implies a change to a commingled collection system (in contrast to multi-material
collection) or the implementation of a more frequent collection system. These strategies are likely to
improve the soft level of customer service in terms of reducing the perceived sorting complexity and
solving the (lack of) maintenance and design appeal of disposal recipients. The potential of these
strategies and their effects on separation and transportation costs is also a future research avenue.
An additional alternative and intermediate strategy that can improve the soft level of customer
service is to maintain the current multi-material collection based at the eco-points and promote
marketing campaigns to increase consumer awareness for greater involvement. Campaigns can also
demystify exaggerated negative expectations about the recycling system. Implementing curbside
collection, on a larger scale, is also a solution for reducing the sorting complexity, since information
exchange is possible on a one-to-one basis. However, and as referred, the implementation of such a
collection system requires a detailed cost-benefits analysis.
On the whole, this study clarifies the need to address all customer service elements. An important
limitation, however, is the fact that the sample is small and drawn from a single city and, as a
consequence, the generalization of the conclusions needs additional research. Furthermore, the
improvement of customer service brings challenges whose overcoming requires additional research.
Entities that manage the system must weight the need of increasing consumers’ involvement without
compromising the system’s economic viability. Therefore, an important challenge that such a reverse
logistics system needs to overcome is to find the best way to minimize the strategic costs of the
collection system without affecting consumer service performance. Another challenge that arises in the
reverse logistics systems for recycling is to guarantee that the market absorbs the recycled materials.
The quality of collected packaging residues affects the performance of the system because most soiled
materials either cannot be further recycled or may lead to increased reprocessing costs. In this sense,
additional support should be given to research that promotes the development of new products using
recycled materials and also marketing campaigns that aim to increase consumer awareness in using
such materials.

Int. Journal of Business Science and Applied Management / Business-and-Management.org
14
APPENDIX: SURVEY ON CONSUMERS’ MOTIVATIONS TOWARDS HOUSEHOLD
PACKAGING RECYCLING
I – CHARACTERIZATION OF THE RESPONDENT
Gender: Female Male Age: …..… years old
Education level:
4 years 6 years 9 years 12 years
Technical –professional College or higher
Marital status:
Married Single Divorced Widow
Occupation:
Farmer/fisher Workman Services worker Public worker Teacher
Liberal worker Manager Housewife Student Retired Other
Residence type: House Farm Apartment
Home ownership: Own/Are buying Renting Familiar Monthly family income:
Less than 324 € 324 a 499 € 500 a 999 € 1000 a 1999 €
2000 a 2999 € At least 3000 €
II – SATISFACTION WITH THE RECYCLING SYSTEM OF HOUSEHOLD WASTE
Indicate your satisfaction level with the following aspects concerning the selective-collection
system of recyclable materials. Use the following answer scale:
Very unsatisfied = 1 … Very satisfied = 5
Location of disposal containers
Frequency of waste collection
Distance to the disposal recipients
Cleaning and maintenance of disposal recipients
Local safety
Emptying regularity
Available information
Support and claim service
System adequacy to lifestyle
Number and type of suitable waste materials
III – INVOLVEMENT IN THE RECYCLING PROGRAM
Do you usually separate and selectively discard recyclable waste?
Yes No
With what frequency do you separate and selectively discard recyclable waste?
Never Sometimes Always
Thank you very much for your participation

Patricia Oom do Valle, Joao Menezes, Elizabeth Reis and Efigenio Rebelo
15
REFERENCES
Alvarez-Gil, M. A., Berrone, P., Husillos, F. J. Lado, N. (2007). Reverse logistics, stakeholders’
influence, organization slack, and managers’ posture. Journal of Business Research, 60, 463-473.
Austin J., Hatfield, D., Grindle, A., Bailey, J. (1993). Increasing recycling in office environments: the
effects of specific informative Cues. Journal of Environmental Systems, 6, 355-368.
Barros, A., Dekker, R., Scholten, V. (1998). A two-level network for recycling sand: a case study.
European Journal of Operational Research, 110(2), 199-215.
Bentler, P., Bonnet, D. (1980). Significance tests and goodness of fit in the analysis of covariances
structures. Psychological Bulletin, 88, 588-606.
Bentler, P. (1990). Comparative fit indexes in structural models. Psychological Bulletin, 107, 238-246.
Bollen, K. (1988). A new incremental fit index for general structural equation models. Paper Presented
at 1988 Southern Sociological Society Meetings. Nashville: Tennessee.
Bollen, K. (1989). Structural Equations with Latent Variables. John Wiley and Sons, Inc., New York.
Bronstad, G., Evans-Correia, K. (1992). Green purchasing: the purchasing agent’s role in corporate
recycling. Conference Proceedings of the National Association of Purchasing Management, 117-
121.
Burn, S., Oskamp, S. (1986). Increasing community recycling with persuasive communication and
public commitment. Journal of Applied Social Psychology, 16, 29-41.
Byrne, P, Deeb, A. (1993). Logistics must meet the “green” challenge. Transportation and Distribution,
34(2), 33.
Chang, N, Wei, Y. (2000). Sitting recycling drop-off stations in urban areas by algorithm-based fuzzy
multiobjective nonlinear integer programming modeling. Fuzzy Sets and Systems, 114, 133-149.
Dadzie, K., Chelariu, C., Winston, E. (2005). Customer service in the internet-enabled logistics supply
chain: website design antecedents and loyalty effects. Journal of Business Logistics, 26(1), 153-78
De Young, R. (1989). Exploring the differences between recyclers and non-Recyclers: the role of
information. Journal of Environmental Systems, 18, 341-351.
De Young, R. (1990). Recycling as appropriate behavior: a review of survey data from selected
recycling education programs in Michigan. Resources, Conservation and Recycling, 3, 253-266.
Diamond, W., Loewy, B. (1991). Effects of probabilistic rewards on attitudes and behaviors. Journal of
Applied Social Psychology, 21, 1590-1607.
Emerson, C., Grim, C. (1998). The relative importance of logistics and marketing customer service: a
strategic perspective. Journal of Business Logistics, 19(1), 17-32.
Faria de Almeida, A., Robertson, A. (1995). Domestic batteries and the environment: a life-cycle
approach to consumer electronic products. Proceedings International Conference Clean
Electronics Products and Technology, Edinburgh, Scotland, 162-167.
Fernández, J., Martinez, T. (2000). Análisis discriminante, in: Martinez, T. (Ed.), Técnicas de Análisis
de Datos en Investigación de Mercados. Ediciones Pirámide, Madrid, pp. 383-430.
Folz, D., Hazlett, J. (1991). Public participation and recycling performance: explaining program
success. Public Administration Review, 51(6), 526-231.
Folz, D. (1991). Recycling program design, management, and participation: a national survey of
municipal experience. Public Administration Review, 51(3), 222-231.
Foshay, M., Aitchison, A. (1991). Factors affecting yield and participation in curbside recycling
collection programs. Recourse Recycling March,118-129.
Fuller, D., Allen, J. (1997). A typology of reverse channels systems for post-consumer recyclables, in:
Polonsky J., Mintu-Winsatt A. (Eds.), Environmental Marketing: Strategies, Practice, Theory and
Research. Haworth Press, New York.
Fuller, D. (1978). Recycling consumer solid waste: a commentary on selected channels alternatives.
Journal of Business Research, 6(January), 17-31.
Gamba, R., Oskamp, S. (1994). Factors influencing community residents’ participation in commingled
curbside recycling programs. Environment and Behavior, 26, 587-612.
Giuntini, R., Andel, T. (1995). Advance with reverse logistics – Part 1. Transportation and Distribution,
36(2), 73-77.

Int. Journal of Business Science and Applied Management / Business-and-Management.org
16
Guiltinan, P., Nwokoye, N. (1975). Developing distribution channels and systems in the emerging
recycling industries. International Journal of Physical Distribution, 6(1), 28-38.
Gupta, T., Chakraborty, S. (1994). Looping in a multistage production system. International Journal of
Production Research, 22, 299-311.
Hair, J., Anderson, R., Tathan, R., Black, W. (1998). Multivariate Data Analysis with Readings. fifth
ed. Prentice-Hall, Upper Saddle River.
Hopper, J., Nielsen, J. (1991). Recycling as altruistic behavior: normative and behavioral strategies to
expand participation in a community recycling program. Environment and Behavior, 23(2), 195-
220.
Huberty, C. (1994). Applied Discriminant Analysis. John Wiley and Sons, Inc., New York.
Jacobs, H., Balley, J, Crews, J. (1984). Development and analysis of a community-based recourse
recovery program. Journal of Applied Behavior Analysis, 17, 127-145.
Jahre, M. (1995). Household waste collection as a reverse channel: a theoretical perspective.
International Journal of Physical Distribution and Logistics Management, 25(2), 39-55.
Johnson, P. (1998). Managing value in reverse logistics systems. Transportation Research, 34(3), 217-
227.
Joreskog, K., Sorbom, D. (1986). LISREL VII: Analysis of Linear Structural Relationship by
Maximum Likelihood and Least Square Method. Mooresville, Scientific Software.
Joreskog, K. (1969). A general approach to confirmatory maximum likelihood factor analysis.
Psychometrika, 34, 183-202.
Klecka ,W. (1980). Discriminant Analysis. Sage Publications, Inc., Newbury Park.
Kopicki, R., Berg, M., Legg, L., Dasappa, V., Maggioni, C. (1993). Reuse and Recycling – Reverse
Logistics Opportunities. Council of Logistics Management. Oak Brook, Illinois.
La Londe, Bernard, J., Zinszer, P. (1976). Customer Service: Meaning and Measurement. Oak Brook,
Council of Logistics Management.
Leroux, K. (2000). Tips for winning the recycling race. American City and County, May, 44-56.
Louwers, D., Kip, B., Peters, E., Souren, F., Flapper, S. (1999). A facility location allocation model for
reusing carpet materials. Computers and Industrial Engineering, 36, 855-869.
Ludwig, T. D., Gray, T. W., Rowell, A. (1997). Increasing recycling in academic buildings: a
systematic replication. Journal of Applied Behavior Analysis, 31(4), 683-686.
Luyben, P., Cummings, S. (1981-82). Motivating beverage container recycling in a college campus.
Journal of Environment Systems, 11, 235-245.
Maltz, A., Maltz, E. (1998). Customer service in the distributor channel: empirical findings. Journal of
Business Logistics, 19(2), 103-130.
Margai, F. (1997). Analyzing changes in waste reduction behavior in a low-income urban community
following a public outreach program. Environment and Behavior, 29(6), 769-792.
Marien, E. (1998). Reverse logistics as competitive strategy. Supply Chain Management Review,
14(1), 43-52.
Mentzer, J., Gomes, R., Krapfel, R. (1989). Physical distribution service: a fundamental marketing
concept! Journal of the Academy of Marketing Science, 17(1), 53-42.
Murphy, P. (1986). A preliminary study of transportation and warehousing aspects of reverse
distribution. Transportation Journal, 25(Summer), 12-21.
Nagel, C., Meyer, P. (1999). Caught between ecology and economic: end-of-life aspects of
environmental conscious manufacturing. Computers and Industrial Engineering, 36(4), 781-792.
O’Connor, J. (1993). Adapting recycling programs to meet new needs. Solid Waste and Power, 22-31.
Pelton, L., Strutton, D., Barnes, J., True, S. (1993). The relationship among referents, opportunity,
rewards and punishments in consumer attitudes towards recycling: a structural equations
approach. Journal of Macromarketing, 13(1), 60-77.
Pohlen, L., Farris, M. (1992). Reverse logistics in plastics recycling. International Journal of Physical
Distribution and Logistics Management, 22(7), 35-47.
Realff, M., Ammons, J., Newton, D. (2000). Strategic design of reverse production systems. Computers
and Chemical Engineering, 24, 991-996.
Reis, E. (1997). Estatística Multivariada Aplicada. Edições Sílabo, Lisbon.

Patricia Oom do Valle, Joao Menezes, Elizabeth Reis and Efigenio Rebelo
17
RevLog., 2002. [http://www.fbk.eur.nl/OZ/REVLOG/PROJECTS/TERMINOLOGY/Definitions.html].
Retrieved: January 2007.
Rogers, D., Tibben-Lembke, R. (2001). An examination of reverse logistics practices. Journal of
Business Logistics, 22(2), 129-148.
Rogers, D., Tibben-Lembke, R. (1999). Going Backwards: Reverse Logistics Trends and Practices.
Reverse Logistics Executive Council Press, Pittsburgh.
Saphores, J., Nixon, H., Oladele, A., Ogunseitan, A. (2006). Shapiro household willingness to recycle
electronic waste: an application to California. Environment and Behavior, 38, 183-208.
Scharma S. (1996). Applied Multivariate Analysis. New York, John Wiley and Sons, Inc.
Schumacker, R. E., Lomax, R. G. (1996). A Beginner’s Guide to Structural Equation Modeling.
Lawrence Erlbaum Associates, Inc., New Jersey.
Spengler, T,, Puchert, H,, Penkuhn, T., Rentz, O. (1997). Environmental integrated introduction and
recycling management. European Journal of Operational Research, 97(2), 308-326.
Steiger J. (1990). Structural model evaluation and modification: an interval estimation approach.
Multivariate Behaviour Research, 25, 173-180.
Stock, J., Lambert, D. (2001). Strategic Logistics Management. McGraw-Hill, New York.
Stock, R. (1992). Reverse Logistics. Council of Logistics Management. Oak Brook, Illinois.
Thogersen J. (1994). A model of recycling behavior, with evidence from Danish source separation
Programs. International Journal of Research in Marketing, 11, 145-163.
Tucker, L., Lewis, C. (1973). A reliability coefficient for maximum likelihood factor analysis.
Psychometrika. 38, 1-10.
Turner, G., Lemay, S., Mitchell, M. (1994). Solving the reverse logistics problem: applying the
symbiotic logistics concept. Journal of Marketing Theory and Practice, 2(2),15-27.
Valle, P., Rebelo, R., Reis, E., Menezes, J. (2005). Combining behavioral theories to predict recycling
involvement. Environment and Behavior, 37(3), 364-396.
Valle, P, Reis, E., Menezes, J., Rebelo, R. (2004). Behavioral determinants of household recycling
participation: the Portuguese case. Environment and Behavior, 36(4), 505-540.
Vining, J., Ebreo, A. (1992). Predicting recycling behavior from global and specific environmental
attitudes and changes in recycling opportunities. Journal of Applied Social Psychology, 22(20),
1580-1607.
Yender, G. (1998). Battery recycling technology and collection processes. Proceedings IEEE
International Symposium on Electronics and the Environment, May, 30-35.
Zikmund, W., Stanton ,W. (1971). Recycling solid wastes: a channels-of-distribution problem. Journal
of Marketing, 35(July), 34-39.

Int. Journal of Business Science and Applied Management, Volume 4, Issue 1, 2009
Teleworking in United Arab Emirates (UAE): An empirical
study of influencing factors, facilitators, and inhibitors
Mohamed G. Aboelmaged
Ajman University of Science and Technology
Po Box 346, Ajman, UAE
Tel: +971 (50) 6300652
Email: [email protected]
Abdallah M. Elamin
King Fahd University of Petroleum and Mineral (KFUPM)
Po Box 488, Dhahran 31261, Saudi Arabia
Tel: +966 (5) 98509634
Email: [email protected]
Abstract
This research constitutes an empirical study of influencing factors, facilitators, and inhibitors to the
choice of teleworking mode in the UAE context. The research reveals that gender, marital status,
nationality, residence location, and work profession are relevant, whereas educational level, Internet
use, number of children, age, and years of experience are irrelevant influencing factors for the choice of
teleworking mode. Furthermore, the research identifies six distinct facilitators and seven distinct
inhibitors. The perceived importance of most identified facilitators and inhibitors to the choice of
teleworking mode in the UAE context are found almost similar among the respondents. An exception,
however, is made to the association between choice of teleworking mode and individual freedom,
travel overload, cost reduction, and union resistance. The study outlines the limitations of the present
research and suggests some practical implications and recommendations for managers.
Keywords: teleworking, information technology, facilitators, inhibitors, UAE
Mohamed G. Aboelmaged and Abdallah M. Elamin
19
1 INTRODUCTION
Teleworking has recently received a considerable amount of attention both at the academia and
professional world, as one of the remarkable changes in business practices (Morgan, 2004). The last
few years have witnessed an increasing interest in the concept of teleworking, particularly in Europe
and USA. Current predictions suggest that teleworking may become a common mode of working in
future, as Knight (2004) points out that 20 million people in Europe will be teleworking by 2007,
taking the enterprise boundary with them.
The concept of using information technology to work at a distance from the regular work site,
referred to initially as telecommuting working and later as teleworking. The term first came to wider
public attention in the USA in the early 1970s, when it was initially coined by Nilles in 1973 (Nilles,
1994), and it has been described as a growing trend and the future way of organizing work. In some
publications, telecommuting and teleworking are often used interchangeably, but telework is generally
used in a broader sense, covering a wider array of distributed work. In general, the motives of
telecommuting are mainly aimed at achieving travel-time savings, while teleworkers (which may
include telecommuters) attempt to work in alternative workplaces.
2 LITERATURE REVIEW
Various authors (e.g. Mann, 2000) have pointed out the diverse meanings assigned to the term
"teleworking". Accordingly, several researchers have tried to establish their own definition. For
example Nilles (1994) states that teleworking is ―...the partial or total substitution of
telecommunications technologies, possibly with the aid of computers, for the commute to work‖. In the
same vein, Mokhtarian (1991) contends that the term refers to ―...working at home or at an alternate
location and communicating with the usual place of work using electronic or other means, instead of
physically traveling to a more distant work site‖. Due to such an inconsistency shaping the definition of
the term, one could argue that the definitions applied to telework can be grouped in two main blocks;
on the one hand those that emphasize the location of the teleworker and on the other hand, those that
stress the use of information communication technologies (ICT).
The empirical literature on teleworking has grown significantly over the last decade and most
studies are western-based. Researching teleworking in developing world is unsurprisingly new, an Arab
world being no exception. According to Cooper and Schindler (2003), literature can be descriptive,
conceptual, empirical, or case study in nature. This section reviews the mainstream empirical
teleworking literature.
On empirical side of teleworking research, researchers present results from surveying and
analyzing large number of teleworkers, prospected teleworkers, or companies. Golden (2006), for
example, use a sample of 393 professional-level teleworkers in one organization to investigate the
intervening role of work exhaustion in determining commitment and turnover intentions. Similarly,
Neufeld and Fang (2005) conduct two-phased research study to point out that teleworker beliefs and
attitudes, and the quality of their social interactions with managers and family members, were strongly
associated with productivity. In the similar thought, Thériault et al., (2005) assess differences between
home-based working and teleworking behavior among genders and professions considering age groups,
household status, car access location within the city and travel distances. They conclude that gender,
professional status, and age are influencing factors to the choice to teleworking. For example, older
workers are more likely to telework than younger ones, with the exception of lone parents which are
seeking for more flexibility. Furthermore, Carnicer et al. (2003) analyze the results of a survey about
labor mobility of a sample of 1,182 Spanish employees. Their study indicates that women have lower
mobility than men, and that the mobility of men and women is explained by different factors such as
employee‘s perceptions about job satisfaction, pay fairness, and employment stability. In a study of
emotional impact of teleworking, Mann (2000) found that respondents of two service industries in the
UK perceive teleworking advantages as follows: less travel (57%); more freedom/flexibility (57%);
better working environment (50%); fewer distractions (43%); cheaper (29%); freedom to choose
comfortable clothes (14%); freedom from office politics (7%); and easier to complete domestic chores
(7%). On the other hand, Mann (2000) found the perceived disadvantages of teleworking include
isolation (57%); longer hours (50%); lack of support (28%); less sick leave (21%); career progression
(14%); and cost (7%). Similarly, Mannering and Mokhtarian (1995) explored the individual's choice of
teleworking frequency as a function of demographic, travel, work, and attitudinal factors. They show
that the most important variables in explaining the choice of frequency of teleworking from home were
the presence of small children in the household, the number of people in the household, gender of

Int. Journal of Business Science and Applied Management / Business-and-Management.org
20
respondent, number of vehicles in the household, whether respondent recently changed departure time
for personal reasons, degree of control over scheduling of different job tasks, supervisory status of
respondent, the ability to borrow a computer from work if necessary, and a family orientation. In
addition, Yap and Tng (1990) conducted a survey of the attitudes of female computer professionals in
Singapore towards teleworking. The study reveals that 73% of the 459 respondents were in favor of
teleworking. Most would prefer to work at home 1 to 3 days a week and at the office on the other days,
rather than working at home full time. They would telework only in times of need (e.g. when they have
young children) and were concerned with work and interaction-related problems which might arise
from teleworking. Furthermore, Yap and Tng (1990) suggest that teleworking will be of particular
interest to employees who are married, those with a high proportion of work that can be done at home,
those who find their journey to work frustrating, and those with supervisors and coworkers who are
supportive of teleworking.
3 RESEARCH OBJECTIVES
The objective of this research is twofold:
1. To examine the influence of specific demographic and individual variables on the choice
for teleworking mode.
2. To examine the differences in employees' perception of importance of the facilitators and
inhibitors based on their choice of the teleworking mode.
4 RESEARCH RATIONALE
The rationale behind the study was driven by the fact that most of the teleworking literature has
generally taken their roots in the developed countries, most notably North America and Western
Europe (Kowalski and Swanson (2005). This point indicates that there is a gap worth filling in the
literature resulting from the lack of studies in developing contexts. Considering the uniqueness of the
UAE economical, political and socio-cultural contexts, this study would contribute to filling that
identified gap.
Though the benefits of teleworking are widely accepted within the literature, there is very scarce
empirical research about how demographic and individual variables influence teleworking choice (full-
time, part-time, not to telework) in non-western contexts. Examining such relationships between
teleworking choice for both actual and prospective teleworker and various demographic and individual
variables as well as facilitators and inhibitors in an Arab context, namely UAE will add to the body of
knowledge in this regard.
Finally, the outcome of the present study will provide employees, managers and practitioners with
important insights that help them make better decisions concerning teleworking programs aiming at
improving organizational processes and fostering strategic goals.
5 DEVELOPMENT OF RESEARCH HYPOTHESES
5.1 The role of demographic and individual variables
The extant literature has shown that there are numerous demographic and individual variables
influence the choice of teleworking mode, including gender, age, martial status, profession, educational
level, internet use, nationality, residence, number of children, and years of experience. The subsequent
paragraphs review some of the relevant literature on this regards.
Peters et al. (2004) indicate that socio-demographic variables, such as gender and age, are found
to influence teleworking adoption and its preference. Similarly, Thériault et al., (2005) suggest that
gender and professional status influence teleworking choice, and older workers are more likely to
telework than younger ones. Moreover, Yeraguntla and Bhat (2005) show that women households with
children are likely to be part-time teleworkers, reinforcing the notion that women are the primary
caregivers of children. All in all, they consider age as one of the important individual socio-
demographic variable that turned out to be significant predictor of teleworking. The age effect indicates
that young adults (less than 25 years) are more likely to prefer part-time employment than older adults.
These results are also consistent with the findings of Bagley and Mokhtarian (1997). Moreover, they
reveal that race, job type, and length of service are also important influential factors for the choice of
teleworking mode. Caucasians and Hispanics, For instance, are more likely to telework than other races
(African-Americans, Asians and other). As for job type, their study indicates that employees working

Mohamed G. Aboelmaged and Abdallah M. Elamin
21
for an educational institution are more likely to be part-time teleworkers than employees in other kinds
of organizations. For the length of service, Yeraguntla and Bhat‘s (2005) study reveals that employees
who have worked less than a year in the firm are more likely to be part-time teleworkers than those
who have been working for longer periods of time.
A survey conducted by Mokhtarian and Salomon (1996) for the employees of the city of San
Diego about teleworking, revealed that only 3% of the sample report that they face no constraints to
telework but do not have a preference for it and do not currently do it. Based on such a survey they
conclude that people who have longer commutes are more likely to report that they want to telework,
especially if they are women and younger people. Having children, however, seems to have no effect
on the desire to telework.
In the same vein, Mannering and Mokhtarian (1995) use survey data collected from employees of
three government agencies in California to model the frequency of teleworking. The results show that
being a mother of small children had a positive influence on teleworking, as did the number of vehicles
per capita in the household.
Similarly, Wells et al. (2001) conduct surveys of employees at a public agency and a private firm
in Minnesota. They find that 43% of the surveyed employees engaged in teleworking. Furthermore,
they report that Public agency workers teleworked, on an average, three days a week, while private
firm workers teleworked, on an average, 1.92 days a week. The authors find that teleworkers are more
likely to be women, married, and have children.
It is worth noting that, Popuri and Bhat (2003) use data from a national survey of 14,441
households conducted by the New York Metropolitan Transportation Council to show factors that
increase the likelihood that an individual telework. Such factors include women with children, college
education, a driver‘s license, being married, working part-time, household income, working for a
private company (rather than government), and having to pay parking fees at work. Also, it has been
found that the longer an individual has worked at her current place of employment, the greater the
probability she teleworks.
In their analysis of the telework Survey conducted by the Southern California Association of
Governments (SCAG), Safirova and Walls (2004) confirm that having high educational level, more
professional experience in general, and a longer tenure with one‘s current company and one‘s current
supervisor will boost the probability of teleworking. Such a study has also revealed a very surprising
finding that teleworkers are more likely to be male and have smaller households than non-teleworkers,
which is inconsistent with other studies' findings that have shown women, and especially women with
children, to be likely teleworkers.
In the view of the aforementioned discussion, the following hypothesis seems to be relevant for
studying the teleworking in the UAE.
Hypothesis 1: There is no difference among employees in their choice for teleworking based on
their:
H1a: Gender
H1b: Marital status
H1c: Educational level
H1d: Internet use
H1e: Nationality
H1f: Residence
H1g: No of children
H1h: Age
H1i: Years of experience
H1j: Profession
5.2 Facilitators of Teleworking
Teleworking was originally seen as part of a solution to an energy crisis involving the reduction of
commuting (Gray et. al., 1993). In this regard, Kurland and Cooper (2002) show that employees choose
teleworking to reduce lengthy commutes, to decrease work-related stress, to balance work and family
responsibilities, to work longer hours but in more comfortable environments, and to provide
uninterrupted time to focus on their work. Organization-wise, teleworking improve employee morale
and productivity (Kurland and Bailey, 1999). Interestingly, Gray et al. (1993) find that teleworkers are
more productive than office-bound staffs that have to travel to work and tend to suffer a higher level of
stress. In addition, Productivity will increase through teleworking if employees are well motivated and
satisfied when they are able to manage their own time and assume greater responsibility for their own

Int. Journal of Business Science and Applied Management / Business-and-Management.org
22
work. And also because teleworking contributes to the reduction of costs of absenteeism, stress related
to traffic congestions, train delays and continuous office interruptions (Lim et al., 2003).
Lupton and Haynes (2000) identify four significant driving forces for teleworking: (1) a change in
management attitudes; (2) savings in office costs; (3) demand from staff; and (4) improvements in
technology. Other facilitators include improved productivity, improved staff retention, improved
morale/motivation, and improved staff recruitment opportunities. These forces are confirmed by Mann
(2000) who also points to less travel, more freedom/flexibility, better working environment, fewer
distractions, freedom to choose comfortable clothes, freedom from office politics, and easiness to
complete domestic chores.
Another classification of teleworking facilitators can be found in the literature is adopted by Mills
et al (2001) and Tung and Turban (1996) who distinguish among three categories of facilitators include
organizational, individual, and societal facilitators.
According to Mills et al (2001) and Tung and Turban (1996) organizational facilitators for
teleworking adoption may include securing skilled employees, saving office space, reducing turnover
and absenteeism, computer literacy and usage, productivity gains, overcoming limitations of distance
and time, providing service from home terminals, and reducing operating cost. Individual facilitators
for teleworking, on the other hand, include initiating personal freedom, autonomy, and flexibility
(Feldman and Gainey (1997), support no conflicting working environment (Pulido and Lopez, 2005),
increasing personal productivity, avoiding a commute, working with fewer interruptions, working in
more pleasant surroundings, wearing informal casual clothes, saving the costs of meals, clothes, and
commuting, greater time flexibility, greater job satisfaction, and bridging the career gap by avoiding a
long career break staying at home (Mills et al., 2001; Tung and Turban, 1996).Community or societal
related teleworking facilitators may include reduction of air pollution and dependence on fuel, enable
disabled people to work from home, conserve energy and reduce traffic during rush hours and demand
on transportation, and solving the problem of rural depopulation (Mills et al., 2001; Tung and Turban,
1996).
Although all these facilitators can support the trend of teleworking implementation, there is still a
literature gap about the role of teleworking choice (full-time, part-time, not to telework) in influencing
perceived importance of teleworking facilitators. In conjunction with this line of reasoning, the
following hypothesis is developed:
Hypothesis 2: There is no difference among employees in the perceived importance of teleworking
facilitators based on their choice for teleworking.
5.3 Inhibitors of teleworking
Despite the potential facilitators, teleworking raises two important inhibitors: supervisors‘
resistance to manage employees that they cannot physically observe (managerial control), and
employees‘ concerns about professional and social isolation (Kurland and Cooper, 2002). Studies,
which have addressed these issues, are largely surveys (e.g., Mokhtarian et al., 1995). One exceptional
is made to the study conducted by Baruch and Nicholson (1997). They gathered interview data from 62
teleworkers representing five different companies. However, they only noted that isolation and
managerial reluctance were factors that could hinder teleworking. In line with this, Reid (1993) cites
loss of status and professional isolation as potential dangers for workers moving into teleworking. The
likely outcome of isolation is the lack of interaction with colleagues, which stands as a serious
inhibitor.
As far as management control is concerned, Kurland and Cooper (2002) has demonstrated that
managers may lose control over employees‘ behavior as employees gain autonomy by teleworking.
Teleworking can diminish a manager‘s perceived control as it physically removes the employee from
the conventional work environment. At the same time the employees believe that the isolation may
result in lack of promotional opportunities.
Other inhibitors may include cost of implementation and resistance of management to change,
longer hours, lack of support, less sick leave, career progression (Lupton and Haynes, 2000; Mann,
2000).
Another classification of teleworking inhibitors is adopted by Mills et al (2001) and Tung and
Turban (1996) who distinguish among three categories of inhibitors include organizational, individual,
and societal inhibitors. According to Mills et al (2001) and Tung and Turban (1996) organizational
inhibitors of teleworking adoption may include technology cost inefficiencies, managing out-of-sight
employees, need for collaboration with other employees, security risks, problems of supervision,
performance control difficulty, work coordination difficulty, legal liability, maintenance of equipment.
From the individual point of view, inhibitors may include isolation, doubts and lack of knowledge of

Mohamed G. Aboelmaged and Abdallah M. Elamin
23
the state of a task, unavailability of necessary supplies or equipment, family interruptions and
household distractions, no separation of work and home life, lack of interactions with co-workers, and
potential lack of loyalty to company, not having a regular routine, workaholics, impedes career
opportunities, and missing ―what‘s going on‖, problem of 'guilt', and increase in cost of equipment and
utilities at home (Mills et al., 2001; Tung and Turban, 1996; Pulido and Lopez, 2005). From the
community perspective, teleworking may be inhibited as a result of promoting dispersion of housing,
increasing commuting distances, slowing down of real estate market, and declining clothing industry
(Mills et al., 2001; Tung and Turban, 1996).
Although all these inhibitors can hinder teleworking implementation, there is a notoriously
unfilled literature gap about the role of teleworking choice (full-time, part-time, not to telework) in
influencing perceived importance of teleworking inhibitors. Based on the above discussion, the
following hypothesis is suggested:
Hypothesis 3: There is no difference among employees in the perceived importance of teleworking
inhibitors based on their choice for teleworking.
6 RESEARCH METHODOLOGY
This research follows the underlying principles of quantitative research methodology. It entails the
collection of numerical data as exhibiting a few of the relationships between theory and research as
deductive, and as having an objectivist conception of social reality (Bryman, 2008). A survey research
method was applied to obtain insight about the issues explored in the study. Primary research data are
collected through structured questionnaire on a voluntary basis. To ensure the right level of teleworking
awareness, several studies recommend sampling employees from organizations involved in information
technology profession, when studying teleworking (Teo and Lim, 1998; Tung and Turban 1996). The
researchers, therefore, consider an employee in an organization within information technology sphere
as the unit of analysis in this research. Organizations in Dubai Media City (DMC) and Dubai Internet
City (DIC) are selected as target. Both cities include more than 500 organizations in the field of
networking, software development, programming, consultancy, broadcasting, publishing, advertising,
public relations, research and development, music and creative services. A total of 350 questionnaires
are distributed; of these, 148 were returned. 12 questionnaires are ignored due to ignoring complete
section(s) or missing data in certain sections, leaving a balance of 136 useful questionnaires for this
study, with a valid response rate of 39%. Respondents represent eleven ICT and media organizations
specialized in media organization and dissemination, software development, wireless technology,
communication tools and equipment, media production, and consultancy services. All organizations are
small to medium in size varying from 20 to 300 employees. Questionnaire data were aggregated, and
no analysis was conducted linking individual responses to a specific organization.
6.1 Measurement development, reliability, and validity
The survey instrument included several statements designed to measure the research constructs.
First, choice for teleworking is presented in a nominal scale with three options: (1) not to telework; (2)
part-time teleworking; and (3) full-time teleworking. Second, the perceived importance of each of
teleworking facilitators and inhibitors is measured based on a four-point Likert scale from ‗‗strongly
disagree‘‘ to ‗‗strongly agree‘‘. The survey also gathers demographic information on the respondents‘
gender, marital status, educational level, internet use, nationality, residence location, number of
children, age, years of experience, and work profession. A nominal scale is developed for each of these
constructs.
Content validity is assessed by examining the process that is used in generating scale items, and its
translation into other languages (i.e., Arabic in this study). The determination of content validity is
judgmental and can be approached through careful definition of the topic of the concern, the scaled
items, and used scales (Cooper and Schindler, 2003). Teleworking facilitators and inhibitors are
developed based on extensive review of teleworking literature, and then reduced using a varimax
rotated principal component factor analysis. Furthermore, Cooper and Schindler (2003) suggest another
way to determine content validity through panel of persons to judge how well the instrument meets the
standards. Thus, the researchers conducted independent interviews with two professors of human
resources and one professor of information technology applications to evaluate whether research covers
relevant constructs. They suggested that the procedure and Arabic translation of the questionnaire were
generally appropriate, with some modifications in the translated version of the questionnaire.

Int. Journal of Business Science and Applied Management / Business-and-Management.org
24
6.2 Data Presentation and Analysis
Responses from the surveys were coded and entered into SPSS spreadsheets for data analysis. For
a descriptive analysis, means, SD, cross tabulation, factor analysis, and Kruskal-Walllis test were
applied to the sample.
6.3 Profile of research demographics
The survey‘s demographic descriptive statistics are presented in Table 1. Of the 136 respondents,
54.4% select part-time teleworking option, 33.1% decide not to telework, and 12.5% choose full-time
teleworking option. 50.7 % of the respondents are male and 49.3 % are female. 67.6% are single and
32.4% are married. 31.7% of married respondents have one child, 26.8% have two children, 22.0%
have three children, and 19.5% have four or more children. The research respondents are relatively
young; the majority of survey respondents age is between 20 and 29 years (44.9 %), while 25.7% are
between 30 – 39 years, 18.4% are less than 20, and only11% are above 40 years old. The education
level reported by respondents showed that 75.7% had university degree or equivalent. Respondents
were mainly non-UAE national (66.2%), national Respondents are only represent 33.8%. 40.4% of
research respondents live in the emirate of Sharajah 40.4%, Ajman 25.7%, Dubai 22.1%, Abu Dhabi
6.6%, and UmQuin 5.1%. The description shows that 39% of the respondents are internet users for 1-3
times a week, 34.6% use the internet 7 or more times a week, 19.8% use the internet 4-6 times a week,
and 6.6% are not using the Internet. According to years of experience, most of the respondents (72.8%)
had less than 7 years, and approximately 27.2% had more than 7 years of experience. Respondents in
ICT professions are 18.4%, while 27.2% of respondents are in media professions, 27.2% are in
management and marketing professions, and 27.2% are in accounting professions.
In conclusion, majority of respondents in this study prefer part-time teleworking, graduate male,
single, between 20 – 29 years of age, care for one child if married, with non UAE nationality, live in
Sharjah, use the internet 1-3 times a week, working in different ICT and media professions, with less
than 7 years of experience.
Table 1: Profile of research respondents (N=136)
% N % N
Marital status Teleworking choice
67.6 92 Single 12.5 17 Full-time
32.4 44 Married 54.4 74 Part-time
33.1 45 No choice
Nationality Gender
33.8 46 UAE 49.3 67 Female
66.2 90 Non UAE 50.7 69 Male
Freq. of internet use Educational level
34.6 47 7 or more times /week 7.4 10 Postgraduate
19.8 27 4-6 times /week 75.7 103 Graduate
39.0 53 1-3 times /week 16.9 23 Undergraduate
6.6 9 No use /week
Children
Residence 31.7 13 1
6.6 9 Abu Dhabi 26.8 11 2
22.1 30 Dubai 22.0 9 3
40.4 55 Sharjah 19.5 8 4 or more
25.7 35 Ajman
5.1 7 UMQ Years of experience
36.8 50 0-3
Age 36 49 4-6
18.4 25 Less than 20 17.6 24 7-9
44.9 61 20 – 29 9.6 13 9 or more
25.7 35 30 – 39
11 15 40 or more Profession
18.4 25 IT
27.2 37 Media
27.2 37 Mgt. & Marketing
27.2 37 Account. & Finance
Mohamed G. Aboelmaged and Abdallah M. Elamin
25
6.4 Testing the first hypothesis
A cross tabulation analysis is conducted to assess whether there is no difference among employees
in their choice for teleworking based on specific demographic variables. Tables 2 presents frequencies,
percentages, and associations of teleworking choice (i.e., full-time, part-time, and not to telework) with
a number of selected demographic and individual variables including gender, marital status,
educational level, internet use, nationality, residence, number of children, years of experience, and
occupation.
Table 2 indicates that there is a significant difference among employees in their teleworking
choice based on their gender (χ2 = 12.06, p < 0.01). It is clear from the cross tabulation presented in
Table 2 that females constitute the majority of employees who select full-time teleworking option
(88.2%), while males are the majority who select part-time teleworking (58.1%) as well as not to
telework (53.3%). It also shows the association between marital status and teleworking. In that sense,
employees‘ marital status does significantly influence teleworking choice (χ2 = 6.69, p < 0.05). The
table demonstrates that single employees are over represented among non teleworkers (80%). On the
other side, married employees are over represented among full-time teleworkers (52.9%). Educational
levels and their distribution cross teleworking choices are illustrated in also reflected in the Table. The
analysis suggests no significant difference among employees in their teleworking choice based on their
educational level (χ2 = 1.451, n.s). The analysis shows that graduate employees with a university degree
or equivalent are over represented in each of teleworking groups; full-time (76.5%), part-time (75.7%),
and no teleworking group (75.6%). Similarly, the table suggests no significant difference among
employees in their teleworking choice based on their level of Internet use (χ2 = 11.19, n.s.). Employees
who use the internet 1-3 times weekly form the majority of two contradictory teleworking groups; full-
time teleworking (70.6%) and no teleworking (42.2%). While the majority of employees who prefer
part-time teleworking are using the Internet for 7 or more times per week (39.2%). Further, the table
indicates that there is a significant difference among employees in their teleworking choice based on
their nationality (χ2
= 6.33, p < 0.05). It is clear from the cross tabulation presented in Table 2 that
employees with UAE nationality are over represented among full-time teleworkers (58.8%), while
employees with non UAE nationality (e.g., Egyptians, Indians, etc.) are over represented among part-
time teleworkers (73.0%) as well as non teleworkers (64.4%). Surprisingly, difference among
employees in their teleworking choice based on their city of residence is significant (χ2 = 33.99, p >
0.001). Moreover, the table illustrates that part-time teleworking is the main choice of employees living
in emirates of Dubai, Sharjah, and Ajman, while the main teleworking choice of employees living in
UmQuin emirate is full time. However, employees who are living in Abu Dhabi tend to prefer not to
telework. Distribution of number of children cross teleworking choices is also illustrated in the table
suggesting that there is no significant difference among employees in their teleworking choice based on
their number of children (χ2 = 5.65, n.s.). Employees who select full-time teleworking are equally
distributed among those who have two (28.6%), three (28.6%), and four or more (28.6%) children,
while part-time teleworking choice is dominated by employees who have one child only (38.5%).
Similarly, the table suggests no significant difference among employees in their teleworking choice
based on their age (χ2 = 3.78, n.s.). Employees between 20-29 years dominate the majority in every
teleworking group; full-time teleworking (47.1%), part-time teleworking (43.2%), and not to telework
(46.7%). Moreover, the relationship between employees‘ teleworking choice and their years of
experience is not significant (χ2 = 11.11, n.s.) as demonstrated by the table which indicates that
employees who have 4-6 years of experience represent the majority of employees who choose two
contradictory options; to telework full-time (56.8%) and not to telework (44.4%), while part-time
teleworking choice is dominated by employees who have less than four years of working experience
(45.9%). Finally the table illustrates the relationship between teleworking choice and profession. It
shows that employees‘ profession does significantly influence teleworking choice (χ2 = 21.95, p <
0.01). The table demonstrates that 46.7% of employees who prefer not to telework are in accounting
and finance profession, 28.4% of employees who prefer part-time teleworking are in management and
marketing profession, while employees in media profession are over represented among full-time
teleworkers (52.9%).

Int. Journal of Business Science and Applied Management / Business-and-Management.org
26
Table 2: Cross tabulation results
p
value χ2 Total
Teleworking Choice
No Part-time Full-time
0.002 12.06** Gender
69 (50.7) 24 (53.3) 43 (58.1) 2 (11.8) Male
67 (49.3) 21 (46.7) 31 (41.9) 15 (88.2) Female
0.03 6.69* Marital status
92 (67.6) 36 (80) 48 (64.9) 8 (47.1) Single
44 (32.4) 9 (20) 26 (35.1) 9 (52.9) Married
0.83 1.45 Educational level
23 (16.9) 9 (20) 11 (14.9) 3 (17.6) Undergrad.
103 (75.7) 34 (75.6) 56 (75.7) 13 (76.5) Graduate
10 (7.4) 2 (4.4) 7 (9.5) 1 (5.9) Postgrad.
0.08 11.19
Internet Use
9 (6.6) 4 (8.9) 5 (6.8) 0 (0) No use
53 (39) 19 (42.2) 22 (29.7) 12 (70.6) 1-3 times
27 (19.9) 7 (15.6) 18 (24.3) 2 (11.8) 4-6 times
47 (34.6) 15 (33.3) 29 (39.2) 3 (17.6) 7 or more
0.04 6.33* Nationality
46 (33.8) 16 (35.6) 20 (27) 10 (58.8) UAE
90 (66.2) 29 (64.4) 54 (73) 7 (41.2) Non UAE
0.00 33.99** Residence location
9 (6.6) 7 (15.6) 2 (2.7) 0 (0) Abu Dhabi
30 (22.1) 12 (26.7) 16 (21.6) 2 (11.8) Dubai
55 (40.4) 16 (35.6) 34 (45.9) 5 (29.4) Sharjah
35 (25.7) 9 (20) 21 (28.4) 5 (29.4) Ajman
7 (5.1) 1 (2.2) 1 (1.4) 5 (29.4) UMQ
0.58 4.65 No. of Children
13 (31.7) 2 (25) 10 (38.5) 1 (14.2) One
11 (26.8) 1 (12.5) 8 (30.8) 2 (28.6) Two
9 (22) 2 (25) 5 (19.2) 2 (28.6) Three
8 (19.5) 3 (37.5) 3 (11.15) 2 (28.6) Four or more
0.706 3.78 Age
25 (18.4) 9 (20) 15 (20.3) 1 (5.9) > 20
61 (44.9) 21 (46.7) 32 (43.2) 8 (47.1) 20 - 29
35 (25.7) 12 (26.7) 17 (23) 6 (35.3) 30 - 39
15 (11) 3 (6.7) 10 (13.5) 2 (11.8) 40 ≤
0.085 11.11 Years of experience
50 (36.8) 14 (31.1) 34 (45.9) 2 (11.8) 0-3
49 (36) 20 (44.4) 19 (25.7) 10 (56.8) 4-6
24 (17.6) 8 (17.8) 13 (17.6) 3 (17.6) 7-9
13 (9.6) 3 (6.7) 8 (10.8) 2 (11.8) 9 or more
0.001 21.95** Profession
25 (18.4) 3 (6.7) 18 (24.3) 4 (23.5) IT
37 (27.2) 9 (20) 19 (25.7) 9 (52.9) Media
37 (27.2) 12 (26.7) 21 (28.4) 4 (23.5) Mgt. & Market.
37 (27.2) 21 (46.7) 16 (21.6) 0 ( 0) Account. & Finance
136
(100.0%)
45
(100.0%)
74
(100.0%)
17
(100.0%)
Total
In conclusion, results from ensuing presentation show significant association between teleworking
choice and gender, marital status, nationality, residence, and profession. On the other hand, there is no
significant association between teleworking choice and educational level, Internet use, number of
children, age, and years of experience. Accordingly, hypothesis H1 is partially supported.
6.5 Testing the Second and Third hypotheses
The data collected concerning employees‘ perception of teleworking facilitators and inhibitors are
reduced using a varimax rotated principal component factor analysis. Tables 3 and 4 display the various
facilitators and inhibitors used in this study and show the factor loadings for each of the items. The
loadings indicate a significant relationship between items in each of the factors since all but three are
greater than .50, the critical value for significant loadings (Hair et al., 1992).

Mohamed G. Aboelmaged and Abdallah M. Elamin
27
Table 3: Factors analysis of teleworking facilitators *
7 6 5 4 3 2 1
Community concerns (α = 0.85)
0.093 -0.046 0.202 0.046 0.122 0.097 0.753 Environmental pollution F20
-0.125 0.235 0.087 -0.055 0.193 0.257 0.749 Working opport. for disabled F21
0.005 0.169 0.094 0.220 0.008 0.174 0.724 Traffic Jams F22
0.038 0.088 0.232 0.305 0.141 0.238 0.676 Increasing oil prices F19
0.169 0.067 -0.059 0.379 -0.020 -0.072 0.647 Severe weather conditions F24
0.281 -0.082 0.069 0.103 0.320 0.072 0.629 Family care F23
Individual freedom (α = 0.78)
-0.076 -0.066 0.125 0.089 0.143 0.782 0.122 Flexible working time and location F11
0.246 0.214 0.109 0.075 0.190 0.749 0.120 Personal freedom F9
0.255 -0.041 0.064 0.036 0.146 0.745 0.178 Avoid work stress F10
0.178 0.108 -0.039 0.368 0.267 0.427 0.152 No absenteeism F14
Productivity improvement (α = 0.78)
-0.107 0.167 0.073 0.046 0.785 0.158 0.130 Developing ICT usage F17
0.109 -0.165 0.221 0.077 0.727 0.007 0.056 Better utilization of working time F8
-0.018 0.093 0.174 -0.024 0.603 0.439 0.203 Improving output quality and quantity F13
-0.170 0.284 -0.034 -0.081 0.593 0.419 0.152 Increasing employees loyalty F16
0.417 0.180 0.176 0.015 0.481 0.237 0.101 Paperless work F18
Travel load (α = 0.71)
0.076 0.180 -0.047 0.797 -0.035 -0.126 0.146 Travel preparation F6
0.036 -0.178 0.132 0.724 0.153 0.247 0.219 Travel time F5
-0.087 0.049 0.368 0.624 0.007 0.298 0.298 Travel effort and cost F3
Cost reduction (α = 0.66)
-0.025 0.017 0.821 0.022 0.180 0.193 0.137 Saving org. space and equipments F2
0.279 -0.100 0.671 0.136 0.134 -0.003 0.365 Increasing cost of real states F1
-0.158 0.469 0.518 0.460 0.017 0.102 0.121 Increasing cost of clothes and accessories F4
Empowering people (α = 0.51)
0.226 0.801 0.033 0.0091 0.103 0.096 0.102 Minimizing supervisory functions F15
0.012 0.471 -0.282 0.313 0.355 -0.158 0.217 Task focus F7
0.831 0.158 0.023 0.042 -0.076 0.209 0.161 Doing other more things F12
1.382 1.529 1.893 2.346 2.743 2.826 3.512 Eigenvalue
5.76 6.37 7.89 9.77 11.43 11.78 14.63 Percentage of variance explained
67.63 61.87 55.50 47.61 37.84 26.41 14.63 Cumulative percentage of total var. explained
0.993 0.710 0.716 0.743 0.589 0.665 0.645 Standard deviation
Correlation Matrix Determinant = 0.0000179
Kaiser-Meyer-Olkin Measure of Sampling Adequacy = 0.814
Bartlett's Test of Sphericity (χ2 = 1378.98 , df = 276 , p < 0.001)
* Principal components analysis; varimax rotation with Kaiser Normalization

Int. Journal of Business Science and Applied Management / Business-and-Management.org
28
Table 4: Factors analysis of teleworking inhibitors *
* Principal components analysis; varimax rotation with Kaiser Normalization
Cumulative percentage of total variance explained for factor analysis of perceived teleworking
facilitators is 67.63% with Kaiser-Meyer-Olkin measure of sampling adequacy = 0.814, while
cumulative percentage of total variance explained for factor analysis of perceived teleworking
inhibitors is 65.97% with Kaiser-Meyer-Olkin measure of sampling adequacy = 0.794. The Cronbach
alpha coefficient is used to assess reliability of the generated facilitators and inhibitors. As shown in
Tables 3 and 4, the alpha reliabilities range from a low of 0.51 to a high of 0.86. All the reliability
figures, except two variables, were higher than 0.6, the lowest acceptable limit for Cronbach‘s alpha
suggested by Hair et al. (1992), variables with reliabilities lower than 0.6 deserve a further refinement
in future research.
7 6 5 4 3 2 1
Management concerns (α = 0.77)
-0.132 0.164 0.055 0.013 -0.201 0.161 0.727 Org. vision and mission are misplaced B15
0.102 0.060 0.199 0.029 0.224 0.028 0.714 Safety criteria are not guaranteed B16
0.156 0.147 0.012 0.228 0.045 0.192 0.683 Inapplicable work rules and regulations B13
0.039 0.261 0.032 0.447 0.088 0.098 0.569 Access difficulty to decision info. B17
0.265 - 0.029 - 0.056 0.154 -0.054 0.392 0.559 Hard to control and evaluate performance B14
Isolation (α = 0.79)
0.169 -0.015 - 0.020 0.124 0.111 0.766 0.089 Misguidance regarding use of org. resources B11
0.077 0.009 0.257 0.295 0.330 0.672 0.149 Need to interact with work colleagues B8
-0.167 0.433 0.063 0.199 0.014 0.596 0.265 Lack of teleworking experience B10
0.205 0.135 0.120 0.062 0.187 0.528 0.385 Feeling guilty toward the organization B7
0.048 0.293 - 0.037 0.480 0.124 0.509 0.194 Missing promotional opportunities at work B9
Union resistance (α = 0.77)
-0.207 -0.097 0.139 -0.016 0.800 0.115 -0.045 Union resistance B23
0.148 0.017 0.027 0.073 0.793 0.104 0.026 Clothing and makeup industry loss B22
-0.008 0.194 0.036 0.170 0.705 0.196 -0.066 Negative impact on real state sector B21
-0.010 0.144 -0.020 0.218 0.672 - 0.157 0.227 Unclear insurance B24
Home inadequacy (α = 0.71)
0.017 0.112 0.192 0.664 0.266 0.053 -0.068 Increased home noise B20
0.017 -0.091 0.142 0.631 0.150 0.261 0.213 Data insecurity B19
0.236 -0.148 0.106 0.568 -0.021 0.336 0.438 Coordination difficulty B12
0.276 0.318 -0.150 0.531 0.020 0.239 0.317 Inapplicable team working B18
ICT cost (α = 0.86)
0.134 0.073 0.900 0.017 0.017 0.117 0.130 ICT acquisition cost B1
0.036 0.145 0.871 0.219 0.125 0.074 0.062 ICT maintenance and upgrading cost B2
Time mismanagement (α = 0.51)
0.208 .802 0.068 -0.046 0.021 0.199 0.169 Home time mismanaged B6
0.094 .594 0.323 0.152 0.289 -0.109 0.091 Org. time expansion B3
Family intervention (α = 0.62)
0.835 0.106 0.105 0.217 -0.087 0.111 0.046 Family rights B4
0.612 0.303 0.187 -0.117 0.095 0.266 0.350 Family – work intervention B5
1.570 1.747 1.969 2.307 2.595 2.639 3.010 Eigenvalue
6.54 7.28 8.20 9.61 10.81 10.99 12.54 Percentage of variance explained
65.97 59.43 52.15 43.95 34.34 23.53 12.54 Cumulative percentage of total var. explained
0.710 0.694 0.745 0.661 0.688 0.611 0.579 Standard deviation
Correlation Matrix Determinant = 0.00002334
Kaiser-Meyer-Olkin Measure of Sampling Adequacy = 0.794
Bartlett's Test of Sphericity (χ2 = 1345.59, df = 276, p < 0.001)

Mohamed G. Aboelmaged and Abdallah M. Elamin
29
6.6 Study-based generated facilitators
The ensuing factor analysis generates six distinct perceived facilitators for teleworking, including
community concerns, individual freedom, productivity improvement, travel load, cost reduction, and
empowering people (see Table 3).
(1) Community concerns: this factor includes a number of community concerns such as reducing
environmental pollution; provision of working opportunities for disabled; reducing traffic jams;
continuous increasing of oil prices; severe weather conditions all over the year; and family care issues.
No doubt, these concerns make adoption and implementation of teleworking programs in UAE is an
appealing option, particularly in case when distance from home to the workplace is far or when traffic
congestion is a problem.
(2) Individual freedom: Items in this factor reflect the notion that teleworking is forced by the
need to reduce stress level and increase job commitment and quality of work life. One likely reason is
that the flexibility in working schedule of teleworkers offers opportunities for them to engage in non-
work activities to a much larger extent than otherwise possible. Such scheduling freedom may allow
time for personal interests.
(3) Productivity improvement: Items in this factor suggest that improving productivity is
perceived as a driving force for teleworking adoption since individuals can avoid interruptions at the
office and get work done in an effective and efficient manner. In addition, teleworking also allows the
individual‘s autonomy by enabling individuals to work during hours where they are most productive
(Teo and Lim, 1998).
(4) Travel load: Items in this factor suggest that the adoption of teleworking will reduce travel
burden, including travel preparation time and effort, time of travel, effort consumed in the travel, and
cost of travel preparation and expenses.
(5) Cost reduction: Items in this factor reflect the notion that teleworking is a cheap work mode,
since it contributes to saving office space and equipments, cost of real states, and cost of clothing and
accessories (Mills et al., 2001; Tung and Turban, 1996).
(6) Empowering people: Items in this factor show that teleworking is perceived as a method to
empower employees through minimizing supervisory functions and giving the employee opportunity to
focus on task at hand.
6.7 Study-based generated inhibitors
The ensuing factor analysis generates seven distinct perceived inhibitors for teleworking,
including management concerns, isolation, union resistance, home inadequacy, ICT cost, time
mismanagement, and family intervention (see Table 4).
(1) Management concerns: Items in this factor propose that managers may find placing
organizational vision and mission, control, supervision, and designing an equitable compensation
scheme for teleworker and appraising their performance are difficult (Teo and Lim, 1998).
(2) Isolation: Items in this factor illustrate the concept of professional and physical isolation which
is reflected in misguidance regarding use of organizational resources, need to interact with work
colleagues, lack of teleworking experience, feeling guilty toward the organization, and missing
promotional opportunities at work. This isolation is found to be one of the key inhibitors of teleworking
implementation (Kurland and Cooper, 2002; Rognes, 2002).
(3) Union resistance: This factor reflects the power of union resistance supported by clothing and
makeup industry loss, negative impact on real state sector, and unclear insurance. This inhibitor may
hinder the implementation of teleworking.
(4) Home inadequacy: Items of this factor shows that home is inadequate place to telework, when
teleworkers face increasing home noise, data insecurity at home, work coordination difficulty, and
missing the chance of team working.
(5) ICT cost: Items in this factor suggest that accountability for repairs / maintenance of
equipment placed at employees‘ homes may be a problem. Furthermore, the initial investment in
equipment to enable employees to telework may be substantial.
(6) Time mismanagement: Items in this factor suggest teleworking time is mismanaged and
expanded since it intervenes with organization‘s working time and follows flexible working mode.
(7) Family intervention: This factor proposes that teleworking may be hindered by the introduction
of family rights and family – work intervention process.
Kruskal-Wallis nonparametric test is applied to assess the relationship between employees‘
perceived teleworking facilitators and inhibitors as ordinal variables and teleworking mode choices as a
nominal variable. Results are illustrated in Tables 5 and 6. Table 5 shows Kruskal-Wallis test result of
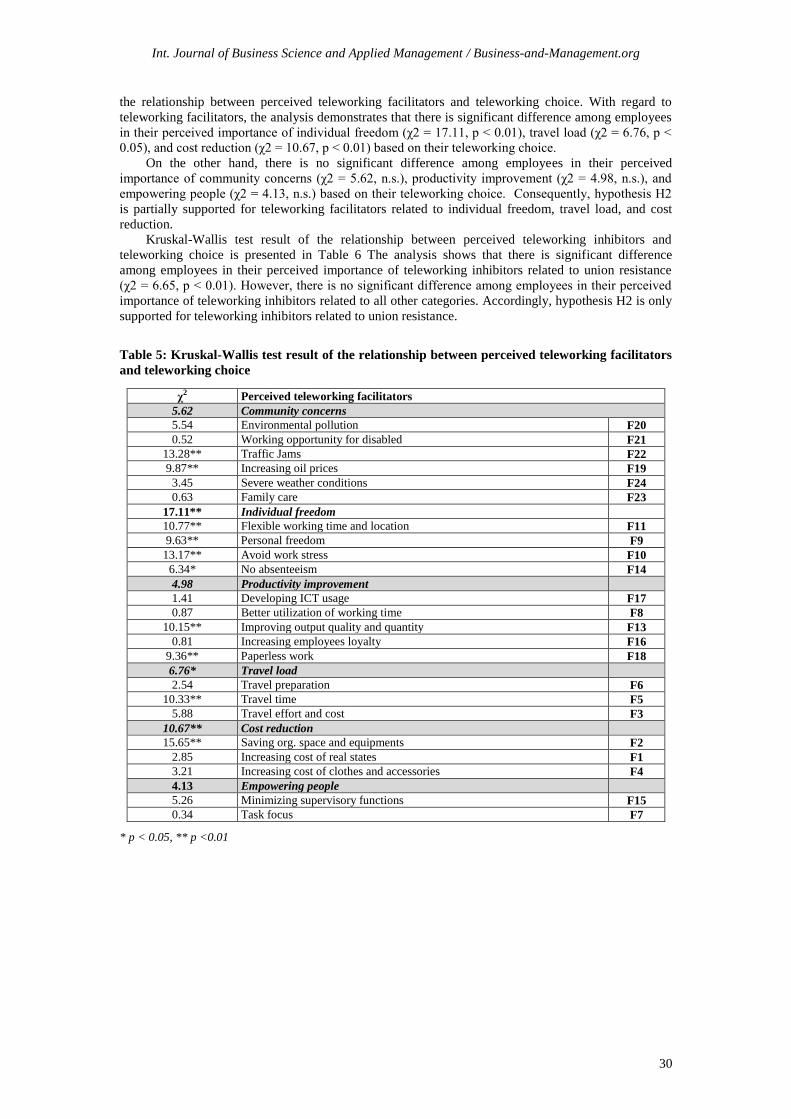
Int. Journal of Business Science and Applied Management / Business-and-Management.org
30
the relationship between perceived teleworking facilitators and teleworking choice. With regard to
teleworking facilitators, the analysis demonstrates that there is significant difference among employees
in their perceived importance of individual freedom (χ2 = 17.11, p < 0.01), travel load (χ2 = 6.76, p <
0.05), and cost reduction (χ2 = 10.67, p < 0.01) based on their teleworking choice.
On the other hand, there is no significant difference among employees in their perceived
importance of community concerns (χ2 = 5.62, n.s.), productivity improvement (χ2 = 4.98, n.s.), and
empowering people (χ2 = 4.13, n.s.) based on their teleworking choice. Consequently, hypothesis H2
is partially supported for teleworking facilitators related to individual freedom, travel load, and cost
reduction.
Kruskal-Wallis test result of the relationship between perceived teleworking inhibitors and
teleworking choice is presented in Table 6 The analysis shows that there is significant difference
among employees in their perceived importance of teleworking inhibitors related to union resistance
(χ2 = 6.65, p < 0.01). However, there is no significant difference among employees in their perceived
importance of teleworking inhibitors related to all other categories. Accordingly, hypothesis H2 is only
supported for teleworking inhibitors related to union resistance.
Table 5: Kruskal-Wallis test result of the relationship between perceived teleworking facilitators
and teleworking choice
* p < 0.05, ** p <0.01
χ2 Perceived teleworking facilitators
5.62 Community concerns
5.54 Environmental pollution F20
0.52 Working opportunity for disabled F21
13.28** Traffic Jams F22
9.87** Increasing oil prices F19
3.45 Severe weather conditions F24
0.63 Family care F23
17.11** Individual freedom
10.77** Flexible working time and location F11
9.63** Personal freedom F9
13.17** Avoid work stress F10
6.34* No absenteeism F14
4.98 Productivity improvement
1.41 Developing ICT usage F17
0.87 Better utilization of working time F8
10.15** Improving output quality and quantity F13
0.81 Increasing employees loyalty F16
9.36** Paperless work F18
6.76* Travel load
2.54 Travel preparation F6
10.33** Travel time F5
5.88 Travel effort and cost F3
10.67** Cost reduction
15.65** Saving org. space and equipments F2
2.85 Increasing cost of real states F1
3.21 Increasing cost of clothes and accessories F4
4.13 Empowering people
5.26 Minimizing supervisory functions F15
0.34 Task focus F7

Mohamed G. Aboelmaged and Abdallah M. Elamin
31
Table 6: Kruskal-Wallis test result of the relationship between perceived teleworking facilitators
and teleworking choice
* p < 0.05, ** p <0.01
7 DISCUSSION AND REFLECTION
7.1 Demographic variables
The results have manifested the important role of selected demographic variables in influencing
teleworking choice, namely, the role of gender. Accordingly, results of the test have shown that
females in the UAE tend to prefer full-time teleworking. Women are found to be motivated by some
considerations such as work flexibility, convenience and increased personal freedom (O‘Connor,
2001). UAE females have perceived telework as promising avenue to change their traditional work
orientation and prove their personal freedom in handling work responsibilities. This is in harmony with
Popuri and Bhat (2003), Yap and Tng (1990), and Wells et al. (2001) who suggest that teleworking will
be of particular interest to women employees. However, in contradiction to the result generated by this
research, some studies show that women employees are not interested in teleworking because they
perceived work, not home, as the less stressful and more emotionally rich environment (Hochschild,
1983). In the same thought, Teo and Lim‘s (1998) study shows that males tend to perceive teleworking
as enabling improvement in the quality of life and improvement in productivity/reduction of overheads
to a greater extent than females. In line with this argument, Peters et al. (2004) suggest that three out
of four teleworkers were male in EU member states, and that this stands in sharp contrast to the
widespread opinion that telework was predominantly female. Moreover, research confirms the
association between marital status and teleworking choice found in previous research. This is in
χ2 Perceived teleworking inhibitors
0.84 Management concerns
1.40 Org. vision and mission are misplaced B15
0.67 Safety criteria are not guaranteed B16
2.13 Inapplicable work rules and regulations B13
1.25 Access difficulty to decision info. B17
2.55 Hard to control and evaluate performance B14
2.93 Isolation
3.91 Misguidance regarding use of org. resources B11
1.76 Need to interact with work colleagues B8
4.28 Lack of teleworking experience B10
1.27 Feeling guilty toward the organization B7
0.31 Missing promotional opportunities at work B9
6.65* Union resistance
6.78* Union resistance B23
1.78 Clothing and makeup industry loss B22
0.99 Negative impact on real state sector B21
9.38** Unclear insurance B24
0.40 Home inadequacy
2.82 Increased home noise B20
1.80 Data insecurity B19
1.73 Coordination difficulty B12
3.79 Inapplicable team working B18
0.74 ICT cost
2.57 ICT acquisition cost B1
1.16 ICT maintenance and upgrading cost B2
0.67 Time mismanagement
1.83 Home time mismanaged B6
0.71 Org. time expansion B3
1.17 Family intervention
0.11 Family rights B4
4.16 Family – work intervention B5

Int. Journal of Business Science and Applied Management / Business-and-Management.org
32
harmony with Popuri and Bhat (2003), Yap and Tng (1990), and Wells et al. (2001) who suggest that
teleworking will be of particular interest to employees who are married. Furthermore, with regard to
the educational level, the study indicates no association between educational level and teleworking
choice. This result challenges Peters et al., (2004) when mention that well-educated employees were
found to be more likely to practice teleworking. Consequently, this research finding is inconsistent with
the notion that well-educated individuals are able to telework as they exercise more control over their
work schedule than are their co-workers (Yeraguntla and Bhat, 2005).
The present research proves that there is an insignificant association between frequency of Internet
use and teleworking choice. Such a finding falsifies the widely held claim that employees master
certain level of IT skills including Internet skills are typically suited for teleworking. This research
results are inconsistent with the result obtained from the Euro survey 2000, which alleged that telework
was most widespread among employees, who used IT frequently in their job (Peters et al., 2004).
Nationality is also found to be significantly associated with teleworking choice. Non-UAE
national employees prefer part time and no teleworking compared to UAE national employees who
prefer fulltime teleworking. Such findings could be attributed to the fact that Non-UAE national
employees attempt to be present at the traditional workplace and establish good work records in order
to renew their working contracts, rather than asking for teleworking scheme, though they may prefer.
UAE national, on the other hand, are not subject to the stress of being present at the traditional
workplace as non UAE employees. This result is in agreement with Yeraguntla and Bhat (2005) who
indicate that resident Hispanics are more likely to telework than other races such as immigrants African
and Asian who need to demonstrate their working skills, and support their legibility to work and follow
work regulations. Similarly, the study shows that residence is associated with teleworking choice.
Employees living in Sharjah, Ajman and Umquin are over presented among part-time and full-time
teleworkers. This may be interpreted as employees living in these northern emirates always face severe
traffic jams in their way to work in Dubai, so that teleworking is perceived as the magic solution for
them. This result is consistent with Yen and Mahmassani (1997) when they suggest that the greater the
distance from home to workplace, the more likely the employee is to prefer teleworking. Also,
Mokhtarian and Salomon (1996) show that people who have longer commutes are more likely to report
that they want to telework. This contrasts with Drucker and Khattak (2000) who find that distance to
work is negatively correlated with working at home—that is, the farther the individual lives from his
job, the less likely he/she to work from home.
Number of children is found to be not associated with teleworking choice. This result confirms
Mokhtarian and Salomon (1996) when propose no effect of having children on the desire to telework.
Nevertheless, this is in disagreement with Popuri and Bhat (2003), Yap and Tng (1990), Wells et al.
(2001) who suggest that teleworking will be of particular interest to employees who have children.
Although, working parents may highly value the time-savings of teleworking due to the elimination of
commuting time and allow a parent to stay at home with a sick child (Peters et al., 2004), albeit, this is
not the case of UAE. In UAE culture, parents (working and not working) depend entirely on foreign
maids to take care of their children regardless how many children they may have. Similarly, age is
found to be not associated with teleworking choice. In consistent with that, Belanger (1999) does not
reveal significant age differences between those practicing telework and those not doing so in her study
of a high technology organization in USA. Nevertheless, many studies have revealed contradictory
results with regard to the relationship between age and teleworking. Mokhtarian and Salomon (1996),
and Bagley and Mokhtarian (1997) show that younger people are more likely to report that they want to
telework. Yeraguntla and Bhat (2005) indicate that young adults (less than 25 years) are more likely to
be in part-time employment than older adults. This is perhaps a reflection of the fact that many young
adults are studying and working part-time at the same time. Inconsistently, the EU member states
survey data indicated that the age group 30–49 was over represented among teleworkers (Peters et al.,
2004).
Research result related to years of experience tends to be not in agreement with Yeraguntla and
Bhat (2005) who suggest that employees who have worked less than a year in the firm are more likely
to be part-time teleworkers than those who have been working for longer periods of time. In UAE
context, the situation may be different since employees with less working experience try to prove their
skills, establish good impression, and get supervisor‘s support through being presenting at the
traditional workplace. After long years of experience, employees may consider teleworking as an
alternative work scheme that facilitate managing other concerns such as managing own small business.
The results of the present research prove the existence of an association between employees‘
profession and teleworking choice. While employees with accounting and finance professions tend to
avoid telework, employees with IT, media and management profession tend to telework either on part-
time or full-time basis. This result is consistent with Gray et al. (1993) who suggest that computer
Mohamed G. Aboelmaged and Abdallah M. Elamin
33
programmers, systems analysts, catalogue shopping telephone order agents, and data entry clerks fit
full-time telework category.
7.2 Facilitator and inhibitors
This research confirms the importance of individual freedom, community concerns, and
productivity as key teleworking facilitators perceived by employees. This is in agreement with the
mainstream literature that support the perceived importance of personal freedom and autonomy as an
immediate symbolic result of employees‘ interaction with teleworking adoption (Feldman and Gainey
(1997; Pulido and Lopez, 2005). In addition, teleworking impact on the society as expressed by
employees is clear and tangible on the short run. Mills et al. (2001) and Tung and Turban (1996)
consider community and societal related teleworking facilitators such as reduction of air pollution and
dependence on fuel, conserve energy housebound and disabled people can work from home, and
reduced traffic during rush hours and transportation demand as important determinants of teleworking
success in the short run. Moreover, increasing productivity gains is also considered as key derivers for
organizations to adopt teleworking (Kurland and Bailey, 1999; Lim et al., 2003; Mills et al., 2001;
Tung and Turban, 1996). However, a recent study analyzed the findings of over 80 previous studies,
indicating that ―little clear evidence exists that telework increases job satisfaction and productivity, as it
is often asserted to do‖ (Bailey and Kurland, 2002: p. 383).
As far as teleworking inhibitors are concerned, the present research confirms the importance of
isolation as a key inhibitor of teleworking. Recent research indicates that isolation is perceived as one
of the key factors that may hinder the implementation of teleworking (Kurland and Cooper, 2002;
Rognes, 2002). Isolation is a factor that may result in lack of interaction with colleagues and lack of
commitment (Hobbs and Armstrong, 1998). Besides isolation, this research also points to the perceived
importance of home inadequacy as a place of working. Although teleworking is treated as working
from home, home is perceived by employees as inadequate place for work. Many reasons contribute to
this claim involve lack of needed collaboration with other employees, security risks, difficulty of
performance control and work coordination (Mills et al., 2001; Tung and Turban, 1996).
Based on the analysis of test results related to hypotheses two and three, most of teleworking
facilitators and inhibitors are not associated with teleworking choice. This means that employees with
different teleworking modes (i.e., full-time, part-time, not to telework) do not differently perceive the
importance of teleworking facilitators and inhibitors. In other words, teleworking facilitators and
inhibitors are visible for all employees regardless of their teleworking preference mode. However,
teleworking choice is found to be associated with the perception of specific teleworking facilitators and
inhibitors. This implies that employees who prefer not to telework tend to perceive less importance for
such teleworking facilitator or inhibitor, while employees who prefer to telework part-time or full-time
tend to perceive higher importance. Such teleworking facilitators which are associated with
teleworking choice include individual freedom, travel overload, and cost reduction. . Union resistance
is the only teleworking inhibitor that is associated with teleworking choice. This is consistent with
other teleworking studies such as Feldman and Gainey (1997) and Pulido and Lopez (2005) who
suggest that individual freedom is highly perceived among part-time teleworkers. In addition,
teleworkers are more likely to report longer commutes to workplace (Yen and Mahmassani, 1997;
Mokhtarian and Salomon, 1996). Finally, perception of cost saving is also over presented among part-
time and full time teleworkers in other context (Kurland and Bailey, 1999; Reid, 1993)
8 RESEARCH LIMITATIONS
There are several limitations of the present study that may restrict its generalizability. First,
sample size is relatively small compared to other studies that have nation-wide samples. Second, the
descriptive and exploratory nature of the topic does not allow the researchers to go into the depth of
predicting the discovered relationships. Despite that, this study is the first of its kinds to examine
teleworking choice and related facilitators and inhibitors in UAE, and in the Arab context. Third, eight
out of eleven organizations do not allow the researchers to collect organization‘s related data such as
income of employees, managerial level, degree of computer use in the organization, level of autonomy,
decentralization, etc. Consequently, such organization‘s related variables are eliminated from the
original questionnaire in order to maintain access to the respondents. Fourth, as the study focuses on
prospective teleworkers in ICT context, results cannot be generalized to other non-ICT contexts.
Int. Journal of Business Science and Applied Management / Business-and-Management.org
34
9 PRACTICAL IMPLICATIONS AND RECOMMENDATIONS
The following are some practical implications and recommendations that have emerged from the
study of teleworking choice in the UAE:
Firms employ relatively large percentages of married, female, IT profession, individuals
living in remote areas are recommended to adopt flexible work practices such as
teleworking.
Managers are advised to adopt part-time or full-time teleworking scheme in order to
integrate and maintain two contradictory strategies; individual freedom and productivity
improvement.
Successful implementation of teleworking requires managers to effectively manage
professional and physical isolation of teleworkers through regular office visits and
meetings with colleagues. Other practical strategies could include regular e-mail intranet
systems, news bulletins and social events. They should also take measures to allow social
comparisons to be made, perhaps through use of newsletters, as well as helping
teleworkers maintain visibility (perhaps with on-line discussions). Given that these
measures are implemented the part-time teleworking is highly recommended compared
with full-time teleworking.
If home is inadequate place for teleworking, managers can rely on telecenters as a
substitute. In telecenters, collaboration with other employees can be conducted, and
performance control can be facilitated.
Managers should ensure that any teleworking initiatives are backed up with the
appropriate technical support in such way that technicians are available and able to
respond quickly to technical problems and equipment failure.
When initiating teleworking schemes, managers should devise a teleworking policy
document that would cover issues such as expectations regarding working when sick,
hours to be worked, salary, meetings and visits, deadlines, continuing training,
opportunities for career development, management by distance, responsibility for hidden
costs (such as electricity) and no hidden costs (such as postage), etc. The aim of such a
document is to let workers feel that they have ―permission‖ to call when they are sick or
to switch off the computer at the end of the working day, as well as helping managers
manage by outlining to distant workers what is expected of them.
The importance of data security, privacy, and confidentiality cannot be overlooked when
work is performed at home. An organization should invest in the appropriate security
measures needed to ensure the confidentiality of data.
It is necessary to provide training both to the teleworkers and their managers or
supervisors. Training areas may include information technologies and networking
procedures as well as psychological preparation to work in a new environment.
10 CONCLUSION
This study examines the concept of teleworking choice as it applies to UAE context. The
relationship between demographic and individual variables, and teleworking choice is investigated. The
research reveals that there is no difference among employees in their teleworking choice based on their
educational level, Internet use, number of children, age, and years of experience. On the other hand,
there is a difference among employees in their teleworking choice based on their gender, marital status,
nationality, residence location, and work profession. In addition, the research identifies six distinct
teleworking facilitators and seven distinct teleworking inhibitors in the UAE context. Generated
facilitators are community concerns, individual freedom, productivity improvement, travel load, cost
reduction, and empowering people, while generated inhibitors are management concerns, isolation,
union resistance, home inadequacy, information and communication technology (ICT) cost, time
mismanagement, and family intervention. Perceived mean importance of these facilitators and
inhibitors is computed and ordered. Individual freedom, community concerns, and productivity are
perceived by employees as the most important facilitators, while isolation and home inadequacy are
perceived as the most important inhibitors. A further statistical test has revealed that there is no
difference among employees in the perceived importance of most teleworking facilitators and inhibitors
based on their teleworking choice. An exception is the association between teleworking choice and
individual freedom, travel overload, cost reduction, and union resistance. The study points out the

Mohamed G. Aboelmaged and Abdallah M. Elamin
35
limitations of the present research and suggests some practical implications and recommendations for
managers.
REFERENCES
Bagley, M.N., and P.L. Mokhtarian (1997), ―Analyzing the preference for non-exclusive forms of
telecommuting: modeling and policy implications,‖ Transportation, Vol. 24, pp. 203-226
Bailey, D.E. and Kurland, N.B. (2002), "A review of telework research: Findings, new directions, and
lessons for the study of modern work." J. Organizational Behavior, Vol. 23 No. 4, pp. 383–400
Baruch, Y. and Nicholson, N. (1997), ―Home, sweet work: requirements for effective home working,‖
Journal of General Management, Vol. 23 No. 2, pp. 15–30.
Belanger, F. (1999), ―Workers‘ propensity to telecommute: an empirical study,‖ Information &
Management, Vol. 35, pp. 139-153.
Bryman, A. (2008), Social Research Methods, Oxford University Press Inc., New York
Carnicer, M., A. Sanchez, M. Perez, and M. Jimenez (2003), ―Gender differences of mobility: analysis
of job and work-family factors,‖ Women in Management Review, Vol. 18 No. 4, pp. 199-219
Cooper, D and Schindler, A. (2003), Business Research Methods. Irwin, MA
Drucker, J., and A.J. Khattak (2000), ―Propensity to work from home – modeling results from the 1995
nationwide personal transportation survey,‖ Transportation Research Record, Vol. 1706, pp. 108-
117
Feldman, D. and Gainey, T. (1997), ―Patterns of telecommuting and their consequences: framing the
research agenda‖, Human Resource Management Review, Vol. 7 No. 4, pp. 369-88.
Gray, M., Hodson, N. and Gordon, G. (1993), Teleworking Explained, John Wiley & Sons, New York,
NY.
Golden, T. (2006), ―Avoiding depletion in virtual work: Telework and the intervening impact of work
exhaustion on commitment and turnover intentions,‖ Journal of Vocational Behavior, Vol. 69, pp.
176–187
Hair, Joseph, Ralph E. Anderson, and Ronald L. Tatham (1992), Multivariate Data Analysis with
Readings, 3rd edition, Macmillan Publishing Company, New York
Hobbs, D. and Armstrong, J. (1998), ―An experimental study of social and psychological aspects of
teleworking‖, Industrial Management & Data Systems, Vol. 98 No. 5, pp. 214-8.
Hochschild, A. (1983), The Managed Heart: Commercialization of Human Feeling, University of
California Press, Berkeley, CA
Knight, William (2004), ―Working drives switch to federated access rights, Info Security Today,
September/October, p. 22-25
Kowalski, K. and J. Swanson (2005), ―Critical success factors in developing teleworking programs,‖
Benchmarking: An International Journal, Vol. 12 No. 3, pp. 236-249.
Kurland, N. and Bailey, D. (1999). When workers are here, there, and everywhere: a discussion of the
advantages and challenges of telework. Organizational Dynamics, pp. 53–68.
Kurland, N. and Cooper, C. (2002), ―Manager control and employee isolation in telecommuting
environments,‖ Journal of High Technology Management Research, Vol.13, pp. 107–126
Lim, H., A. van der Hoorn, V. Marchau, (2003), ―the effects of telework on organization and business
travel,‖ Paper submitted for ―Symposium on Teleworking‖, 4th Interbalkan Forum International
IT conference, Sofia, Bulgaria, 6-7 October 2003
Lupton, P. and Haynes, B. (2000), ―Teleworking – the perception-reality gap‖, Facilities, Vol. 18. No.
7/8, pp. 323-8.
Mann, Sandi (2000), ―An exploration of the emotional impact of tele-working via computer mediated
communication,‖ Journal of Managerial Psychology, Vol. 15 No. 7, pp. 668-690.
Mannering J. and P. Mokhtarian (1995), ―Modeling the choice of telecommuting frequency in
California: An exploratory analysis,‖ Technological Forecasting and Social Change, Vol. 49, pp.
49-73
Mills, J., Wong-Ellison, C., Werner, W., and Clay, J. (2001), ―Employer liability for telecommuting
employees,‖ Cornell Hotel and Restaurant Administration Quarterly, Vol. Oct-Nov., pp. 48 – 59

Int. Journal of Business Science and Applied Management / Business-and-Management.org
36
Mokhtarian, P. L. (1991), ―Definig Telecommuting‖, Transportation Research Record, Vol. 1305, pp.
273-281.
Mokhtarian, P. L., Handy, S. L. & Salomon, I. (1995), ―Methodological issues in the estimation of the
travel, energy, and air quality impacts of telecommuting,‖ Transportation Research, Vol. 29, pp.
283–302.
Mokhtarian, P. L., and I. Salomon (1996) Modeling the choice of telecommuting: the importance of
attitudinal factors in behavioral models. Environment and Planning, Vol. 28, pp. 1877-1894.
Morgan, Robert (2004), ―Teleworking: an assessment of the benefits and challenges,‖ European
Business Review, Vol. 16 No. 4, pp. 344-357
Neufeld, D. and Fang, Y. (2005), Individual, social and situational determinants of telecommuter
productivity, Information & Management, Vol. 42, pp. 1037–1049
Nilles, J. M. (1994), Making Telecommuting Happen: A Guide for Telemanagers and Telecommuters.
Van Nostrand Reinhold, New York
O‘Connor, V. (2001), ―Women and men in senior management‖, Women in Management Review, Vol.
16 No. 8, pp. 400-4.
Peters, P., Tijdens, K. and Wetzels, C. (2004), ―Employees‘ opportunities, preferences, and practices in
telecommuting adoption‖, Information & Management, Vol. 41 No. 4, pp. 469-82.
Popuri, Yasasvi, and Chandra R. Bhat. 2003. ―On modeling choice and frequency of home-based
telecommuting,‖ Transportation Research Record, Vol.1858, pp. 55–60
Pulido, J., and Lopez, F. (2005) ―Teleworking in the information sector in Spain,‖ International
Journal of Information Management, Vol. 25, pp. 229–239
Reid, A. (1993), Teleworking as a Guide to Good Practice, NCC Blackwell.
Rognes, J (2002), ―Telecommuting resistance, soft but strong: Development of telecommuting over
time, and related rhetoric, in three organizations,‖ SSE/EFI Working Paper Series in Business
Administration, No 2002:1, Stockholm School of Economics, Sweden
Safirova, Elena and M. Walls, 2004. "What have we learned from a recent survey of teleworkers?
Evaluating the 2002 SCAG Survey." Discussion Paper 04–43. NW: Resources for the Future,
Washington, D.C
Teo, T. and Lim, V. (1998), ―Factorial dimensions and differential effects of gender on perceptions of
Teleworking,‖ Women in Management Review, Vol. 13 No.7, pp. 253–263
Thériault, M., P. Villeneuve, M. Vandersmissen, and F. Des Rosiers (2005), Home-working,
telecommuting and journey to workplaces: are differences among genders and professions varying
in space?,‖ the 45th
. Congress of the European Regional Science Association, 23-27 August 2005,
Vrije Universiteit Amsterdam
Tung, L-L. and Turban, E. (1996), ―Information technology as an enabler of telecommuting‖,
International Journal of Information Management, Vol. 16 No. 2, pp. 103-18.
Wells, Kimberly, F. Douma, H. Loimer, L. Olson, and C. Pansing. (2001), ―Telecommuting
implications for travel behavior: case studies from Minnesota.‖ Transportation Research Record,
Vol. 1752, pp. 148–5
Yap, C. S. and Tng, H. (1990), ‗Factors associated with attitudes towards telecommuting‘, Information
& Management, Vol. 19, pp. 227–235
Yen, Jin-Ru, and Hani S. Mahmassani. (1997), ―Telecommuting adoption: conceptual framework and
model estimation.‖ Transportation Research Record, Vol. 1606, pp. 95–102
Yeraguntla, A. and C. Bhat (2005), ―A Classification Taxonomy and Empirical Analysis of Work
Arrangements,‖ Working Paper # 05-1522, The University of Texas, Austin

Int. Journal of Business Science and Applied Management, Volume 4, Issue 1, 2009
Strategic management and entrepreneurship:
Friends or foes?
Sascha Kraus
Helsinki University of Technology, Finland
& University of Liechtenstein, Fürst-Franz-Josef-Str., FL-9490 Vaduz, Liechtenstein
Email: [email protected]
Ilkka Kauranen
School of Management¸ Asian Institute of Technology
Office room 236, Phathumthani 12120, Thailand
Tel: +66-89 (0) 6890560
Email: [email protected]
Abstract
The objective of this article is to create a better understanding of the intersection of the academic fields
of entrepreneurship and strategic management, based on an aggregation of the extant literature in these
two fields. The article structures and synthesizes the existing scholarly works in the two fields, thereby
generating new knowledge. The results can be used to further enhance fruitful integration of these two
overlapping but separate academic fields. The article attempts to integrate the two fields by first
identifying apparent interrelations, and then by concentrating in more detail on some important
intersections, including strategic management in small and medium-sized enterprises and start-ups,
acknowledging the central role of the entrepreneur. The content and process sides of strategic
management are discussed as well as their important connecting link, the business plan. To conclude,
implications and future research directions for the two fields are proposed.
Keywords: strategy, strategic management, entrepreneurship, small and medium-sized enterprises,
SMEs, intersection

Int. Journal of Business Science and Applied Management / Business-and-Management.org
38
1 Introduction
In a new competitive landscape (1995), entrepreneurial strategies are becoming more and more
important for both new as well as established enterprises. Due to e.g. increasing environmental
dynamics and intensifying global competition, enterprises, regardless of their age or size, are forced to
build more entrepreneurial strategies in order to compete and survive (Hitt, Ireland, & Hoskisson,
2001; Meyer, Neck, & Meeks, 2002). These entrepreneurial strategies are said to be related to better
company performance. They aim to build on the identification of opportunities and develop them
towards competitive advantages (Hitt, Ireland, Camp, & Sexton, 2002). This is where the fields of
entrepreneurship and strategic management intersect.
Both academic fields are focused on the process of adapting to change and exploiting
opportunities. Despite this shared focus, they have developed largely independently of each other (Hitt
et al., 2001). Recently, scholars have called for the integration of these two fields (Meyer & Heppard,
2000; McGrath & MacMillan, 2000). The need for integration emerges as strategists, on the one hand,
need to use resources in order to exploit opportunities (mostly under uncertain conditions) – and
entrepreneurs, on the other hand, need to include a strategic perspective in their planning and actions.
In times of growing uncertainty and increasing speed of change, both new threats and new
opportunities emerge (Brown & Eisenhardt, 1998; Shane & Venkataraman, 2000). The identification
and exploitation of these opportunities is the essence of entrepreneurship – whereas the essence of
strategic management is in how these opportunities can be transformed into sustainable competitive
advantages (Zahra & Dess, 2001; Venkataraman & Sarasvathy, 2001; Kuratko, Ireland, Covin, &
Hornsby, 2005). The call for the integration of these two fields is a surprisingly new phenomenon.
Both disciplines are concerned with value creation, acknowledging it as a major organizational
goal. Entrepreneurial actions and strategic actions can contribute to value creation independently, but
they can contribute even more when they are integrated. Indeed, entrepreneurial opportunity-seeking is
at the same time also strategic behaviour with the aim of value creation (Ireland, Hitt, & Simon, 2003;
Ramachandran, Mukherji, & Sud, 2006). A central interest of researchers in strategic management is to
explain differences of enterprises in their value creation – an interest which is increasingly shared by
researchers in the field of entrepreneurship as well (Ireland, Hitt, Camp, & Sexton, 2001).
In addition to “classical” variables that describe entrepreneurship, such as the characteristics and
motivations of entrepreneurs, many authors favour a greater emphasis on organizational and strategic
variables (e.g., Zahra, 1991; Entrialgo, Fernández, & Vázquez, 2000). Zahra & Dess (2001) argue that
the integration of different views is a key to more fruitful research in entrepreneurship, and specifically
name strategic management as a most promising area to be integrated into entrepreneurship research.
The positive outcomes of such an integration can be observed in real business life, where
entrepreneurial enterprises are more inclined to engage in strategic management practices than more
established enterprises which are by nature more conservative (Shuman, Shaw, & Sussmann, 1985;
Bracker, Keats, & Pearson, 1988; Woo, Cooper, Dunkelberg, Daellenbach, & Dennis, 1989).
Entrepreneurship and strategic management both have made their unique and valuable
contributions to management theory. Although their foci differ, both are inevitably interrelated, and are
often complementarily supportive of each other (Ireland et al., 2003). Meyer & Heppard (2000) remark
that the two fields are in fact even inseparable, forming two sides of the same coin, since the research
results of the one cannot fully be understood without the other (Barney & Arikan, 2001).
Nevertheless, the evident intersection between these two research fields has been largely left
uncovered so far. Thus, the objective of this article is to create a better understanding of this
intersection, based on an aggregation of the extant literature in these two fields. The article attempts to
structure and synthesize the existing scholarly works on this topic, thereby generating new knowledge.
The results can be used to further enhance fruitful integration of the two academic fields.
2 THE FIELDS OF ENTREPRENEURSHIP AND STRATEGIC MANAGEMENT
2.1. Entrepreneurship
Entrepreneurship was emerging as an academic field of study when Karl Vesper founded an
interest group within the Academy of Management‟s (AoM) Business Policy and Strategy division in
1974. Five years later, David Birch (1979) reported that small enterprises created about 90 percent of
all new jobs, and thereby highlighted entrepreneurship as the engine of growth in the economy. In
1987, entrepreneurship finally became a separate division of the AoM (Meyer et al., 2002). At present,
entrepreneurship is acknowledged as one of the major driving forces of the economy of every modern
society (Brock & Evans, 1989; Carree & Thurik, 2000) and is considered as the instrument to cope
with the new competitive landscape and its enormous speed of changes (Hitt & Reed, 2000).

Sascha Kraus and Ilkka Kauranen
39
Entrepreneurship entails far more than starting up a new venture (Stevenson & Jarillo, 1990). It
can also take place in established organizations where renewal and innovation are a major goal
(Sharma & Chrisman, 1999). Entrepreneurial behaviour can accordingly be found in all kinds of
enterprises, regardless of their size, age or profit-orientation (Kraus, Fink, Rößl, & Jensen, 2007).
Entrepreneurship describes the process of value creation through the identification and exploitation of
opportunities, e.g. through developing new products, seeking new markets, or both (Lumpkin, Shrader,
& Hills, 1998; Shane & Venkataraman, 2000; McCline, Bhat, & Baj, 2000). It focuses on innovation
by identifying market opportunities and by building a unique set of resources through which the
opportunities can be exploited, and is usually connected with growth (Ireland et al., 2001; Davidsson,
Delmar, & Wiklund, 2002). Reynolds et al. (1999) e.g. proposed that 15 percent of the highest growth
enterprises created 94 percent of all new jobs. One of the key challenges for entrepreneurs is to deal
with the strategic changes required with the growth of their enterprise (Thompson, 19999). Many
scholars have thus decided to separate (growth-oriented) entrepreneurship from small business
management (i.e. mom and pop enterprises or lifestyle businesses), describing growth as “the essence
of entrepreneurship” (Sexton & Smilor, 1997, p. 97).
Entrepreneurial enterprises identify and exploit opportunities that their competitors have not yet
observed or have underexploited. An appropriate set of resources is required to exploit entrepreneurial
opportunities with the greatest potential returns (Hitt et al., 2002). An entrepreneurial enterprise‟s
resources are often intangible, such as unique knowledge or proprietary technology. According to
Ireland et al. (2001), entrepreneurial behaviour arises through the “…concentration on innovative,
proactive, and risk-taking behaviour” (p. 51). In real business life, though, there is not yet a cogent,
direct treatise to formally recognize entrepreneurial behaviour as a new “dominant logic” in enterprises
(Meyer & Heppard, 2000).
2.2. Strategic management
The “birth” of strategic management as an academic field can be traced to the 1960s (Furrer,
Thomas, & Goussevskaia, 2007). Chandler‟s “Strategy and Structure” (1962) and Ansoff‟s “Corporate
Strategy” (1965) are among the first seminal publications in this field. In its first decades of existence,
strategic management almost solely investigated strategic issues in large, established enterprises
(Analoui & Karami, 2003).
The basis of strategic management is the notion that strategy creates an alignment between the
enterprise‟s internal strengths and weaknesses on the one hand and its opportunities and threats
(SWOT) in its external environment on the other (Andrews, 1987). Schendel and Hofer (1979)
identified the following six “major tasks” of strategic management: 1) goal formulation, 2)
environmental analysis, as well as the 3) formulation, 4) evaluation, 5) implementation and 6) control
of strategies. Sandberg (1992) lists an enterprise‟s resources, processes, strategy and field of industry as
the primary variables of strategic management.
Strategic management deals with how enterprises develop sustainable competitive advantages
resulting in the creation of value (Ramachandran et al., 2006). An underlying basis of the Austrian
school in strategic management (Schumpeter, 1993 [1934]) is the temporary nature of such competitive
advantages. Accordingly, strategic management can be regarded as setting the context for
entrepreneurial behaviour, i.e. the exploitation of opportunities (Ireland et al., 2001).
Strategic management research is for a large part concerned with identifying differences among
enterprises‟ performance by examining their efforts to develop sustainable competitive advantages as
determinants of their ability to create value (Ireland et al., 2003). A competitive advantage results from
a long-lasting value difference in the product or service compared to those of its competitors as
perceived by the customers (Duncan, Ginter, & Swayne, 1998). The possession of valuable, rare, non-
imitable and non-substitutable resources (Prahalad & Hamel, 1990) as well as a favourable market
position (Porter, 1985) are regarded as major sources for sustainable competitive advantages. This
builds the basis for the resource-based view (RBV) of strategic management, which regards an
enterprise as a bundle of resources that needs to be deployed strategically in order to add value
(Wernerfelt, 1984; Barney, 1991). Small and medium-sized enterprises (SMEs) and start-ups (which
typically are small in the beginning, and therefore a subset of the former), have almost by definition
fewer resources than larger enterprises, and the types of resources of these two groups of enterprises
are different (Mosakowski, 2002). SMEs possess such capabilities as niche filling, speed and flexibility
that allow them to exploit certain opportunities faster and more effectively than established enterprises
(Li, 2001). Nevertheless, so far the RBV lacks the insights provided by creativity and entrepreneurial
behaviour (Barney, 2001). Therefore, the role of entrepreneurial behaviour in corporate strategy is
increasingly emphasized (Mosakowski, 1998; Alvarez & Barney, 2000; McCarthy, 2003).

Int. Journal of Business Science and Applied Management / Business-and-Management.org
40
A major differentiation in strategic management is between content and process, i.e. the strategy
itself (content) and its implementation (process) (Stacey, 1993). On the content side, there are three
“levels” of strategy within enterprises: 1) the corporate strategy which defines what businesses the
enterprise is in and how all of its activities are structured and managed, 2) the business level strategy
which is concerned with creating a competitive advantage in each of the enterprise‟s product levels or
strategic business units, and 3) the functional level strategy examples of which are marketing strategy,
human resources strategy and research and development strategy (Thompson, 1995; Analoui &
Karami, 2003). In SMEs, level 1 and level 2 mentioned above are usually the same.
Strategy can also be classified into different “schools”. Table 1 shows Mintzberg‟s (1990a)
categorization of strategies, which was done after a review of about 1,500 published articles on
strategic management.
Table 1: Mintzberg’s Schools of Strategy
Prescriptive Schools Descriptive Schools I Descriptive Schools II
Design school
Conceptual strategy development
through achievement of a “fit”
between internal strengths and
weaknesses and external
opportunities and threats.
Main instrument: SWOT analysis.
Entrepreneurial School
Visionary strategy formation, vision
and intuition of the entrepreneur
instead of precise plans. Implicit
perspective (vision) which is
personal and unique
Main instruments: Start-up, niche or
turnaround strategies.
Political School
Power-based strategy formation:
The development of strategies
within the organization is
determined by politics and power,
micro power.
Main instruments: Strategy
development is based on self-
interest and fragmentation or tactics
and positioning.
Planning School
Strategy as a formal process with
single clear steps and techniques.
Main instruments: Scenario
planning, check lists, strategic
control.
Cognitive School
Regards strategy formation as a
mental process, based on individual
perceptions.
Main instruments: Deals with the
origin of strategies and the mental
processes of strategy development.
Cultural School
Strategy formation is a social
process which builds on culture.
Main instruments: Strategy
development is based on mutual
interests and integration; strategy
has a collective perspective and it is
unique and mostly implicit.
Positioning School:
Analytical strategy formation,
strategy being regarded as a generic
competitive position depending on
the industry situation.
Main instruments: Boston
Consulting Group matrix,
McKinsey matrix, PIMS study.
Learning School
Strategy development as an
emergent learning process.
Main instruments: Strategy
formulation and development mesh
with each other; frequently applied
in intrapreneurship.
Environmental School
The environment is not only seen as
a factor, but moreover as the central
actor which determines the strategy.
Main instruments: Examination of
the environmental conditions and
the specific position, termed niche
in population ecology.
Sources: Mintzberg (1990a); Sandberg (1992); Mintzberg & Lampel (1999).
Only the first three – the so-called “prescriptive” – schools have developed their own specific sets
of strategic management instruments; the other schools are not bound to any particular instruments.
The basis of all the schools is the design school‟s SWOT analysis from the early 1960s (Mintzberg &
Waters, 1985), which is also most applicable in SMEs. The design school sees the responsibility for
strategy development as being with the top manager. In SMEs, this mostly is the entrepreneur himself.
The high importance of formalization as well as the control function in strategic planning (e.g. in the
business plan) can be derived from the planning school, which usually defines strategy as a static
formal plan, where planners perform a detailed analysis of the enterprise, its product-market
relationship and the environment (Chandler, 1962; Ansoff, 1965). Check lists or scenario planning are
characteristic strategic management instruments of the planning school. Within the positioning school,
Porter‟s niche strategy seems to be particularly relevant for SMEs. Some of the most important
strategic management instruments of the positioning school are portfolio analyses such as the Boston
Consulting Group matrix or the McKinsey matrix. The use of these instruments in SMEs is applicable
once the enterprise has grown and developed more than one single product or service.
Later, scholars began to concentrate more on the process side (Mintzberg & Waters, 1985;
Pettigrew, 1992), and highlighted the emergent nature of strategic planning due to cognitive limitations,

Sascha Kraus and Ilkka Kauranen
41
learning, organizational politics, and cultural biases. The view emerged that strategy was not simply
based on formality, but moreover also reflected experimentation, intuition and learning, and thereby
reflected the increasingly dynamic changes in the outside business economy (Hamel, 1996; Hayashi,
2001; Miller & Ireland, 2005). The entrepreneurial school e.g. emphasizes the central role of the
entrepreneur in strategic management. The vision and intuition of the entrepreneur are said to be more
important than precise and formal plans. The cognitive school deals with the origin of strategies as well
as with the mental processes of strategy development. It regards strategy formulation as a mental
process, which is partly based on individual perceptions. In the complex reality, the “via regia” can be
assumed to lie somewhere in between formal planning on the one side, and flexibility and intuition on
the other. Accordingly, the learning school sees strategy development as a learning process. This
includes the view that a formalized plan is not static, but needs to be revisited and adjusted, e.g. when
environmental conditions change.
The political school claims that the development of strategies within the organization is
determined by politics and power. This goes along with the “power promoter” of Hauschildt &
Kirchmann‟s (2001) promoter model, which states that in innovation processes, different persons with
different powers are needed to overcome the barriers of unwillingness and of ignorance. The cultural
school again considers strategy formulation as a social process which builds on culture. An
“entrepreneurial culture” within an enterprise which supports learning or innovation is an example of
this. The environmental school examines the environmental conditions of the enterprise. It attempts to
discover the enterprise‟s specific optimal position within this environment, e.g. a niche.
All of the nine schools presented in Table 1 are important for strategic management, and they have
also shown obvious intersections with entrepreneurship. In addition to the presented schools, Mintzberg
has developed a tenth school, the configurational school, which can be regarded as an integration of all
the other nine schools. In this school, certain characteristics and behaviours of enterprises and
entrepreneurs are clustered towards an optimal configuration. In this process, all of the named strategic
management instruments of the other schools can be used, depending on the respective situation
(Kohtamäki, Kraus, Kautonen, & Varamäki, 2008).
3 INTEGRATING ENTREPRENEURSHIP AND STRATEGIC MANAGEMENT
3.1. Interrelated fields
Strategic management research has often given the impression that entrepreneurship can be treated
as a subset of strategic management. The fact that the Entrepreneurship Division of the AoM was a
“spin-off” of the Business Policy and Strategy Division contributes to this image. The more recent calls
for the integration of these two fields are mainly due to the reasons that 1) researchers in both fields use
company performance as a major dependent variable, and 2) the new competitive landscape makes
entrepreneurial strategies more and more important (Meyer et al., 2002).
Stevenson and Jarillo (1990) remark that there is a need to establish links between the fields of
entrepreneurship and strategic management. As Dess et al. (1999) put it, “understanding
entrepreneurial processes has been a central theme in a good deal of both the entrepreneurship and
strategic management literatures” (p. 85). Schendel and Hofer (1979) had already linked both research
fields in the late 1970s when defining strategic management as “a process that deals with the
entrepreneurial work of the organization, with organizational renewal and growth…” (p. 11), and
furthermore stating that “the entrepreneurial choice is at the heart of the concept of strategy” (p. 6).
One of the most obvious linkages between entrepreneurship and strategic management are
opportunities. Opportunities are both at the very heart of entrepreneurship and part of e.g. the SWOT
analysis of strategic management. Enterprises create value by identifying opportunities in their external
environment and by subsequently developing competitive advantages to exploit them (Hitt et al., 2001;
Ireland et al., 2001).
Venkataraman and Sarasvathy (2001) used a metaphor based on Shakespeare‟s Romeo and Juliet
saying that strategic management research without an entrepreneurial perspective is like the balcony
without Romeo, and entrepreneurship research without a strategic perspective like Romeo without a
balcony.
Six “natural” domains where the intersection between entrepreneurship and strategic management
exist have been proposed: 1) innovations, 2) networks, 3) internationalization, 4) organizational
learning, 5) top management teams and governance, and 6) growth (Covin & Miles, 1999; Hitt &
Ireland, 2000; Ireland et al., 2001).
Cooper (1979) was the first to place start-ups into the field of strategic management by
investigating the relationships between the characteristics of entrepreneurs, venture strategies and

Int. Journal of Business Science and Applied Management / Business-and-Management.org
42
performance. He argued that strategic management researchers should study established enterprises and
growth-oriented start-ups, but not “mom and pop” small businesses. This later led to the distinction
between “entrepreneurs” and “small business managers” by Carland et al. (1984). From this point on,
more and more scholars have studied the relationship between strategic management and business
performance in SMEs (Schwenk & Shrader, 1993, Kraus, Harms, & Schwarz, 2006). SMEs are thought
to be so unique that standard textbook approaches of strategic management, which have originally been
developed for large enterprises, are not considered suitable for them. On the other hand, corporate
entrepreneurship (intrapreneurship), i.e. entrepreneurial behaviour within established organizations, is
closer to such a “standard” strategic management (Sandberg, 1992). SMEs have always been skilful in
identifying entrepreneurial opportunities, but less effective in developing and sustaining competitive
advantages for exploiting them. It is mostly the other way around with established enterprises (Ireland
et al., 2003).
It has been found that many of the key topics in entrepreneurship research, e.g. new venture
creation, innovation and opportunity-seeking do in fact apply to the strategic management paradigm as
well. New venture creation e.g. is in most cases about acquisition, mobilization and deployment of
resources and the integration of the resources with opportunities, and can thus be linked to Mintzberg‟s
design school, which is about matching resources with opportunities (Sandberg, 1992). Also,
innovation, being understood in the Schumpeterian sense as new combinations of factors of production,
builds on resources, which again build the basis of many strategic management instruments (e.g.
Wernerfelt, 1984; Barney, 1991). If the creation of innovations is understood as an individual process,
both the cognitive school and the entrepreneurial school of Mintzberg can be applied (e.g. in exploring
how innovations appear and in explaining the strategic nature of innovations), and the learning school,
where creation of innovations is seen as an organizational phenomenon (e.g. by the way an innovation
leads its way through the organization).
3.2. Strategic management in SMEs and young SMEs
The application of strategy in SMEs is a main part of the intersection between entrepreneurship
and strategic management (e.g. Chan & Foster, 2001). Next to the content and process side (which are
always interrelated, e.g. in the form of a business plan) of strategy within SMEs, the role of the
entrepreneur is particularly important. The following table as well as the following sub-chapters
exemplarily show four major constitutive elements of SME strategy and their characteristics.
Table 2: Constitutive Elements of SME Strategy
Entrepreneur Strategy Content Strategy Process Business Plan
Characteristics The Entrepreneur or
the SME manager
is the main
strategist and
decision maker
develops the vision,
mission and
strategies for the
enterprise
implements the
vision, mission and
strategies
Most promising market
entry strategies for
SMEs
niche strategy: allows
targeting of customer
needs by focusing the
limited resources on a
narrow market segment
differentiation strategy:
offers the customer a
special advantage
along a valued
dimension (e.g. quality
or price leadership)
Strategic
instruments which
are suitable for
SMEs
SWOT analysis
PEST analysis
industry analysis
product life-cycle
analysis
Business portfolio
matrixes
Written or formal
documentation of the
SME‟s strategy and
strategic planning
means of
communication with
external stakeholders
internal control
mechanism
leads to actual
company founding,
ongoing strategic
planning and
employment growth
Other Issues
and Challenges
Personal goals,
traits and strategic
orientation having a
significant impact
on the SME‟s
strategy.
Daily business is
customarily
regarded as more
important than
long-term
strategies.
Other dimension of
assessing an
enterprise‟s market
entry: product/market
strategy (four-field
matrix with different
combinations for
implementing existing
or new products in
present or new
markets).
Other strategic
instruments (e.g.
benchmarking,
GAP analysis,
BSC), which could
also be used in
SMEs, are often
unknown in SMEs.
Business plans are
rarely existent in
young SMEs.
The question of
whether to write a
business plan is the
entrepreneur‟s
decision, reflecting
his thoughts and
ideas.
(Main) Sources McKenna (1996);
Berry (1998);
Vesper (1980); Ibrahim
(1993); Lee et al.
Andrews (1987);
Zahra & Dess,
Kraus & Schwarz
(2007); Liao &

Sascha Kraus and Ilkka Kauranen
43
McCarthy (2003);
Analoui & Karami
(2003)
(2001); Gruber (2004)
(2001); Analoui &
Karami (2003);
Kraus (2007)
Gartner (2008);
Schulte (2008)
Research Gaps
and Areas for
Future Work
Changes in strategy
when the SME
grows and the
entrepreneur is no
longer the only
decision maker (e.g.
entrepreneurial
teams)
Possible correlations
between the applied
strategy and corporate
success; industry-
specific surveys
Possible
correlations
between the
instruments and
corporate success
Quality, quantity and
content of the
business plan and
their possible
correlations with
corporate success
3.2.1. The entrepreneur’s role in SME strategy
Empirical evidence suggests that entrepreneurs in SMEs plan in a way that is quite different from
the standard textbook approaches (McCarthy, 2003). In the multitude of SMEs, not top management
teams, but the entrepreneur himself is the enterprise‟s main strategist and decision maker, developing
the vision, mission and strategies, and also implementing them (Analoui & Karami, 2003). Strategic
decisions reflect the subjective orientations and attitudes of the entrepreneur. The role of the
entrepreneur and his attitude towards strategic issues are therefore often critical for the implementation
of strategy (Kraus, 2007).
Likewise, the entrepreneur‟s personal goals, traits and strategic orientation will have a significant
impact on the enterprise‟s strategy (McKenna, 1996). Many entrepreneurs routinely operate their daily
business, but do not believe that strategic management applies to them. However, it has been argued
that no business is too small to have a solid strategy (Sandberg, Robinson, & Pearce, 2001). The
question of whether or not to use sophisticated strategic management instruments again depends on the
entrepreneur‟s previous experience (Berry, 1998).
3.2.2. Strategy content
The market entry of a start-up is of major importance because it determines the strategic basis
from which the enterprise tries to achieve competitive advantages in the market place (Gruber, 2004).
The enterprise‟s relative position within the market strongly influences its performance. Within the
spectrum of the generic strategies by Porter (1985), there are (at least) three options: 1) cost leadership,
2) differentiation, and 3) focus on a market niche. Whether there is a cost advantage or a differentiation
potential for the enterprise is the result of the enterprise‟s ability to cope with the five competitive
forces (industry competitors, potential entrants, buyers, substitutes, and suppliers) better than its
competitors. Young SMEs can seldom develop cost advantages, as these are often based on economies
of scale. For these enterprises, most researchers recommend the niche strategy (e.g. Vesper, 19800).
Besides, young SMEs can hardly target a market as a whole, but more likely have to target certain
narrow market segments which larger competitors ignore (Lee, Lim, Tan, & Wee, 2001). A niche
strategy allows an enterprise to target customer needs by focusing the enterprise‟s limited resources on
a narrow segment of the market. This gives time for establishing a market position and developing both
the necessary resources to survive (Bamford, Dean, & McDougall, 1997). Numerous empirical studies
confirm that the niche strategy is often the most successful initial entry strategy. Ibrahim (1993) made
this observation with small enterprises and Bantel (1996) with 166 small technology-based enterprises.
Still, the niche strategy leaves several risks for SMEs, since larger enterprises can easily launch an
attack on the market niche simply by making the choice to do so.
The differentiation strategy is also possible for SMEs. The core of this strategy is to offer the
customer a special advantage along dimensions that are highly valued by the customers (Porter, 1985).
This could be e.g. quality leadership where the enterprise aims to offer the market the best quality
compared to its competitors. The differentiation potential of SMEs is mostly imbedded in the business
idea of the enterprise or in a technical innovation. A common mistake of entrepreneurs is being
enthusiastic about their new ideas, neglecting the market, and failing to assess if there is a target group
for the new products or services.
Another dimension of assessing an enterprise‟s market entry is the product/market strategy. The
decision within this strategy is whether to implement existing or new products in present or new
markets. The original matrix concept of the product/market strategy by Ansoff (1965) consists of four
different strategies: 1) present product in present market, representing status quo, 2) present product in
new market, e.g. through internationalization, 3) new product in old market, usually based on some
innovation, and 4) new product in new market, which is the most risky and most expensive strategy

Int. Journal of Business Science and Applied Management / Business-and-Management.org
44
option. These strategies can be useful for young SMEs as well, despite the fact that these enterprises
are usually restricted in their actions because of their limited resources. The product/market matrix can
be an efficient management instrument for identifying new strategies and for planning resources
accordingly. For achieving the highest performance, each strategy option needs to be linked with
appropriate resources (Borch, Huse, & Senneseth, 1999).
3.2.3. Strategy Process
With regard to the strategy process, several different strategic management instruments can be
applied in SMEs, depending on the respective situation the enterprises are in. For instance, any
enterprise needs to assess its position within its environment and within the market (Zahra & Dess,
2001). A common instrument for this is the SWOT analysis, which aims at studying internal strengths
and weaknesses and matching them with the enterprise‟s external opportunities and threats (Andrews,
1987). A SWOT analysis can be used as a basis for developing future strategies as well as for
developing the business plan. Another part of the environmental analysis is the PEST analysis, which
tries to identify political and legal (P), economical (E), socio-cultural (S), and technological (T) factors
influencing the enterprise. Finally, the industry analysis tries to assess the attractiveness of a specific
industry for the enterprise (Analoui & Karami, 2003). The industry analysis again can use sub-
instruments, such as market analyses (e.g. Wickham, 2001) and Porter‟s (1985) five forces analysis.
The product life-cycle (PLC) concept can be utilized in enhancing the effectiveness of operative
instruments and in changing the strategies, especially in young SMEs. The basic idea of the PLC
concept corresponds to the law of birth and death of all biological existence. This idea can be
transferred to man-made systems, such as products or markets. Even if the forecasting ability of the
PLC concept has been deemed rather limited (Levitt, 1965; Cox, 1967), it provides a good overview of
marketing decision options, especially in the implementation phase and growth phase of an enterprise
(Kraus et al., 2007).
Business portfolio models, such as the Boston Consulting Group (BCG) matrix or the McKinsey
matrix rely, on the one hand, on the PLC concept as a predictor for the axis of market attractiveness
and, on the other hand, on the concept of the learning curve as an indicator for the relative market share
(Hedley, 1977). Originally, these matrixes were designed to facilitate recourse allocation between
different strategic business units (SBUs) of an enterprise. In this sense, portfolios are not applicable for
young SMEs which, due to their small-scaled structure and age, typically do not consist of SBUs.
However, transferring the concept to the range of different products, these matrixes can be useful
strategic management instruments for young SMEs as well. The ideal distribution of products within
the portfolio can especially be interpreted as the optimal structure of the product line, as it shows
opportunities and threats of each single product in relation to both the market share and the maturity of
the market. Such analyses can reveal when a new product should be introduced into the market in order
to rejuvenate the product line, and furthermore when measures need to be taken to boost a product into
a market dominating position (to make a cash cow out of a star).
Other well-known strategic management instruments, such as e.g. benchmarking, GAP analysis or
Balanced Scorecard, which can also be used in SMEs, are often unfamiliar to entrepreneurs, especially
if the entrepreneurs do not have an educational background in management (Kraus, 2007).
3.2.4. The business plan
Every business, regardless of its size, has some form of a strategic plan. In small enterprises, this
may include e.g. the general ideas put forward by the entrepreneur; with increasing size of the
enterprise, however, the strategic plan usually becomes more formal and elaborate. Such a document is
called a business plan. It is the document which describes the enterprise‟s strategy, i.e. content and
process, thereby presenting the vision of the enterprise and how the enterprise is going to attain its
vision (Honig & Karlsson, 2004). The business plan can particularly serve as the basis of the strategy
itself and as its formalized documentation. Usually, it is written to serve as a means of communication
with external stakeholders, especially potential investors (Castrogiovanni, 1996). In addition, it can
serve as a mechanism for internal control and goal-achievement.
Entrepreneurs who prepare a business plan become more conscious of their business instruments
and their assumptions about how to become successful. In some cases, after devising the business plan,
especially after making the financial calculations, the entrepreneur might even find that his business is
not likely to succeed, and thereby gets the chance to not go into business rather than engaging in one
which is ex ante deemed to fail. This can be seen as a most positive outcome of the pre-start-up
planning process.
The pure existence of a business plan and the quality of the business plan are commonly regarded
as indicators of the enterprise‟s attitude towards strategic planning. They also provide insight into how

Sascha Kraus and Ilkka Kauranen
45
much the entrepreneur is committed to his venture (“signalling effect”). Research has indicated that the
probability of actually founding the new company is six times higher among entrepreneurs who have
written a business plan than among entrepreneurs who have not written a business plan (Heriot &
Campbell, 2004). Furthermore, the existence of a business plan has been positively associated with the
success of the enterprise e.g. in an Austrian study of 458 young SMEs by Kraus and Schwarz (2007)
and in a study of 312 nascent entrepreneurs from the USA by Liao and Gartner (2008). Similarly, a
study by Schulte (2008) of 585 business plans from Germany also regarded pre-start-up planning as an
important requirement for success.
The business plan can be regarded as one of the most important strategic management instruments
in young SMEs. Nevertheless, the actual process of decision making that can be observed in reality
often deviates substantially from the management‟s ideal picture of rationality – planning in SMEs
seems to be rather unstructured, sporadic, and incremental, due to e.g. limited resources, limited time,
or the entrepreneur‟s attitude towards formal planning (Kraus, 2007). As a consequence, the majority
of SMEs still do not have a written business plan (e.g., only 29.5% of the 468 young SMEs in the study
by Kraus & Schwarz, 2007 had a business plan).
3.2.5. Limitations of previous research studies
Previous research on the fields of strategic management in SMEs has numerous limitations that
need to be addressed in future research. First, it is often limited to those enterprises that have already
been identified as conducting strategic planning or to the surviving enterprises, whereas failed
companies are not considered (“survivor bias”). These studies‟ response rates have mostly been rather
low. It can be assumed that questionnaires are more frequently returned by such enterprises that apply
strategic management instruments more than the others. The results concerning the use of strategic
management instruments might therefore be unintentionally inflated. Furthermore, in previous studies,
the aggregation of single functional plans has often been a sufficient condition for categorizing an SME
as using strategic planning, which might give a questionable picture of the real nature of the strategic
management in the companies.
Furthermore, previous research studies are difficult to compare with each other due to their
differences in terms of enterprise type, field of industry, sample size, company size, or investigation
period. Likewise, previous studies are often limited to only one industry, which reduces the potential to
derive generalizable conclusions. In this respect, it would be interesting to examine whether there are
differences in the usage of strategic management instruments as it regards the industry sector. It can be
assumed that in these industries, in which product development and order processing have a shorter
time frame (e.g. in the services industry) or in those with a generally smaller range of products,
strategic management instruments are less frequently used.
4 DISCUSSION AND CONCLUSIONS
The objective of the present article was to create a better understanding of the intersection of the
academic fields of entrepreneurship and strategic management. The article was based on an aggregation
of the extant literature in these two fields. It has been shown that there are intersections between both
of these fields of studies, and this is pointed out e.g. by Mintzberg‟s schools of strategy. Obvious
intersections are strategy content and processes within SMEs, i.e. the development of strategic
management instruments for enterprises. The niche strategy has been shown to be a most successful
market entry strategy for new enterprises, whereas the differentiation strategy can also gain importance
once the enterprise grows. Success for any enterprise – regardless of its size or age – is highly
dependent upon its ability to find a valuable strategic position (Thompson, 1999).
Nonetheless, some authors have questioned the overall value of strategic management in SMEs
(e.g. Bhidé, 1994), and argued that it does not work in a dynamic environment where flexibility and
responsiveness are key conditions for survival (Mintzberg, Quinn, & Ghoshal, 1995). We are of a
different opinion. Many of the strategic management instruments which have originally been developed
for large enterprises, such as the SWOT analysis, can be important for SMEs as well, but need to be
adapted according to their particularities. Since SMEs considerably differ from large enterprises in their
amount of resources, it is doubtful that „standard‟ strategic management instruments work in the same
manner in SMEs as in large enterprises. The instruments therefore need to be aligned with the
personnel as well as the cultural, organizational, and financial conditions of the specific enterprise in
order to be successful. Since many strategic instruments are simply not known or applied in SMEs, a
consciousness regarding the virtue of the use of proper strategic instruments needs to be raised. This is

Int. Journal of Business Science and Applied Management / Business-and-Management.org
46
where politics and education have to take over. They both need to use their respective channels for
generating a greater strategic awareness, starting with SMEs, especially the young ones.
All in all, the integration of entrepreneurial (opportunity-seeking) and strategic (advantage-
seeking) perspectives seems to be a promising approach for contemporary management, and is
probably even a necessary approach for coping with the effects of the new competitive landscape. Both
perspectives can be regarded as essential for value creation, although neither is sufficient on its own
(McGrath & MacMillan, 2000; Ireland et al., 2001). Strategic management must therefore without a
doubt become more entrepreneurial, and shift from the traditional administrative approach to a
strategic entrepreneurship approach. This would characterize a new management philosophy that
promotes strategic agility, flexibility, creativity, and continuous innovation. It can also be used in
transforming administrative-oriented employees into intrapreneurs.
A concrete managerial implication of the strategic entrepreneurship approach is the possibility to
develop more entrepreneurial and innovative thinking, especially in young SMEs. This stands in
contrast with the traditional strategic management approach, which characteristically emphasizes
administrative management and focuses on day-to-day business. Intuition and utilizing “gut feelings”
are important elements of the entrepreneur‟s strategy development, although they have to be
supplemented by wise use of strategic management instruments. It is also generally acknowledged that
proper planning has its positive implications for successful implementation. Accordingly, planning
complements and enhances entrepreneurial behaviour or, as Liao and Gartner (2008) put it: “Planners
are doers!” (p. 18).
With regard to research, recent years have brought significant progress in the investigation of
strategic management in (young) SMEs (e.g. Kraus, Harms, & Schwarz, 2008). This has mostly taken
place only on a general, i.e. cross-sectoral level, and has been limited to one country at a time. Future
research regarding the intersection between the entrepreneurial approach and the strategic management
approach should concentrate on (quantitative) empirical investigations from different contexts, i.e. firm
sizes, industries, countries etc. Also, other entrepreneurial sub-groups such as family firms or spin-offs
(corporate venturing) should be investigated regarding their strategic management particularities.
Numerous areas are still under-researched. For example, the changes in enterprise strategies when the
SME grows and the entrepreneur has to delegate power should be investigated in more detail. Possible
correlations between the strategic management instruments applied and company success need more
research. One of the most promising areas for future research is the pre-start-up planning stage.
Strategic management of an enterprise before and during the phase of its foundation is a topic of
increasing interest. This includes research on the role of the business plan in the planning process,
another topic of growing academic interest.
The question of whether the formality of the business plan or the strategic management in general
is beneficial for the success of young SMEs seems to be promising. The dichotomous questions of
whether there is a plan and/or how the qualities of the plan relate to enterprise success should be
investigated. Other relevant research questions entail the content of a business plan, its single elements
and areas, as well as the quality and quantity of such a document. The timing in the preparation of the
business plan (e.g. prior, during or after the founding process) should also be investigated further. Both
quantitative and qualitative research studies, including case research, are called for.
Last but not least, the interplay between personal, structural, strategic and environmental factors in
SMEs, the so-called configurations, (e.g., Harms, Kraus, & Reschke, 2007) is a promising approach for
conceptualizing strategic entrepreneurship by integrating these elementary domains. Of these four
domains, this present article has tried to shed light on the personal and strategic elements of SME
strategy. Accordingly, the two remaining domains of the four in the configuration approach need more
attention. Both theoretical and empirical research work should be done on the (company) structure and
(industry) environment. We regard the configuration approach as one of the most promising avenues
for future research where valid questionnaires for quantitative empirical investigations can be
developed.

Sascha Kraus and Ilkka Kauranen
47
REFERENCES
Alvarez, S., & Barney, J. (2000). Entrepreneurial capabilities - A resource-based view. In G. D. Meyer
& K. A. Heppard (Eds.), Entrepreneurship a strategy - Competing on the entrepreneurial edge
(pp. 63-81). Thousand Oaks, CA: Sage.
Analoui, F., & Karami, A. (2003). Strategic management in small and medium enterprises. London:
Thomson.
Andrews, K. R. (1987). The concept of corporate strategy. Homewood: Irwin.
Ansoff, H. I. (1965). Corporate strategy - An analytical approach to business policy for growth and
expansion. New York: McGraw-Hill.
Bamford, C. E., Dean, T. J., & McDougall, P. P. (1997). Initial strategies and new venture growth: An
examination of the effectiveness of broad vs. narrow breadth strategies. Frontiers of
Entrepreneurship Research, 375-387.
Bantel, K. A. (1996). Niche strategy - planning focus synergy in technological, entrepreneurial firms.
Frontiers of Entrepreneurship Research, 601-615.
Barney, J. (1991). Firm resources and sustained competitive advantage. Journal of Management, 17(1),
99-120.
Barney, J. B., & Arikan, A. M. (2001). The resource-based view: Origins and implications. In M. A.
Hitt, R. F. Freeman & J. S. Harrison (Eds.), Handbook of strategic management (pp. 124-188).
Oxford: Blackwell.
Berry, M. (1998). Strategic planning in small high tech companies. Long Range Planning, 31(3), 455-
466.
Bettis, R. A., & Hitt, M. A. (1995). The new competitive landscape. Strategic Management Journal,
16(5), 7-16.
Bhidé, A. v. (1994). How entrepreneurs craft strategies that work. Harvard Business Review, 72, 150-
163.
Birch, D. L. (1979). The job generation process. Cambridge, MA: MIT Press.
Borch, O. J., Huse, M., & Senneseth, K. (1999). Resource configuration, competitive strategies, and
corporate entrepreneurship: an empirical examination of small firms. Entrepreneurship: Theory &
Practice, 24(1), 49-70.
Bracker, J. S., Keats, B. W., & Pearson, J. N. (1988). Planning and financial performance among small
firms in a growth industry. Strategic Management Journal, 9(6), 591-603.
Brock, W. A., & Evans, D. S. (1989). Small business economics. Small Business Economics, 1(1), 7-
20.
Brown, S. L., & Eisenhardt, K. M. (1998). Competing on the Edge. Boston, MA: Harvard Business
School Press.
Carland, J. W., Hoy, F., Boulton, W. R., & Carland, J. A. (1984). Differentiating entrepreneurs from
small business owners: A conceptualization. Academy of Management Review, 9(2), 354-359.
Carree, M. A., & Thurik, A. R. (2000). The impact of entrepreneurship on economic growth. In D. B.
Audretsch & Z. J. Acs (Eds.), Handbook of Entrepreneurship (pp. 437-471). Boston: Kluwer
Academic Publishers.
Castrogiovanni, G. J. (1996). Pre-startup planning and the survival of new small businesses:
Theoretical linkages. Journal of Management, 22(6), 801-822.
Chan, S. Y., & Foster, J. M. (2001). Strategy formulation in small business. International Small
Business Journal, 19(3), 56-71.
Chandler, A. D. (1962). Strategy and structure. Cambridge u.a.: MIT Press.
Cooper, A. C. (1979). Strategic management: New ventures and small business. In D. E. Schendel & C.
Hofer (Eds.), Strategic management (pp. 316-327). Boston: Little, Brown & Co.
Covin, J. G., & Miles, M. P. (1999). Corporate entrepreneurship and the pursuit of competitive
advantage. Entrepreneurship Theory & Practice, 23(3), 47-63.
Cox, W. E. (1967). Product life cycles as marketing models. Journal of Business, 40(4), 375-384.

Int. Journal of Business Science and Applied Management / Business-and-Management.org
48
Davidsson, P., Delmar, F., & Wiklund, J. (2002). Entrepreneurship as Growth: Growth as
Entrepreneurship. In M. A. Hitt, R. D. Ireland, S. M. Camp & D. L. Sexton (Eds.), Strategic
entrepreneurship: Creating a new mindset (pp. 328-340). Oxford: Blackwell.
Dess, G. G., Lumpkin, G. T., & McGee, J. E. (1999). Linking corporate entrepreneurship to strategy,
structure, and process: suggested research directions. Entrepreneurship: Theory & Practice, 23(3),
85-103.
Duncan, W. J., Ginter, P. M., & Swayne, L. E. (1998). Competitive advantage and internal
organizational assessment. Academy of Management Executive, 12(3), 6-16.
Entrialgo, M., Fernández, E., & Vázquez, C. J. (2000). Linking entrepreneurship and strategic
management: evidence from Spanish SMEs. Technovation, 20(8), 427-436.
Furrer, O., Thomas, H., & Goussevskaia, A. (2007). The structure and evolution of the strategic
management field: A content analysis of 26 years of strategic management research. International
Journal of Management Reviews, forthcoming.
Gruber, M. (2004). Marketing in new ventures: Theory and empirical evidence. Schmalenbach
Business Review, 56(April 2004), 164-199.
Hamel, G. (1996). Strategy as Revolution. Harvard Business Review, 74(4), 69-82.
Harms, R., Kraus, S., & Reschke, C. H. (2007). Configurations of new ventures in entrepreneurship
research - Contributions and research gaps. Management Research News, 30(9), 661-673.
Hauschildt, J., & Kirchmann, E. (2001). Teamwork for innovation - the 'troika' of promotors. R&D
Management, 31(1), 41-49.
Hayashi, A. M. (2001). When to trust your gut. Harvard Business Review, 79(2), 58-65.
Hedley, B. (1977). Strategy and the business portfolio. Long Range Planning, 10(2), 9-14.
Heriot, K. C., & Campbell, N. D. (2004). The tentative link between planning and firm performance in
small firms: An explanatory framework. Paper presented at the USASBE Annual Conference,
Dallas, TX.
Hitt, M. A., Ireland, R., Camp, M., & Sexton, D. (2002). Strategic entrepreneurship: Integrating
entrepreneurial and strategic management perspectives. In M. A. Hitt, R. Ireland, M. Camp & D.
Sexton (Eds.), Strategic Entrepreneurship: Creating a new mindset (pp. 1-13). Oxford: Blackwell.
Hitt, M. A., & Ireland, R. D. (2000). The intersection of entrepreneurship and strategic management
research. In D. L. Sexton & H. A. Landstrom (Eds.), Handbook of entrepreneurship (pp. 45-63).
Oxford.
Hitt, M. A., & Reed, T. S. (2000). Entrepreneurship in the new competitive landscape. In G. D. Meyer
& K. A. Heppard (Eds.), Entrepreneurship as Strategy (pp. 23-48). Thousand Oaks: Sage
Publications.
Hitt, M. A., Ireland, R. D., & Hoskisson, R. E. (2001). Strategic management: Competitiveness and
Globalization (4 ed.). Cincinatti: South-Western College Publishing.
Honig, B., & Karlsson, T. (2004). Institutional forces and the written business plan. Journal of
Management, 30(1), 29-48.
Ibrahim, A. B. (1993). Strategy types and small firms‟ performance: An empirical investigation.
Journal of Small Business Strategy, 4(1), 13-22.
Ireland, R. D., Hitt, M. A., Camp, S. M., & Sexton, D. L. (2001). Integrating entrepreneurship and
strategic management actions to create enterprise wealth. Academy of Management Executive,
15(1), 49-64.
Ireland, R. D., Hitt, M. A., & Simon, D. G. (2003). A model of strategic entrepreneurship: The
construct and its dimensions. Journal of Management, 29(6), 963-989.
Kohtamäki, M., Kraus, S., Kautonen, T., & Varamäki, E. (2008). Strategy in Small-Sized Growth
Firms in Finland: A Discourse Analysis Approach. International Journal of Entrepreneurship and
Innovation, 9(3), 1-10.
Kraus, S. (2007). Strategic Planning in New Ventures and Young SMEs. In C. Wankel (Ed.), 21st
Century Management - A Reference Handbook (pp. 73-81). Thousand Oaks, CA: Sage.
Kraus, S., Fink, M., Rößl, D., & Jensen, S. H. (2007). Marketing in Small And Medium Sized
Enterprises. Review of Business Research, 7(3), 1-11.
Kraus, S., Harms, R., & Schwarz, E. (2008). Strategic Business Planning and Success in Small Firms.
International Journal of Entrepreneurship and Innovation Management, 8(5), forthcoming.
Sascha Kraus and Ilkka Kauranen
49
Kraus, S., Harms, R., & Schwarz, E. J. (2006). Strategic planning in smaller enterprises - New
empirical findings. Management Research News, 29(6), 334-344.
Kraus, S., & Schwarz, E. J. (2007). The role of pre-start-up-planning in new small business.
International Journal of Management and Enterprise Development, 4(1), 1-17.
Kuratko, D. F., Ireland, R. D., Covin, J. G., & Hornsby, J. S. (2005). A Model of Middle-Level
Managers‟ Entrepreneurial Behavior. Entrepreneurship Theory & Practice, 29(6), 699-716.
Lee, K. S., Lim, G. H., Tan, S. J., & Wee, C. H. (2001). Generic marketing strategies for small and
medium-sized enterprises - conceptual framework and examples from Asia. Journal of Strategic
Marketing, 9(2), 145-162.
Levitt, T. (1965). Exploit the product life cycle. Harvard Business Review, 43(6), 81-94.
Li, H. (2001). How does new venture strategy matter in the environment-performance relationship?
Journal of High Technology Management Research, 12(2), 183-204.
Liao, J., & Gartner, W. B. (2008). The Influence of Pre-Venture Planning on New Venture Creation.
Journal of Small Business Strategy, 18(2), 1-21.
Lumpkin, G. T., Shrader, R. C., & Hills, G. E. (1998). Does formal business planning enhance the
performance of new ventures? Frontiers of Entrepreneurship Research, 180-199.
McCarthy, B. (2003). The impact of the entrepreneur's personality on the strategy-formation and
planning process in SMEs. Irish Journal of Management, 24(1), 154-172.
McCline, R. L., Bhat, S., & Baj, P. (2000). Opportunity recognition: An exploratory investigation of a
component of the entrepreneurial process in the context of the health care industry.
Entrepreneurship Theory & Practice, 25(2), 81-94.
McGrath, R. G., & MacMillan, I. (2000). The entrepreneurial mindset. Boston: Harvard Business
School Press.
McKenna, S. D. (1996). The darker side of the entrepreneur. Leadership and Organizational
Development Journal, 17(5), 41.
Meyer, G. D., & Heppard, K. A. (2000). Entrepreneurial Strategies – The dominant logic of
entrepreneurship. In G. D. Meyer & K. A. Heppard (Eds.), Entrepreneurship as strategy -
competing on the entrepreneurial edge (pp. 1-22). London: Sage.
Meyer, G. D., Neck, H. M., & Meeks, M. D. (2002). The Entrepreneurship-Strategic Management
Interface. In M. A. Hitt, R. D. Ireland, S. M. Camp & D. L. Sexton (Eds.), Strategic
entrepreneurship: Creating a new mindset (pp. 19-44). Oxford: Blackwell.
Miller, C. C., & Ireland, R. D. (2005). Intuition in strategic decision making: friend or foe in the fast-
paced 21st century? Academy of Management Executive, 19(1), 19-30.
Mintzberg, H. (1990a). The design school: Reconsidering the basic bpremises of strategic management.
Strategic Management Journal, 11(3), 171-195.
Mintzberg, H., & Lampel, J. (1999). Reflecting on the Strategy Process. Sloan Management Review,
40(3), 21-30.
Mintzberg, H., Quinn, J. B., & Ghoshal, S. (1995). The Strategy Process. London: Prentice Hall.
Mintzberg, H., & Waters, J. (1985). Of strategies, deliberate and emergent. Strategic Management
Journal, 6(3), 257-272.
Mosakowski, E. (1998). Entrepreneurial resources, organizational choices, and competitive outcomes.
Organization Science, 9(6), 625-643.
Mosakowski, E. (2002). Overcoming resource disadvantages in entrepreneurial enterprises: When less
is more. In M. A. Hitt, R. D. Ireland, S. M. Camp & D. L. Sexton (Eds.), Strategic
entrepreneurship: Creating a new mindset (pp. 106-125). Oxford: Blackwell.
Pettigrew, A. (1992). The character and significance of strategy process research. Strategic
Management Journal, 13(8), 5-16.
Porter, M. E. (1985). Competitive advantage: creating and sustaining superior performance. New
York: The Free Press.
Prahalad, C. K., & Hamel, G. (1990). The core competence of the corporation. Harvard Business
Review, 68(3), 79-91.
Ramachandran, J., Mukherji, S., & Sud, M. (2006). Strategic Entrepreneurship in a Globalising
Economy: Evidence from Emerging Economies. IIMB Management Review, 28(3), 291-302.

Int. Journal of Business Science and Applied Management / Business-and-Management.org
50
Reynolds, P. D., Hay, M., & Camp, M. (1999). Global Entrepreneurship Monitor - 1999 Executive
Report. Wellesley, MA/London/Kansas City: Babson College, London Business School and
Kauffman Center for Entrepreneurial Leadership.
Sandberg, W. R. (1992). Strategic management's potential contributions to a theory of
entrepreneurship. Entrepreneurship: Theory & Practice, 16(3), 73-90.
Sandberg, W. R., Robinson, R. B., & Pearce, J. A. (2001). Why small businesses need a strategic plan.
Business & Economic Review, 48(1), 12-15.
Schendel, D. E., & Hofer, C. W. (1979). Strategic management. Boston: Little, Brown & Co.
Schulte, R. (2008). Pre-start-up planning sophistication and its impact on new venture performance in
Germany. In M. Fink & S. Kraus (Eds.), Management in SMEs and New Ventures (p.
forthcoming). London: Routledge.
Schumpeter, J. A. (1993 [1934]). The theory of economic development. New Brunswick, London:
Transaction Publishers.
Schwenk, C. R., & Shrader, C. B. (1993). Effects of formal strategic planning on financial performance
in small firms: a meta-analysis. Entrepreneurship: Theory and Practice, 17(3), 53-64.
Sexton, D. L., & Smilor, R. W. (1997). Entrepreneurship 2000. Chicago, IL: Upstart Pub. Co.
Shane, S., & Venkataraman, S. (2000). The promise of entrepreneurship as a field of research.
Academy of Management Review, 25(1), 217-226.
Sharma, P., & Chrisman, J. J. (1999). Toward a reconciliation of the definitional issues in the field of
corporate entrepreneurship. Entrepreneurship Theory & Practice, 23(3), 11-27.
Shuman, J. C., Shaw, J. J., & Sussmann, G. (1985). Strategic planning in smaller rapid growth
companies. Long Range Planning, 18(6), 48-53.
Stacey, R. D. (1993). Strategic Management and Organisational Dynamics. London: Pitman.
Stevenson, H. H., & Jarillo, J. C. (1990). A paradigm of entrepreneurship: entrepreneurial management.
Strategic Management Journal, 11(4), 17-27.
Thompson, J. L. (1995). Strategy in Action. London: Chapman & Hall.
Thompson, J. L. (1999). A strategic perspective of entrepreneurship. International Journal of
Entrepreneurial Behavior & Research, 5(6), 279-296.
Venkataraman, S., & Sarasvathy, S. D. (2001). Strategy and entrepreneurship: Outlines of an untold
story. In M. A. Hitt, E. Freeman & J. S. Harrison (Eds.), Handbook of strategic management (pp.
650-668). Oxford: Blackwell.
Vesper, K. H. (1980). New venture planning. Journal of Business Strategy, 1(2), 73-75.
Wernerfelt, B. (1984). A resource-based view of the firm. Strategic Management Journal, 5(2), 171-
180.
Wickham, P. A. (2001). Strategic Entrepreneurship: A decision-making approach to new venture
creation and management (2 ed.). London: Prentice Hall.
Woo, C. Y., Cooper, A. C., Dunkelberg, W. C., Daellenbach, U., & Dennis, W. J. (1989). Determinants
of growth for small and large entrepreneurial start-ups. In R. Brockhaus, N. Churchill, J. Katz, B.
Kirchhoff, K. Vesper & L. W. Wetzel (Eds.), Fronties of Entrepreneurship Research (pp. 134-
147). Wellesley, MA: Babson College.
Zahra, S. (1991). Predictors and financial outcomes of corporate entrepreneurship: An exploratory
study. Journal of Business Venturing, 6(4), 259-286.
Zahra, S., & Dess, G. G. (2001). Entrepreneurship as a field of research: Encouraging dialogue and
debate. Academy of Management Review, 26(1), 8-10.

Int. Journal of Business Science and Applied Management, Volume 4, Issue 1, 2009
Book Review: Exploring Corporate Strategy: Texts and
Cases
Dimitrios N. Koufopoulos
Brunel Business School, Brunel University
Uxbridge, London UB8 3PH
Tel: +44 (0) 1895 265250
Email: [email protected]
Gabriella Spinelli
Brunel Business School, Brunel University
Uxbridge, London UB8 3PH
Tel: +44 (0) 1895 267544
Email: [email protected]
Book Information
Book Title: Exploring Corporate Strategy: Texts and Cases
Author: Gerry Johnson, Kevan Scholes and Richard Whittington
Publisher: Prentice Hall: Financial Times Press, UK
Edition: 8th edition
Year: 2008
Pages: 878 pages
ISBN: 978-0-273-71192-6
Price: £43.69
Keywords: strategic management, corporate and business strategies

Int. Journal of Business Science and Applied Management / Business-and-Management.org
52
1 BOOK REVIEW
Having established a worldwide reputation with sales over 750,000 copies, the current edition of
this book -published for the first time in the early 80s – lives up to its popularity.
As in past editions the introductory chapter illustrates the strategy concept in a clear, well
organized and comprehensive manner. Alongside the well developed three lenses of strategy (design,
experience and ideas), already a feature of the past versions, this edition introduces an extra lens; this is
strategy as a discourse and ability to communicate and shape organisational objectives. The rest of the
book is then structured in three parts dedicated respectively to Strategic positioning; Strategic choices
and the principles of Strategy in action.
The four chapters of Part I discuss the issues, facets and factors that affect and influence
organizations into their quest for developing and managing their strategies. This part encompasses
considerations on the organisational environment, the capabilities, resources and assets, the purposes,
vision and organizational mission and the culture.
Part II focuses on the choices that eventually organizations are bound to take. Chapter 6 illustrates
the available strategies at the business level whereas Chapter 7 moves its attention to corporate level.
To respond to the disciplinary needs, Chapter 8 is introduced and reflects on the International aspects
of Strategies and strategic development. Chapter 9, also an addition of the latest edition, portrays the
increasing academic interest on Innovation and Entrepreneurship. Finally, Chapter 10 goes on to
consider the methods and ways that companies pursue in order to materialise their strategies.
Part III draws on the well known debate of deliberate vs. emergent approaches that has dominated
the discipline for the last 30 years. The chapters in this part of the book analyse and review issues
related to strategy development, planning, organisational configuration and the fundamental business
resources: people, information, finance and technology. Change and the management of change are
also examined within part III leading to the identification of key roles and stakeholder in strategy
practicalities.
As in previous editions, the main conceptual elements are supported by brief case examples within
the main text and by extended case studies, 17 brand new and 19 thoroughly revised, that feature at the
end of the book. Through this structure the authors uphold the narrative flow of the book still providing
the readers with extensive resources.
The structure of the book has been carefully planned and the guided tour section directs the
readers to effectively integrate the online and printed resources.
This is a superb book and a required addition to the library of students both at their undergraduate
and postgraduate studies or anyone who wishes to understand issues relating to well known but often
misused concepts of strategy, strategy development and strategy implementation.