International Journal of Artificial Intelligence and...
20
International Journal of Artificial Intelligence and Applications (IJAIA), Vol.9, No.2, March 2018 DOI : 10.5121/ijaia.2018.9201 1 OVERVIEW AND APPLICATION OF ENABLING TECHNOLOGIES ORIENTED ON ENERGY ROUTING MONITORING, ON NETWORK INSTALLATION AND ON PREDICTIVE MAINTENANCE Alessandro Massaro, Angelo Galiano, Giacomo Meuli, Saverio Francesco Massari Dyrecta Lab, IT research Laboratory, via Vescovo Simplicio,45, 70014 Conversano (BA), Italy ABSTRACT Energy routers are recent topics of interest for scientific community working on alternative energy. Enabling technologies supporting installation and monitoring energy efficiency in building are discussed in this paper, by focusing the attention on innovative aspects and on approaches to predict risks and failures conditions of energy router devices. Infrared (IR) Thermography and Augmented Reality (AR) are indicated in this work as potential technologies for the installation testing and tools for predictive maintenance of energy networks, while thermal simulation, image post-processing and data mining improve the analysis of the prediction process. Image post- processing has been applied on thermal images and for WiFi AR. Concerning data mining we applied k-Means and Artificial Neural Network –ANN- obtaining outputs based on measured data. The paper proposes some tools procedure and methods supporting the Building Information Modeling- BIM- in smart grid applications. Finally we provide some ISO standards matching with the enabling technologies by completing the overview of scenario . KEYWORDS Energy Router, IR Thermography, Augmented Reality, Predictive Maintenance, Design Simulation, Data Mining, Neural Network,Building Information Modeling, Failure Conditions. 1. INTRODUCTION Smart Grid applications and energy management are interesting topics in the research field [1]- [3]. A particular attention has been focused on Home Energy Management (HEMS) [3] and on energy management by means of simulators [4]. As simulator useful for the study and the design of energy system some authors have applied the open sources Energy 2D [5]-[7] and Energy 3D tools [8]-[12]. The use of the simulator tools are suitable for the improvement of the Visual Process Analytics (VPA) which includes data mining algorithms and multiple visualization oriented on energy monitoring and predictions [8]. A good matching between Artificial intelligence and computer-aided design (CAD) platforms support human designers for a high performance energy models [9]-[11]. Approaches including infrared (IR) thermography post- processed by data mining (K-Means clustering) algorithms, are able to support the planning of procedures oriented on the monitoring of energy efficiency in building, by defining risk maps of energy leakage with only a radiometric image [12]. The application of Artificial Neural Network (ANNs) together with infrared thermography has been discussed in [13], where ANNs network (Multilayered Perceptron –MLP-) provided predictive maintenance of electrical equipment by classifying defects identified into thermal images. Also Augmented Reality (AR) technologies have been applied on thermal visualizations [14]-[16] thus suggesting their application in Building Information Modeling (BIM) [17]. In order to implement a decision support system (DSS) based on predictive maintenance it is necessary to apply data mining algorithms. These
Transcript of International Journal of Artificial Intelligence and...

International Journal of Artificial Intelligence and Applications (IJAIA), Vol.9, No.2, March 2018
DOI : 10.5121/ijaia.2018.9201 1
OVERVIEW AND APPLICATION OF ENABLING
TECHNOLOGIES ORIENTED ON ENERGY ROUTING
MONITORING, ON NETWORK INSTALLATION AND
ON PREDICTIVE MAINTENANCE
Alessandro Massaro, Angelo Galiano, Giacomo Meuli, Saverio Francesco Massari
Dyrecta Lab, IT research Laboratory, via Vescovo Simplicio,45, 70014
Conversano (BA), Italy
ABSTRACT
Energy routers are recent topics of interest for scientific community working on alternative energy.
Enabling technologies supporting installation and monitoring energy efficiency in building are discussed in
this paper, by focusing the attention on innovative aspects and on approaches to predict risks and failures
conditions of energy router devices. Infrared (IR) Thermography and Augmented Reality (AR) are
indicated in this work as potential technologies for the installation testing and tools for predictive
maintenance of energy networks, while thermal simulation, image post-processing and data mining
improve the analysis of the prediction process. Image post- processing has been applied on thermal images
and for WiFi AR. Concerning data mining we applied k-Means and Artificial Neural Network –ANN-
obtaining outputs based on measured data. The paper proposes some tools procedure and methods
supporting the Building Information Modeling- BIM- in smart grid applications. Finally we provide some
ISO standards matching with the enabling technologies by completing the overview of scenario
.
KEYWORDS
Energy Router, IR Thermography, Augmented Reality, Predictive Maintenance, Design Simulation, Data
Mining, Neural Network,Building Information Modeling, Failure Conditions.
1. INTRODUCTION Smart Grid applications and energy management are interesting topics in the research field [1]-[3]. A particular attention has been focused on Home Energy Management (HEMS) [3] and on energy management by means of simulators [4]. As simulator useful for the study and the design of energy system some authors have applied the open sources Energy 2D [5]-[7] and Energy 3D tools [8]-[12]. The use of the simulator tools are suitable for the improvement of the Visual Process Analytics (VPA) which includes data mining algorithms and multiple visualization oriented on energy monitoring and predictions [8]. A good matching between Artificial intelligence and computer-aided design (CAD) platforms support human designers for a high performance energy models [9]-[11]. Approaches including infrared (IR) thermography post-processed by data mining (K-Means clustering) algorithms, are able to support the planning of procedures oriented on the monitoring of energy efficiency in building, by defining risk maps of energy leakage with only a radiometric image [12]. The application of Artificial Neural Network (ANNs) together with infrared thermography has been discussed in [13], where ANNs network (Multilayered Perceptron –MLP-) provided predictive maintenance of electrical equipment by classifying defects identified into thermal images. Also Augmented Reality (AR) technologies have been applied on thermal visualizations [14]-[16] thus suggesting their application in Building Information Modeling (BIM) [17]. In order to implement a decision support system (DSS) based on predictive maintenance it is necessary to apply data mining algorithms. These

International Journal of Artificial Intelligence and Applications (IJAIA), Vol.9, No.2, March 2018
2
algorithms can be executed by using open source tools such as R language, Orange Canvas, Rapid Miner, KNIME and Weka (Waikato Environment for Knowledge Analysis), available as Graphical User Interfaces (GUIs) using objects or libraries [18]-[19]. Advanced image processing tools such as ImageJ can provide further typologies of advanced analyses such as 3D processing and segmentation of images [20]-[21]. A typical tool for the design of hybrid renewable energy systems is Homer [22]. This tools provides ideal load distribution during the time starting from the energy power distribution of a smart grid. In this paper we discuss and apply the tools and the approaches mentioned partially in the state of the art by highlighting some aspects concerning the predictive maintenance. The paper is structured as follows:
• Description of the main architecture of enabling technologies utilized in a pilot research project involving energy routing of renewable energy;
• Application of different tools considered the proposed architecture;
• Definition of algorithms for intelligent electric load management based on power prediction;
• Discussion about ISO standard laws regarding the main topics developed in this work.
Figure 1. System architecture integrating enabling technologies for energy routing analysis.
2. ENABLING TECHNOLOGIES AND RESULTS In this section we describe the architecture of Fig. 1 embedding different enabling technologies oriented on the design, the installation, the monitoring and on the predictive maintenance of an energy routing building network.
2.1. System architecture and main use cases In Fig. 1 we illustrate the proposed system architecture containing the main use cases. We list below the use case concerning the main actors of the system:

International Journal of Artificial Intelligence and Applications (IJAIA), Vol.9, No.2, March 2018
3
• Case 1 (testing installation): the thermographic operator acquires thermal images by means of a thermal camera or by a visor/mobile device supporting real time thermal image processing (processing of augmented reality). The inspection of the energy router components should be performed under good environment conditions (good thermal excitation, absence of rain and humidity, etc.), and good operator position (good angle of view). The thermal testing should executed by applying the electrical loads.
• Case 2 (testing and verification before to apply maintenance procedures): the operator downloads thermal data and thermograms on the personal computer and verify better the detected anomalies. After he compares the design specifications with the measured data of the produced energy by observing possible mismatching. This verification it is important to update the maintenance procedures (predictive maintenance of first level).
• Case 3 (data post-processing): the operator post-processes the radiometric data in order to classify in details the defects and the anomalies by means of data mining algorithms (k-Means for clustering and ANNs network for prediction) and of image processing tools. The post-processing outputs provide further information about predictive maintenance (predictive maintenance of second level). The post-processing phase includes the improvement of the electric load management due to the analysis of data sensors monitoring electrical power distribution in the building.
• Case 4 (training): the operator visualizes in a AR visor the post-processed image in order to learn risk levels and maintenance procedures.
2.2. IR Thermography: basic principle and thermal camera specifications used in
the experimentation
Temperature measurement using IR Thermography measures the infrared radiation emitted by an object and converts the energy detected due to particle vibrations into a temperature value [23]. For a good setting of a thermal camera radiation from other sources or from environment must be removed in the conversion to temperature. This setting process is called compensation. As reported in equation (1), the total radiation received by the thermal camera (WT) comes from three sources: the emission of the target object (Eo), the emission of the surroundings and reflected by the object (Er) and the emission of the environment (Ee):
T o r eW E E E= + + (1)
where
4
4
4
( )
(1 ) ( )
(1 ) ( )
o o e o
r o e r
e e e
E T
E T
E T
ε τ σ
ε τ σ
τ σ
= ⋅ ⋅ ⋅
= − ⋅ ⋅ ⋅
= − ⋅ ⋅
(2)
being σ is the Stefan–Boltzmann constant, ε is the emissivity, τ is the transmittance, and T is the temperature. The transmittance of the environment is generally estimated using the distance from the object to the camera and the relative humidity. In general, this value is very close to one. The temperature of the environment can be obtained using a common thermometer. For the experimental radiometric images used this work has been used a FLIR T1020 camera, having the following main specifications: thermal sensitivity <0,02 °C at 30 °C, IR sensor resolution of 1024

International Journal of Artificial Intelligence and Applications (IJAIA), Vol.9, No.2, March 2018
4
x 768 pixel, temperature range of -40°C to 2000°C, frame rate of 30 Hz, spectral range between
7.5 – 14 µm.
2.3. Augmented Reality Embedding IR Thermography Augmented Reality embedding thermography could be improved in different ways such as: (i) by constructing visor objects by means of development platform (Unity 3D [24] or Vuforia [25]) able to download them in a visor or in a smartphone inserted into a cardboard ; (ii) by integrating a thermal sensor inside the visor [26]; (iii) by using smartphone or tablet in Multi-Spectral Dynamic Imaging (MSX), thermal fusion and picture-in-picture modalities. The last approach is the basic mode to improve augmented reality directly on a mobile device: a simple way to produce a real time AR images is to use Flir Tools Mobile App which allows to view the thermal images in real time by means of the WiFi connection. The ‘augmented’ reality is due to the superposition of real photo contours (or part of the real image) on the thermal images, by viewing in real time the composed images. Concerning this last approach it is possible to add in the thermal image different information about inspected object such as parameters or comments, or colour maps filtering different range of temperature values. In Fig. 2 we show an example of importing assets elements in Unity 3D platform by considering a post-processed image of an electrical cabinet. This approach could be useful for training procedures (case 4) by constructing a virtual environment of a thermal post–processed image, in order highlight possible critical aspects about fire risk or failure of electrical components. In Fig. 3 we show an image observed on a smartphone through different modalities of an electrical cabinet: in this image it is possible to distinguish better each element of the object thus facilitating the localization of the anomaly characterized by a higher temperature. Therefore the Augmented reality can be adopted to:
• verify the energy equpment status by means ‘augmented’ viewing modalities, or by means of a visor integrating IR thermal sensor, after the installation activity;
• transfer knowledge to workers enabled for installation and maintenance of elements of the energy network by designing virtual environments;
• predict imminent electrical failures.
Figure 2. Case 4: thermal image loaded as assets in Unity 3D platform.

International Journal of Artificial Intelligence and Applications (IJAIA), Vol.9, No.2, March 2018
5
Figure 3. Thermal image of a small electrical cabinet: case 1. (a) Original thermal image, (b) MSX image, (c) thermal fusion image, (d) picture-in-picture image.
2.4. Software oriented on design, on verification, and on predictive maintenance The design software can be used in order to test the correct work of the energy router network and to optimize the energy router layout. We discuss in this paragraph different simulators applied for the study of building thermal properties and for thermal characterization of some electrical components. The simulator Energy 2D [5]-[7] has been applied for the thermal characterization of building indoor heat transfer and for thermal characterization of the electrical cabinets, while Energy 3D [8]-[12] provides mainly data about outdoor applications involving solar energy of whole buildings and on photovoltaic (PV) panels. Both the simulators solve the follow differential equation:
( ) [ ]T
c T k T qt
ρ∂
+ ∇ ⋅ = ∇ ⋅ ∇ + ∂ υ (3)
being k the thermal conductivity, c the heat capacity, ρ the density, νννν field velocity, and q the heat generation. The equation (3) is solved in the 3D (x,y,z) space by means of the Finite Difference Time Domain (FDTD) approach. In Fig 4 (a) we illustrate an Energy 2D simulation of heat indoor distribution by considering a model with two heat source (see circles) and three “numerical” thermometers placed in the middle of the room. This model is useful in order to compare measured indoor data with ideals ones provided by the simulation, and to allocate efficiently sensors in the building structure (case 2). Furthermore the indoor simulation can be analysed for the explanation of thermal phenomena observed by the IR thermography (location of heat sources, thermal bridges, etc.): for example the predictive maintenance can be applied by analysing results of thermal leakage of windows or some parts of the building to restructure. It was observed from the simulations that the thermometer 1 (higher position), starting from 0 ° C, reached the temperature of 20 °C after only 4 minutes and 30 seconds. This is an important aspect about the monitoring of the real case, where is needed the knowledge of the time necessary to heat a room. We report in same Fig. 4 (a) the superimposed graphs related to the temperature
International Journal of Artificial Intelligence and Applications (IJAIA), Vol.9, No.2, March 2018
6
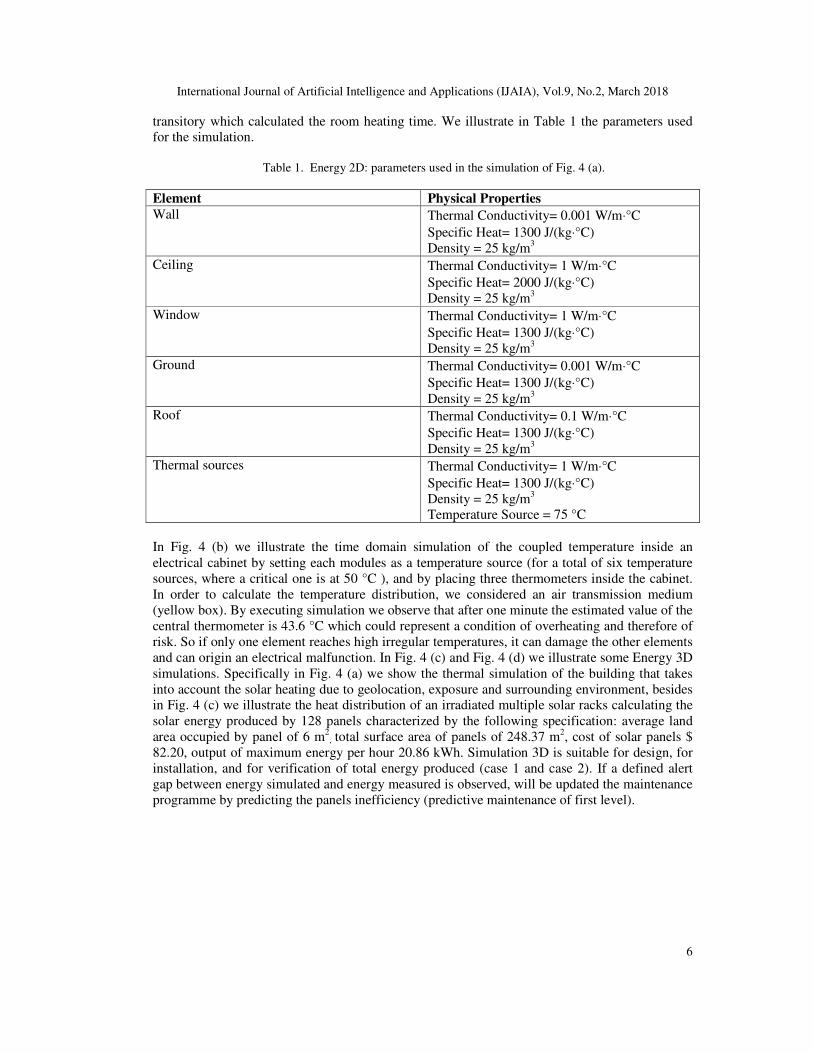
transitory which calculated the room heating time. We illustrate in Table 1 the parameters used for the simulation.
Table 1. Energy 2D: parameters used in the simulation of Fig. 4 (a).
Element Physical Properties
Wall Thermal Conductivity= 0.001 W/m⋅°C
Specific Heat= 1300 J/(kg⋅°C) Density = 25 kg/m3
Ceiling Thermal Conductivity= 1 W/m⋅°C
Specific Heat= 2000 J/(kg⋅°C) Density = 25 kg/m3
Window Thermal Conductivity= 1 W/m⋅°C
Specific Heat= 1300 J/(kg⋅°C) Density = 25 kg/m3
Ground Thermal Conductivity= 0.001 W/m⋅°C
Specific Heat= 1300 J/(kg⋅°C) Density = 25 kg/m3
Roof Thermal Conductivity= 0.1 W/m⋅°C
Specific Heat= 1300 J/(kg⋅°C) Density = 25 kg/m3
Thermal sources Thermal Conductivity= 1 W/m⋅°C
Specific Heat= 1300 J/(kg⋅°C) Density = 25 kg/m3
Temperature Source = 75 °C
In Fig. 4 (b) we illustrate the time domain simulation of the coupled temperature inside an electrical cabinet by setting each modules as a temperature source (for a total of six temperature sources, where a critical one is at 50 °C ), and by placing three thermometers inside the cabinet. In order to calculate the temperature distribution, we considered an air transmission medium (yellow box). By executing simulation we observe that after one minute the estimated value of the central thermometer is 43.6 °C which could represent a condition of overheating and therefore of risk. So if only one element reaches high irregular temperatures, it can damage the other elements and can origin an electrical malfunction. In Fig. 4 (c) and Fig. 4 (d) we illustrate some Energy 3D simulations. Specifically in Fig. 4 (a) we show the thermal simulation of the building that takes into account the solar heating due to geolocation, exposure and surrounding environment, besides in Fig. 4 (c) we illustrate the heat distribution of an irradiated multiple solar racks calculating the solar energy produced by 128 panels characterized by the following specification: average land area occupied by panel of 6 m2
, total surface area of panels of 248.37 m2, cost of solar panels $ 82.20, output of maximum energy per hour 20.86 kWh. Simulation 3D is suitable for design, for installation, and for verification of total energy produced (case 1 and case 2). If a defined alert gap between energy simulated and energy measured is observed, will be updated the maintenance programme by predicting the panels inefficiency (predictive maintenance of first level).

International Journal of Artificial Intelligence and Applications (IJAIA), Vol.9, No.2, March 2018
7
Figure 4. (a) Energy 2D: thermal simulation of indoor heat propagation; in the plot are superimposed the time evolution of the three temperatures. (b) Energy 2D: thermal simulation of temperature coupling in an electrical cabinet; in the plot are superimposed the time evolution of the three temperatures. (c) Energy 3D: simulation of solar impact on a building. (d) Energy 3D: simulation of solar impact and energy production
of four photovoltaic panels.
We illustrate in Table 2 an example of working and critical temperature values of elements of an electrical cabinet (CEI EN 61439) useful for the comparison of numerical results.
Table 2. Element of an electrical cabinet: critical and operating temperatures.
Element Recommended operating
temperature
Maximum temperature
with risk of malfunction
Speed variators 35 °C 50 °C
PLC 35 °C 40 - 45 °C
Contactors 45 °C 50 °C
Switches 45 °C 50 °C
Fuses 50 °C 50 °C
Power supplies 35 °C 40 °C
PCB 30 °C 40 °C
Batteries 20 - 25 °C 30 °C
TLC devices 40 – 50 °C 55° C
PFC Capacitors 50 °C 55° C
We observe that online are available other open source tools oriented on the design and temperature modelling of an electrical cabinet [27]. The design of a whole smart grid network integrating different alternative energy sources can be achieved by Homer Simulator [22]. This simulator is able to provide the main sizing of the smart grid and the template system architecture. In the simulation of Fig. 5 is illustrated the schematic architecture of a network characterized by a primary load of 10 kWh/d, 1.65 kW of peak, 1 kW wind turbine (module XL1), 1 kW photovoltaic panels (module PV), 2.6 kW gasoline generator (module Gen), AC/DC converter, and energy storage batteries (module P16P having nominal capacity 2kW/h). The illustrated layout has been designed to handle small electrical loads lights only. In Fig. 5 we show

International Journal of Artificial Intelligence and Applications (IJAIA), Vol.9, No.2, March 2018
8
the electric load characteristics of the simulated network: the curves refer to daily, monthly and annual trends. By analysing these curves it is evident how there are three load peaks during the day at the sixth hour, at the twelfth hour and at the eighteenth hour (most intense peak of 1.231 kW). The same simulator provides also information about load frequency (in the simulated case 0.35 kW is the power most used corresponding to a percentage of about 12% of the entire use of the entire electric load), and about equipment characteristics (costs, replacement costs, life cycle).
Figure 5. Homer simulator: template of a smart grid architecture and load distribution.
2.5. Data post-processing The data post-processing represent the real innovation of the BIM approach and provides important information about predictive maintenance. In order to create an efficient predictive model it is important to create the training dataset by experimental results. To do this different sensors (meter analyser, data logger, meteorological sensors) have been installed on a PV prototype demonstrator (having a peak power of 30 kWp). For the data post-processing we used the java libraries using Eclipse platform, and ANN Weka libraries (Time Series Forecasting with Multilayer Perceptron -MLP- classifier [28]). The training dataset has been created by 3690 measured data extracted from the experimental Sunguard platform [29], where each data sample corresponds t the total energy measured at a time step of 5 minutes. The testing dataset has been created by the measurements of the last 2.5 days (720 counts). In order to compare predicted values with real ones, we have waited 2.5 days (from 00:01 on 23/June/2017 to 12:00 on
25/June/2017, equal to a count of other 720 measured data). A good data matching is observed in
the result of Fig. 6, thus validating of the neural networks predictive model. We observe that the initial oscillation may be due to the initial calculation error which is successively attenuated. The predictive maintenance should be obtained in this case by predicting long term efficiency of PV panels, and by correlating other predicted data such as meteorological data. Data post-processing can be applied also to radiometric data of thermal images. In Fig. 7 we shows an example of measured thermal defect points by using the line measurement approach in Flir Tools software: measured temperature are extracted from the written line crossing the defect point, and successively measurement data are plotted from the exported csv file. We indicates in Table 3 some defect characterization useful for monitoring of PV panel efficiency and for predictive maintenance (modification of standard maintenance planning). Concerning wind turbine defect detection, thermography could provide information about abnormal overheating thus predicting breakages. Wind turbines infact incorporate different electrical and mechanical components which can break down, generating costly downtime and dangerous accidents. Inspections with thermal imaging cameras can help prevent such accidents. Both for electrical and mechanical components the general rule is that a component will become hot before it fails. Thermography can be used to spot this rise in temperature before a failure occurs (hot spot detection of

International Journal of Artificial Intelligence and Applications (IJAIA), Vol.9, No.2, March 2018
9
transformers, connectors, controllers yaw motors etc.). Another data post-processing process able to facilitate the prediction of anomalies for electrical devices is data mining clustering. Specifically the application of K-Means algorithm [30] provides clustering of radiometric values. In Fig. 8 we illustrate the clustering calculation of measurements of a selection box embedding power supplies. For this result we have adopted the KNIME K-Means module: the three clusters (K=3) are characterized by increasing temperatures (cluster 0 = lower temperatures, cluster 1 = average temperatures, cluster 2 = higher temperatures). The increase of measurements of cluster 2 dataset could mean a damage risk.
Table 3. PV panels: Defects detect by thermal images.
Error type Example Image representation
Production defect Impurity and gas inclusion Hot/could defect points
Cracks in cells Heating of cells with a predominantly elongated
shape
Damages Cracks Heating of cells with a predominantly elongated
shape Cracks in cells a part of the cell looks
warmer
Temporary darkening Pollution Hot defect points
Bird excrements Humidity
Defective bypass diode Short circuit and reduced circuit protections
Patchwork conformation
Failed interconnections Modules or series of modules not connected
Module or series of modules continuously
warmer
Figure 6. Times series forecasting neural network (MLP) simulation: comparison between predicted and
measured results. Inset: geolocation of the PV prototype demonstrator.

International Journal of Artificial Intelligence and Applications (IJAIA), Vol.9, No.2, March 2018
10
Figure 7. Defect point characterization. (a) Photo of PV panels of the prototype demonstrator. (b) MSX thermal image with a marker indicating a thermal defect point. (c) Thermal image of a selected PV panel
obtained by changing color scale. (d) Thermal image of the region surrounding the defect point crossed by the calculus line Li1 (A and B indicate the line extremes). (e) Data plotting of extracted csv file of the
radiometric measurements related to line plot.

International Journal of Artificial Intelligence and Applications (IJAIA), Vol.9, No.2, March 2018
11
Figure 8. (a) Box selection of thermal image of power supplies of an electrical cabinet. (b) data mining workflow implementing KNIME K-Means algorithm reading the exported csv file of the box selection (Flir
Tools data exporting). (c) Box plot of box selection measurements. (d) Scattering plot of measurements grouped in clusters (plot of column values of Fig. 8 (c)).
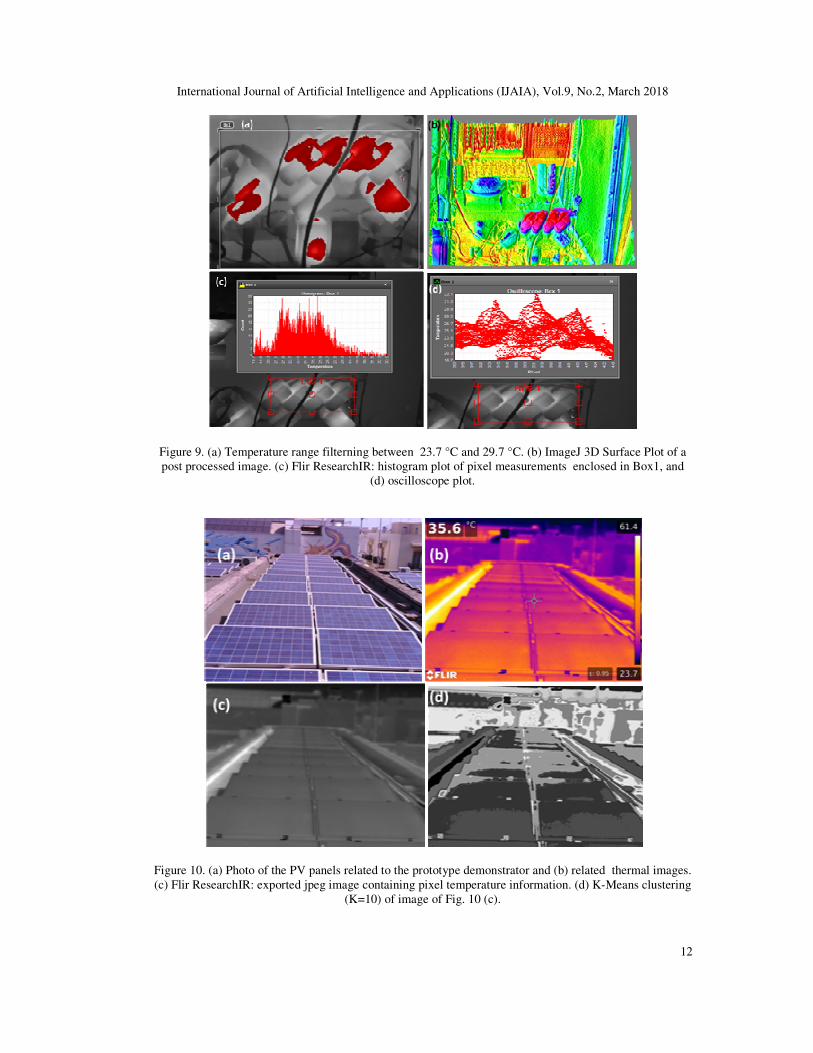
In Fig. 9 (a) is shown a group of power supplies image post-processed by setting a filter temperature range: this function highlights the regions where the temperature is between a temperature range thus analyzing temperature coupling. The 3D image processed Fig. 9 (b) highlights the pixel intensity information by observing the whole thermal environment of the electrical cabinet. This processing could be adopted for training by AR technology (case 4). In Fig. 9 (c) and Fig. 9 (d) are illustrated other measurements plotted by Flir ResearchIR software. In Fig. 10 is illustrated in succession the post processing of a thermal image by means of K-Means clustering [31] (ImageJ processing with K=10). This tool is a part of the trainable Weka segmentation of ImageJ plugin that combines a collection of machine learning algorithms with a set of selected image features to produce pixel-based segmentations. From Fig. 10 (d) it is possible to observe an irregular heating for the panels located on middle and on the top right of the detected row of photovoltaic panels. This could explain an inefficiency and suggest to reformulate the maintenance planning. In table 4 are indicated the calculated centroid values and the numerical errors related to the different calculus iteration of the K-Means processing (the error decrease with the iteration number until value 0 related to the 12 th. iteration). The ImageJ K-Means algorithm has been executed in about 2 second using a Intel core i3-403OU. 1.9GHz PC CPU.
International Journal of Artificial Intelligence and Applications (IJAIA), Vol.9, No.2, March 2018
12
Figure 9. (a) Temperature range filterning between 23.7 °C and 29.7 °C. (b) ImageJ 3D Surface Plot of a post processed image. (c) Flir ResearchIR: histogram plot of pixel measurements enclosed in Box1, and
(d) oscilloscope plot.
Figure 10. (a) Photo of the PV panels related to the prototype demonstrator and (b) related thermal images. (c) Flir ResearchIR: exported jpeg image containing pixel temperature information. (d) K-Means clustering
(K=10) of image of Fig. 10 (c).

International Journal of Artificial Intelligence and Applications (IJAIA), Vol.9, No.2, March 2018
13
Table 4. Image J: K-Means image clustering results (It: iteration).
Cluster Centroid
Value
(it. 12)
Initial
Cluster
(it. 0)
It. 1 It. 2 It. 3 It. 4 It. 5 It. 6 It. 7 It. 8 It. 9 It. 10 It. 11
0 213.15 188 197.11 201.31 204.58 206.25 207.85 209.59 210.47 211.35 212.25 213.15 213.15
1 18.83 6 10.38 13.40 15.52 16.40 17.19 17.99 17.99 18.83 18.83 18.83 18.83
2 89.84 86 88.53 88.93 88.93 89.43 89.84 89.84 89.84 89.84 89.84 89.84 89.84
3 100.12 100 98.94 99.01 99.07 99.90 99.95 100 100 100.05 100.05 100.05 100.12
4 152.74 137 139.41 142.73 145.31 147.35 148.64 149.98 150.42 151.35 151.78 152.21 152.73
5 58.35 57 58.22 58.22 58.22 58.22 58.22 58.35 58.35 58.35 58.35 58.35 58.35
6 79.43 79 78.61 78.83 78.83 78.83 79.43 79.43 79.43 79.43 79.43 79.43 79.43
7 41.27 40 39.49 39.49 39.49 39.49 40.17 40.61 41.27 41.27 41.27 41.27 41.27
8 28.67 25 25.27 25.76 26.39 26.74 27.46 27.85 28.20 28.67 28.67 28.67 28.67
9 66.42 68 66.86 66.43 66.42 66.42 66.42 66.42 66.42 66.42 66.42 66.42 66.42
Error 0 // 118.89 38.31 22.28 8.83 6.33 5.81 1.53 2.57 0.98 0.99 0.28
2.6. Algorithms for electrical load management based on power consumption
prediction
Cloud monitoring and control of electric loads represent an important topic for energy routing research. In Fig. 11 is illustrated an example of architecture oriented on fault tolerance (property that enables the electric system to continue operating properly in the event of the failure, where failure could mean that the total power overcomes a threshold). The smart building can be monitored in cloud by different sensors (for example transmitting in Message Queuing Telemetry Transport –MTTQ- or Advanced Message Queuing Protocol –AMQP- or other protocols [32]): by means of dashboards an external user can activate or deactivate electric loads predicting the total power behaviour. Different technologies could be implemented for the realization of electric boards connecting sensors measuring electric power. Raspberry PI and Arduino are used in research for smart home control [33], and are good candidates for programming fault tolerance intelligence. Industrial components such as Controllino [34] are compatible with Arduino technology and are versatile because can be installed directly on electrical cabinet and can be easily interfaced with cloud. We report in Fig. 12 and Fig.13 the criteria of load management by load lines, where segmented line indicates the measured electrical power and the red line indicates the threshold line having a defined slope. Each power variation during the time is characterized by a slope, if the predicted measurement of the total power (in this case one minute prediction indicated by the dashed line of Fig. 13 (a) is considered) overcomes the threshold line, will be deactivated a possible no priority load or groups of no priority loads for more accentuated predicted slope (selecting from a list containing priority levels of each loads). Figure 12 (b) exhibits the flowchart representing the load activation taking into account the priority order. Figure 13 (b) indicates the deactivation procedure by considering the over threshold of the total predicted (sum of power of each load which are classified by priority levels). The prediction is estimated by hypothesizing the same slope behaviour of the last minute.

International Journal of Artificial Intelligence and Applications (IJAIA), Vol.9, No.2, March 2018
14
Figure 11. Case Use 3: (a) schematic architecture of monitoring and control of power load switching; (b) scheme of a case of fault tolerance managed by DSS.
Smart building
Sensor 1 Sensor 2
MTTQAMQP
Energy Router
(Energy
Switching)
Sensor n
Dashboard (Decision Support System -DSS)
Cloud
Control/
processing and
actuation
Lp1 Lp2 Lpn
(a) (b)
Priority loads
No priority loads
L1 L2Ln
DSS
Threshold
Wh
Time
load
deactivation
Fault Tolerance Scheme

International Journal of Artificial Intelligence and Applications (IJAIA), Vol.9, No.2, March 2018
15
0
100
200
300
400
500
600
700
800
900
1000
0 1 2 3 4 5 6 7 8 9 10 11 12 13 14 15 16 17 18
Monitoring
Detected load Maximum load
Wh
minute
A(xC1,yC1)
B(xC2,yC2)
C(xmax1,ymax1)
D(xmax2,ymax2)
Transient Regime
Slope
Slope
Are all electric
loads active?
Sorting of non-active electric loads
in descending order of priority
diff= ymax2-yC2
Is list
empty?
Consider first electric
load from list
Available?Remove electric load
from list
No operation
diff>size_load
diff=diff-size_load
Electric load activation
Remove electric load
from list
Remove electric load
from list
No operation
YES NO
NO
YES
NO
YES
YES
NO
(a)
(b)
Figure 12. (a) Case of power load threshold estimation and definition of parameters related the case of load activation (total loads under threshold). (b) Flowchart of load activation.

International Journal of Artificial Intelligence and Applications (IJAIA), Vol.9, No.2, March 2018
16
0
100
200
300
400
500
600
700
800
900
1000
0 1 2 3 4 5 6 7 8 9 10 11 12 13 14 15 16 17 18
ymax2next-yC2next<0
Detected load Maximum load
E(xmax2next,ymax2next)
F(xC2next,yC2next)
D(xC2,yC2)
C(xmax2,ymax2)
B(xC1,yC1)
A(xmax1,ymax1)
Wh
minute
Transient Regime
Slope
(a)
ymax2-yC2>0
Sorting of non-active loads in
increasing order of priority
Is list
empty?
Consider first electric
load from list
diff<0
No operation
abs>size_lo
ad
diff=diff-size_load
Electric load
deactivation
Remove electric load
from list
Remove electric load
from list
Low priority electric load
deactivation
YES NO
NO
YES
YES
NO
yC2next and ymax2next estimation
diff=ymax2next -yC2next
abs=|diff|
diff=0
No operationElectric load
deactivation
YES NO
NO YES
(b)
Figure 13. (a) Case of power load threshold estimation and definition of parameters related the case of load deactivation (total loads over threshold). (b) Flowchart of load deactivation.
3. INTERNATIONAL STANDARDS International standards are standards studied and developed by international standards organizations. International standards are references for consideration and use worldwide in different applications. The main organization is the International Organization for Standardization (ISO). International standards in wind and solar energy generation are nowadays driving all the

International Journal of Artificial Intelligence and Applications (IJAIA), Vol.9, No.2, March 2018
17
most relevant aspects in engineering and construction of RES energy facilities. Standards and Conformity Assessment issued by International bodies and Institutions (IEC, ISO) provide solid bases for development of this sector with regard to site suitability and resource assessment, design, engineering, modeling, measurement, test, operation and maintenance. Following some of the most relevant standards in solar and wind:
• S+ IEC/TS 61836 Ed. 3.0 en:2016 (Redline version): solar photovoltaic energy systems - Terms, definitions and symbols;
• IEC 60904-3 Ed. 3.0 b:2016: Photovoltaic devices - Part 3, measurement principles for terrestrial photovoltaic (PV) solar devices with reference spectral irradiance data;
• ISO 9847:1992: Solar energy - Calibration of field pyranometers by comparison to a reference pyranometer;
• IEC/TS 62727 Ed. 1.0 en:2012: Photovoltaic systems, specification for solar trackers;
• IEC 60050-415 Ed. 1.0 b:1999: International Electrotechnical Vocabulary - Part 415: Wind turbine generator systems;
• ISO 12494:2017: Atmospheric icing of structures;
• ANSI/AGMA/AWEA 6006-A03 (R2016): design and specification of gearboxes for wind turbines;
• IEC 60076-16 Ed. 1.0 b:2011: power transformers - Part 16: Transformers for wind turbine applications;
• AS 4959-2010: Acoustics - Measurement, prediction and assessment of noise from wind turbine generators (FOREIGN STANDARD), sets out a method for the measurement, prediction and assessment of noise from wind turbine generators;
• BS EN 50308:2004: wind turbines; protective measures; requirements for design, operation and maintenance (British Standard);
• IEC 61400-1 Ed. 3.0 b:2005: wind turbines- Part 1, design requirements;
• IEC 61400-2 Ed. 3.0 b:2013: wind turbines -Part 2, small wind turbines;
• IEC 61400-3 Ed. 1.0 b:2009: wind turbines - Part 3, design requirements for offshore wind turbines;
• IEC 61400-4 Ed. 1.0 en:2012: wind turbines - Part 4, design requirements for wind turbine gearboxe;
• IEC 61400-21 Ed. 2.0 b:2008: wind turbines - Part 21, measurement and assessment of power quality characteristics of grid connected wind turbines
• IEC 61400-23 Ed. 1.0 en:2014: wind turbines - Part 23, full-scale structural testing of rotor blades.
• Concerning thermography we list below some useful international standards:
• ISO 9712 – Third edition – 2005 “Non-destructive testing – Qualification and certification of personnel”;
• ISO 18436-1 (2012) “Condition monitoring and diagnostics of machines - Requirements for qualification and assessment of personnel - Part 1: Requirements for assessment bodies and the assessment process”;
• ISO 18436-3 (2012) “Condition monitoring and diagnostics of machines - Requirements for qualification and assessment of personnel - Part 3: Requirements for training bodies and the training process”;
• ISO 18436-7 (2014) “Condition monitoring and diagnostics of machines - Requirements for qualification and assessment of personnel - Part 7: Thermography”;
• ISO 18434-1:2008 Condition monitoring and diagnostics of machines –Thermography- Part 1: General procedures.
• ISO 6781:1983 Thermal insulation—Qualitative detection of thermal irregularities in building envelopes—Infrared method.
International Journal of Artificial Intelligence and Applications (IJAIA), Vol.9, No.2, March 2018
18
• EN 13187 Thermal performance of buildings. Qualitative detection of thermal irregularities in building envelopes. Infrared method.
• DIN 54190-1 Zerstörungsfreie Prüfung—Thermografische Prüfung—Teil 1: Allgemeine Grundlagen.
• DIN 54190-2 Non-destructive testing—Thermographic testing—Part 2: Equipment.
• DIN 54190-3 Zerstörungsfreie Prüfung—Thermografische Prüfung—Teil 3: Begriffe.
• DIN 54191 Zerstörungsfreie Prüfung—Thermografische Prüfung elektrischer Anlagen.
• DIN 54192 Zerstörungsfreie Prüfung—Aktive Thermografie.
• VdS 2858en Thermography in electrical installations, a contribute to loss prevention and operational reliability.
• ASTM E1934-99a (2014) Standard guide for examining electrical and mechanical equipment with infrared thermography.
• CAN/CGSB 149-GP-2MP: Manual for Thermographic Analysis of Building Enclosures;
• ASTM C1060: Standard Practice for Thermographic Inspection of Insulation Installations in Envelope Cavities of Frame Buildings;
• ASTM E1186: Standard Practice for Air Leakage Site Detection in Building Envelopes and Air Barrier Systems;
• ASTM C1153: Standard Practice for Locating of Wet Insulation in Roofing System Using Infrared Imaging;
• ASTM E1316: Terminology for Non Destructive Examinations;
• ASTM E1213: Standard Test Methods for Minimum Resolvable Difference for Thermal Imaging System;
• ASTM E1311: Standard Test Methods for Minimum Detectable Temperature Difference for Thermal Imaging System;
• ASTM E1862: Standard Test Methods for Measuring and Compensating for Reflected Temperature Using Infrared Imaging Radiometers;
• ASTM E1897: Measuring and Compensating for Transmittance and Using Infrared Imaging Radiometers;
• ASTM E1933: Standard Test Method for Measuring and Compensating for Emissivity Using Infrared Imaging Radiometers;
• ASTM D4788: Standard Test Method for Detecting Delaminations in Bridge Decks Using Infrared Thermography;
• Canada NMS Section 022713-2008: Thermographic Assessment: Building Envelope;
• Canada NMS Section 022719-2008: Thermographic Assessment: Mechanical Equipment;
• Canada NMS Section 022723-2008: Thermographic Assessment: Electrical Systems.
4. CONCLUSION The goal of the proposed paper is to describe the use of possible software and hardware technologies enabling intelligent design, installation, monitoring and management of energy router building equipements. All the proposed results are described in order to suggest some uses of the proposed facilities the and to facilitate technology transfer. The discussed facilities are related to IR Thermography, AR, image processing, load management and data mining. Al the proposed technologies are oriented on Building Information Modeling and predictive maintenance.

International Journal of Artificial Intelligence and Applications (IJAIA), Vol.9, No.2, March 2018
19
ACKNOWLEDGEMENTS The work has been developed in the frameworks of the Italian projects: “Energy Router e Strumenti di Controllo Cloud per Smart Grid [Energy Router and Cloud-based control tools for Smart Grids]”. The authors would like to thank the team of Garofoli S.p.A., EMI s.r.l. and of Ginex Gaetano s.r.l. for their effort about requirements and study of the topics proposed in this paper.
REFERENCES [1] Bari, A., Saad, W. & Jaekel, A. (2014) “Challenges in the smart grid applications: an overview”,
International Journal of Distributed Sensor Networks, Vol. 2014, No. 974682, pp1-11. [2] Ahmed, S., Lee, D. Y., Hyun, S. H, & Koo, I. (2017) “A Cognitive Radio-Based Energy-Efficient
System for Power Transmission Line Monitoring in Smart Grids”, Journal of Sensors, Vol. 2017, No. 3862375, pp1-12.
[3] Hartono, BS., Mursid, P., & Prajogo, S. (2017) “Review: Home energy management system in a Smart Grid scheme to improve reliability of power systems”, IOP Conf. Series: Earth and
Environmental Science, Vol. 105, No. 012081, pp1-9. [4] Miceli, R., (2013) “Energy management and smart grids”, Energies, Vol. 6, pp2262-2290. [5] Abderrezek, M. & Fathi, M. (2017) “Experimental study of the dust effect on photovoltaic panels’
Energy Yield”, Solar Energy, Vol. 142, pp308-320. [6] Xie, C. (2012) “Interactive heat transfer simulations for everyone”, The Physics Teacher, Vol. 50,
No. 4, pp237-240. [7] http://energy.concord.org/energy2d/ [8] Xie, C., (2015) “Visual Process Analytics”, Concord, Vol. 19, No. 2, pp1-3. [9] Xie, C., (2017) “Artificial Intelligence research for engineering design”, Concord, Vol. 21, No. 1,
pp1-3. [10] Xie, C., Zhang, Z, Nourian, S., Pallant, A. & Hazzard, E. (2014) “Time series analysis method for
assessing engineering design processes using a CAD Tool”, International Journal of Engineering
Education, Vol. 30, No. 1, pp218-230. [11] Xie, C., Zhang, Z, Nourian, S., Pallant, A. & Bailey, S. (2014) “On the instructional sensitivity of
CAD logs”, International Journal of Engineering Education, Vol. 30, No. 4, pp760-778. [12] http://energy.concord.org/energy3d/ [13] Galiano, A., Massaro, A., Barbuzzi, D. & Birardi, V. (2016) “Heat monitoring plan in building for
energy efficiency using thermal imaging analysis”, Journal of Next Generation Information
Technology (JNIT), Vol. 7, No. 4, pp8-18. [14] Irfan, U., Fan, Y., Rehanullah, K., Ling, L., Haisheng, Y. & Bing, G. (2017) “Predictive
Maintenance of Power Substation Equipment by Infrared Thermography Using a Machine-Learning Approach”, Energies, Vol. 10, No. 1987, pp1-13.
[15] Yudi Nugraha Bahar, Landrieu, J., Pere, C. & Nicolle, C. (2014) “CAD Data Workflow toward the Thermal Simulation and Visualization in Virtual Reality”, International Journal on Interactive
Design and Manufacturing (IJIDeM), Vol. 8, No. 2, pp283-292. [16] Yudi Nugraha Bahar, Landrieu, J., Pere, C. & Nicolle, C. (2014) “Simulation and Visualization of
Thermal Metaphors in a Virtual Environment for Thermal Building Assessment”, International
Journal of Technology (IJTech), Vol. 5, No. 1, pp3-13. [17] Yudi Nugraha Bahar, Landrieu, J., Pere, C. & Nicolle, C. (2013) “Thermal Simulation Tool for
Building and its Interoperability through Building Information Modeling (BIM) Platform”, Buildings, Vol. 3, No. 3, pp380-398.
[18] Wimmer, H., & Powell, L. M. (2016) “A Comparison of Open Source Tools for Data Science”, Journal of Information Systems Applied Research, Vol. 9, No. 2, pp4-12.
[19] Al-Khoder, A., & Harmouch, H. (2015) “Evaluating four of the most popular Open Source and Free Data Mining Tools”, IJASR International Journal of Academic Scientific Research, Vol. 3, No. 1, pp13-23.
[20] Abràmoff, M. D., Magallhas, P. J. & Ram, S. J. (2004) “Image processing with ImageJ,” Biophotonics International, Vol. 11, No. 7, pp36-42.

International Journal of Artificial Intelligence and Applications (IJAIA), Vol.9, No.2, March 2018
20
[21] Cicala, G., Massaro, A., Velardi L., Senesi, G. S. & Valentini, A. (2014) “Self-assembled pillar-like structures in nanodiamond layers by pulsed spray technique”, ACS Applied Materials &
Interfaces, Vol. 6, No. 23, pp21101-21109. [22] Huang, R., Low, S. H. & Chandy, K. M. (2011) “Optimal design of hybrid energy system with
PV/wind turbine/ storage: a case study”, Proceeding of IEEE International Conference on Smart
Grid Communications, pp.511-516. [23] Usametiaga, R., Venegas P., Guerediaga, J., Vega, L., Molleda, J. & Bulnes, F. G. (2014)
“Infrared thermography for temperature measurement and non-destructive testing”, Sensors,Vol. 14, pp.12305-12348.
[24] “Unity Engine Platform: Unity 2017.3” 2018. [Online]. Available: https://unity3d.com [25] “Vuforia is the leading AR platform. Here’s why.” 2018. [Online]. Available:
https://www.vuforia.com [26] “Glassup F4, applications, design, added value, case studies, technical sheet” 2018. [Online].
Available: http://www.glassup.com/f4/ [27] “ABB e-Design” 2018. [Online]. Available: http://new.abb.com/low-voltage/support/software/e-
design/download [28] Kumar, R. & Balara P. (2014) “Time series forecasting of nifty stock market using Weka”, JRPS
International Journal for Research Publication & Seminar,Vol. 5, No. 2, pp1-6. [29] “SunGuard: photovoltaic plants monitoring ” 2018. [Online]. Available: http://www.sunguard.it/ [30] Siddharth, A., Parneet K. & Prachi A. (2013), “Economical maintenance and replacement decision
making in fleet management using data mining” Transactions on Computer Science Engineering
& its Applications (CSEA), Vol. 1, No. 2. [31] “IJ Plugins: k-means clustering” 2018. [Online]. Available: http://ij-
plugins.sourceforge.net/plugins/segmentation/k-means.html [32] Fuqaha, A. A., Guizani, M., Mohammadi, M., Aledhari M. & Ayyash, M. (2015), “Internet of
Things: a survey on enabling technologies, protocols, and applications” IEEE Communications
Surveys & Tutorials, Vol. 17, No. 4, pp2347-2376. [33] Hadwan, H., H., & Reddy Y. P. (2016), “Smart home control by using raspberry Pi & arduino
UNO” International Journal of Advanced Research in Computer and Communication
Engineering, Vol. 5, No. 4, pp283-288. [34] “Welcome to the world of CONTROLLINO!” 2018. [Online]. Available: https://controllino.biz/
Corresponding Author Alessandro Massaro: Research & Development Chief of Dyrecta Lab s.r.l.