International Journal of Advances in Engineering ... · International Journal of Advances in...
17
International Journal of Advances in Engineering & Technology, Aug., 2015. ©IJAET ISSN: 22311963 646 Vol. 8, Issue 4, pp. 646-662 MITIGATION OF CURRENT HARMONICS USING SHUNT ACTIVE POWER FILTER Khalid Jamal Shahid Khan and Sreeharsha Chunduri Department of Electrical Engineering, National Institute of Technology, Warangal, India ABSTRACT A study on the shunt active power filter is brought out in this paper in order to mitigate source current harmonics due to the increasing non-linear loads. The shunt active power filters provide dynamic compensation of current harmonics. The shunt active power filters have been developed based on control strategies like instantaneous active and reactive power compensation scheme (P-Q control) .The compensation is carried out by the use of hysteresis based controllers. P-Q control scheme is implemented in simulation work and its harmonic compensation results are analysed for a non-linear load like thyristor convertor. Then this compensation is carried on a practical welding load (non-linear load). Its current waveform is captured using a power quality analyser meter and modelled in MATLAB simulink and then compensation is done using shunt active power filter. KEYWORDS: Non-linear load, Mitigate, Shunt Active Power Filter, P-Q Control, Harmonics, Compensation. I. INTRODUCTION The increase of the nonlinear loads due to the proliferation of electronic equipment causes power quality in the power system to deteriorate. For example, solid-state conversion of AC power using diodes and thyristor is widely adopted to control a number of processes such as adjustable speed drives (ASD), furnaces, chemical processes such as electroplating etc., power supplies, welding, heating etc. These solid state converters are also used in power industries such as HVDC transmission systems, battery energy storage systems and interfacing renewably energy electricity generating. Some of these solid state controllers draw harmonic currents and reactive power from the supply network and behave as non-linear loads. Harmonic current drawn from a supply by the nonlinear load causes the distortion of the supply voltage wave format the point of common coupling (PCC) due to the source impedance. Both distorted current and voltage may cause end user equipment to malfunction, conductors to overheat and may reduce the efficiency and life expectancy of the equipment connected at the PCC. Classically, shunt passive filters, consist of tuned LC filters and/or high passive filters are used to suppress the harmonics and power capacitors are employed to improve the power factor. But they have the limitations of fixed compensation, large size and can also exile resonance conditions. Active power filters are now seen as a viable alternative over the classical passive filters, to compensate harmonics and reactive power requirement of the non-linear loads. The objective of the active filtering is to solve these problems by combining with a much-reduced rating of the necessary passive components. II. SIMULATION OF NON LINEAR LOAD The below simulation shows the simulation of DC Motor drive which has been performed in MATLAB
Transcript of International Journal of Advances in Engineering ... · International Journal of Advances in...

International Journal of Advances in Engineering & Technology, Aug., 2015.
©IJAET ISSN: 22311963
646 Vol. 8, Issue 4, pp. 646-662
MITIGATION OF CURRENT HARMONICS USING SHUNT
ACTIVE POWER FILTER
Khalid Jamal Shahid Khan and Sreeharsha Chunduri Department of Electrical Engineering,
National Institute of Technology, Warangal, India
ABSTRACT A study on the shunt active power filter is brought out in this paper in order to mitigate source current
harmonics due to the increasing non-linear loads. The shunt active power filters provide dynamic compensation
of current harmonics. The shunt active power filters have been developed based on control strategies like
instantaneous active and reactive power compensation scheme (P-Q control) .The compensation is carried out
by the use of hysteresis based controllers. P-Q control scheme is implemented in simulation work and its
harmonic compensation results are analysed for a non-linear load like thyristor convertor. Then this
compensation is carried on a practical welding load (non-linear load). Its current waveform is captured using a
power quality analyser meter and modelled in MATLAB simulink and then compensation is done using shunt
active power filter.
KEYWORDS: Non-linear load, Mitigate, Shunt Active Power Filter, P-Q Control, Harmonics, Compensation.
I. INTRODUCTION
The increase of the nonlinear loads due to the proliferation of electronic equipment causes power
quality in the power system to deteriorate. For example, solid-state conversion of AC power using
diodes and thyristor is widely adopted to control a number of processes such as adjustable speed
drives (ASD), furnaces, chemical processes such as electroplating etc., power supplies, welding,
heating etc. These solid state converters are also used in power industries such as HVDC transmission
systems, battery energy storage systems and interfacing renewably energy electricity generating.
Some of these solid state controllers draw harmonic currents and reactive power from the supply
network and behave as non-linear loads. Harmonic current drawn from a supply by the nonlinear load
causes the distortion of the supply voltage wave format the point of common coupling (PCC) due to
the source impedance. Both distorted current and voltage may cause end user equipment to
malfunction, conductors to overheat and may reduce the efficiency and life expectancy of the
equipment connected at the PCC. Classically, shunt passive filters, consist of tuned LC filters and/or high passive filters are used to suppress the harmonics and power capacitors are employed to improve
the power factor. But they have the limitations of fixed compensation, large size and can also exile
resonance conditions. Active power filters are now seen as a viable alternative over the classical
passive filters, to compensate harmonics and reactive power requirement of the non-linear loads. The
objective of the active filtering is to solve these problems by combining with a much-reduced rating
of the necessary passive components.
II. SIMULATION OF NON LINEAR LOAD
The below simulation shows the simulation of DC Motor drive which has been performed in
MATLAB
International Journal of Advances in Engineering & Technology, Aug., 2015.
©IJAET ISSN: 22311963
647 Vol. 8, Issue 4, pp. 646-662
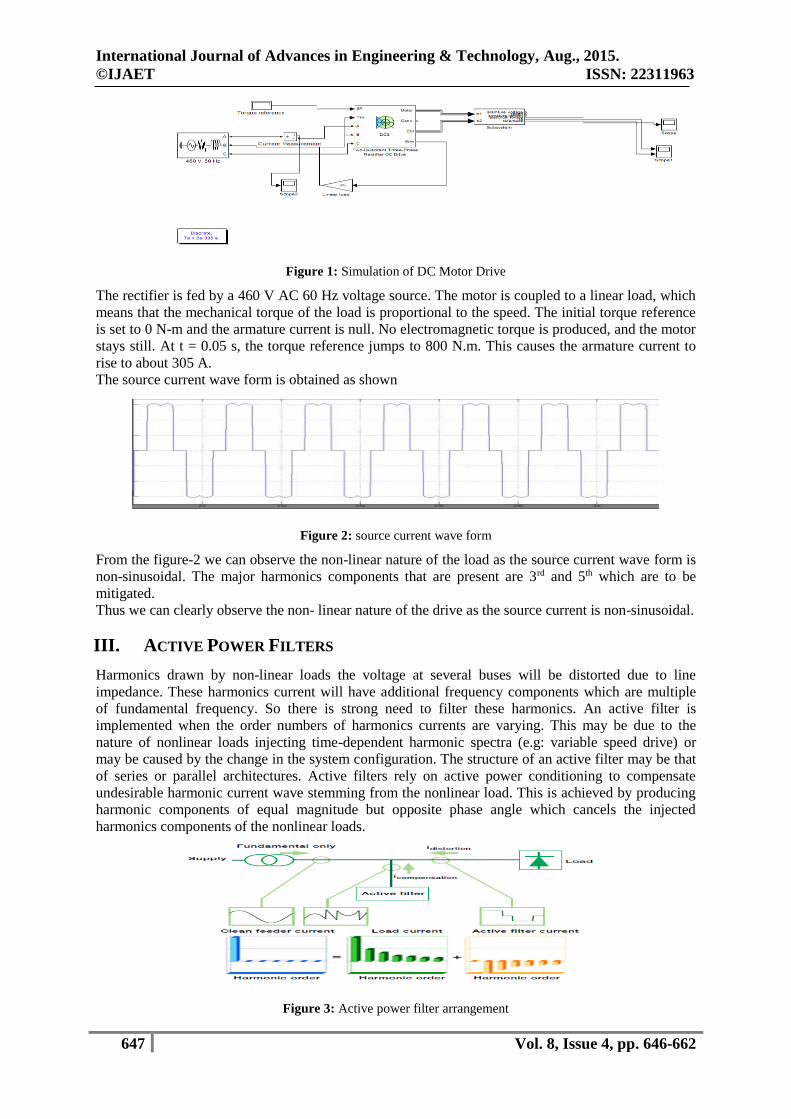
Figure 1: Simulation of DC Motor Drive
The rectifier is fed by a 460 V AC 60 Hz voltage source. The motor is coupled to a linear load, which
means that the mechanical torque of the load is proportional to the speed. The initial torque reference
is set to 0 N-m and the armature current is null. No electromagnetic torque is produced, and the motor
stays still. At t = 0.05 s, the torque reference jumps to 800 N.m. This causes the armature current to
rise to about 305 A.
The source current wave form is obtained as shown
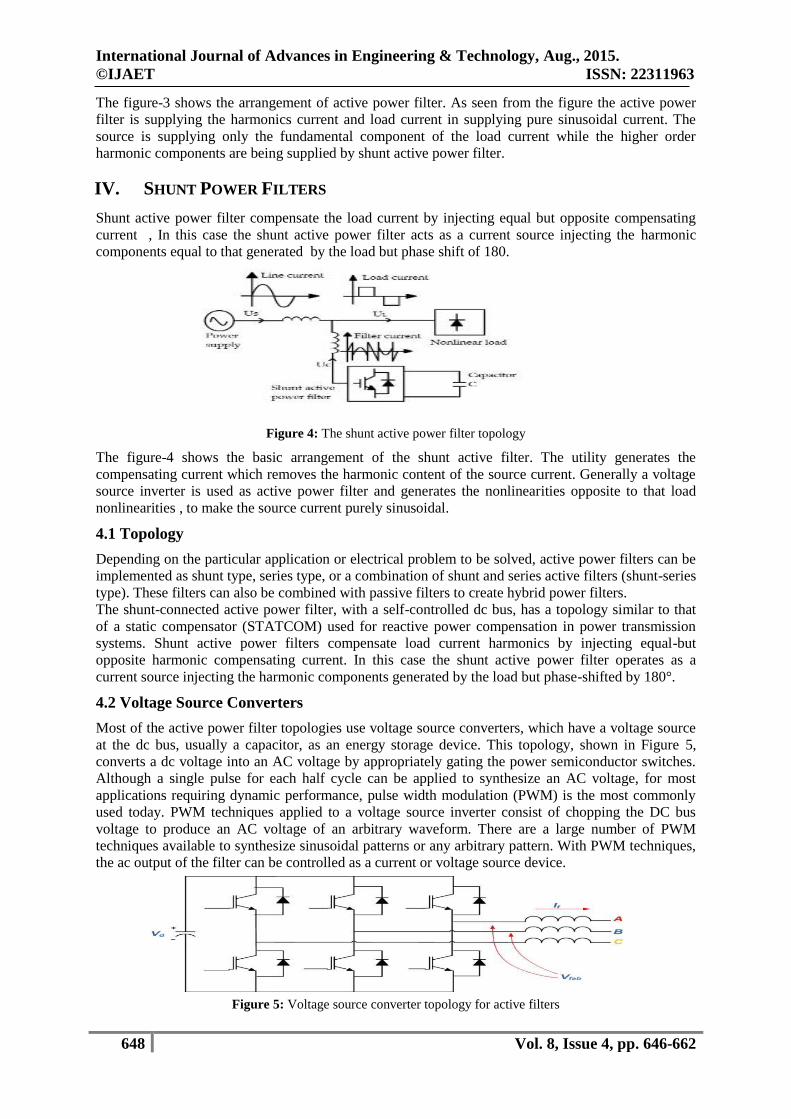
Figure 2: source current wave form
From the figure-2 we can observe the non-linear nature of the load as the source current wave form is
non-sinusoidal. The major harmonics components that are present are 3rd and 5th which are to be
mitigated.
Thus we can clearly observe the non- linear nature of the drive as the source current is non-sinusoidal.
III. ACTIVE POWER FILTERS
Harmonics drawn by non-linear loads the voltage at several buses will be distorted due to line
impedance. These harmonics current will have additional frequency components which are multiple
of fundamental frequency. So there is strong need to filter these harmonics. An active filter is
implemented when the order numbers of harmonics currents are varying. This may be due to the
nature of nonlinear loads injecting time-dependent harmonic spectra (e.g: variable speed drive) or
may be caused by the change in the system configuration. The structure of an active filter may be that
of series or parallel architectures. Active filters rely on active power conditioning to compensate
undesirable harmonic current wave stemming from the nonlinear load. This is achieved by producing
harmonic components of equal magnitude but opposite phase angle which cancels the injected
harmonics components of the nonlinear loads.
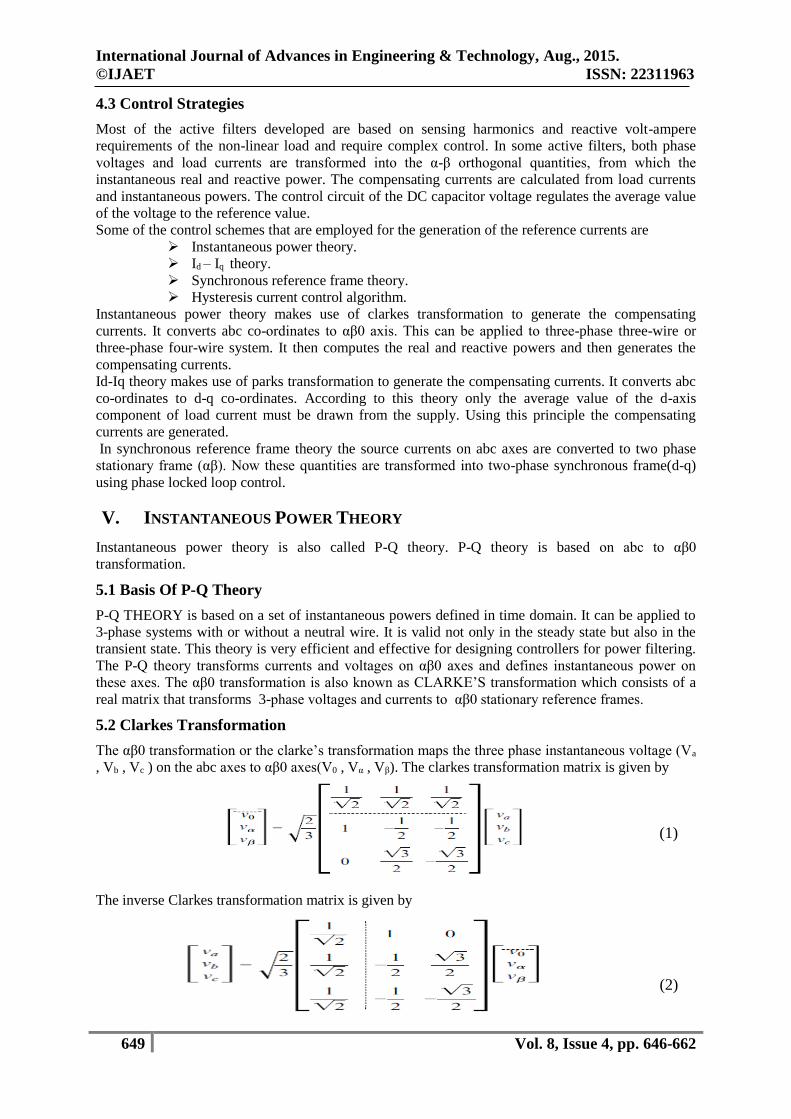
Figure 3: Active power filter arrangement
International Journal of Advances in Engineering & Technology, Aug., 2015.
©IJAET ISSN: 22311963
648 Vol. 8, Issue 4, pp. 646-662
The figure-3 shows the arrangement of active power filter. As seen from the figure the active power
filter is supplying the harmonics current and load current in supplying pure sinusoidal current. The
source is supplying only the fundamental component of the load current while the higher order
harmonic components are being supplied by shunt active power filter.
IV. SHUNT POWER FILTERS
Shunt active power filter compensate the load current by injecting equal but opposite compensating
current , In this case the shunt active power filter acts as a current source injecting the harmonic
components equal to that generated by the load but phase shift of 180.
Figure 4: The shunt active power filter topology
The figure-4 shows the basic arrangement of the shunt active filter. The utility generates the
compensating current which removes the harmonic content of the source current. Generally a voltage
source inverter is used as active power filter and generates the nonlinearities opposite to that load
nonlinearities , to make the source current purely sinusoidal.
4.1 Topology
Depending on the particular application or electrical problem to be solved, active power filters can be
implemented as shunt type, series type, or a combination of shunt and series active filters (shunt-series
type). These filters can also be combined with passive filters to create hybrid power filters.
The shunt-connected active power filter, with a self-controlled dc bus, has a topology similar to that
of a static compensator (STATCOM) used for reactive power compensation in power transmission
systems. Shunt active power filters compensate load current harmonics by injecting equal-but
opposite harmonic compensating current. In this case the shunt active power filter operates as a
current source injecting the harmonic components generated by the load but phase-shifted by 180°.
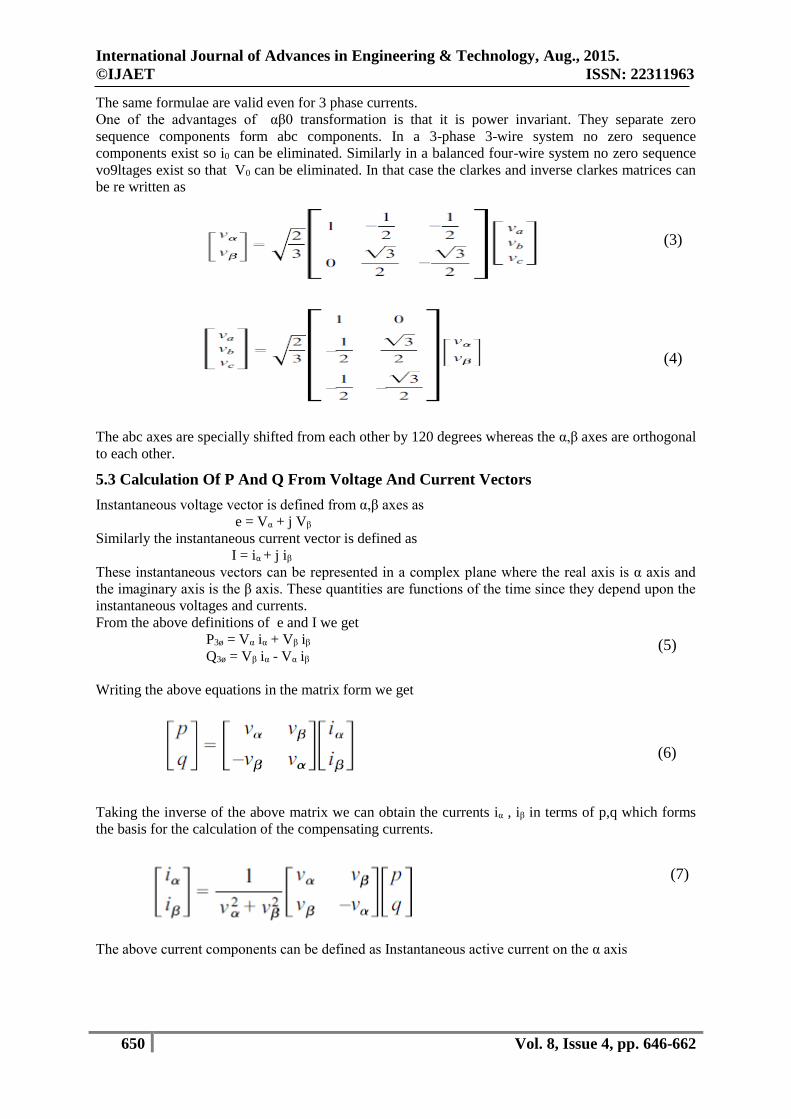
4.2 Voltage Source Converters
Most of the active power filter topologies use voltage source converters, which have a voltage source
at the dc bus, usually a capacitor, as an energy storage device. This topology, shown in Figure 5,
converts a dc voltage into an AC voltage by appropriately gating the power semiconductor switches.
Although a single pulse for each half cycle can be applied to synthesize an AC voltage, for most
applications requiring dynamic performance, pulse width modulation (PWM) is the most commonly
used today. PWM techniques applied to a voltage source inverter consist of chopping the DC bus
voltage to produce an AC voltage of an arbitrary waveform. There are a large number of PWM
techniques available to synthesize sinusoidal patterns or any arbitrary pattern. With PWM techniques,
the ac output of the filter can be controlled as a current or voltage source device.
Figure 5: Voltage source converter topology for active filters
International Journal of Advances in Engineering & Technology, Aug., 2015.
©IJAET ISSN: 22311963
649 Vol. 8, Issue 4, pp. 646-662
4.3 Control Strategies
Most of the active filters developed are based on sensing harmonics and reactive volt-ampere
requirements of the non-linear load and require complex control. In some active filters, both phase
voltages and load currents are transformed into the α-β orthogonal quantities, from which the
instantaneous real and reactive power. The compensating currents are calculated from load currents
and instantaneous powers. The control circuit of the DC capacitor voltage regulates the average value
of the voltage to the reference value.
Some of the control schemes that are employed for the generation of the reference currents are
Instantaneous power theory.
Id – Iq theory.
Synchronous reference frame theory.
Hysteresis current control algorithm.
Instantaneous power theory makes use of clarkes transformation to generate the compensating
currents. It converts abc co-ordinates to αβ0 axis. This can be applied to three-phase three-wire or
three-phase four-wire system. It then computes the real and reactive powers and then generates the
compensating currents.
Id-Iq theory makes use of parks transformation to generate the compensating currents. It converts abc
co-ordinates to d-q co-ordinates. According to this theory only the average value of the d-axis
component of load current must be drawn from the supply. Using this principle the compensating
currents are generated.
In synchronous reference frame theory the source currents on abc axes are converted to two phase
stationary frame (αβ). Now these quantities are transformed into two-phase synchronous frame(d-q)
using phase locked loop control.
V. INSTANTANEOUS POWER THEORY
Instantaneous power theory is also called P-Q theory. P-Q theory is based on abc to αβ0
transformation.
5.1 Basis Of P-Q Theory
P-Q THEORY is based on a set of instantaneous powers defined in time domain. It can be applied to
3-phase systems with or without a neutral wire. It is valid not only in the steady state but also in the
transient state. This theory is very efficient and effective for designing controllers for power filtering.
The P-Q theory transforms currents and voltages on αβ0 axes and defines instantaneous power on
these axes. The αβ0 transformation is also known as CLARKE’S transformation which consists of a
real matrix that transforms 3-phase voltages and currents to αβ0 stationary reference frames.
5.2 Clarkes Transformation
The αβ0 transformation or the clarke’s transformation maps the three phase instantaneous voltage (Va
, Vb , Vc ) on the abc axes to αβ0 axes(V0 , Vα , Vβ). The clarkes transformation matrix is given by
The inverse Clarkes transformation matrix is given by
(1)
(2)
International Journal of Advances in Engineering & Technology, Aug., 2015.
©IJAET ISSN: 22311963
650 Vol. 8, Issue 4, pp. 646-662
The same formulae are valid even for 3 phase currents.
One of the advantages of αβ0 transformation is that it is power invariant. They separate zero
sequence components form abc components. In a 3-phase 3-wire system no zero sequence
components exist so i0 can be eliminated. Similarly in a balanced four-wire system no zero sequence
vo9ltages exist so that V0 can be eliminated. In that case the clarkes and inverse clarkes matrices can
be re written as
The abc axes are specially shifted from each other by 120 degrees whereas the α,β axes are orthogonal
to each other.
5.3 Calculation Of P And Q From Voltage And Current Vectors
Instantaneous voltage vector is defined from α,β axes as
e = Vα + j Vβ
Similarly the instantaneous current vector is defined as
I = iα + j iβ
These instantaneous vectors can be represented in a complex plane where the real axis is α axis and
the imaginary axis is the β axis. These quantities are functions of the time since they depend upon the
instantaneous voltages and currents.
From the above definitions of e and I we get
P3ø = Vα iα + Vβ iβ
Q3ø = Vβ iα - Vα iβ
Writing the above equations in the matrix form we get
Taking the inverse of the above matrix we can obtain the currents iα , iβ in terms of p,q which forms
the basis for the calculation of the compensating currents.
The above current components can be defined as Instantaneous active current on the α axis
(6)
(5)
(7)
(3)
(4)
International Journal of Advances in Engineering & Technology, Aug., 2015.
©IJAET ISSN: 22311963
651 Vol. 8, Issue 4, pp. 646-662
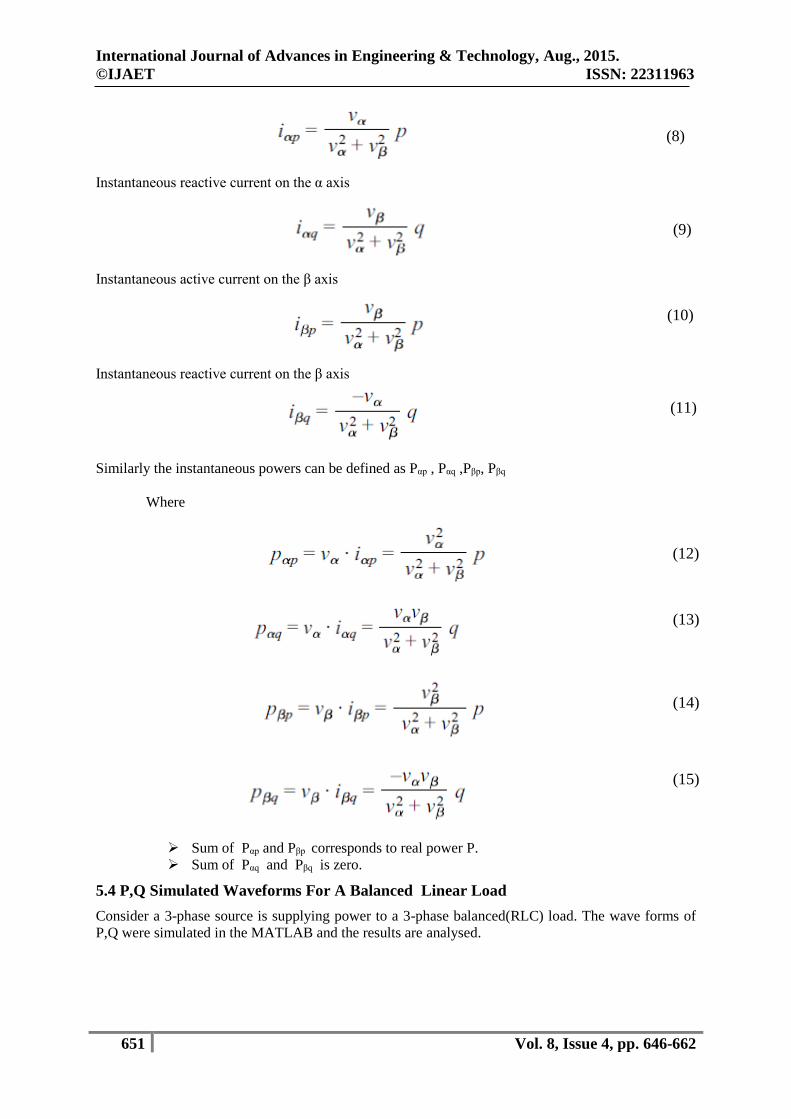
Instantaneous reactive current on the α axis
Instantaneous active current on the β axis
Instantaneous reactive current on the β axis
Similarly the instantaneous powers can be defined as Pαp , Pαq ,Pβp, Pβq
Where
Sum of Pαp and Pβp corresponds to real power P.
Sum of Pαq and Pβq is zero.
5.4 P,Q Simulated Waveforms For A Balanced Linear Load
Consider a 3-phase source is supplying power to a 3-phase balanced(RLC) load. The wave forms of
P,Q were simulated in the MATLAB and the results are analysed.
(8)
(9)
(10)
(11)
(12)
(13)
(14)
(15)
International Journal of Advances in Engineering & Technology, Aug., 2015.
©IJAET ISSN: 22311963
652 Vol. 8, Issue 4, pp. 646-662
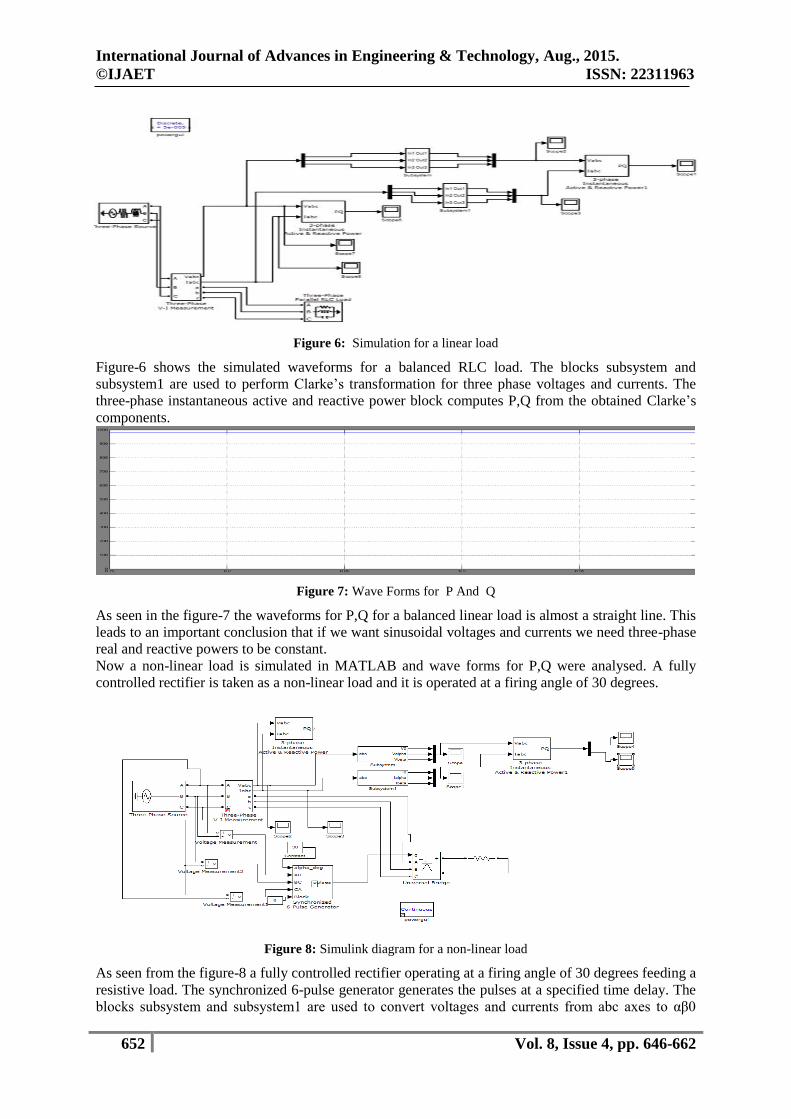
Figure 6: Simulation for a linear load
Figure-6 shows the simulated waveforms for a balanced RLC load. The blocks subsystem and
subsystem1 are used to perform Clarke’s transformation for three phase voltages and currents. The
three-phase instantaneous active and reactive power block computes P,Q from the obtained Clarke’s
components.
Figure 7: Wave Forms for P And Q
As seen in the figure-7 the waveforms for P,Q for a balanced linear load is almost a straight line. This
leads to an important conclusion that if we want sinusoidal voltages and currents we need three-phase
real and reactive powers to be constant.
Now a non-linear load is simulated in MATLAB and wave forms for P,Q were analysed. A fully
controlled rectifier is taken as a non-linear load and it is operated at a firing angle of 30 degrees.
Figure 8: Simulink diagram for a non-linear load
As seen from the figure-8 a fully controlled rectifier operating at a firing angle of 30 degrees feeding a
resistive load. The synchronized 6-pulse generator generates the pulses at a specified time delay. The
blocks subsystem and subsystem1 are used to convert voltages and currents from abc axes to αβ0

International Journal of Advances in Engineering & Technology, Aug., 2015.
©IJAET ISSN: 22311963
653 Vol. 8, Issue 4, pp. 646-662
axes. The 3-phase instantaneous active and reactive power block is used for measuring the wave
forms for P and Q.
Figure 9: Simulated Wave Form For P
From the figure-9 it can be observed that P waveform has DC component and also an oscillating
component. The oscillating component is responsible for production of harmonics
Figure 10: Simulated Waveform For Q
From the figure-10 it can be observed that similar to P even Q has both oscillating and DC
components which are responsible for production of harmonics.
From the above simulations we conclude the following:
For a linear load i.e. if voltage and currents are purely sinusoidal, the 3-phase active and
reactive powers are constant.
If the load is non-linear, P and Q wave forms will have an oscillating component in addition
to the DC component.
P = P̅ + P̃
Q = Q̅ + Q̃
P̃ and Q̃ are oscillating powers which are undesirable are due to the presence of harmonics. We need
to remove them for removing harmonics.
5.5 Use Of The P-Q Theory For Shunt Current Compensation
One important application of the p-q theory is the compensation of undesirable currents . If a source is
supplying a nonlinear load that is being compensated by a shunt compensator. The shunt
compensator behaves as a three phase controlled current source , that can draw any set of arbitrarily
chosen reference current . The figure-13 shows a general control method to be used in the controller
of a shunt compensator.
The calculated real and imaginary power of the load ( P and Q) can be separated into its average and
oscillating parts. The undesired portions of real and imaginary powers of the loads that should be
compensated as selected. The power to be compensated are represented by -Pc and –Qc .
International Journal of Advances in Engineering & Technology, Aug., 2015.
©IJAET ISSN: 22311963
654 Vol. 8, Issue 4, pp. 646-662
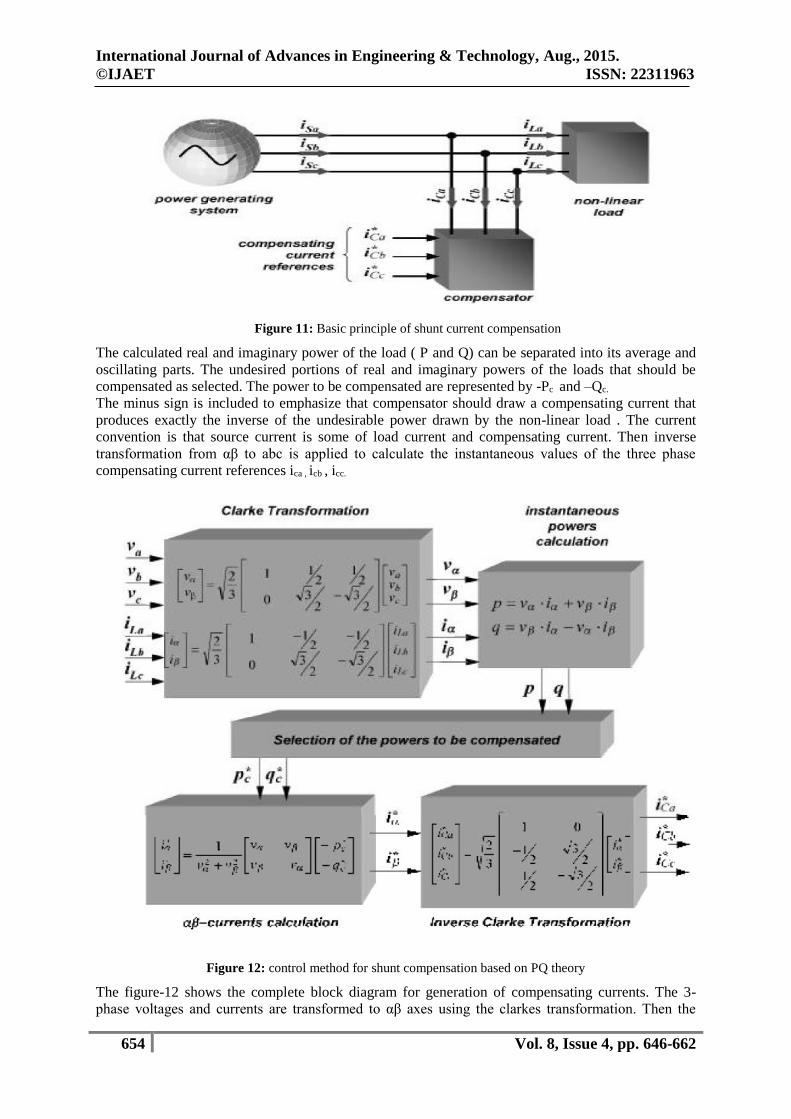
Figure 11: Basic principle of shunt current compensation
The calculated real and imaginary power of the load ( P and Q) can be separated into its average and
oscillating parts. The undesired portions of real and imaginary powers of the loads that should be
compensated as selected. The power to be compensated are represented by -Pc and –Qc.
The minus sign is included to emphasize that compensator should draw a compensating current that
produces exactly the inverse of the undesirable power drawn by the non-linear load . The current
convention is that source current is some of load current and compensating current. Then inverse
transformation from αβ to abc is applied to calculate the instantaneous values of the three phase
compensating current references ica , icb , icc.
Figure 12: control method for shunt compensation based on PQ theory
The figure-12 shows the complete block diagram for generation of compensating currents. The 3-
phase voltages and currents are transformed to αβ axes using the clarkes transformation. Then the
International Journal of Advances in Engineering & Technology, Aug., 2015.
©IJAET ISSN: 22311963
655 Vol. 8, Issue 4, pp. 646-662
instantaneous powers are calculated. Then the compensating powers are calculated. Then iα , iβ are
calculated.
After knowing them inverse Clarke transformation is performed and the compensating currents are
calculated(ica , icb , icc)
Shunt active filters generally consist of two main distinct blocks as shown in figure 13:
1- The PWM converter for power processing
2- The active filter controller for signal processing
Figure 13: Basic configuration of a shunt active filter
The PWM converter is responsible for drawing the compensating current. The active filter controller
is responsible for signal processing in determining the instantaneous compensating current references
which are continuously passed to the PWM converter. The figure shows the basic configuration of
shunt active power filter for harmonic current compensation.
The shunt active filter controller works in a closed loop manner, continuously sensing the load current
and calculating the instantaneous values of compensating current reference for PWM converter. The
PWM converter should have a high switching frequency to reproduce accurately the compensating
current. The PWM converter is a voltage source inverter which has a DC capacitor at the input and
IGBT with an anti-parallel diode.
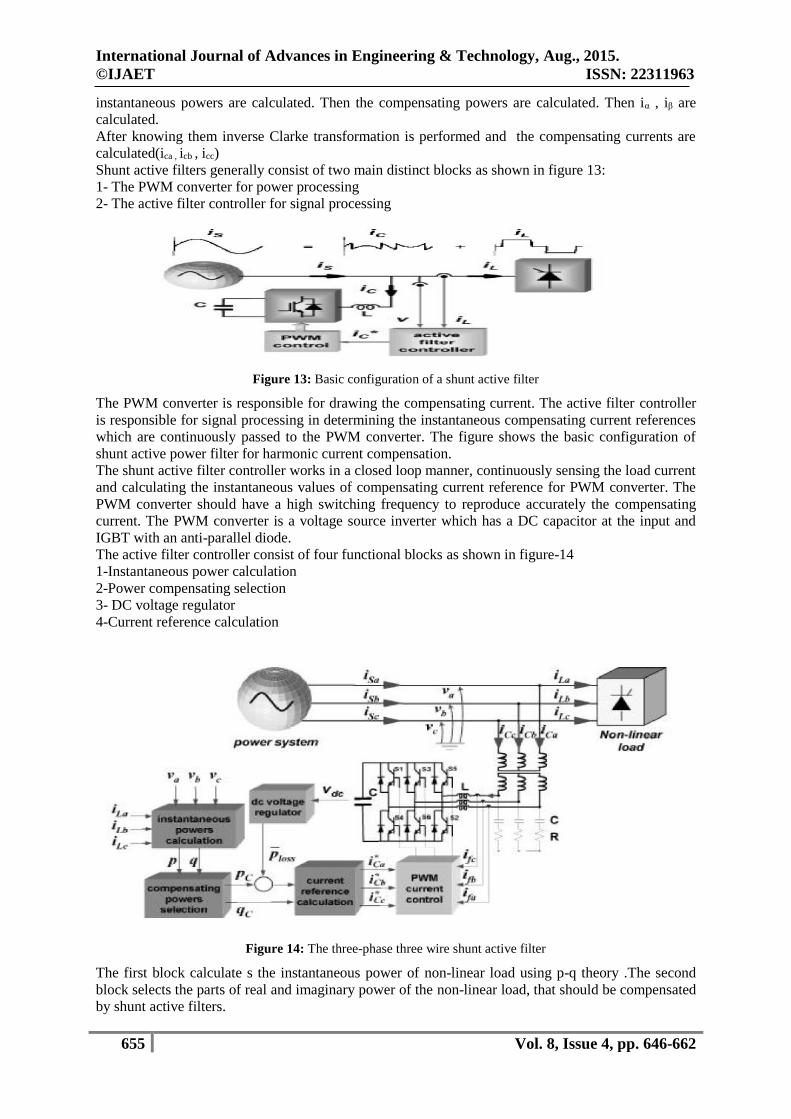
The active filter controller consist of four functional blocks as shown in figure-14
1-Instantaneous power calculation
2-Power compensating selection
3- DC voltage regulator
4-Current reference calculation
Figure 14: The three-phase three wire shunt active filter
The first block calculate s the instantaneous power of non-linear load using p-q theory .The second
block selects the parts of real and imaginary power of the non-linear load, that should be compensated
by shunt active filters.
International Journal of Advances in Engineering & Technology, Aug., 2015.
©IJAET ISSN: 22311963
656 Vol. 8, Issue 4, pp. 646-662
In a real implementation the separation of P̅ from P is realized through a low–pass filter. In practice
a fifth order Butterworth low pass filter with a cutoff frequency between 20 and 100Hz has been used
to separate P̅ from P.
The DC voltage regulator determines the amount of real power represented by Ploss that causes
additional flow of energy to dc capacitor in order to keep its voltage around a fixed reference value.
This real power Ploss is added to compensating real power Pc , together with the compensating
imaginary power Qc are passed to current reference calculation block .It determines the instantaneous
compensating current references from the compensating powers and voltages.
In order to avoid high di/dt , the VSC should be connected to the power system through a series
inductor .
5.6 Hysteresis Current Controller
This current controller decides the switching pattern in SHAPF. The switching logic is formulated as
If Imeasured > Ireference then upper switch is “OFF” and bottom switch is “ON” in the inverter leg
If Imeasured < Ireference then upper switch is “ON” and bottom switch is “OFF” in the inverter leg.
The same switching pattern is followed for all the 3 legs. Since the signals given to the 2 switches in a
same leg are complimentary there is no chance of dead short. If the top switch is “ON” the current
produced by the inverter increases since a positive voltage is applied. If the bottom switch is “ON”
then the current produced decreases as a negative voltage is applied. Here we get a hysteresis band
around the reference currents. In this fashion the generated currents by the inverter are regulated
within the hysteresis band of their respective reference values.
VI. SIMULATIONS AND RESULTS
A MATLAB SIMULINK model is developed to simulate SHAPF based on instantaneous power
theory. A fully controlled thyristor converter operating at a firing angle of 45 degrees feeding a
resistive load is taken as a non-linear load for the purpose of simulation. SYSTEM PARAMETERS VALUES
Source voltage(Line-Line) RMS 400V
Rs , Ls 0.01ohms, 1mH
System frequency 50 Hz
Filter inductance 1.2mH
DC link capacitance 40uF
DC link voltage 850V
Load(R-L) 7 ohms, 20mH
PI controller KP = 0.1 , KI = 1
Keeping the above parameters the simulation is performed.
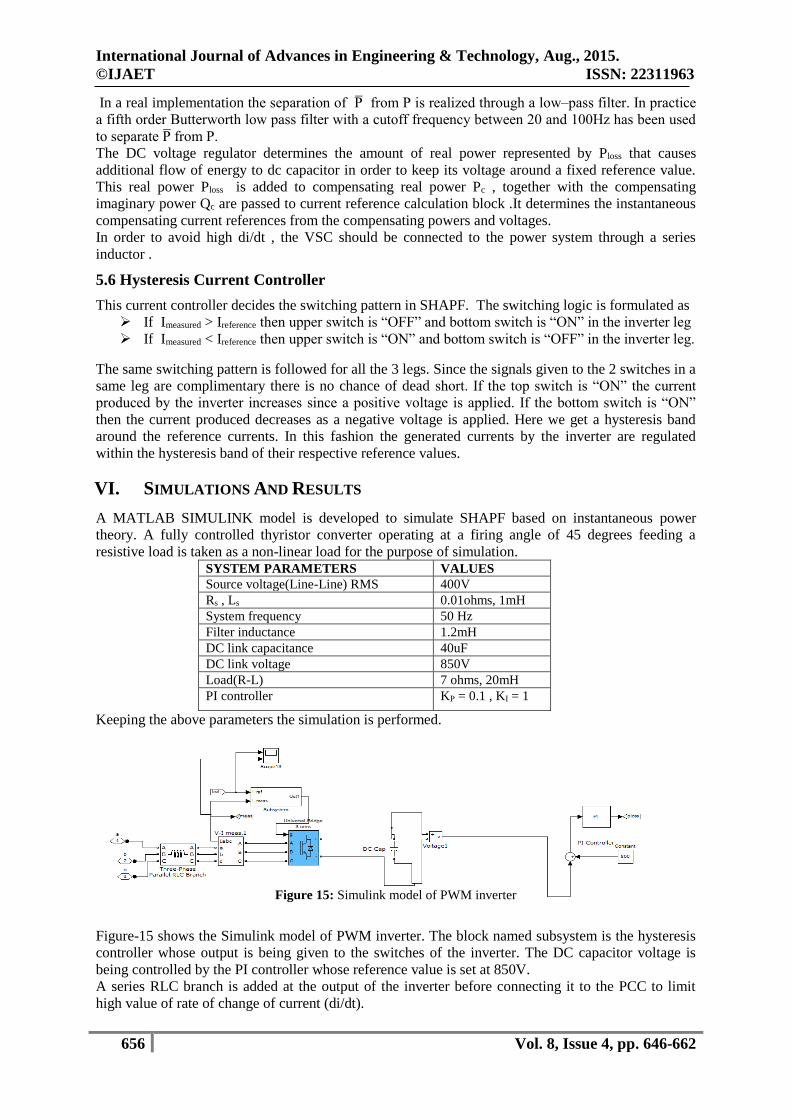
Figure 15: Simulink model of PWM inverter
Figure-15 shows the Simulink model of PWM inverter. The block named subsystem is the hysteresis
controller whose output is being given to the switches of the inverter. The DC capacitor voltage is
being controlled by the PI controller whose reference value is set at 850V.
A series RLC branch is added at the output of the inverter before connecting it to the PCC to limit
high value of rate of change of current (di/dt).
International Journal of Advances in Engineering & Technology, Aug., 2015.
©IJAET ISSN: 22311963
657 Vol. 8, Issue 4, pp. 646-662
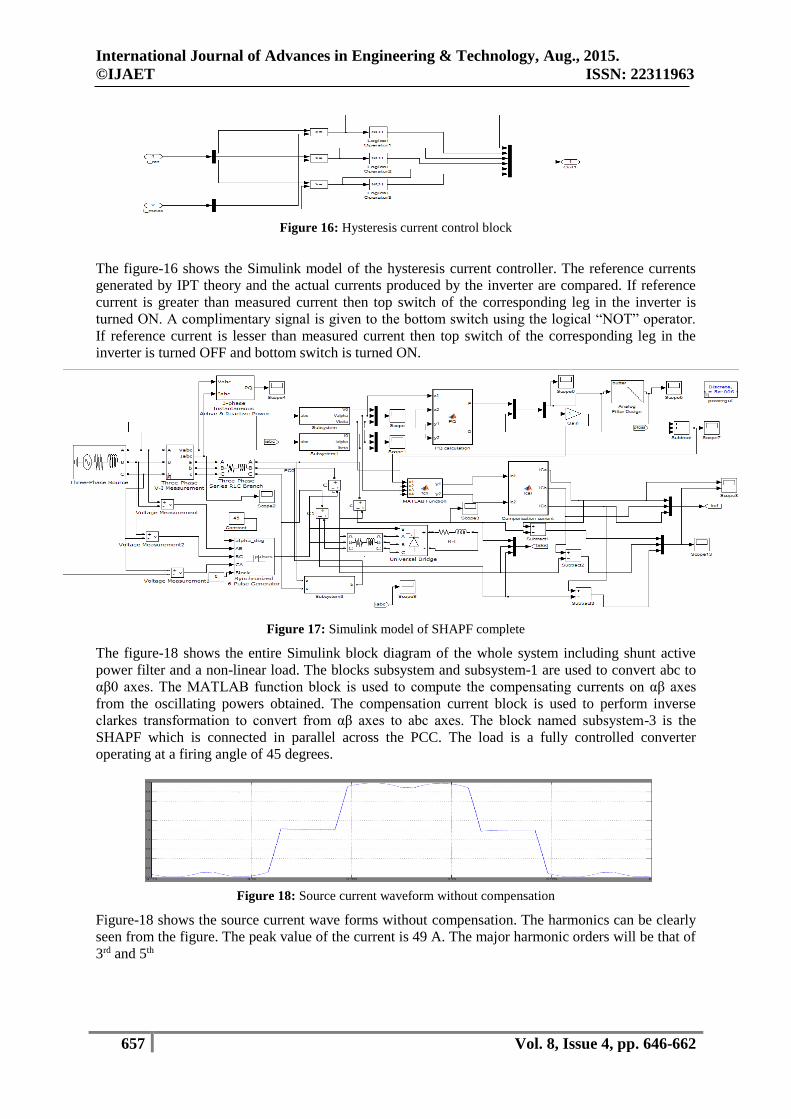
Figure 16: Hysteresis current control block
The figure-16 shows the Simulink model of the hysteresis current controller. The reference currents
generated by IPT theory and the actual currents produced by the inverter are compared. If reference
current is greater than measured current then top switch of the corresponding leg in the inverter is
turned ON. A complimentary signal is given to the bottom switch using the logical “NOT” operator.
If reference current is lesser than measured current then top switch of the corresponding leg in the
inverter is turned OFF and bottom switch is turned ON.
Figure 17: Simulink model of SHAPF complete
The figure-18 shows the entire Simulink block diagram of the whole system including shunt active
power filter and a non-linear load. The blocks subsystem and subsystem-1 are used to convert abc to
αβ0 axes. The MATLAB function block is used to compute the compensating currents on αβ axes
from the oscillating powers obtained. The compensation current block is used to perform inverse
clarkes transformation to convert from αβ axes to abc axes. The block named subsystem-3 is the
SHAPF which is connected in parallel across the PCC. The load is a fully controlled converter
operating at a firing angle of 45 degrees.
Figure 18: Source current waveform without compensation
Figure-18 shows the source current wave forms without compensation. The harmonics can be clearly
seen from the figure. The peak value of the current is 49 A. The major harmonic orders will be that of
3rd and 5th
International Journal of Advances in Engineering & Technology, Aug., 2015.
©IJAET ISSN: 22311963
658 Vol. 8, Issue 4, pp. 646-662
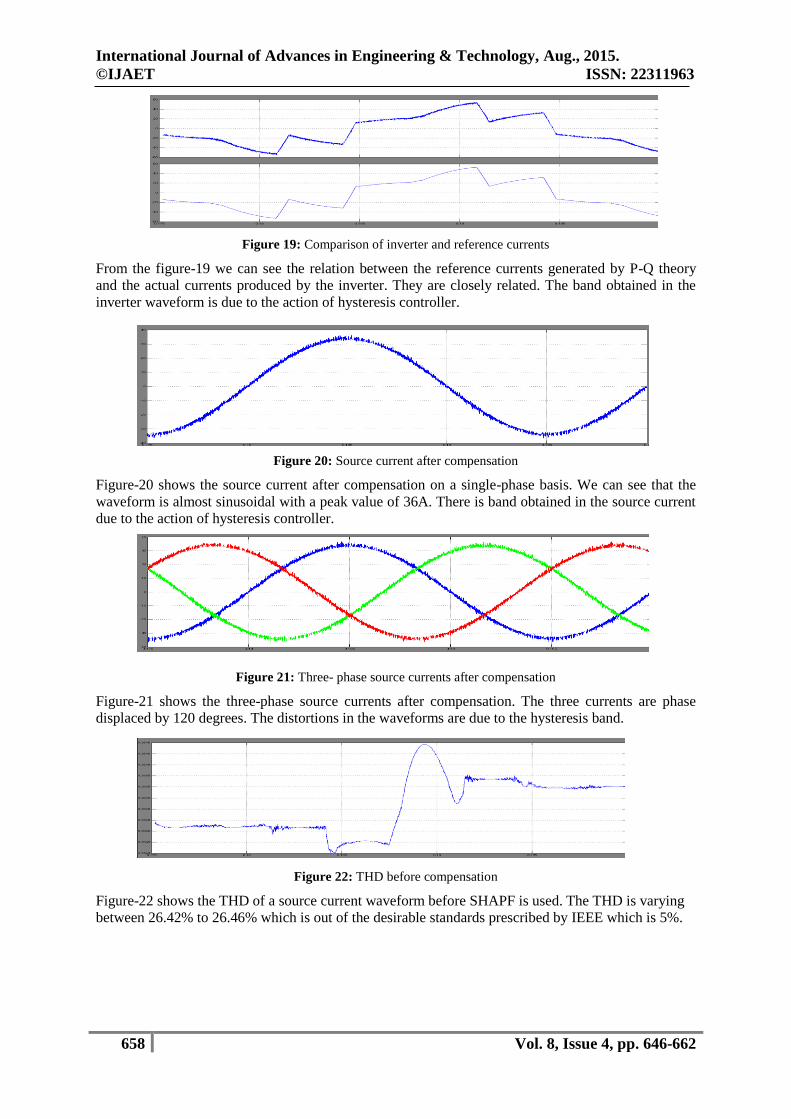
Figure 19: Comparison of inverter and reference currents
From the figure-19 we can see the relation between the reference currents generated by P-Q theory
and the actual currents produced by the inverter. They are closely related. The band obtained in the
inverter waveform is due to the action of hysteresis controller.
Figure 20: Source current after compensation
Figure-20 shows the source current after compensation on a single-phase basis. We can see that the
waveform is almost sinusoidal with a peak value of 36A. There is band obtained in the source current
due to the action of hysteresis controller.
Figure 21: Three- phase source currents after compensation
Figure-21 shows the three-phase source currents after compensation. The three currents are phase
displaced by 120 degrees. The distortions in the waveforms are due to the hysteresis band.
Figure 22: THD before compensation
Figure-22 shows the THD of a source current waveform before SHAPF is used. The THD is varying
between 26.42% to 26.46% which is out of the desirable standards prescribed by IEEE which is 5%.
International Journal of Advances in Engineering & Technology, Aug., 2015.
©IJAET ISSN: 22311963
659 Vol. 8, Issue 4, pp. 646-662
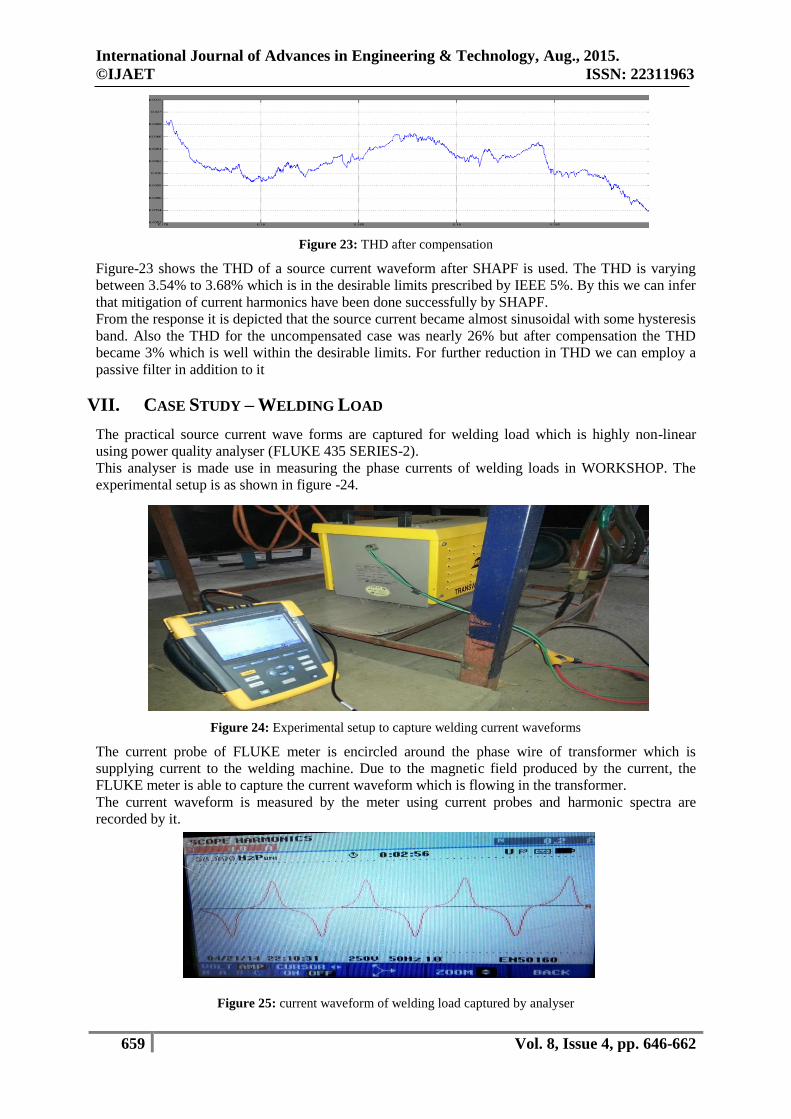
Figure 23: THD after compensation
Figure-23 shows the THD of a source current waveform after SHAPF is used. The THD is varying
between 3.54% to 3.68% which is in the desirable limits prescribed by IEEE 5%. By this we can infer
that mitigation of current harmonics have been done successfully by SHAPF.
From the response it is depicted that the source current became almost sinusoidal with some hysteresis
band. Also the THD for the uncompensated case was nearly 26% but after compensation the THD
became 3% which is well within the desirable limits. For further reduction in THD we can employ a
passive filter in addition to it
VII. CASE STUDY – WELDING LOAD
The practical source current wave forms are captured for welding load which is highly non-linear
using power quality analyser (FLUKE 435 SERIES-2).
This analyser is made use in measuring the phase currents of welding loads in WORKSHOP. The
experimental setup is as shown in figure -24.
Figure 24: Experimental setup to capture welding current waveforms
The current probe of FLUKE meter is encircled around the phase wire of transformer which is
supplying current to the welding machine. Due to the magnetic field produced by the current, the
FLUKE meter is able to capture the current waveform which is flowing in the transformer.
The current waveform is measured by the meter using current probes and harmonic spectra are
recorded by it.
Figure 25: current waveform of welding load captured by analyser
International Journal of Advances in Engineering & Technology, Aug., 2015.
©IJAET ISSN: 22311963
660 Vol. 8, Issue 4, pp. 646-662
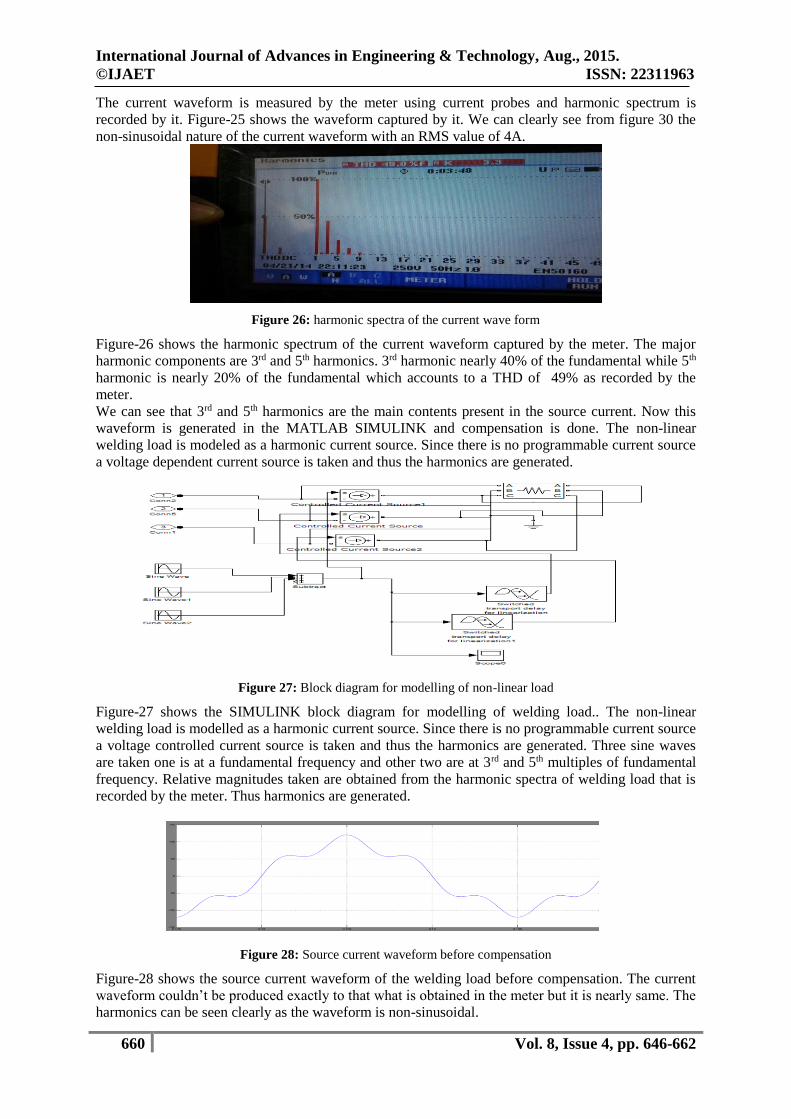
The current waveform is measured by the meter using current probes and harmonic spectrum is
recorded by it. Figure-25 shows the waveform captured by it. We can clearly see from figure 30 the
non-sinusoidal nature of the current waveform with an RMS value of 4A.
Figure 26: harmonic spectra of the current wave form
Figure-26 shows the harmonic spectrum of the current waveform captured by the meter. The major
harmonic components are 3rd and 5th harmonics. 3rd harmonic nearly 40% of the fundamental while 5th
harmonic is nearly 20% of the fundamental which accounts to a THD of 49% as recorded by the
meter.
We can see that 3rd and 5th harmonics are the main contents present in the source current. Now this
waveform is generated in the MATLAB SIMULINK and compensation is done. The non-linear
welding load is modeled as a harmonic current source. Since there is no programmable current source
a voltage dependent current source is taken and thus the harmonics are generated.
Figure 27: Block diagram for modelling of non-linear load
Figure-27 shows the SIMULINK block diagram for modelling of welding load.. The non-linear
welding load is modelled as a harmonic current source. Since there is no programmable current source
a voltage controlled current source is taken and thus the harmonics are generated. Three sine waves
are taken one is at a fundamental frequency and other two are at 3rd and 5th multiples of fundamental
frequency. Relative magnitudes taken are obtained from the harmonic spectra of welding load that is
recorded by the meter. Thus harmonics are generated.
Figure 28: Source current waveform before compensation
Figure-28 shows the source current waveform of the welding load before compensation. The current
waveform couldn’t be produced exactly to that what is obtained in the meter but it is nearly same. The
harmonics can be seen clearly as the waveform is non-sinusoidal.

International Journal of Advances in Engineering & Technology, Aug., 2015.
©IJAET ISSN: 22311963
661 Vol. 8, Issue 4, pp. 646-662
Figure 29: THD before compensation
Figure-32 shows the THD of the source current waveform when the welding load is modeled as a
non-linear load for the purpose of simulation. The value of THD is nearly 19.4% which is not in the
limits prescribed by IEEE.
Figure 30: Source current waveform after compensation
Figure-33 shows the source current wave form after compensation. The source current wave form
became almost sinusoidal. There is a band obtained in the waveform due to the action of the
hysteresis control.
Figure 31: THD after compensation
Figure-34 shows the THD of the source current waveform after compensation. The THD is varying
between 1.6-1.7%.Intially it was 19% for the uncompensated case, now it has decreased by a large
extent. So, it can be inferred that SHAPF has successfully mitigated the current harmonics.
VIII. CONCLUSION
The wave forms for linear and non-linear loads are analyzed in the MATLAB SIMULINK. A shunt
active power filter is developed using instantaneous power theory. The source current waveforms are
analyzed with and without SHAPF. With SHAPF the source waveform which was non-sinusoidal
earlier became almost sinusoidal with some hysteresis band. There was also a sharp reduction in THD
from 26% to 3% after compensation. Later practical non-linear load like welding load is taken. Its
current waveform is captured using a power quality analyser meter. It is modelled in SIMULINK and
compensation is done for it. The THD has decreased from 19.94% to 1.7% after compensation. Thus
we have successfully mitigated current harmonics using SHAPF.
International Journal of Advances in Engineering & Technology, Aug., 2015.
©IJAET ISSN: 22311963
662 Vol. 8, Issue 4, pp. 646-662
IX. FUTURE SCOPE
More than one-nonlinear load may be taken at a time and non-linear loads may be switched at
different instances of time so that harmonic spectra changes. Compensation can be done for the above
load conditions to prove that SHAPF can mitigate current harmonics even under dynamic conditions
unlike passive filter. Also to reduce THD still to a lower value passive filter can be used along with
active filter which is termed as a hybrid power filter.
ACKNOWLEDGEMENTS
We consider it as a great privilege to express our deep gratitude to many respected personalities who
guided, inspired and helped us in the successful completion of our project.
We would like to express our deepest gratitude to our guide Dr. D.V.S.S. Siva Sarma, Professor,
Department of Electrical Engineering, National Institute of Technology, Warangal, for his constant
supervision, guidance, suggestions and invaluable encouragement during this project. Finally, we
would like to dedicate this work to our parents who have provided support and encouragement during
every part of our life.
REFERENCES
[1] Ewald F.Fuchs and Mohammad A.S. Masoum “Power quality in power systems and electrical machines”
Academic Press, USA, 2008.
[2] H.Akagi ,E.H Watanabe and M. Aredes “Instantaneous power theory and applications to power
conditioning” IEEE press 2007
[3] Vasundhara Mahajan, Pramod Agarwal and Hari Om Gupta “Simulation of instantaneous power theory for
active power filter” IEEE International conference on Power, Control and embedded systems.
[4] B. Singh, K. Al-Haddad, and A. Chandra, “A review of active filters for power quality improvement, ” IEEE
Trans. Ind. Electron., vol. 46, no. 5,pp. 960–971, Oct. 1999.
[5] Pragathi and Bharathi “Control of shunt active filter based on instantaneous power theory” IJRET volume-1
Issue-6 August 2012.
[6] H. Fujita, H. Akagi, "A practical approach to harmonic compensation in power systems; series connection of
passive and active filters," IEEE Trans. on Industry Applications,Vol. 27, pp. 1020-1025, 1991.
[7] R. S. Herrera, P. Salmeron, and H. Kim, “Instantaneous reactive power theory applied to active power filter
compensation: Different approaches, assessment, and experimental results,” IEEE Trans. Ind. Electron., vol. 55,
no. 1, pp. 184–196, Jan. 2008.
[8] IEEE Std 519-1992, IEEE Recommended Practices and Requirements for Harmonic Control in Electrical
Power Systems, New York, NY: IEEE.
[9] V. Soares, P. Verdelho and Gil D. Marques, “An Instantaneous Active and Reactive Current
Component Method for Active Filters,” IEEE Transactions on Power Electronics, Vol. 15, No. 4, July 2000.
[10] L. Asiminoaei, E. Aeloiza, P. N. Enjeti, and F. B laabjerg, “Shunt active-power- filter topology based on
parallel interleaved inverters,” IEEE Trans.Ind. Electron. vol. 55, no.3, pp. 1175–1189,Mar. 2008.
[11] Power quality analyser ( FLUKE 435 SERIES-2 ) manual on http://fluke.com/products/power-quality-
analyzers/fluke-435-ii-power-quality.html
AUTHORS
Khalid Jamal Shahid Khan was graduated with B.Tech degree in April 2014 in Electrical
and Electronics Engineering from National Institute of Technology Warangal, India. He is
presently working as Design Engineer in VA Tech Wabag Ltd. His area of interest includes
Power Quality, Power Electronics Converters and Control Systems.
Sreeharsha Chunduri was graduated with B.Tech degree in April 2014 in Electrical and
Electronics Engineering from National Institute of Technology Warangal, India. He is
presently working as Electrical Engineer in Power Grid Corporation Ltd. His area of interest
includes Power Quality and Control Systems.