
International Health Policy Program -Thailand Panatapon Chongprasertying,Kannapon Phakdeesettakun...
20
International Health Policy Program - Thailand International Health Policy Program -Thailand Panatapon Chongprasertying,Kannapon Phakdeesettakun Center for Alcohol Studies, International Health Policy Program, Ministry of Public Health The density of liquor outlets: Case Study of The British Columbia, Canada .
-
Upload
elfrieda-warner -
Category
Documents
-
view
215 -
download
1
Transcript of International Health Policy Program -Thailand Panatapon Chongprasertying,Kannapon Phakdeesettakun...

Inte
rna
tio
na
l H
ea
lth
Po
lic
y P
rog
ram
-T
ha
ila
nd
Inte
rnati
onal H
ealt
h P
olic
y P
rogra
m -
Thaila
nd
Panatapon Chongprasertying,Kannapon Phakdeesettakun
Center for Alcohol Studies, International Health Policy Program, Ministry of Public
Health Thailand
The density of liquor outlets: Case Study of The British
Columbia, Canada .
Inte
rna
tio
na
l H
ea
lth
Po
lic
y P
rog
ram
-T
ha
ila
nd
Inte
rnati
onal H
ealt
h P
olic
y P
rogra
m -
Thaila
nd
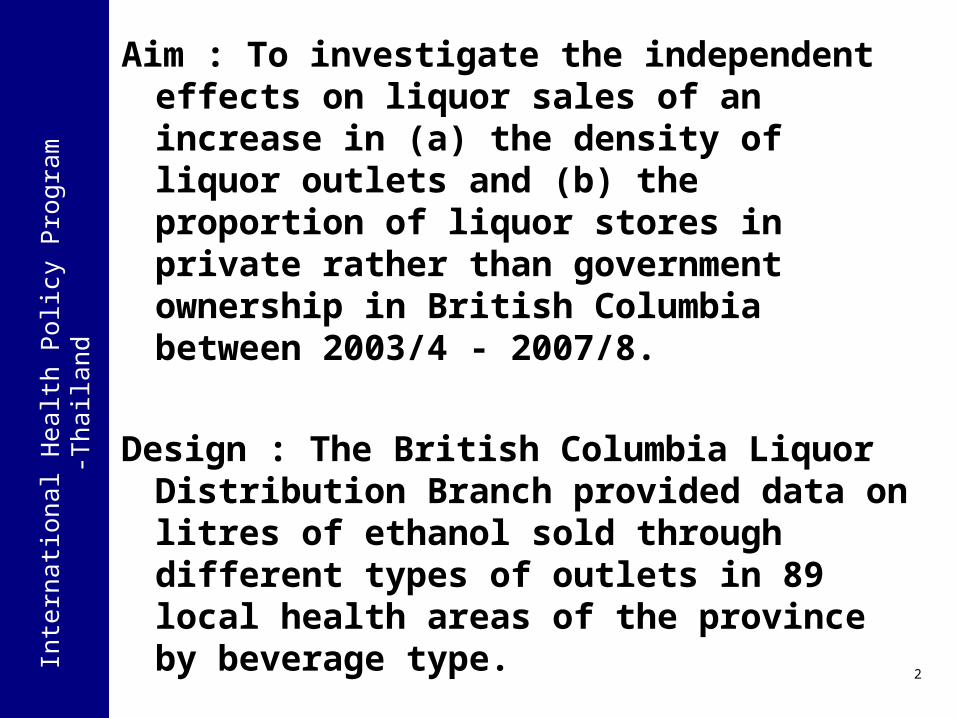
Aim : To investigate the independent effects on liquor sales of an increase in (a) the density of liquor outlets and (b) theproportion of liquor stores in private rather than government ownership in British Columbia between 2003/4 - 2007/8.
Design : The British Columbia Liquor Distribution Branch provided data on litres of ethanol sold through different types of outlets in 89 local health areas of the province by beverage type.
2

Inte
rna
tio
na
l H
ea
lth
Po
lic
y P
rog
ram
-T
ha
ila
nd
Inte
rnati
onal H
ealt
h P
olic
y P
rogra
m -
Thaila
nd
Statistical analyses : Multi-level regression
models were used to examine the relationship
between per capita alcohol sales and outlet
densities for different types of liquor outlet
after adjusting for potential confounding
social,economic and demographic factors as
well as spatial and temporal autocorrelation.
Setting: Liquor outlets in 89 local health
areas of British Columbia,Canada.-Interior- Northern- Vancouver Coastal- Vancouver Island- Fraser
3
Inte
rna
tio
na
l H
ea
lth
Po
lic
y P
rog
ram
-T
ha
ila
nd
Inte
rnati
onal H
ealt
h P
olic
y P
rogra
m -
Thaila
nd
4
Variable name
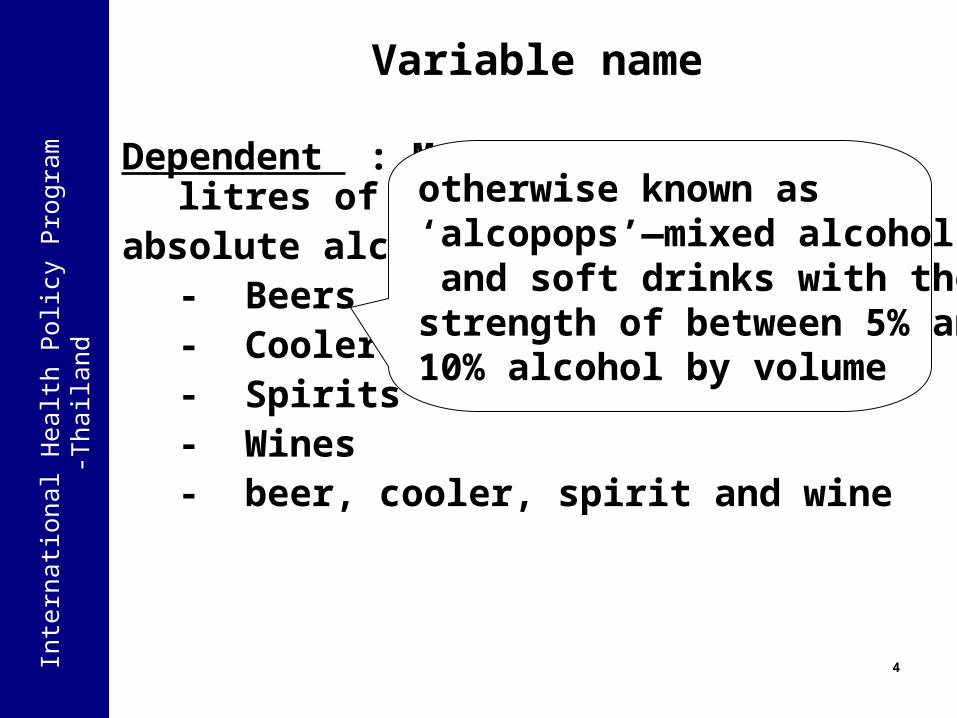
Dependent : Monthly per capita litres of absolute alcohol from……
- Beers- Coolers- Spirits- Wines- beer, cooler, spirit and wine
otherwise known as‘alcopops’—mixed alcohol and soft drinks with thestrength of between 5% and 10% alcohol by volume
Inte
rna
tio
na
l H
ea
lth
Po
lic
y P
rog
ram
-T
ha
ila
nd
Inte
rnati
onal H
ealt
h P
olic
y P
rogra
m -
Thaila
nd
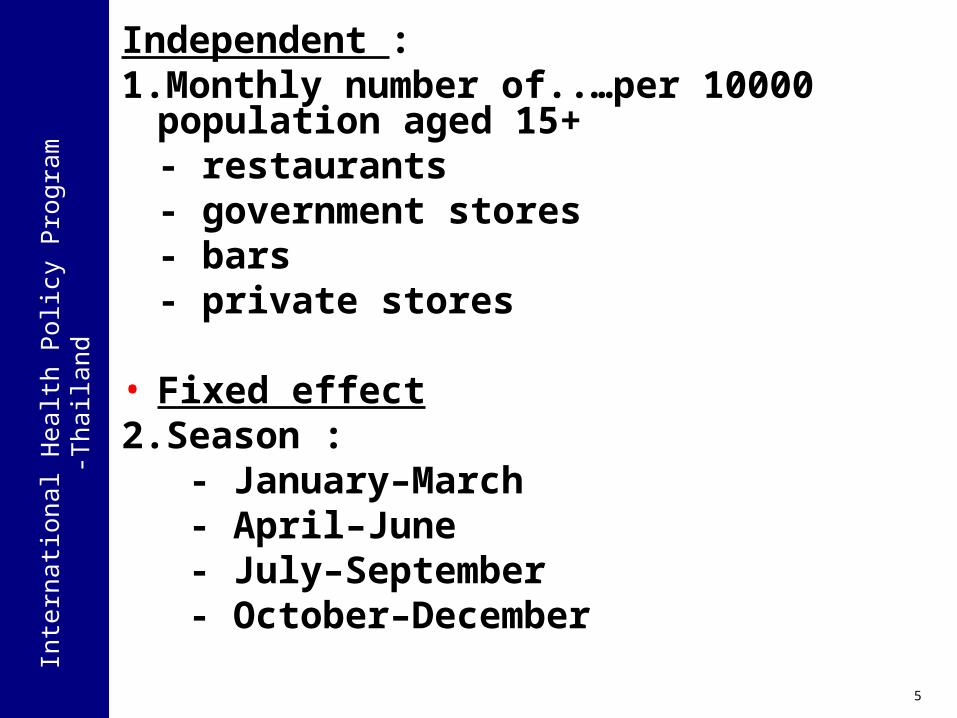
Independent :1.Monthly number of..…per 10000
population aged 15+- restaurants- government stores- bars- private stores
• Fixed effect2.Season : - January–March - April–June - July–September - October–December
5
Inte
rna
tio
na
l H
ea
lth
Po
lic
y P
rog
ram
-T
ha
ila
nd
Inte
rnati
onal H
ealt
h P
olic
y P
rogra
m -
Thaila
nd
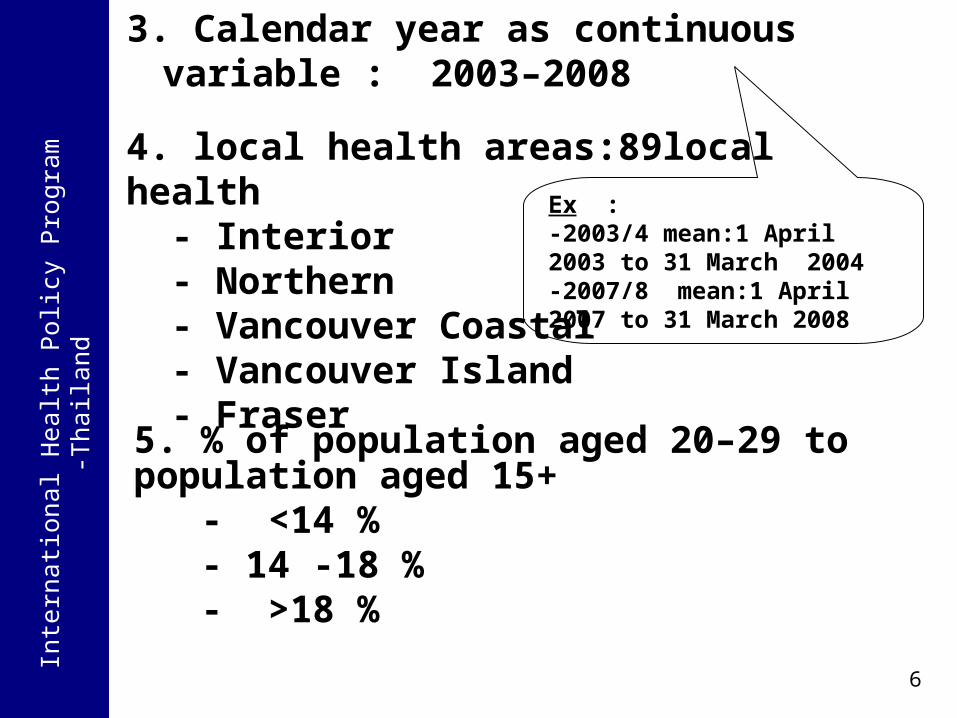
3. Calendar year as continuous variable : 2003–2008
Ex : -2003/4 mean:1 April 2003 to 31 March 2004 -2007/8 mean:1 April 2007 to 31 March 2008
4. local health areas:89local health - Interior - Northern - Vancouver Coastal - Vancouver Island - Fraser
5. % of population aged 20–29 to population aged 15+ - <14 % - 14 -18 % - >18 %
6
Inte
rna
tio
na
l H
ea
lth
Po
lic
y P
rog
ram
-T
ha
ila
nd
Inte
rnati
onal H
ealt
h P
olic
y P
rogra
m -
Thaila
nd
7
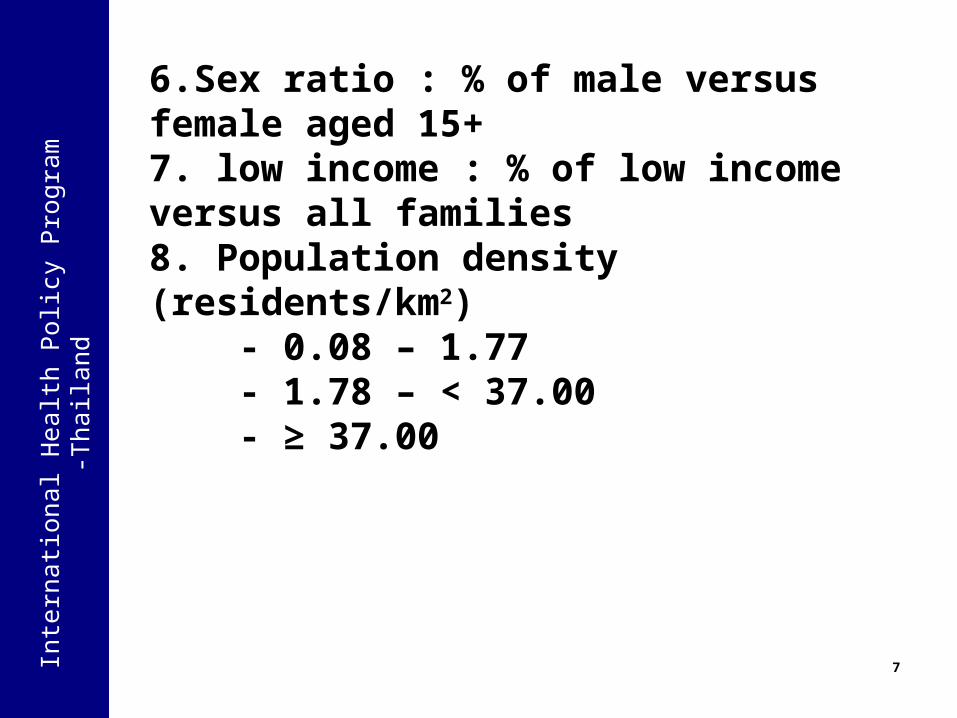
6.Sex ratio : % of male versus female aged 15+7. low income : % of low income versus all families8. Population density (residents/km2) - 0.08 – 1.77 - 1.78 – < 37.00 - ≥ 37.00
Inte
rna
tio
na
l H
ea
lth
Po
lic
y P
rog
ram
-T
ha
ila
nd
Inte
rnati
onal H
ealt
h P
olic
y P
rogra
m -
Thaila
nd
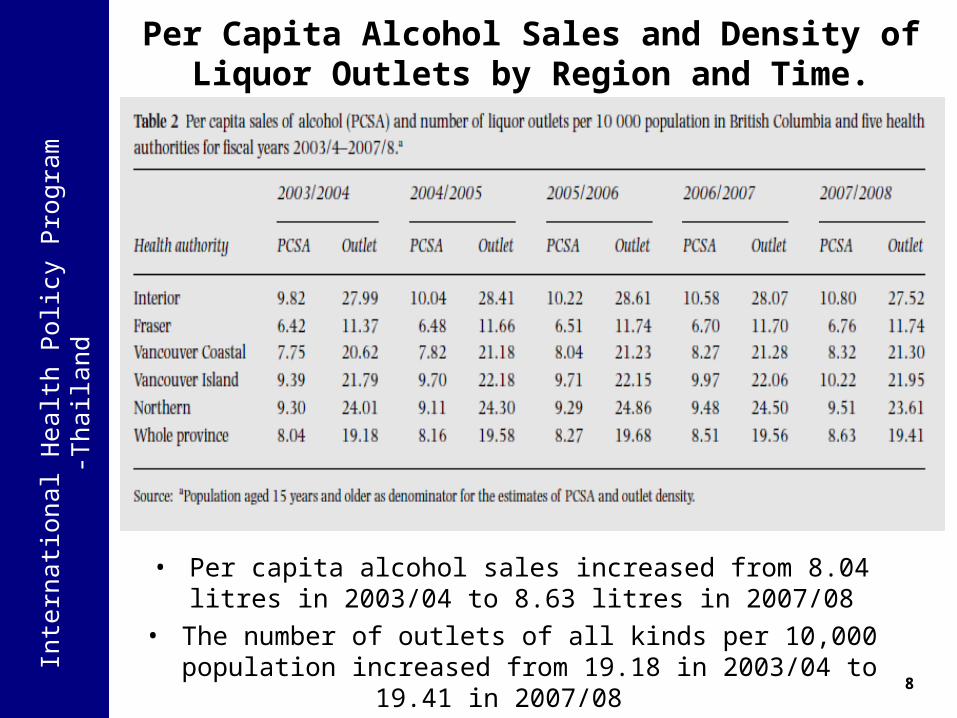
• Per capita alcohol sales increased from 8.04 litres in 2003/04 to 8.63 litres in 2007/08
• The number of outlets of all kinds per 10,000 population increased from 19.18 in 2003/04 to 19.41
in 2007/08
Per Capita Alcohol Sales and Density of Liquor Outlets by Region and Time.
8
Inte
rna
tio
na
l H
ea
lth
Po
lic
y P
rog
ram
-T
ha
ila
nd
Inte
rnati
onal H
ealt
h P
olic
y P
rogra
m -
Thaila
nd
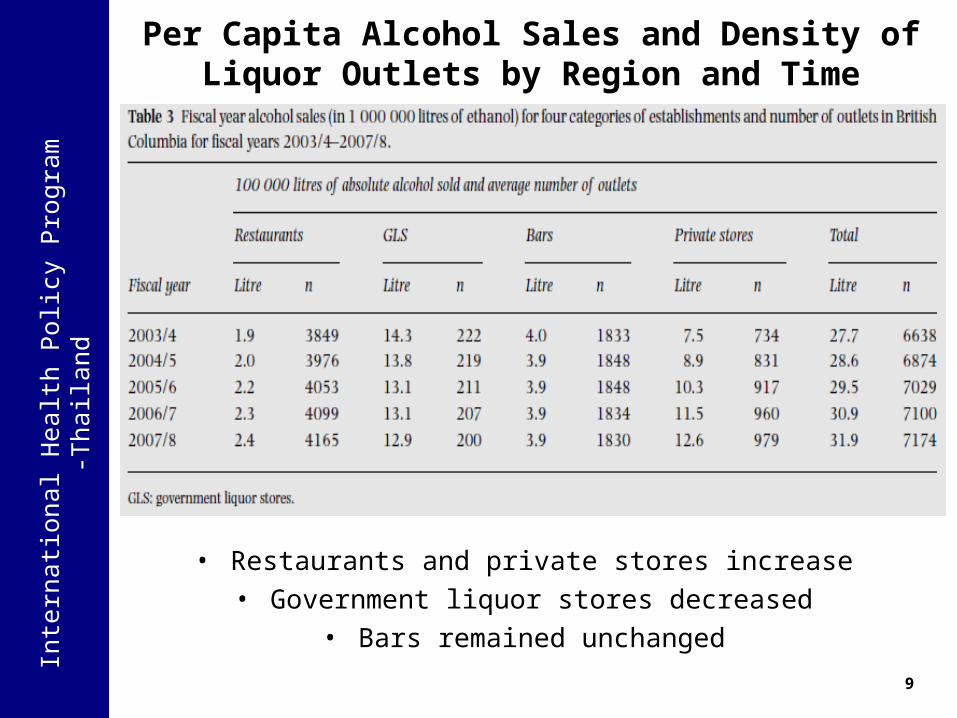
Per Capita Alcohol Sales and Density of Liquor Outlets by Region and Time
• Restaurants and private stores increase• Government liquor stores decreased
• Bars remained unchanged
9
Inte
rna
tio
na
l H
ea
lth
Po
lic
y P
rog
ram
-T
ha
ila
nd
Inte
rnati
onal H
ealt
h P
olic
y P
rogra
m -
Thaila
nd
Multi-level regression analysisRelationships between alcohol sales and outlet
density
10
• Per capita sales of alcohol were associated significantly and positively with changes in monthly number of each kind of
liquor outlet per 10,000 residents.
• The direction of the relationship for government liquor stores was negative when adjustments were made for other
independent variables.
• All types of density measures were associated significantly with changes in per capita alcohol sales :
- Restaurants, bars and private stores were associated significantly and positively.
- Government stores was associated significantly and negatively.
• The density of private stores was associated positively and significantly with per capita sales of beer, coolers, spirits and
wine, while the density of government stores were related significantly negatively to per capita sales of beer, coolers or
spirits, but not wine.
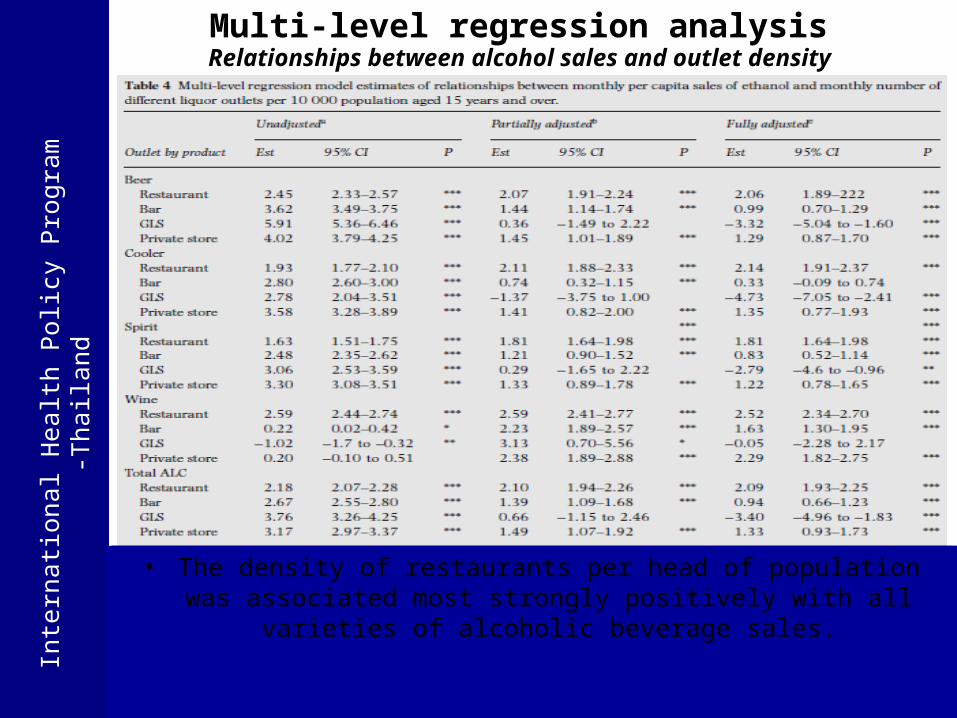
• The density of restaurants per head of population was associated most strongly positively with all varieties of
alcoholic beverage sales.
Inte
rna
tio
na
l H
ea
lth
Po
lic
y P
rog
ram
-T
ha
ila
nd
Inte
rnati
onal H
ealt
h P
olic
y P
rogra
m -
Thaila
nd
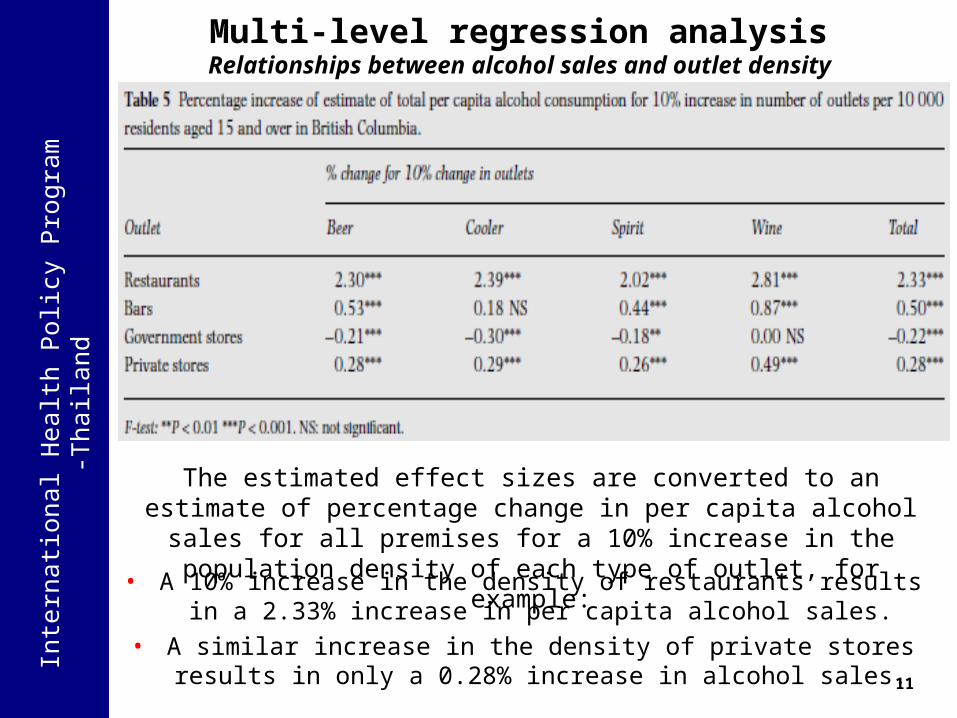
• A 10% increase in the density of restaurants results in a 2.33% increase in per capita alcohol sales.
• A similar increase in the density of private stores results in only a 0.28% increase in alcohol sales.
The estimated effect sizes are converted to an estimate of percentage change in per capita alcohol sales for all premises for a 10% increase in the population density of each type of
outlet, for example:
Multi-level regression analysisRelationships between alcohol sales and outlet
density
11
Inte
rna
tio
na
l H
ea
lth
Po
lic
y P
rog
ram
-T
ha
ila
nd
Inte
rnati
onal H
ealt
h P
olic
y P
rogra
m -
Thaila
nd
Multi-level regression analysisProportion of private versus government stores and
alcohol sales
12

Inte
rna
tio
na
l H
ea
lth
Po
lic
y P
rog
ram
-T
ha
ila
nd
Inte
rnati
onal H
ealt
h P
olic
y P
rogra
m -
Thaila
nd
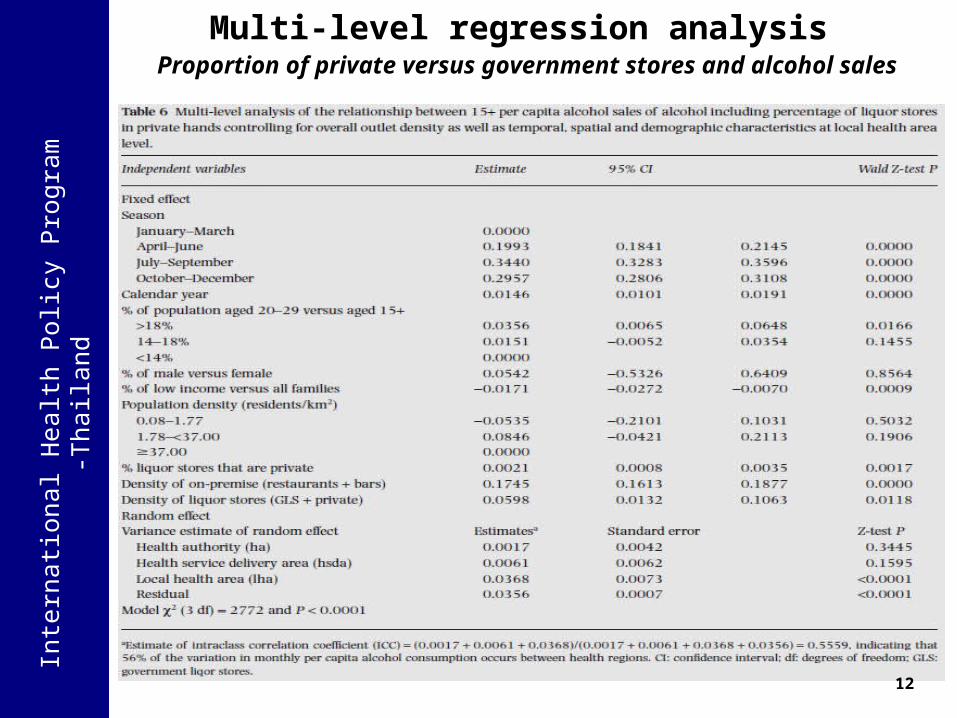
• The proportion of stores in private hands was associated significantly with total alcohol sales (P < 0.01)
• Other independent variables which were related positively and significantly to per capita alcohol sales in this model
were:
- Financial year, the percentage of population aged 20–29 years in the local population aged 15 years and older (P =
0.05) and all annual quarters other than January to March (P < 0.0001 in each case).
- The proportion of low-income families in a local area was associated negatively with per capita alcohol sales (P <
0.001).
The multi-level regression analysis shown in Table 6 controlling or socio-economic and demographic variables
found:
13
Multi-level regression analysisProportion of private versus government stores and
alcohol sales

Inte
rna
tio
na
l H
ea
lth
Po
lic
y P
rog
ram
-T
ha
ila
nd
Inte
rnati
onal H
ealt
h P
olic
y P
rogra
m -
Thaila
nd
• Between the financial years 2003/04 and 2007/08 the number of private liquor stores rose by 33.4%, while the
number of government liquor stores fell by 9.9%.
• Overall, conclude that there is strong evidence for a connection between the number of liquor outlets overall per
population and per capita alcohol sales:- hypothesis 1 was supported for most varieties of liquor
outlet and beverage types.- hypothesis 2 was supported that private liquor outlets are somehow intrinsically more risky than government liquor
stores, both for total alcohol sales and for sales of beer, wine and spirits, although not coolers.
• This suggests some support for the observation that private stores enable some differentiation of the alcohol market,
putting further upward pressure on alcohol sales.
Discussion
14

Inte
rna
tio
na
l H
ea
lth
Po
lic
y P
rog
ram
-T
ha
ila
nd
Inte
rnati
onal H
ealt
h P
olic
y P
rogra
m -
Thaila
nd
• The fully adjusted multi-level regression models found significant and positive associations for the number of
restaurants, bars and private stores with total per capita sales of alcohol and also separately for sales of most beverages.
• By contrast, the population density of government stores was associated significantly and negatively with total alcohol sales, as well as sales of beer, coolers and spirits, but not wine and the numbers of restaurants per 10 000 residents
aged 15 and over was associated the most closely with changes in per capita sales of alcohol.
• A 10% increase in numbers of different liquor outlets per 10 000 adult residents was associated with:
- A 2.33% increase in per capita sales of alcohol for restaurants.
- A 0.50% increase for bars.- A 0.28% increase for private stores.
- A 0.22% decrease for government stores.
These changes appear modest, it is important to bear in mind that they are changes in total per capita alcohol sales, not simply changes in sales for that particular type of liquor
outlet.
Discussion
15
Inte
rna
tio
na
l H
ea
lth
Po
lic
y P
rog
ram
-T
ha
ila
nd
Inte
rnati
onal H
ealt
h P
olic
y P
rogra
m -
Thaila
nd
• Conclude that there was a stimulating effect on alcohol sales introduced by increasing proportions of private stores
over and above the increase in total number of liquor outlets that occurred during the study period.
• It is important to note that population density of liquor stores was less associated with total alcohol sales than was
population density of on premise outlets (bars and restaurants). This is a counter-intuitive finding, as liquor stores contribute a substantially larger proportion of all
alcohol sales than to bars and restaurants.
• This is also consistent with the finding that densities of private alcohol stores are associated significantly positively with changes in per capita alcohol sales, while densities of government alcohol stores are associated significantly and
negatively with per capita alcohol sales. Private outlets, both on- and off-premise, have typically more freedom of
economic response than government monopolies.
Discussion
16
Inte
rna
tio
na
l H
ea
lth
Po
lic
y P
rog
ram
-T
ha
ila
nd
Inte
rnati
onal H
ealt
h P
olic
y P
rogra
m -
Thaila
nd
• Overall, findings support strongly a relationship between population density of liquor outlets and alcohol
consumption.
• One impact of the policy that has led to gradually increasing partial privatization of liquor stores has been an
increase in the overall number of outlets in many areas. This, in itself, has been associated clearly with increased
per capita alcohol sales
• The analyses presented here show that there was substantial variation across different regions of British
Columbia, both in density of liquor outlets and the population rate of alcohol sales. Further, these analyses
indicate that local variation in population density of liquor outlets is associated strongly with changes in per capita alcohol sales—and that increasing privatization of liquor
stores has further stimulated alcohol sales and consumption.
Discussion
17
Inte
rna
tio
na
l H
ea
lth
Po
lic
y P
rog
ram
-T
ha
ila
nd
Inte
rnati
onal H
ealt
h P
olic
y P
rogra
m -
Thaila
nd
• As would be expected from international research, any increase in population density of outlets will put upward pressure on per capita alcohol consumption which will, in
turn, usually increase a wide range of serious alcohol-related harms.
• Main finding is that when controlling for liquor outlet density plus spatial, temporal, economic and demographic
characteristics across 89 local health areas, increasing privatization of liquor stores in British Columbia in recent years has been associated significantly with increasing
alcohol sales per head of population with probable adverse effects on public health.
• Thus, a fully privatized system might be expected to increase total alcohol consumption still further, along with
adverse alcohol-related consequences.
Discussion
18

Inte
rna
tio
na
l H
ea
lth
Po
lic
y P
rog
ram
-T
ha
ila
nd
Inte
rnati
onal H
ealt
h P
olic
y P
rogra
m -
Thaila
ndReference
• Tim Stockwell and other. “Changes in per capita alcohol sales during the partial privatization of British Columbia’s retail alcohol monopoly 2003–2008: a multi-level local area analysis”. Addiction, 104, 1827–1836.
19

Inte
rna
tio
na
l H
ea
lth
Po
lic
y P
rog
ram
-T
ha
ila
nd
Inte
rnati
onal H
ealt
h P
olic
y P
rogra
m -
Thaila
nd
20


![Alliance for Alcohol policy movements€¦ · Health Promotion Policy Research Center, International Health Policy Program (IHPP) Ministry of Public Health ]thaksaphon@ihpp.thaigov.net](https://static.fdocuments.us/doc/165x107/5f0701cc7e708231d41ad4e4/alliance-for-alcohol-policy-movements-health-promotion-policy-research-center-international.jpg)


