
International Gas Unionmembers.igu.org/html/wgc2003/WGC_pdffiles/data/IGU/WOC2_Report... ·...
43
22 nd World Gas Conference June 1– 5, 2003 Tokyo, Japan International Gas Union Triennium 2000 – 2003 Working Committee 2 – Underground Gas Storage – Report of Basic Activity Study Rapport du Basic Activity Study Chairman/Président Joachim Wallbrecht Germany
Transcript of International Gas Unionmembers.igu.org/html/wgc2003/WGC_pdffiles/data/IGU/WOC2_Report... ·...

22nd World Gas Conference June 1– 5, 2003 Tokyo, Japan
International Gas Union
Triennium 2000 – 2003
Working Committee 2
– Underground Gas Storage –
Report of Basic Activity Study
Rapport du Basic Activity Study
Chairman/Président
Joachim Wallbrecht
Germany
IGU WOC 2 Basic Activity Study2000 – 2003
2
ABSTRACT
This report includes a summary of the work undertaken in the Basic Activity Study Group of WOC 2-UGS -and is part of the WGC report.
The report includes the following sections:
- Underground Gas Storage in the World- Trends in the UGS business.
The survey about Underground Gas Storage in the world accounts for the major part of the study. Thissection is built up out of the UGS Data Bank and the UGS World Map, which allows for a geo-referencedvisualisation and fast derivation of UGS data in the world.
The report describes trends in the UGS business with respect to general, legal, environmental andtechnological issues and trends from a country perspective. Examples of performance improvements areincluded.
For the first time a worldwide database has been developed including data about individual storage facili-ties in the world. Based on the work carried out during the triennium 2000-2003 the Basic Activity Studywill be continued and will become a standing item in each triennium.
RESUME
Ce rapport comprend un résumé des travaux effectués par le « Basic Activity Study Group » (Equipe pourles Etudes des Activités de Base) du WOC 2-UGS et fait partie du rapport WGC (Centre Mondial du Gaz).
Ce rapport contient les sections suivantes :
- Stockage souterrain de gaz dans le monde entier- Tendances dans le domaine du stockage souterrain de gaz
Les recherches sur le stockage souterrain de gaz dans le monde entier constituent la partie principale del’étude. Cette section à été crée à partir du UGS Data Bank (base de données de l’UGS) et le UGSWorld Map (carte mondiale du UGS) permettant une visualisation liée aux lieux individuels et uneexploitation rapide des données UGS dans le monde entier.
Ce rapport décrit les tendances dans le domaine du stockage souterrain de gaz en tenant compte desaspects et tendances généraux, légaux, environnementaux et technologiques et du point de vue des paysindividuels. Les exemples pour l’amélioration des capacités de stockage sont ajoutés.
C’est la première fois qu’une base de données internationale a été développée, y compris les donnéesconcernant les stocks individuels dans le monde entier. Le travail triennal (de 2000 à 2003) du BasicActivity Group sera continué, et le Basic Activity Study (Etude des Activités de Base) deviendra un pointfixe dans chaque période triennale.
IGU WOC 2 Basic Activity Study2000 – 2003
3
Table of Contents
1 Introduction2. Study Group Members3. Objectives and scope4. Way of working5. Structure of Basic Activity Study
5.1 Underground Gas Storage in the world5.2 Trends in the UGS Business5.2.1 Storage Capacity and Demand Trends5.2.2 General, legal, technological issues - General issues - Legal issues - Technological issues5.2.3 Trends in the UGS business from a country perspective - Austria - Denmark - Finland - France - Germany - Italy - Japan - The Netherlands - Poland - Russia - United States of America
6. Lessons learned, further improvements and proposals for the nexttriennium
7. Contact Address8. Attachments
IGU WOC 2 Basic Activity Study2000 – 2003
4
1. Introduction
One part of the Triennium work programme 2000 - 2003 is WOC 2‘s Basic Activity, which has been estab-lished for the first time. The Basic Activity will become a standing item in each triennium. Results of thestudy will be presented during the World Gas Conference 2003 in Tokyo.
2. Study Group Members
The study has been developed by the WOC 2 Basic Activity Study Group in co-operation with UNECE andWOC 9. The study group included members from Austria, Croatia, France, Germany, Italy, Japan, Russia,Slovakia and Ukraine. The study leader was Germany. The members are listed in attachment 1.
3. Objectives and Scope
The objectives of the Basic Activity Study are:
• Statistical survey of existing/planned Underground Gas Storages (UGS) in the world• Development of a database of underground gas storage facilities in the different regions of the world• Development of a UGS World Map• Derivation of general trends in the storage business.
The study covers the following types of storage:
- storage in aquifer structures - storage in oil and gas fields - storage in salt caverns - storage in rock caverns - storage in abandoned mines
4. Way of Working
The report has been derived from a questionnaire which was sent out to the relevant gas associations andstorage companies.
The questionnaire was split into the following parts:
• Data questionnaire for existing UGS in operation asking for relevant data from individual storage fa-cilities
• Data questionnaire for planned UGS• General questionnaire asking for example for trends in the storage business
5. Structure of Basic Activity Study
The study report includes the following sections:
I. Underground Gas Storage in the world• UGS Data Bank• UGS World Map - geo-referenced presentation of UGS data
II. Trends in the UGS businessIII. Attachments, incl. relevant terms, units and definitions

IGU WOC 2 Basic Activity Study2000 – 2003
5
Section I. on the database and its visualisation accounts for the major part of the study.
For the first time a worldwide database has been developed including data about individual storage facili-ties in the world.
The studies carried out so far (see attachment 2) do not cover recent data, or the reports have only a lim-ited regional scope. There was therefore a real demand for an extensive study as carried out within theBasic Activity Study Group.
5.1. Underground Gas Storage in the World
Data concerning storage facilities were received from the following 14 countries in reply to the question-naire: Austria, Belgium, Croatia, Czech Republic, Denmark, France, Germany, Italy, Japan, theNetherlands, Poland, Slovak Republic, Spain, Ukraine. 50% of all countries with UGS in operationtherefore answered.
In addition to the questionnaire replies, a valuable contribution was received from the American Gas As-sociation in the form of the AGA Report – Survey of Underground Storage Of Natural Gas in the UnitedStates and Canada: 1998 (Jan. 1999).
Based on the information received, data from about 563 storage facilities were compiled, which is equiva-lent to a coverage of 89 % of the existing 634 underground gas storage facilities in the world.
The countries of interest for UGS were grouped into the following four regions: America, Asia, EastEurope/Central Asia, Middle East and West Europe:
America
WestEurope
East Europe/Central Asia
AsiaMiddleEast
As storage data from some relevant storage countries were not accessible via the questionnaire, a co-operation with UN ECE, IGU WOC 9 and others made it possible to use published data, for example:Study on UGS in Europe and Central Asia, UN ECE 1999 (status: 1996). In addition publications such asCEDIGAZ Report, Report of NLfB (Dec. 2001), etc. were incorporated in the database.
IGU WOC 2 Basic Activity Study2000 – 2003
6
It has to be noted in the context of the european liberalisation process, that european gas companies aremore and more reluctant to publish information on their storage facilities.
The world database on UGS facilities was created for the first time and is based on received data andpublished data or additional available information as explained above, mainly at reference year 2001. Thedata are included, apart from some adjustments, +/- as received. The database is still incomplete for someregions and may include some inconsistencies. The study does not claim to be complete. Applied unitsare defined in attachment 9.
Despite clear definitions, some operators did not use definitions consistently; for example only injectedgas volumes are referred to as cushion gas volumes by a few operators, thus excluding the indigenous insitu gas volumes. Pressures derived from the AGA 1998 report are mainly referred to as surface well headpressures; consistent conversion to subsurface pressures is not possible as depth data are missing.
The data contained in the UGS World Data Bank differ from cumulative storage capacities of individualcountries reported on a national basis, e.g. to WOC 9. Differences were identified between the summation-storage by storage- of accessible data compared to the national capacity, e.g. for the USA and for Rus-sia. No detailed data were received from Russia. Thus differences may be due to different referenceyears, differing use of capacities (installed vs. utilized working gas volume) and included long-term re-serves.
As the Basic Activity will commence in the next trienniums, the existing database will be broadened suc-cessively and inconsistencies will be reduced in the following years.
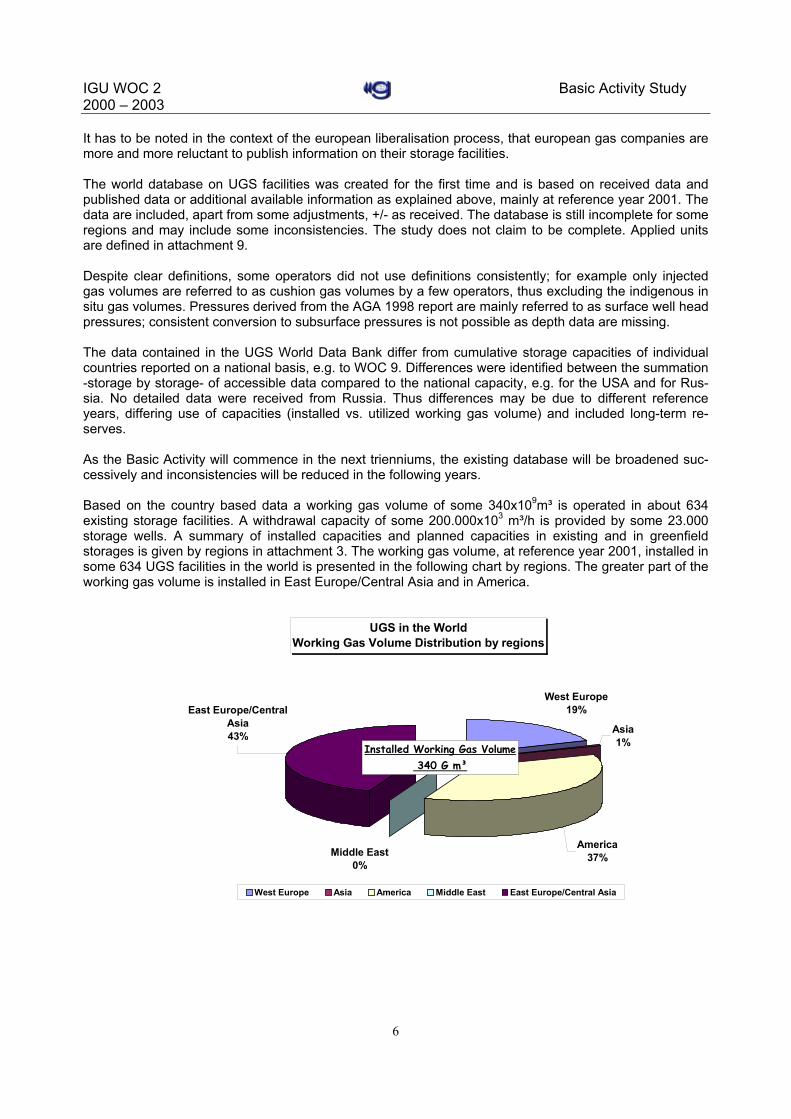
Based on the country based data a working gas volume of some 340x109m³ is operated in about 634existing storage facilities. A withdrawal capacity of some 200.000x10³ m³/h is provided by some 23.000storage wells. A summary of installed capacities and planned capacities in existing and in greenfieldstorages is given by regions in attachment 3. The working gas volume, at reference year 2001, installed insome 634 UGS facilities in the world is presented in the following chart by regions. The greater part of theworking gas volume is installed in East Europe/Central Asia and in America.
UGS in the WorldWorking Gas Volume Distribution by regions
Middle East0%
America37%
Asia1%
West Europe19%East Europe/Central
Asia43%
West Europe Asia America Middle East East Europe/Central Asia
Installed Working Gas Volume 340 G m³
IGU WOC 2 Basic Activity Study2000 – 2003
7
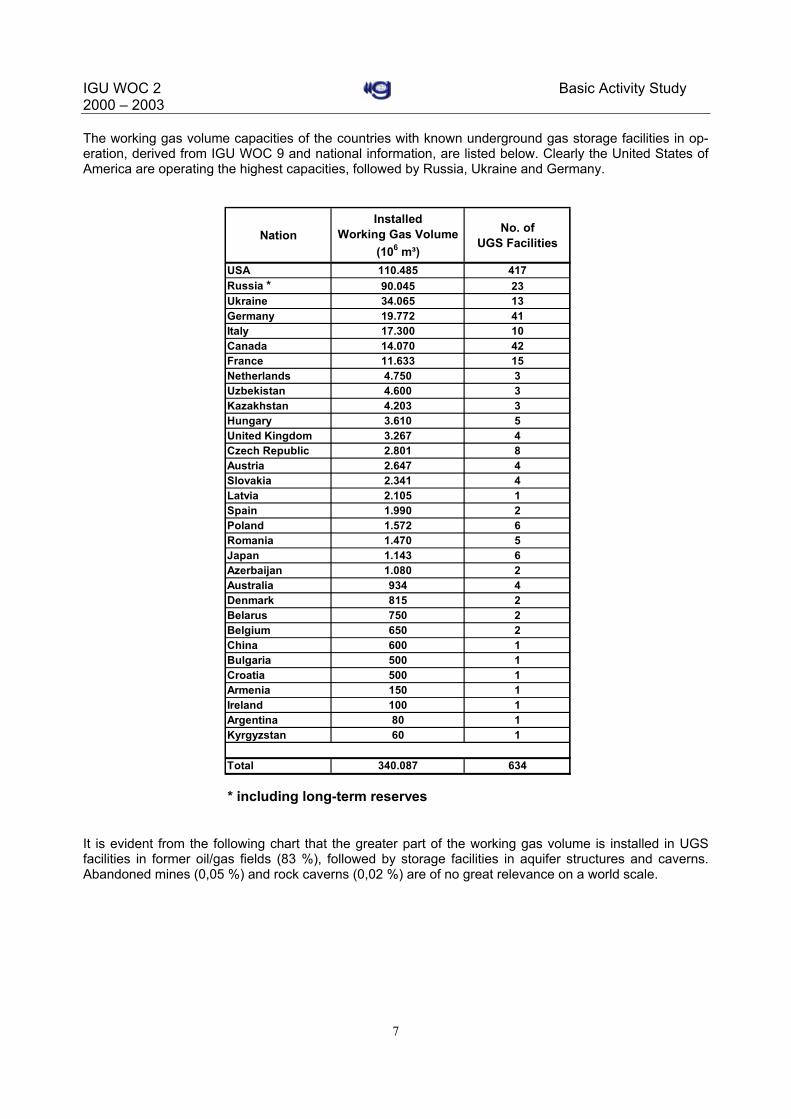
The working gas volume capacities of the countries with known underground gas storage facilities in op-eration, derived from IGU WOC 9 and national information, are listed below. Clearly the United States ofAmerica are operating the highest capacities, followed by Russia, Ukraine and Germany.
NationInstalled
Working Gas Volume (106 m³)
No. of UGS Facilities
USA 110.485 417Russia * 90.045 23Ukraine 34.065 13Germany 19.772 41Italy 17.300 10Canada 14.070 42France 11.633 15Netherlands 4.750 3Uzbekistan 4.600 3Kazakhstan 4.203 3Hungary 3.610 5United Kingdom 3.267 4Czech Republic 2.801 8Austria 2.647 4Slovakia 2.341 4Latvia 2.105 1Spain 1.990 2Poland 1.572 6Romania 1.470 5Japan 1.143 6Azerbaijan 1.080 2Australia 934 4Denmark 815 2Belarus 750 2Belgium 650 2China 600 1Bulgaria 500 1Croatia 500 1Armenia 150 1Ireland 100 1Argentina 80 1Kyrgyzstan 60 1
Total 340.087 634
* including long-term reserves
It is evident from the following chart that the greater part of the working gas volume is installed in UGSfacilities in former oil/gas fields (83 %), followed by storage facilities in aquifer structures and caverns.Abandoned mines (0,05 %) and rock caverns (0,02 %) are of no great relevance on a world scale.

IGU WOC 2 Basic Activity Study2000 – 2003
8
UGS in the WorldWorking Gas Volume Distribution by Storage Types
Salt Cavern3,83%
Aquifers12,63%
Abandandoned Mine0,05%
Oil-/Gasfield83,47%
Rock Cavern0,02%
Oil-/Gasfield Abandandoned Mine Aquifers Salt Cavern Rock Cavern
Installed Working Gas Volume 340x109 m³in 634 UGS
This distribution of storage types differs by regions; in West Europe for example more storage capacitiesare available from aquifers (21%) and caverns (13%) relative to UGS in oil/gas fields (67%).
The database includes, in addition to the UGS in operation, planned UGS facilities and facilities underconstruction. As this is the first worldwide report, the database has to be completed successively in thefuture, especially on the planned UGS projects which have a more volatile character. As many projectplans are coming up and are going it is always difficult to present the real status and the presenteddatabase may not be fully representative.
The detailed information, at reference year 2001, is available in the UGS Data Bank, which is Access 97based, and as a geo-referenced UGS World Map via links on the front page of the report, such as thefollowing one for the UGS Data Bank. The data are made available for information purposes and for anyfurther detailed analysis.
UGS DATA BANK

IGU WOC 2 Basic Activity Study2000 – 2003
9
5.2 Trends in the UGS Business
Based on 21 replies from 12 countries limited feedback on the general questionnaire request was re-ceived. Therefore additional sources were utilized to derive some trends in the storage industry business.In general the database was insufficient and does not allow for a comprehensive analysis.
5.2.1 Storage Capacity and Demand Trends
From the data sources the historical development of the installed working gas capacity by regions wasderived as presented in the following graph:
Development of Installed Working Gas Volume in the World
0
50
100
150
200
250
300
350
400
1965 1970 1975 1980 1985 1990 1995 2000 2005
Wor
king
Gas
Vol
ume
(G m
³) Total World
America
East Europe / Central Asia
West Europe
Asia
Increasing capacities can be observed despite rumours of capacity oversupply in some regions.Contributions received from different countries indicate increasing storage demand (see chapter 5.2.3 -Trends in the UGS business from a country perspective). Due to the ongoing liberalisation process of thegas market the importance of storage capacity in the gas chain is recognised and new products can bemade available from underground gas storage facilities. UGS in a liberalised market environment should,in addition to conventional tasks, be used as a trading tool to enhance the value of gas. New businessopportunities for UGS are related to the development of gas hubs in Europe. The load factor of gassupplies is expected to rise in Europe, due to higher import volumes compared to a stable or decliningindigenous production. Withdrawal capacity consequently has to be increased. Increasing utilization andincreasing storage demand may result in increasing capacities, assuming a reliable economic and politicalenvironment.
The aspect of strategic storage is under political discussion in West Europe. The idea is to hold strategicstocks. The requirement does not make real political sense, as international co-operation is more stableand the variety of supply sources has been increasing.
Every current forecast of global energy consumption for the next decades concludes that the use of gaswill substantially increase, consequently resulting in higher storage demand. In addition higher loadfactors and changes in the demand structure can be expected. As only limited information about expected

IGU WOC 2 Basic Activity Study2000 – 2003
10
future storage demand was received, no explicit prognosis is given. A comprehensive analysis of theexpected storage demand would be beneficial for the next triennium.
As a rough indication of the future storage capacity trend, an assessment of storage demand in Europe isdeveloped in the following. Based on the existing storage capacities as a share of gas consumption andthe expected future gas demand the future storage demand is extrapolated.
Referring to a recent prognosis of IEA on expected energy demand (World Energy Outlook 2002) anincrease in gas consumption by 2/3 until 2030 is expected. Other IEA publications and authors (OME)indicate an increase in gas demand of 29 % until 2010 and of 55-64 % until 2020 in Europe (UGSConference May 2002, Istanbul).
In 2000 about 59x109 m³ of working gas volume, equivalent to some 13% of gas consumption, wasavailable in UGS facilities in West Europe.
Just ignoring influences of changing load structures and demand structures an increase in the order ofsome 17x109 m³ of working gas volume can be expected until 2010 or 30 to 35x109 m³ until 2020.Withdrawal capacity is expected to rise more strongly.
5.2.2 General, legal, technological issues
Based on the replies, which were, except for 3 replies from Japan, only received from Europe, the follow-ing trends were derived with respect to legal, technical and safety topics. Technological trends, derivedfrom the Data Bank, have also been included. Further details are given in chapter 5.2.3 - Trends in theUGS business from a country perspective.
General issues
In general, the UGS industry in Europe is moving more from a national to a European business.
The impact of liberalisation of the European gas market, especially third party access (TPA) to storage,will be one of the major challenges in the future. For the time being the procedure to implement liberalisa-tion, especially regulation, differs from country to country.
It is expected that TPA will have a major impact on the storage industry as regards reduced storage tariffs.Proactive cost cutting initiatives and efficiency improvements are required.
On the other hand, the effect of future environmental requirements, such as emission control, and safetyprogrammes is expected to increase costs.
In the forefront, due to market liberalisation and the related publication of contracted capacities, surpluscapacities will be identified and made available to new players.
In the event of mandatorily regulated TPA to UGS, together with low uneconomic storage tariffs, a majorimpact on the UGS industry is expected. New storage capacities will not be developed, shut-in of existingUGS facilities is possible, or withdrawal from the storage business seems to be a realistic option in thefuture for some operators.
The expected increasing long-term storage demand cannot be fulfilled under these circumstances. As aslight increase in lead times for new storage developments is observed and more delays are expected inthe future, the covering of storage demand will be aggravated.
Assuming an economic development environment, adjustments of the existing facilities to new demandrequirements offer business opportunities in the future. This is mainly related to new storage products
IGU WOC 2 Basic Activity Study2000 – 2003
11
compared to the historical use of UGS. For example, peak capacities are becoming more important andcycling capacity can be improved by the development of additional injection capacities.
From the received replies the following additional comments can be derived.
Concerns were raised about the level of qualification and expertise of staff in the future which is requiredfor oncoming tasks and to maintain core competences.
Further new alternative opportunities for the UGS industry are limited. The topic of CO2 storage is underintensive investigation in several countries and may be a midterm opportunity. The storage of hydrogen isconsidered to be a long-term option > 2010. Helium Storage, as carried out for example in Cliffside Field,USA, is an option but of limited application.
Benchmarks for UGS operation are considered useful by 61 %, mainly to improve the efficiency of thestorage facilities. Technical benchmarking is preferred by a majority of 72 % in comparison to 23 % whichsupport commercial benchmarking.
Legal issues
It is impossible to discuss briefly relevant legal issues with respect to UGS in the world. Input frominteresting areas as America and United Kingdom was not accessible. Some selective general commentswill be summarized in the following only. Concerning legal developments in Europe the liberalisation of thegas market, the Gas Directive, the Security of Supply Directive, the Directive about major hazards(Seveso directive) and new national legislation related to mining are of relevance. The new Gas Directiveintends to allow for technical and economic open access to storage. Further details are provided inchapter 5.2.3 - Trends in the UGS business from a country perspective.
Concerning the approval of new developments, in some West European countries a lack of public accep-tance and increasing environmental requirements are observed.
Depending on the local or national situation there is no clear general trend as regards public acceptanceof new projects observed in Europe. However, more than half of the European comments indicate prob-lems in the smooth unhindered development of projects.
In some East European countries financial problems are hindering new developments and economicalbarriers are the main problem for potential investors. Due to the monopoly of a state owned company,storage service can only be sold to this company and the investor has no direct access to the market.
In West Europe the functional recommendations – CEN 1918-1-5 for the design, construction, operationand abandonment for the different storage types are in force. Canada has also developed UGS standards.A general comment from the replies was that no further regulations or standards are required.
Technological issues
The definition of a technological novelty differs from country to country, reflecting the level of expertiseand the specific (geological, etc.) situation. Therefore it is difficult to identify ”the“ important technologicaldevelopment relevant for the storage industry.
Based on all the received questionnaire replies a general summary was derived. The following areas oftechnological improvement and the main topics for the optimisation of existing storage facilities weresummarised as the most relevant topics:
• increase of cavern size (mega caverns up to a geometrical volume of 1x10⁶ m3)• welded casing/tubing

IGU WOC 2 Basic Activity Study2000 – 2003
12
• horizontal wells• integrated subsurface/surface reservoir management• subsurface optimisation by:
- increasing the min/max pressure range- water influx reduction by optimised injection/withdrawal utilization of storage- increasing max. withdrawal rates, for example by debottlenecking, increasing velocities- seismic reprocessing
• enhancement of surface facilities – e.g. new compressor seals- new dehydration technology (Vortex tube)- online monitoring of wells/facility- remote control- environmental monitoring
• reliability improvement• start up time reduction• “manless“ operation.
New requirements/tasks induced by recent market developments are coming up:
• reduction of minimum injection/withdrawal rate• injection capacity enhancements – resulting in an enhanced cycling capacity• fast changes of operational mode• production data management with respect to TPA• cost cutting analysis of facility.
Based on data from 106 UGS facilities in operation from the UGS Data Bank, conclusions about the typeof storage wells in pore storage can be drawn. A majority of 79 existing UGS (75%) were developed totallyby vertical wells, compared to only 3 facilities developed totally by horizontal wells. In 6 UGS only slantedwells were drilled. In the remaining UGS combinations of vertical, slanted and horizontal wells exist,mainly in a combination of slanted and vertical wells. Referring to the available database horizontal wellsare not applied on a broad scale. For oncoming projects more horizontal wells will be introduced. Out ofreported 22 planned storage projects 10 UGS still will be developed totally by vertical wells (45 %) and 7UGS totally by horizontal wells (32 %).
Feedback to the questions about applied seismic techniques in pore storage was received for 82 UGSfacilities in operation. Applied techniques are summarised in the following table:
UGS FacilitiesNo seismic applied 28 (34 %)2 D seismic applied 433 D seismic applied 23Time lapse technique 2Improved processing techniques 9
No seismic was applied in well known oil/gas fields and in cavern projects. In many cases 2D and 3Dseismic were applied in the same UGS in different development stages of the facility. In recent storagedevelopments and new ventures 3D seismic is predominant. The interesting time lapse technique is usedin a few locations only.
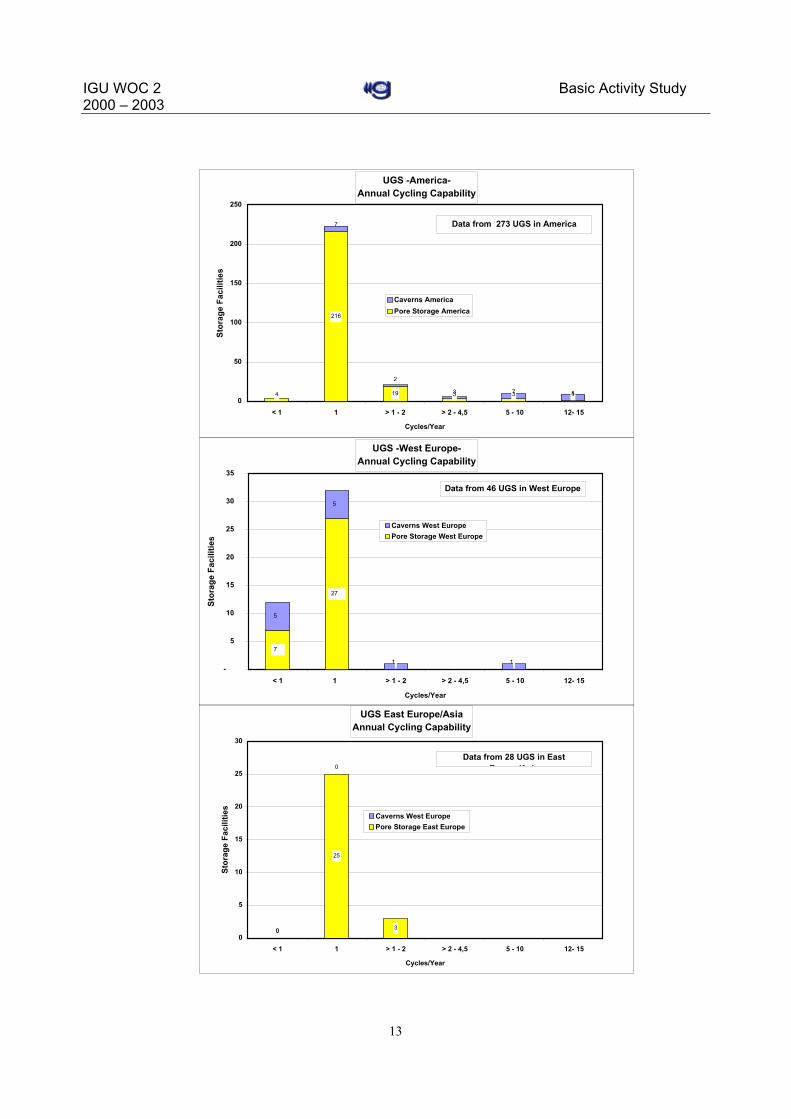
The annual cycling capability of storage facilities is an indicator for the integrated utilization of subsurfacecapacities by installed surface installations. Historically utilization of the capacity potential was quite lowdue to low installed injection capacities. The process of liberalisation required intensive utilization ofcapacities and reduction of specific storage costs, as observed in USA. The graph, presented overleaf,shows a comparison of the annual cycling capability for America, West Europe and East Europe/Asia.
IGU WOC 2 Basic Activity Study2000 – 2003
13
UGS -America- Annual Cycling Capability
4
216
19 3 3 1
7
2
3 7 80
50
100
150
200
250
< 1 1 > 1 - 2 > 2 - 4,5 5 - 10 12- 15
Cycles/Year
Stor
age
Faci
litie
s
Caverns AmericaPore Storage America
Data from 273 UGS in America
UGS -West Europe- Annual Cycling Capability
7
27
5
5
1 1 -
5
10
15
20
25
30
35
< 1 1 > 1 - 2 > 2 - 4,5 5 - 10 12- 15
Cycles/Year
Stor
age
Faci
litie
s
Caverns West EuropePore Storage West Europe
Data from 46 UGS in West Europe
UGS East Europe/AsiaAnnual Cycling Capability
0
25
30
0
0
5
10
15
20
25
30
< 1 1 > 1 - 2 > 2 - 4,5 5 - 10 12- 15
Cycles/Year
Stor
age
Faci
litie
s
Caverns West EuropePore Storage East Europe
Data from 28 UGS in East E /A i

IGU WOC 2 Basic Activity Study2000 – 2003
14
In America (see graph above), i.e. USA and Canada, the predominant utilization of storage facilities is stillone cycle/year. But the intensive use of UGS, mainly caverns, up to 15 cycles/year is obvious, resulting inspecific lower storage tariffs. 25 UGS operating at annual cycles > 2 were reported.
For East Europe and Japan (below) annual cycling capabilities of 1 to 2 are reported.
In West Europe (middle) mainly a capability of one cycle/year and only a few cases of higher cyclingcapability are reported. Even the cavern storage facilities are designed for one cycle/year and 12 facilitiesfor annual cycles < 1. This is mainly due to the existing installations which were constructed based on the“old” design. In the course of liberalisation in Europe enhancements of installations, i.e. mainlycompressors, may be carried out depending on demand. New storage projects may be designed for ahigher cycling capability. Reported cycling capabilities for planned projects are in the order of the “old”figures, 1 to 2. This topic is an area for improvements.
Concerning the topic of technical problems in UGS facilities, limited feedback to the questionnaire wasreceived. No problems were reported by 10 operators. A few problems reported by operators were relatedto water influx, H2S development treated by biocide injection, subsurface safety valve installation in oldcaverns, corrosion due to the gas quality, and low productivity, which was overcome by horizontal/lateralwells. The integrity of the casing/cemented annuli system of storage wells, which are much more exposedto pressure and temperature changes than normal gas production wells, is still an area of concern andresultant costs for repair jobs. There is a strong demand for improved completion and operations tech-niques in order to ensure UGS system integrity and to save costs.
The question of performance/capacity losses in UGS was raised in the study. From some 110 commentsreceived on individual storage facilities a clear majority of 86 % did not encounter any performance losses.Thus surprisingly only some 14 % reported performance losses. The conclusion is that either there existonly a few technical problems or performance losses or nobody is talking about problems in public.Especially in a period of major changes within the gas market competitors are not willing to discussproblems in their facilities.
It has to be noted, that about 12 storage facilities have been abandoned so far.
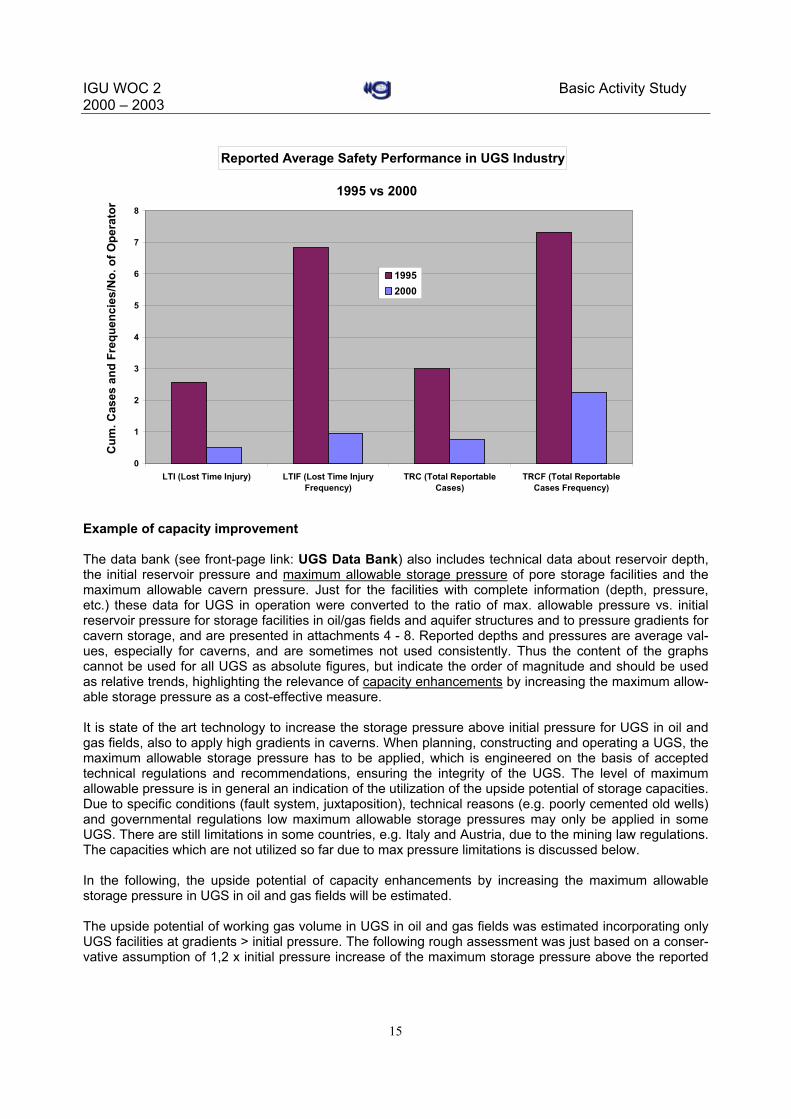
As in the ”old“ integrated gas companies no separate statistic on safety performance was available for thestorage business for the years 1995 and 2000. Only 50 % of the operators answered. Just incorporatingthe representative data, significant improvements (15- 30 %) in safety performance versus 1995 are clear,as shown by the following graph (see definitions in attachment 9):
IGU WOC 2 Basic Activity Study2000 – 2003
15
Reported Average Safety Performance in UGS Industry
0
1
2
3
4
5
6
7
8
LTI (Lost Time Injury) LTIF (Lost Time InjuryFrequency)
TRC (Total ReportableCases)
TRCF (Total ReportableCases Frequency)
Cum
. Cas
es a
nd F
requ
enci
es/N
o. o
f Ope
rato
r
19952000
1995 vs 2000
Example of capacity improvement
The data bank (see front-page link: UGS Data Bank) also includes technical data about reservoir depth,the initial reservoir pressure and maximum allowable storage pressure of pore storage facilities and themaximum allowable cavern pressure. Just for the facilities with complete information (depth, pressure,etc.) these data for UGS in operation were converted to the ratio of max. allowable pressure vs. initialreservoir pressure for storage facilities in oil/gas fields and aquifer structures and to pressure gradients forcavern storage, and are presented in attachments 4 - 8. Reported depths and pressures are average val-ues, especially for caverns, and are sometimes not used consistently. Thus the content of the graphscannot be used for all UGS as absolute figures, but indicate the order of magnitude and should be usedas relative trends, highlighting the relevance of capacity enhancements by increasing the maximum allow-able storage pressure as a cost-effective measure.
It is state of the art technology to increase the storage pressure above initial pressure for UGS in oil andgas fields, also to apply high gradients in caverns. When planning, constructing and operating a UGS, themaximum allowable storage pressure has to be applied, which is engineered on the basis of acceptedtechnical regulations and recommendations, ensuring the integrity of the UGS. The level of maximumallowable pressure is in general an indication of the utilization of the upside potential of storage capacities.Due to specific conditions (fault system, juxtaposition), technical reasons (e.g. poorly cemented old wells)and governmental regulations low maximum allowable storage pressures may only be applied in someUGS. There are still limitations in some countries, e.g. Italy and Austria, due to the mining law regulations.The capacities which are not utilized so far due to max pressure limitations is discussed below.
In the following, the upside potential of capacity enhancements by increasing the maximum allowablestorage pressure in UGS in oil and gas fields will be estimated.
The upside potential of working gas volume in UGS in oil and gas fields was estimated incorporating onlyUGS facilities at gradients > initial pressure. The following rough assessment was just based on a conser-vative assumption of 1,2 x initial pressure increase of the maximum storage pressure above the reported
IGU WOC 2 Basic Activity Study2000 – 2003
16
level. The applied vs. reported pressure gradient ratio is indicated in attachment 8 as an example, ignoringall potential reasons for the low pressure levels.
The study resulted, for UGS in oil and gas fields, in an upside potential of some 20x109m³ of working gasvolume all over the world and 13x109m³ of working gas volume excluding America, i.e. 11% or 12% of theinstalled capacities referred to. It is obvious that significant capacities can be developed in a cost-effectivemanner. In addition higher gradients may be applicable in specific UGS reservoirs.
It is strongly recommended to study this topic in more detail with respect to the theories and techniquesapplied for the engineering and verification of the maximum allowed storage pressure and for the moni-toring requirements.
5.2.3 Trends in the UGS business from a country perspective
Direct valuable contributions about the national situation and trends in the underground gas storage busi-ness were received from Austria, Denmark, Finland, France, Germany, Italy, Japan, the Netherlands,Poland and Russia. In addition a report from the Energy Information Administration (EIA) about a currentassessment in 2001 and near-term outlook in the United States was included. The contributions areincluded in this report +/- as received.
Austria
General:
According to latest reports covering the year 2001 Austria has imported 6.042x10⁶ m³, domestically pro-duced 1.732x10⁶ m³ and consumed 7.590x10⁶ m³. The difference covers own use and losses in domesticproduction and movements in storage inventories. Consumption of 7.590x10⁶m³ was 7% above the figurefor the very warm year 2000 and 1% above the all-time high of 1996.
Contracted volumes in UGS and sendout capacities were reduced from 2.245x10⁶ m³/23,0x106 m³/d in2000 to 2.106x10⁶ m³ /20,68x106 m³/d in 2001. The split among the two providers of gas storage servicesis presently OMV/Erdgas 1.606x10⁶ m³/15,68x106 m³/d and RAG 500x106 m³/5,00x106 m³/d.
Due to the different locations, OMV has the bulk of its facilities in the Eastern part and RAG has its facili-ties near the German border. Future market trends are viewed differently by OMV and RAG.
Both storage operators consider available working gas volumes to be too high (particularly in the East)while sendout capacity is still demanded. Reasons can be found in the single supply source from the Eastand diversification of today’s import supply. Furthermore OMV and RAG foresee changes in the demandstructure, leading away from seasonal storage to new products such as structuring, parking, etc.
RAG, with its centre of E&P activities in the federal provinces of Upper Austria and Salzburg, both locatednear the German border, forecasts additional demand in the South German gas markets as soon as liber-alisation has its impact on these markets.
Legal:
The amended gas law (GWG II) was passed in Parliament and came into effect on October 1, 2002.As far as gas storage is concerned it governs:- Access to gas storage has to be granted to producers, traders and suppliers, registered in an EU
country, on non-discriminatory and transparent terms. Rejection of an application is only possible forreasons specified in the law.

IGU WOC 2 Basic Activity Study2000 – 2003
17
- Tariffs are to be negotiated based on costs and equal treatment. Provable technical and geologicalrisks, together with opportunity costs, have to be adequately considered.
- In case tariffs for comparable and equal services provided in EU member states are 20 per centabove the average the Erdgas-Control-Kommission can stipulate by decree the cost elements to beused.
- Holders of storage contracts are obliged to submit all contracts to the Erdgas-Control-Kommission byOctober 15, 2002.
Construction and installations related to a UGS are regulated by the Austrian mining law (MinroG of No-vember 2002), together with other laws as needed. Deviating from EU standards, a UGS in Austria doesnot require an Environmental Impact Assessment (EIA) Report.Commissioning and supervision of a UGS facility are in the hands of the Austrian Mining Authority (oper-ating schedule).
Environmental:
Since safety and environmental matters are of major concern to the general public it is the good policy ofcompanies involved in Austria’s gas storage activities to make abundant information available in due timeand during all phases of planning, construction and operations to all persons who might be concerned.
Emission levels of all kinds and treatment of waste are regulated by a framework of laws and supervision,and control rests with the Mining Authority or an agency appointed for a specific task by the MiningAuthority (e.g. TÜV).
Technical:
As in the past, construction of a new or expansion of an existing facility will always be governed by tech-niques available at any given time.In Austria RAG started to drill horizontal wells in depleted gas reservoirs 9 years ago and installed full-bore completions with 7” diameter. Recent studies have shown that to step up the diameter to 9 5/8”would not bring significant advantages. Multi-lateral wells have been considered but have been shelvedfor the moment.Recent project works are all based on 3D seismic to allow the drilling of optimum well patterns. But it hadto be realised that due to complicated geological conditions drilling of pilot wells cannot be avoided insome instances.Increasing operational pressures above initial pressure has been rejected in the past by the MiningAuthorities, but a study commissioned by the Mining Authority and performed in the year 2000 in Germany(NLfB) has shown that operational pressures can be increased to 115 per cent of the initial pressure with-out major problems. Weak points needing special attention are, as can be expected, old wells in a de-pleted reservoir.Injecting inert gas as cushion gas has been considered, but has not yet reached such a status as to be aviable solution.Safety valves (SSSV) have been used on all recently completed new storage wells and will be used in allrecompleted old storage wells.
Denmark
Denmark will be on the way to a liberalised market from January 1, 2004 onwards, and the Danish gascompanies are preparing for the free market: As a consequence there are no developments of new gasstorage facilities for the time being.

IGU WOC 2 Basic Activity Study2000 – 2003
18
Finland
There is no natural gas storage in Finland. The only gas storage is the pipeline volume itself; enough forhalf a day’s consumption. Because most of the gas is delivered to industrial users and to power plants, thefluctuation in gas demand is lower than in Western Europe.
The soil in Finland is mainly hard Precambrian rock and due to the Ice Ages practically without sediments.The hard rock is suitable for excavated underground storages, but today the studies show excavated UGSto be uneconomic for natural gas. Many underground excavated rock caverns for HFO, LFOand LPG exist in Finland. One underground LPG storage (about 100.000 m³ LPG) is used as a back-upstorage for residential natural gas consumers. At the moment there are no plans to construct UGS in Fin-land.
France
– NATURAL GAS IN FRANCE : A QUICK OVERVIEW
In 2000, the proportion of total French energy consumption accounted for by natural gas was just under15% (14,7% in 1999), or around 450x109 kWh. This represents 24% of the total energy demand for in-dustry and 20% for the residential and tertiary sectors. In a year with an average climate, just under 40%of total gas sales are the result of commission on heating, 45% from industry and around 15% from thetertiary sector.
This percentage should continue to grow over the next decade, but should remain lower than that of natu-ral gas in Europe (23% in 1999). In 2001, France saw an increasing number of vehicles running on naturalgas (more than 700 buses and 4000 vehicles).
Cogeneration is also expanding, with a total of more than 5.000 installations in service in 2000, repre-senting around 25x109 kWh.
In 2001, 10,44x10⁶ customers were served by a 158.000 km distribution network.
Five supply points serve the interconnecting transmission network :
- TAISNIERES on the Belgian border receives natural gas from Norway and the Netherlands- OBERGAILBACH on the German border receives natural gas from Russia- DUNKERQUE (PITGAM), with the offshore ‘Franpipe’ pipeline reception terminal on the coast of the
North Sea receives natural gas from Norway- MONTOIR-DE-BRETAGNE receives liquefied natural gas from Algeria- FOS-SUR-MER receives liquefied natural gas from Algeria- The Lacq field, located in the south west, supplies most of the natural gas produced in France.
The natural gas supply policy in France is based on diversification of gas sources. What distinguishes thispolicy from others is its long-term contracts which maintain security of trade. In 2001, 30% of sales ofnatural gas came from Norway, with 25,5% from Russia, 25,5% from Algeria, 12% from the Netherlands,3% from United Kingdom and 4% from other sources (Nigeria, spot and short term).
– UNDERGROUND NATURAL GAS STORAGE IN FRANCE
Underground natural gas storage (UGS) meets the various needs associated with the organisation of con-sumption and the supply situation.

IGU WOC 2 Basic Activity Study2000 – 2003
19
Supplies in France come mainly from contracts signed with foreign suppliers. These are non-flexible, witha constant output of natural gas throughout the year. National natural gas resources (the Lacq field) andthose near to our borders (the Groningen field in the Netherlands) represent a relatively small proportionof the country’s global supply, not to mention the fact that these local supplies are tailing off.
Seasonal fluctuations in consumption are mainly linked to patterns in heating, Within this context,adjusting natural gas resources on a seasonal basis in line with consumption - seasonal balancing - is theprimary role of UGS.
In France, the critical temperature for heating demand is around 16°C. The critical temperature for with-drawal from UGS is around 10°C in Paris, which explains why there is little UGS fluctuation around 1 Apriland around 1 November with regular alternations in filling and withdrawing of storage.
This justifies dividing the gas year into two periods :
Winter : 5 months from 1 November to 31 March; Summer : 7 months from 1 April to 31 October.
As well as their function of seasonal balancing, UGS - according to the distance of our supply sources andthe risk of technical breakdowns in corresponding supply chains - play an important role in preventingproblems related to interruptions in supply.
Beyond the two main principles of seasonal balancing and supply security, underground gas storage siteshave an important role to play in regulating daily and weekly variations in sales, and in optimising the run-ning of the transmission network.
It should also be noted that appropriate geographical distribution of UGS in France will allow for a notice-able optimisation in the sizing of the transmission network. This situation is illustrated in particular duringcold spots in winter, when more than half of the amount sold in a single day comes from 14 storage sites,with the other half imported from 5 sites on the border.
In addition, storage sites allow yearly sales to be balanced with quantities imported, particularly by adapt-ing the filling programme for reservoirs in the build-up phase.
A final example of the use of UGS is as a controller of gas field production. In the 1960s, development ofthe Lacq field led to the development of the natural gas market in France; from the very beginning, theunderground gas storage facility at Lussagnet was closely linked to this development. The Lussagnetfacility allowed the rise in flow from natural gas purification plants to be absorbed as these plants werebuilt in successive stages over a ten-year period, and the facility still serves as a regulator during periodicdrops in production due to maintenance.
There are now 15 underground gas storage facilities in France, comprising :
• 12 facilities located in aquifer layers;
• 3 facilities located in salt cavities.
2 facilities are run by TotalFinaElf and 13 by Gaz de France.

IGU WOC 2 Basic Activity Study2000 – 2003
20
Storage Type Year commis-sioned
Depth of reser-voir top(metres)
Total volumestored
(106 m³)(winter
2001/2002)Beynes supérieur A 1956 400 450
Lussagnet (1) A 1957 600 2000Saint-Illiers-la-Ville A 1965 470 1450
Chémery A 1968 1085 7000Tersanne S 1970 1400 330
Cerville-Velaine A 1970 470 1500Beynes profond A 1975 740 760
Gournay-sur-Aronde A 1976 720 2500Etrez S 1979 1400 750
Saint-Clair-sur-Epte A 1979 740 850Soings-en-Sologne A 1981 1140 765
Izaute (1) A 1981 510 2750Germigny-ss-Coulombs A 1982 850 2500
Céré-la-Ronde A 1993 910 850Manosque (2) S 1993 900 400
A : aquifer S : salt cavities
(1) Storage operated by TOTALFINAELF (2) Storage operated by Gaz de France [GIEGéométhane (Gaz de France-Géostock)]
- TRENDS IN THE UGS BUSINESS IN FRANCE
From the legal point of view, rules for safety have been recently upgraded in France and their applicationto UGS facilities now integrates them in the “Seveso 2” regulation. It provides for the drawing up of com-plete safety studies based on detailed analysis of risks and organisation of emergency plans for both theoperator and the local authorities; it also includes provisions about the control of building constructionwithin a zone at a certain distance from the central station and the wells, directly depending on the resultsof the safety study. According to this regulation, the inhabitants of the surroundings of a site have also tobe informed of the potential risks by the operator.From the environmental point of view, important efforts have been made by the operators to develop inte-grated management systems for environmental protection, based on detailed environmental analysisstudies on every site. For instance GAZ DE FRANCE has even planned for 2003 to obtain an ISO 14000certificate for two facilities, one in an aquifer and one in salt caverns.
Concerning the development of capacities, it may be noted that the gas field of Trois-Fontaines (east ofthe Parisian basin) will be converted into a UGS by the end of the decade, and that some exploration workis being carried out on finding possible new sites in salt layers.
Storage needs in France are likely to continue increasing at the same rate as gas sales in the upcomingyears, whether or not TPA to storages is implemented according to the Gas Directive. It is thereforeexpected that due to the future development of gas trading with daily pricing, additional capacity offeredby cavities in bedded salt will be a good response thanks to their high daily injection and withdrawal flowrate.

IGU WOC 2 Basic Activity Study2000 – 2003
21
On the other hand, projects for developing new capacities in aquifers, especially in the south-west ofFrance, have recently been presented to the regulating authorities. These projects are also considered thegood response to the forecast lack of working volume on a long-term basis which results from the analysiscarried out to date.
Germany
General Trends:
Germany is an energy importing country. About 21 % of the total primary energy are provided by naturalgas. In 2001 about 100x109 m³ of natural gas were consumed. The following countries contribute to thesupply of gas:
Country Share in %2001 2000
Germany 18 19Netherlands 19 17
Norway 21 21Russia 36 37
Denmark and United Kingdom 6 6
The first UGS was developed in an aquifer near Hannover in 1953 by Ruhrgas AG and was abandoned in1999 for economic reasons.
In 2002 Germany has 42 underground gas storage facilities in operation with a total maximum allowableworking gas volume of 19,1x10⁹ m³, as shown in the following table:
PorousRock
Caverns Total
Total max. allowable working gas volume in operation(109 m³)
13,0 6,1 19,1
Total max. withdrawal rate 106 m³/day 201,7 236,2 437,9
Theoretical deliverability in days* 65 26 44
Number of storages in operation 23 19 42
Total max. allowable working gas volume in planned stor-age facilities (109 m³)
0,6 3,8 4,5
Number of planned storages 2 12 14
Expected total max. allowable working gas volume in op-erated and planned storage facilities (109 m³)
13,6 9,9 23,5
* assuming constant rate over time
About 50 % of the present working gas volume is available in 4 facilities (Rehden, Epe, Dötlingen, Bier-wang). Most of the planned volume will be developed in salt caverns in existing storage facilities byleaching additional salt caverns.

IGU WOC 2 Basic Activity Study2000 – 2003
22
The development of the working gas volume since the beginning of UGS operation in Germany is shownin the graph.
During the last decade the existing working gas volume has more than doubled. The number of plannedprojects has decreased because these projects, especially Rehden, were finalised. Germany providesUGS services for the Czech Republic.
There is no national monopoly on gas transportation and distribution. There are many UGS operatorslisted, for example in the tables of the yearly report on UGS (website see below).
Due to favourable geological conditions in North and South Germany sufficient additional storage volumecan be developed in salt rock (only in N Germany) and porous rock (mainly in depleted hydrocarbon res-ervoirs in both areas) to meet the needs of future UGS capacities.
In Germany the consumption of gas is expected to increase from about 100x109 m³ in 2001 to 122x109 m³in the year 2020. A further increase in UGS working gas volume is thus expected.
Some of the German storage companies are involved in the domestic E&P and in storage business. Theholders of an exploration permit do not implicitly have the right in North Germany to obtain a permit tooperate storage facilities. New applications for storage permission ("Betriebsplanantrag") are requiredindependent of existing exploration or production permits. This application and the operation of UGS aresubject to regulations according to the mining law of 1980 (“Bundesberggesetz”). The acquired subsurface(geological) data are submitted to the geological surveying authorities in accordance with the mineral law("Lagerstättengesetz"). There is no specific tax on exploration and operational activity at undergroundstorage sites.
Environmental Aspects:
Exploration and operation activities in UGS are subject to environmental impact assessments ("Umwelt-verträglichkeitsprüfung") and to public inquiry. The leaching of salt caverns is, except for the use of brinein the chemical industry, dependent on permission to dispose of the brine, for example in aquifer reser-voirs or the sea.

IGU WOC 2 Basic Activity Study2000 – 2003
23
Gas Market Structure:
The structure of natural gas consumption in Germany indicates the greatest share for the household &commercial sector. Second place is taken by the industrial sector, followed by the power generation sec-tor. This structure will change in the long run (2020). There will be a growth in gas consumption of about1,7 %/year from 2001 to the year 2020. Gas market share will drop from 47% to 43% in the residen-tial/commercial sector and from 28% to 21% in the industrial sector, and will rise from 12% to 27% in thepower sector. Future gas consumption might be affected by political trends, especially by decisions withrespect to the future use of nuclear plants which might be substituted by natural gas power plants.
In 2000 the liberalisation of the German gas market started ("Verbändevereinbarungen" - AssociationAgreements). Despite the fact that there was no European requirement to open access to storage, Ger-many voluntarily introduced third party access to storage. At present it cannot be predicted how this regu-lation will affect the development of the working gas volumes in operation and the competitiveness of UGSin Germany.
Technology:
Due to favourable geological conditions (overburden rocks) high operational pressures are run in someUGS. Due to this fact a high standard of monitoring of the technical integrity of the storage wells and theoverburden rocks is ensured.A large number of horizontal UGS wells have been drilled during the last few years. In depleted reservoirswith a low reservoir pressure new types of low pressure mud systems are used to prevent formation dam-age. Generally drilling of new wells is based on 3-D seismic surveys, followed by comprehensive 3-Dmodelling and simulation of the storage dynamics. Most of the UGS have installed subsurface safetyvalves (SSSV).
Documents, websites:
A yearly report about UGS in Germany is available as a pdf file:http://www.nlfb.de/index.htm?/rohstoffe/anwendungsgebiete/kohlenwass_1.htm
The following document gives further information on the legislation under mining law:Deutsches Bergrecht - Textsammlung bergrechtlicher Vorschriften des Bundes und der Länder - 1996.
ItalyGeneral
According to storage service demand in terms of working gas and peak capacity of the Thermal Year2002-2003, storage needs in the short term appear higher than the available storage capacity.
So great interest from gas operators (mostly shippers) in UGS is demonstrated from the attention to thefirst round of bidding for the first 10 fields consisting of depleted gas reservoirs (shut in or in the finalproduction phase). 7 Gas Companies offered for 8 of the 10 fields.
This interest of shippers in obtaining licences for new UGS is caused by the possibility, as allowed for newLNG plants and already contained in a new law proposed by the Production Activity Ministry, to dedicateto itself up to 80% of the developed working gas.
On the other hand the present UGS operators have provided a short term program to improve mostlyworking capacity to comply with this demand.In summer 2002 some 800x106 m³ of working gas were offered to the market by the main Operator as aresult of improved capacity of existing UGS by increasing operating pressure in particularly above the
IGU WOC 2 Basic Activity Study2000 – 2003
24
original pressure. It seems necessary for the main operator to carry out some portfolio assessment inorder to be ready for a future open and no longer regulated market.
First innovative services such as reverse cycle stream, parking etc. are already established, while otherinnovative services are under study and depend on the actual development of the liberalised market andthe constraints of authority rules.
Legal
From the point of view of Italian laws, the gas market is completely liberalised. TPA access to the storagesystem and transmission system is fully guaranteed.
Nevertheless in UGS there is a dominant position (more than 90% of storage total capacity) of the Statecompany (ENI) (State stocks are now less than 30%). Therefore the Electricity and Gas Authority haveregulated the storage system and imposed storage service tariffs on the State company. As mentionedabove, for the next new UGS legislation 80% of capacity should be guaranteed to the investor.
A further improvement is the possibility of overcoming initial pressure in order to match the future shortterm needs of UGS capacity satisfying the technical and safety conditions. A first pilot has beenauthorised and is already in operation.
It is foreseen that a new storage code necessary to comply with the current storage market (the previouscode was considered a part of or integrated in E&P operation) will be issued in the next few months.
This code should comply with the possibility of operating the field at pressures higher than the originalpressure and operating and developing other types of UGS (aquifer, cavern etc.), and should contain thetechnical conditions for the above topics.
Environmental
It appears that there will be no particular constraints on present or future UGS operation from present ornext future environmental laws except for the necessity to comply with the Kyoto protocol for greenhouseeffect emission and the need to revamp plants to meet these requirements. Since present and future UGSwill be of the depleted gas reservoir type, no particular problem will arise for water or brine disposal.
Technical
Extension of 3D or 4D seismic to all reservoirs in order to benefit from more reliable static and dynamicmodels has been almost completely achieved.Horizontal drilling is the technique which appears to be the solution for cost reduction in future devel-opments in existing or new UGS.Other technical achievements and improvements are derived directly from E&P operations improvementi.e. for drilling, completion, logging, seismic, plants and surface facilities (gathering, treatment plants,compression etc.).

IGU WOC 2 Basic Activity Study2000 – 2003
25
Japan
Summary
The total potential capacity of underground gas storage in Japan is estimated at 26,5x10⁹ m³, or more thanthe amount of domestic gas consumption for 4 months. Five depleted gas fields in Niigata Prefecturehave been utilized for underground storage. As Niigata is distant from the major metropolitan areas whilenationwide pipeline networks are non-existent in Japan, the gas produced in the region is used primarilyfor local industrial and commercial purposes. The aforementioned five underground storage facilities areused only on a limited scale as emergency storage and/or peak shaving capacity for these demands.
Study for further utilization
As a country lacking in underground resources, Japan relies on imported LNG for 97% of domestic naturalgas consumption. There are 25 LNG receiving terminals in total, most of which are located near the largecities. For seasonal gap absorption and emergency storage the LNG tanks in these terminals are utilized.The use of depleted gas fields as underground storage facilities dates back to a governmentally subsi-dised experiment which started in 1968. Since then, the use of underground storage facilities for seasonaldemand gap absorption and emergency storage has been repeatedly studied so as to substitute expen-sive LNG tanks.
Nearly 40 oil and gas reservoirs in Japan which have been depleted after years of production are consid-ered as candidates for natural gas storage with a total capacity of 26,5x10⁹ m³. Although domestic gasproducers have operated only five of these for storage purposes, increasing natural gas demand willrequire taking full advantage of these reservoirs. However, as pipelines to the demand areas are not welldeveloped, the underground storage facilities have not yet been utilized on a large scale.
Legal issues
Discussions on deregulation are actively held in Japan in both the public and private sectors. As a resultof the ongoing deregulation in the energy market, major Japanese gas companies are obliged to offeropen access to their pipelines to third parties. The possible introduction of third party access (TPA) toLNG terminals is also currently being debated. It is generally understood that mandatory TPA will not beintroduced for LNG terminals. There has been no discussion on TPA to underground storage facilitiesbecause of very limited use in Japan.
Technical focuses
One of the recent technological agendas in the area of utilization of depleted gas fields is the developmentof a simulation system which predicts changes in the heat value of withdrawn gas taking place whengases with different compositions are repeatedly injected. An idea to construct lined rock caverns alonggas pipelines for peak shaving purposes has also been examined, led by gas utilities. A study on the in-jection of CO2 in underground storages has commenced.
The Netherlands
Background
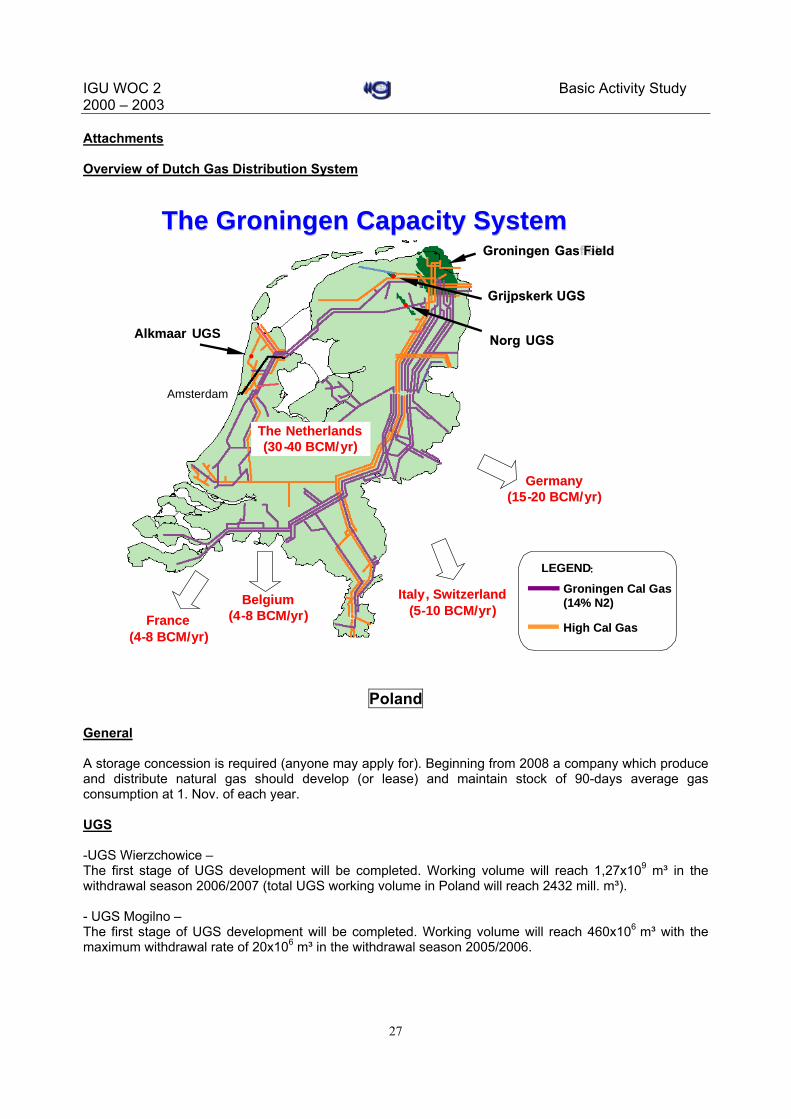
In the Netherlands the so-called “small fields policy” has successfully promoted exploration for and ex-ploitation of new gas reserves since 1974. The main source of flexibility of the gas supply system is pro-vided by the Groningen system, allowing the “small fields” to produce at a relatively high load factor. TheGroningen system consists of the Groningen field (296 wells) and three UGS facilities.

IGU WOC 2 Basic Activity Study2000 – 2003
26
The Groningen gas field is operated by NAM (50% Shell, 50% ExxonMobil) and has an expected ultimategas recovery of approx. 2800x109 m³, of which approx. 60% has been produced. Currently a full upgradeof the production facilities and installation of compression is in progress. The field can currently supply ap-prox. 310x106 m³/d peak capacity at a ramp up of approx. 120x106 m³ in one hour.
UGS
Of the three UGS facilities, two are operated by NAM (Grijpskerk, Norg) and one is operated by BP-Amoco (Alkmaar). The UGS facilities were built in the mid-1990’s. They can provide a total sendout (endwinter capacity) of approx. 140x106 m³/d (5,8x10⁶ m³/h). The UGS reservoirs have a total working volumeof approx. 2,4x10⁹ m³ at the stated capacity.
The UGS were designed to cater for winter peak demands given the declining reservoir pressure andcapacity of the Groningen field. Relatively small injection capacity was installed, with limited flexibility inorder to accommodate gas from small fields in the summer periods. The UGS have long-term contractswith Gasunie.
Legal:
As part of the ongoing European liberalisation efforts the Dutch regulator (DTe) has indicated that asubstantial part of the Dutch UGS should be made available for Third Party Access (TPA). The objectiveof the regulator is to increase trade and the efficient operation of the UGS by both owners and users whilstcreating a healthy investment climate. In order to achieve these objectives the DTe has issued guidelines,which the storage owner should adhere to when offering storage services to the market.
Although the NAM UGS have been designed, built and operated for production purposes and therefore donot fall under the Gas Act and under the jurisdiction of DTe, NAM, together with Gasunie, has decided tomake a certain amount of capacity available as NAM/Gasunie wish to co-operate with the overall EU lib-eralisation efforts.
Environmental/social:
There is a general trend to increase energy efficiency and to limit the environmental impact of operationsas much as reasonably possible (zero impact if possible). Construction of new facilities requiresinvolvement of neighbours in the design of facilities (visual impact, safety) and landscaping aroundfacilities.
Technical aspects:
State of the art technology is employed in the Groningen system in order to maximise operational flexibilityand minimise cost.
Business:
At the moment there is a general trend to postpone investments given the uncertainty of a liberalisingmarket. On the one hand market share and associated capacity demand forecasts have become moreuncertain. On the other hand investments in providing security of supply – the Groningen system isdesigned to fail less than once in 50 years – may partially be taken over by more interruptible types ofcontract in the future.
The legal framework for the gas industry in the Netherlands is currently under political review. First stepshave been taken, for example separating transport from trade and supply within Gasunie. More changesare expected in the future in order to comply with the European drive of gas market liberalisation.
IGU WOC 2 Basic Activity Study2000 – 2003
27
Attachments
Overview of Dutch Gas Distribution System
Grijpskerk UGSGrijpskerk UGS
NorgNorg UGSUGS
GermanyGermany(15(15--20 BCM/20 BCM/yryr))
BelgiumBelgium(4(4--8 BCM/8 BCM/yryr))
GroningenGroningen GasfieldGas Field
Amsterdam
Groningen Cal GasGroningen Cal Gas(14% N2)(14% N2)
High Cal GasHigh Cal Gas
LEGENDLEGEND::
AlkmaarAlkmaar UGSUGS
The Groningen Capacity SystemThe Groningen Capacity System
FranceFrance(4(4--8 BCM/8 BCM/yryr))
ItalyItaly,, SwitzerlandSwitzerland(5(5--10 BCM/10 BCM/yryr))
TheThe NetherlandsNetherlands(30(30--40 BCM/40 BCM/yryr))
Poland
General
A storage concession is required (anyone may apply for). Beginning from 2008 a company which produceand distribute natural gas should develop (or lease) and maintain stock of 90-days average gasconsumption at 1. Nov. of each year.
UGS
-UGS Wierzchowice –The first stage of UGS development will be completed. Working volume will reach 1,27x10⁹ m³ in thewithdrawal season 2006/2007 (total UGS working volume in Poland will reach 2432 mill. m³).
- UGS Mogilno –The first stage of UGS development will be completed. Working volume will reach 460x106 m³ with themaximum withdrawal rate of 20x106 m³ in the withdrawal season 2005/2006.

IGU WOC 2 Basic Activity Study2000 – 2003
28
- No UGS for low methane natural gas (LMNG) system will be developed in the near future. The nitrogenremoval plant in Odolanow, as a regulator for LMNG GZ35 (higher Wobbe index 32,5-37,5 MJ/m³), pro-vides arbitrage between two gas systems LMNG GZ35 and high methane natural gas GZ50 (higherWobbe index 45,0-54,0 MJ/m³).
- LMNG GZ41 (higher Wobbe index 37,5-45,0 MJ/m³) system will be developed and the excess fields’production rates will cover the fluctuations of gas consumer needs.
- The owner of POGC (State Treasury represented by the Ministry of the State Treasury) will not be priva-tising the transmission and storage company in the near future.
- So far POGC has not been offering UGS services separately. No UGS tariffs are published. The secon-dary legislation to the energy law (gas tariffs bill) covers the methodology of storage tariff calculation.
- There are some projects for developing independent UGS facilities – none seems feasible before realderegulation of the gas market.
Russia
General
In 1996 a small UGS on Sakhalin island operated by SakhalinMorNetegaz (Oil & Gas Co) was added tothe total number of 21 UGS operated by Gazprom. In 1998 the Uvyazovskoe UGS was commissioned byGazprom. So the total number of UGS in Russia reached 23 storage facilities (22 owned and operated byGazprom), located mainly in the European part of Russia. Only two of them are located in the Asian part:
UGS Punginskoe – in the northern part of Western Siberia UGS Kydylan’ee – on Sakhalin island.
17 storages are operated in depleted gas fields; 6 storages were constructed in aquifers near main indus-trial centres in the central and NW part of Russia.Most of the storage facilities have unique geological or technical characteristics:
Kalugskoe – peak shaving storage in aquifer with complex geological structure, first UGS in Rus-sia;
Gatchinskoe – operated during 40 years in practically horizontal aquifer; Schelkovskoe – aquifer with low closure and strong water drive; Kasimovskoe – world’s largest UGS in aquifer (total gas volume is 19x109m³); Severo-Stavropolskoe – world’s largest UGS in depleted oil/gas fields (total working gas volume in
two horizons excl. long-term gas reserves is more than 23x109 m³); the Khadum layer is operatedat a very low working pressure range (11-25 bar) by using compressors during withdrawal period;
Kuschevkoe – wide implementation of horizontal wells in a low permeable reservoir with clusterpattern of wellheads;
Krasnodarskoe – UGS created in fully water-flooded gas field, the coefficient of excess max.pressure above initial pressure is 1,35;
Nevskoe – aquifer with low closure, small thickness, implementation of deviated wells; Uvyazovskoe – newest UGS created in an aquifer, modern, fully automated, with cluster pattern of
wellheads and deviated wells.
The total working gas volume has been increasing since the collapse of the USSR and had reached theex-USSR level of about 80x109 m³ by 1998. The total working gas volume has now reached 90x109 m³, ofwhich 30x109 m³ are dedicated for long-term reserves. Due to Gazprom’s strategy the UGS system fulfilsthe following functions:
Seasonal balancing of domestic consumption;

IGU WOC 2 Basic Activity Study2000 – 2003
29
Security of supply on Unified Gas Supply System; Seasonal balancing of gas exports; Storage of gas for extremely severe winters; Long-term reserves (balancing over years).
A few storages are now under construction and exploration. It is expected that in 2003 a new UGS –Karashurskoe will be commissioned. It is a first of the Udmurd UGS Complex. 2 UGS in a salt formationare now under construction – Kaliningradskoe and Volgogradskoe. It is planned to develop UGS facilitiesalong new possible routes for exporting gas to China.
So far as Russia has developed the UGS in aquifer structures, there are no geological limitations onmaximum allowable pressure for UGS; this also holds for depleted gas fields. Due to extensive researchand long operational experience the usual maximum allowable pressure in reservoirs can be in the rangeof 1,35 – 1,55 (average: 1,45) above initial reservoir pressure. Nevertheless the record of 1,77 was regis-tered by experience of VNIIGAZ (main technological research centre of Gazprom).
Legal
It is expected that at the end of 2002 a gas exchange will start, when about 5% of Gazprom‘s gas produc-tion and gas of independent producers (i.e. oil companies) will be sold at market price. The first attempt touse UGS for gas exchange might be carried out during the winter season 2002-2003.
Environmental
A policy of Gazprom is to inform frankly about environmental conditions related to UGS and about all envi-ronmental activities carried out by Gazprom. During 1998-2001 Gazprom’s research centre -VNIIGAZ-together with Wintershall AG (Germany) explored the environmental situation around Russia’s largestUGS (Kasimoskoe and Uvyazovskoe) and UGS Rehden in Germany. The results of these studies provedgood environmental conditions around this large Russian UGS. A joint Russian-German report with theresults will be presented at the International Gas Conference in Tokio in 2003.
The next storage for the joint international environmental audit will be UGS Kalugskoe (the oldest in Rus-sia).
Such investigations are strongly supported by Gazprom. The results of environmentally friendly technol-ogy implementation at the UGS of Mostransgaz (Gazprom) were rewarded by a Gazprom Prize in 2001.
Technical:
Gazprom is rapidly developing the daily withdrawal capacity of the UGS system. During the post-Sovietperiod the total maximum output of all UGS was increased twice and reached 520x106 m³ per day in 2002.In the year 2010 the total maximum output will reach 700x106 m³ per day and a plateau output duringDecember to February of 600x106 m³ per day.
Technically this goal will be reached by creating a new peak-shaving storage such as Talovskoe (with-drawal period is 25-40 days), Udmurd UGS Complex, Kaliningradskoe and Volgogradskoe in salt caverns.UGS in operation are being reconstructed using new technologies and techniques:
High productivity wells (with horizontal wells, large tubing diameters, new types of well screen andgravel pack, new completion, etc.);
Better reservoir management (complex reservoir and surface facilities simulation and manage-ment, directional drilling, optimal mode of injection and withdrawal);
Wide implementation of automation systems.

IGU WOC 2 Basic Activity Study2000 – 2003
30
New technologies and techniques in gas dehydration and compression will also lead to cutting operationalcosts.It is planned to inject gas into the depleted Terklinskoe oil field for enhanced oil recovery.
United States of America
(Extract from - A Current Assessment and Near-Term Outlook Natural Gas Storage in the United States in2001 by James Tobin and James Thompson, Energy Information Administration)
Shifts in Storage Use - Impact on Inventories and Storage Activities
The natural gas industry is also experiencing low storage inventories this heating season because ofchanges in inventory management practices and storage utilization over the past decade as a result ofmarket restructuring. During that time, the operational practices of many U.S. underground storage sitesbecame much more market-oriented. Many storage gas owners (marketers and other third parties) areminimizing inventories in an attempt to synchronize their buying and selling activities more effectively withmarket needs while minimizing their business costs.
Reflecting the change in focus within the natural gas storage industry during recent years, the largestgrowth in daily withdrawal capability has been from high-deliverability storage sites, which are mainly saltcavern storage reservoirs.
These facilities can cycle their inventories more rapidly than can other types of storage, a feature moresuitable to the flexible operational needs of today's storage users. Currently, on average, high-deliverabil-ity storage facilities cycle their inventories 2,1 times per year, compared with 0,78 for depleted reservoirsand 0,6 for aquifers. Since 1993, when access to interstate underground natural gas storage becamecompletely open, daily withdrawal capability from high-deliverability storage facilities has grown by 62 percent and the number of sites has increased from 21 to 27. During this same period, the average cyclingrate at these sites increased from 1,66 in 1993 to 2,10 in 2000, as marketers, electric generation, andother variable-load customers have made increasing use of the unique service features of this type ofstorage. Interestingly, although five new (greenfield) storage facilities were developed in the United Statesbetween 1996 and 2000, the bulk of new working gas capacity and growth in daily (withdrawal) deliver-ability (about 4 per cent in each category) during that time came from expansions to all types of existingstorage sites.
The increasing influence of high-deliverability storage may change the meaning of the inventory levels.For instance, because gas can be rapidly injected and withdrawn from these sites, how full they are onNovember 1 has less significance than inventory levels for depleted reservoir or aquifer storage, which aredesigned to cycle (deplete) their inventories once a heating season. Most high-deliverability sites are de-signed to cycle their inventory as rapidly as once a month although none currently operate at such a highrate. Whereas the high-deliverability sites in the Producing Region make up only 11 per cent of the totalworking gas capacity, the capacity has different potentials than other sites. For example, a high-deliver-ability facility with a working gas capacity of 28,3x10⁶ m³ theoretically could cycle 12x106 m³ during acalendar year. A site that is only 50 per cent full at the end of a given month could be 100 per cent full orheavily depleted some time during the month. The storage operations of such a site are not dictated bythe seasonal need to store gas as a backup, but rather are a function of customer needs as they occur.

IGU WOC 2 Basic Activity Study2000 – 2003
31
6. Lessons learned, further improvement and proposals for the next triennium
The Basic Activity Study was developed for the first time and is planned as a standing item in the followingtrienniums. Further improvements are proposed for the oncoming Triennium:
• Continuous completion of database, especially incorporating ”new“ storage countries and plannedprojects
• Participation of additional countries and active participants in the study work for data collectionand derivation of trends
• Development of a standard data bank platform on the IGU website• Extended incorporation of status and trends of the storage industry on a country basis• Development of prognosis on storage demand.
7. Contact Address
In case of any additional questions and for support please contact:
Joachim WallbrechtBEB Erdgas und Erdöl GmbHRiethorst 12D-30659 HannoverGermany
: +49-(0)511 - 641-2294Fax: +49-(0)511 - 641-2266e-mail: [email protected]

IGU WOC 2 Basic Activity Study2000 – 2003
32
8. Attachments
Attachment 1 - Study Group Members
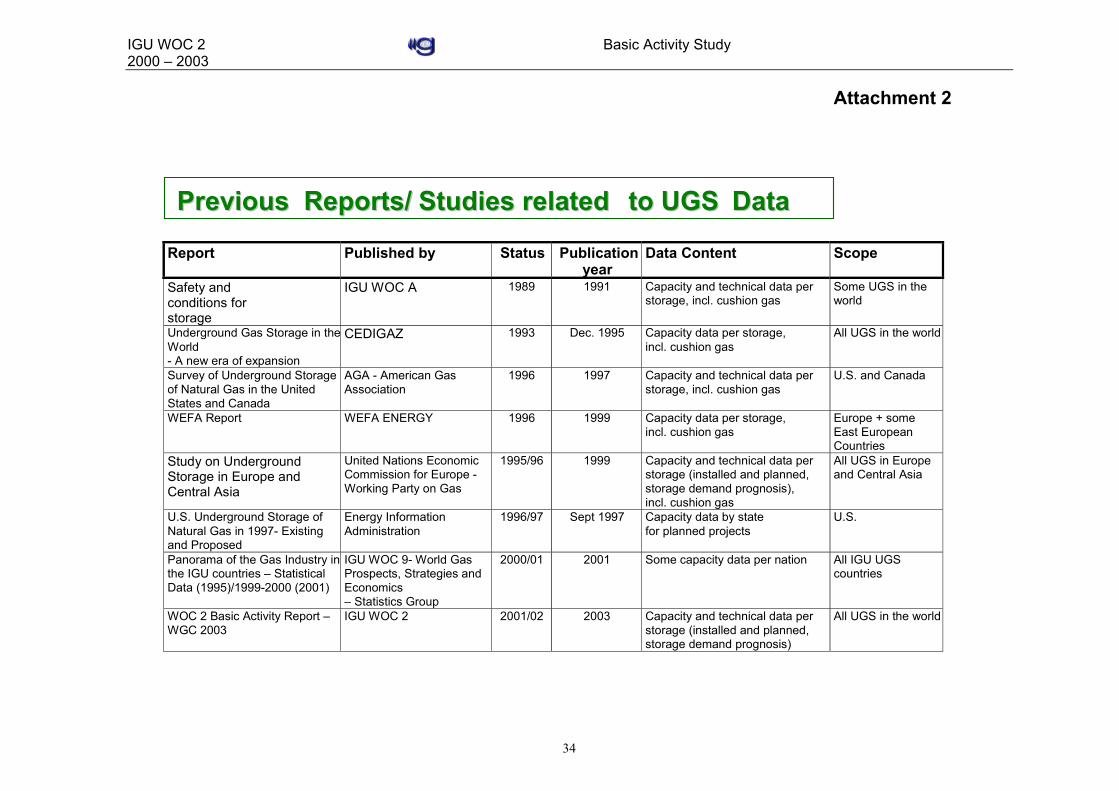
Attachment 2 - Previous Reports/Studies related to UGS Data
Attachment 3 - Summary- UGS in the World
Attachment 4 - Max. Storage Pressure in UGS in Oil Gas Fields - America
Attachment 5 - Max. Storage Pressure in UGS in Oil Gas Fields – World excl. America
Attachment 6 - Max. Storage Pressure in UGS in Aquifer Storage Facilities
Attachment 7 - Max. Storage Pressure in UGS in Cavern Storage Facilities
Attachment 8 - Max. Storage Pressure in UGS in Oil/Gas Fields – Upside Potential
Attachment 9 - Relevant Terms – Units and Definitions
IGU WOC 2 Basic Activity Study2000 – 2003
33
Attachment 1
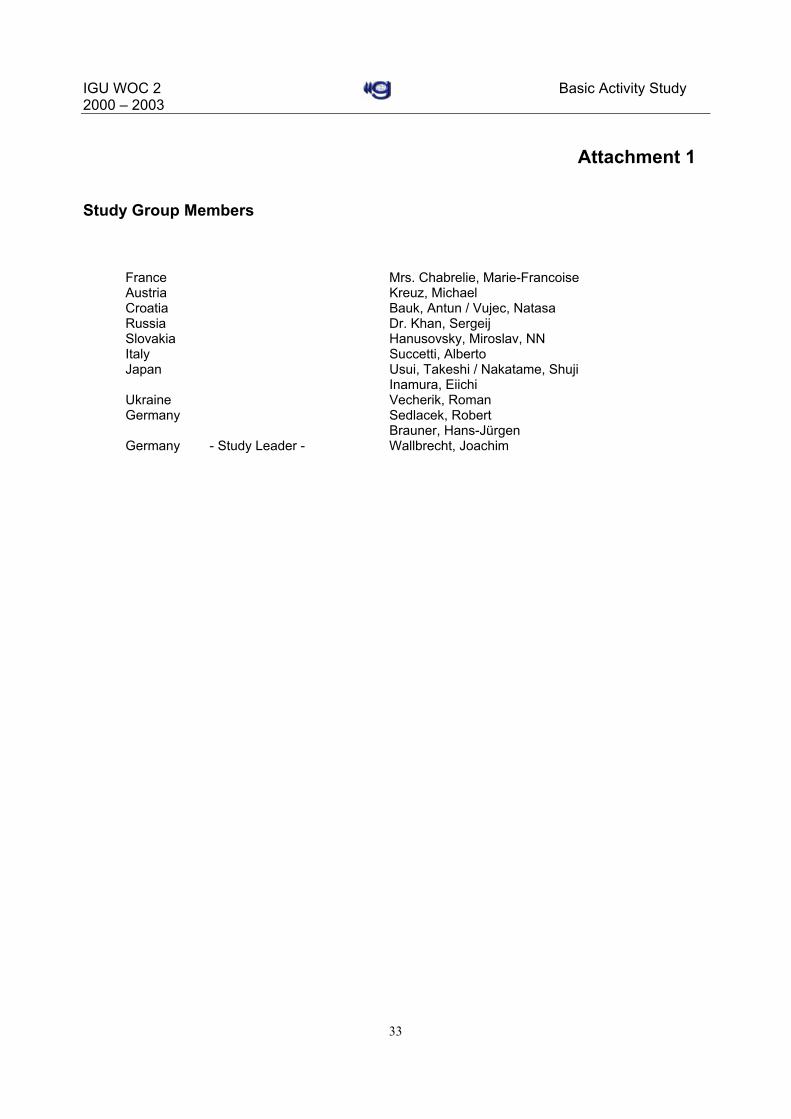
Study Group Members
France Mrs. Chabrelie, Marie-FrancoiseAustria Kreuz, MichaelCroatia Bauk, Antun / Vujec, NatasaRussia Dr. Khan, SergeijSlovakia Hanusovsky, Miroslav, NNItaly Succetti, AlbertoJapan Usui, Takeshi / Nakatame, Shuji
Inamura, EiichiUkraine Vecherik, RomanGermany Sedlacek, Robert
Brauner, Hans-JürgenGermany - Study Leader - Wallbrecht, Joachim
IGU WOC 2 Basic Activity Study2000 – 2003
34
Attachment 2
PreviousPrevious Reports/Reports/ Studies relatedStudies related to UGSto UGS DataData
Report Published by Status Publicationyear
Data Content Scope
Safety andconditions forstorage
IGU WOC A 1989 1991 Capacity and technical data perstorage, incl. cushion gas
Some UGS in theworld
Underground Gas Storage in theWorld- A new era of expansion
CEDIGAZ 1993 Dec. 1995 Capacity data per storage,incl. cushion gas
All UGS in the world
Survey of Underground Storageof Natural Gas in the UnitedStates and Canada
AGA - American GasAssociation
1996 1997 Capacity and technical data perstorage, incl. cushion gas
U.S. and Canada
WEFA Report WEFA ENERGY 1996 1999 Capacity data per storage,incl. cushion gas
Europe + someEast EuropeanCountries
Study on UndergroundStorage in Europe andCentral Asia
United Nations EconomicCommission for Europe -Working Party on Gas
1995/96 1999 Capacity and technical data perstorage (installed and planned,storage demand prognosis),incl. cushion gas
All UGS in Europeand Central Asia
U.S. Underground Storage ofNatural Gas in 1997- Existingand Proposed
Energy InformationAdministration
1996/97 Sept 1997 Capacity data by statefor planned projects
U.S.
Panorama of the Gas Industry inthe IGU countries – StatisticalData (1995)/1999-2000 (2001)
IGU WOC 9- World GasProspects, Strategies andEconomics– Statistics Group
2000/01 2001 Some capacity data per nation All IGU UGScountries
WOC 2 Basic Activity Report –WGC 2003
IGU WOC 2 2001/02 2003 Capacity and technical data perstorage (installed and planned,storage demand prognosis)
All UGS in the world
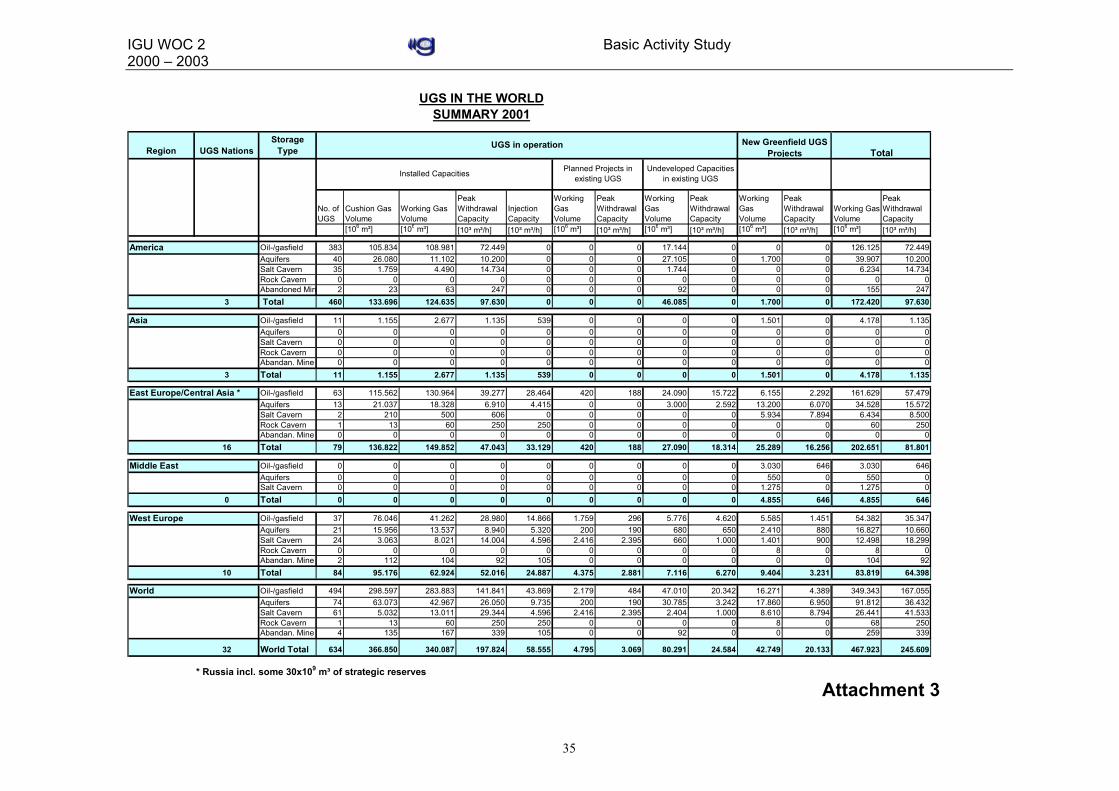
IGU WOC 2 Basic Activity Study2000 – 2003
35
UGS IN THE WORLDSUMMARY 2001
Region UGS NationsStorage
Type
No. of UGS
Cushion Gas Volume
Working Gas Volume
Peak Withdrawal Capacity
Injection Capacity
Working Gas Volume
Peak Withdrawal Capacity
Working Gas Volume
Peak Withdrawal Capacity
Working Gas Volume
Peak Withdrawal Capacity
[106 m³] [106 m³] [10³ m³/h] [10³ m³/h] [106 m³] [10³ m³/h] [106 m³] [10³ m³/h] [106 m³] [10³ m³/h]
America Oil-/gasfield 383 105.834 108.981 72.449 0 0 0 17.144 0 0 0Aquifers 40 26.080 11.102 10.200 0 0 0 27.105 0 1.700 0Salt Cavern 35 1.759 4.490 14.734 0 0 0 1.744 0 0 0Rock Cavern 0 0 0 0 0 0 0 0 0 0 0Abandoned Min 2 23 63 247 0 0 0 92 0 0 0
3 Total 460 133.696 124.635 97.630 0 0 0 46.085 0 1.700 0
Asia Oil-/gasfield 11 1.155 2.677 1.135 539 0 0 0 0 1.501 0Aquifers 0 0 0 0 0 0 0 0 0 0 0Salt Cavern 0 0 0 0 0 0 0 0 0 0 0Rock Cavern 0 0 0 0 0 0 0 0 0 0 0Abandan. Mine 0 0 0 0 0 0 0 0 0 0 0
3 Total 11 1.155 2.677 1.135 539 0 0 0 0 1.501 0
East Europe/Central Asia * Oil-/gasfield 63 115.562 130.964 39.277 28.464 420 188 24.090 15.722 6.155 2.292Aquifers 13 21.037 18.328 6.910 4.415 0 0 3.000 2.592 13.200 6.070Salt Cavern 2 210 500 606 0 0 0 0 0 5.934 7.894Rock Cavern 1 13 60 250 250 0 0 0 0 0 0Abandan. Mine 0 0 0 0 0 0 0 0 0 0 0
16 Total 79 136.822 149.852 47.043 33.129 420 188 27.090 18.314 25.289 16.256
Middle East Oil-/gasfield 0 0 0 0 0 0 0 0 0 3.030 646Aquifers 0 0 0 0 0 0 0 0 0 550 0Salt Cavern 0 0 0 0 0 0 0 0 0 1.275 0
0 Total 0 0 0 0 0 0 0 0 0 4.855 646
West Europe Oil-/gasfield 37 76.046 41.262 28.980 14.866 1.759 296 5.776 4.620 5.585 1.451Aquifers 21 15.956 13.537 8.940 5.320 200 190 680 650 2.410 880Salt Cavern 24 3.063 8.021 14.004 4.596 2.416 2.395 660 1.000 1.401 900Rock Cavern 0 0 0 0 0 0 0 0 0 8 0Abandan. Mine 2 112 104 92 105 0 0 0 0 0 0
10 Total 84 95.176 62.924 52.016 24.887 4.375 2.881 7.116 6.270 9.404 3.231
World Oil-/gasfield 494 298.597 283.883 141.841 43.869 2.179 484 47.010 20.342 16.271 4.389Aquifers 74 63.073 42.967 26.050 9.735 200 190 30.785 3.242 17.860 6.950Salt Cavern 61 5.032 13.011 29.344 4.596 2.416 2.395 2.404 1.000 8.610 8.794Rock Cavern 1 13 60 250 250 0 0 0 0 8 0Abandan. Mine 4 135 167 339 105 0 0 92 0 0 0
32 World Total 634 366.850 340.087 197.824 58.555 4.795 3.069 80.291 24.584 42.749 20.133
* Russia incl. some 30x109 m³ of strategic reserves
Installed Capacities Planned Projects in existing UGS
Undeveloped Capacities in existing UGS
UGS in operation New Greenfield UGS Projects
Working Gas Volume
Peak Withdrawal Capacity
[106 m³] [10³ m³/h]
126.125 72.44939.907 10.2006.234 14.734
0 0155 247
172.420 97.630
4.178 1.1350 00 00 00 0
4.178 1.135
161.629 57.47934.528 15.5726.434 8.500
60 2500 0
202.651 81.801
3.030 646550 0
1.275 04.855 646
54.382 35.34716.827 10.66012.498 18.299
8 0104 92
83.819 64.398
349.343 167.05591.812 36.43226.441 41.533
68 250259 339
467.923 245.609
Total
Attachment 3

IGU WOC 2 Basic Activity Study2000 – 2003
36
Attachment 4
Max. Storage Pressure in Storage Facilities in Oil/Gas Fields- I - America -
Ratio of Max. Storage Pressure to Initial Pressure
0.0 0.5 1.0 1.5 2.0
Aicken Creek Storage
Black Creek
Dawn 156
Wilkesport
Dawn 59-85
Bayhurst
Reed City
Austin
Columbus
Loreed
South Chester 15
Cleveland
Excelsior 6
Augusta
Loudon
Lanham
Flank
Lyon 34
Ira
Loogootee
Artemas "B"
Worthington
Washington
Oil Springs
Sabinsville
Wellendorf
Dixie
Dundee
Hanson
Eden South
Rotherwood
Chiles Dome
East Independence
Haskell
Katy Hub & Storage Facility
Kirk Ranch
Roundup
McDonald Island
Kettle Island
Zane
Lake Dallas
North Hopeton
Box Elder
Laurel
Zoar
Felmac
Markle
Weaver
Colvin
Osage
Partello/ Anderson
Ratio of max. storage pressure to initial pressure
USA
Canada
Argentina

IGU WOC 2 Basic Activity Study2000 – 2003
37
Attachment 5
Max. Storage Pressure in Storage Facilities in Oil/Gas Fields- II- World excl. America-
Ratio of Max. Storage Pressure to Initial Pressure
0.0 0.5 1.0 1.5
Sekihara Gas Field
Okoli
Tvrdonice
Tranovice
Hajduszoboszlo
Zsana
Brezeznica
Husow XII
Strachocina I+II hor.
Krasnodarskoe
Yelshanskoe
Mikhaylovskoe (Samara group)
Sovhoznoe
Láb 4. Stavba PZZP
Láb 1. a 2. Stavba PZZP
Vergunka
Bogorodchany
Solokha
Krasnopopivka
Dashava
Kegychivka
Puchkirchen
Tallesbrunn
Uelsen
Dötlingen
Stockstadt
Bad Lauchstädt Reservoir
Kirchheilingen
Reitbrook
Brugherio
Sabbioncello
Minerbio
Settala
Norg
Ratio of max storage pressure to initial pressure
Japan
Czech Republic
Russia
Ukraine
United Kingdom
Austria
Netherlands
Germany
Croatia
Hungary
Poland
Slovakia
Italy
Spain
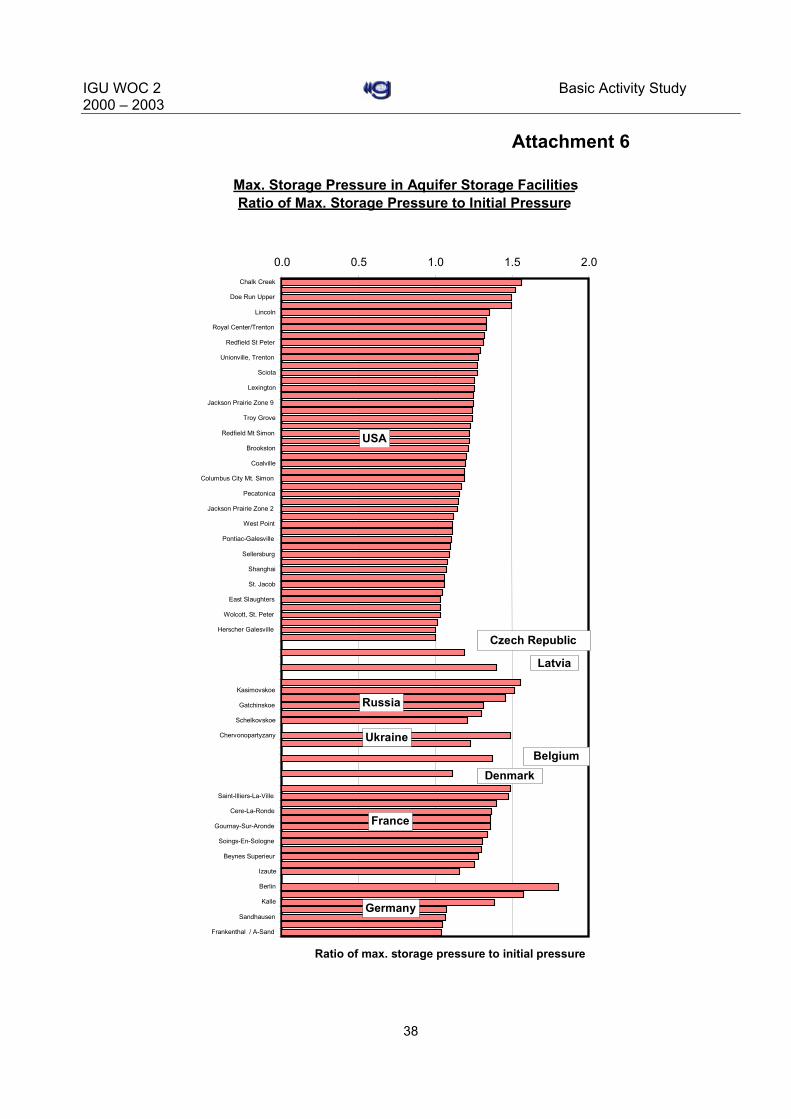
IGU WOC 2 Basic Activity Study2000 – 2003
38
Attachment 6
Max. Storage Pressure in Aquifer Storage FacilitiesRatio of Max. Storage Pressure to Initial Pressure
0.0 0.5 1.0 1.5 2.0Chalk Creek
Doe Run Upper
Lincoln
Royal Center/Trenton
Redfield St Peter
Unionville, Trenton
Sciota
Lexington
Jackson Prairie Zone 9
Troy Grove
Redfield Mt Simon
Brookston
Coalville
Columbus City Mt. Simon
Pecatonica
Jackson Prairie Zone 2
West Point
Pontiac-Galesville
Sellersburg
Shanghai
St. Jacob
East Slaughters
Wolcott, St. Peter
Herscher Galesville
Kasimovskoe
Gatchinskoe
Schelkovskoe
Chervonopartyzany
Saint-Illiers-La-Ville
Cere-La-Ronde
Gournay-Sur-Aronde
Soings-En-Sologne
Beynes Superieur
Izaute
Berlin
Kalle
Sandhausen
Frankenthal / A-Sand
Ratio of max. storage pressure to initial pressure
USA
Czech Republic
Russia
UkraineBelgium
Denmark
France
Germany
Latvia

IGU WOC 2 Basic Activity Study2000 – 2003
39
Attachment 7
Max. Storage Pressure in Cavern Storage FacilitiesMax. Pressure Gradient (bar/10 m)
0,0 0,5 1,0 1,5 2,0 2,5
Prud' Homme
Moosomin
NUL Salt Caverns
Melville North
Melville South
Landis
Regina South
Regina North
Hattiesburg Gas Storage
Yaggy
Bethel Salt Dome No. 1
Egan
Moss Bluff Salt Dome
Spindletop
McIntosh Salt Dome
North Dayton
Spindletop
Seneca Lake Storage
Wilson Storage Facility
Clemens Terminal
Eminence
Morton (17-21A)
Leyden Mine
Háje
Ll. Torup
Manosque
Etrez
Tersanne
Bernburg
Xanten
Epe TG
Harsefeld
Etzel
Epe RG
Kraak
Reckrod
Bad Lauchstädt Caverns
Stassfurt
Bremen-Lesum MEEG
Kiel-Rönne
Huntorf
Krummhörn
Nüttermoor
Burggraf-Bernsdorf
Hornsea
USA
France
Germany
Canada
Czech Republic
Denmark
United Kingdom

IGU WOC 2 Basic Activity Study2000 – 2003
40
Attachment 8
Max. Storage Pressure in Storage Facilities in Oil/Gas fields- II- World excl. America-
Ratio of Max. Storage Pressure to Initial Pressureincl. Upside Potential
0.0 0.5 1.0 1.5
Sekihara Gas Field
Okoli
Tvrdonice
Tranovice
Hajduszoboszlo
Zsana
Brezeznica
Husow XII
Strachocina I+II hor.
Krasnodarskoe
Yelshanskoe
Mikhaylovskoe (Samara group)
Sovhoznoe
Láb 4. Stavba PZZP
Láb 1. a 2. Stavba PZZP
Vergunka
Bogorodchany
Solokha
Krasnopopivka
Dashava
Kegychivka
Puchkirchen
Tallesbrunn
Uelsen
Dötlingen
Stockstadt
Bad Lauchstädt Reservoir
Kirchheilingen
Reitbrook
Brugherio
Sabbioncello
Minerbio
Settala
Norg
Ratio of max storage pressure to initial pressure
Japan
Czech Republic
Russia
Ukraine
United Kingdom
Austria
Netherlands
Germany
Croatia
Hungary
Poland
Slovakia
Italy
Spain
Upside Potential

IGU WOC 2 Basic Activity Study2000 – 2003
41
Relevant terms used in the Basic Activity Study - Units and definitions - Attachment 9
Term Unit *) Definition
Type of storage The following types of underground gas storages, which differ according to the storage formationand storage mechanism, are covered:- Storage in aquifers and oil/gas field (pore storage)- Salt cavern- Rock cavern- Abandoned mine
Containment Ability of the storage reservoir or cavern to resist leakage or migration of the fluids containedtherein either through wells, caprock or laterally via a spill point.
Greenfield storage project New underground storage development; development not based on any existing storage facilities
Cushion gas volume 1) 106 m³ Minimum gas volume required in a storage to maintain adequate reservoir pressure for meetingworking gas delivery with the required withdrawal profile throughout the withdrawal season. In totalit builds up from the recoverable (reserves)/non-recoverable (in situ gas) and the injected gas vol-umes. Also known as base gas.
Max. installed working gas vol-ume
106 m³ Maximum developed volume of gas in the storage above the design level of cushion gas volume,which can be withdrawn with installed facilities (wells, flowlines, etc.) and at technical limitations(pressures, velocities, etc.). Depending on the specific situation of the storage facility (injec-tion/withdrawal rates, etc.) the working gas volume can be cycled more than once (see annual cy-cling capability).
Total capacity 106 m³ Maximum inventory which can be stored in an underground storage facility; i.e. the total of workingand cushion gas volume.
Peak withdrawal capacity 10³ m³/h Maximum flow rate which can be delivered based on the installed facilities and technical limitationswhen the storage is at maximum volume, i.e. maximum storage pressure. Also referred to as thedeliverability rate, withdrawal rate or deliverability.
Nominal withdrawal capacity 10³ m³/h In general deliverability varies directly with the amount of inventory in the storage; when the work-ing gas is withdrawn the deliverability declines. The nominal withdrawal capacity, indicative of thedeliverability of the facility, is used as an average withdrawal capacity, which is available over alonger period of withdrawal. Also known as plateau capacity. Some operators refer this capacity toa 50 % point of working gas withdrawal.
Injection capacity 10³ m³/h Flow rate at which gas can be injected into the storage, based on the installed facilities and techni-cal limitations.
Withdrawal profile Relation of withdrawal capacity vs. withdrawn working gas volume for a single withdrawal period.The withdrawal profile and the resultant time required (utilization hours) for withdrawal is indicativeof the layout of the underground storage facility.
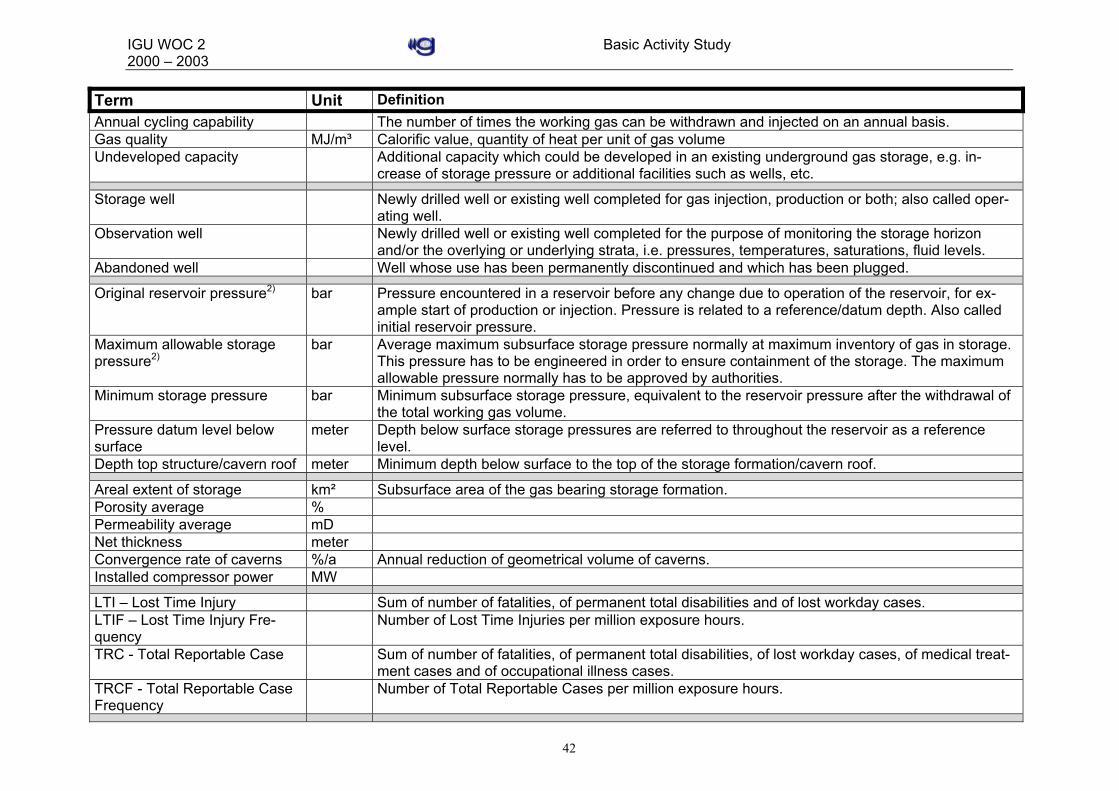
IGU WOC 2 Basic Activity Study2000 – 2003
42
Term Unit DefinitionAnnual cycling capability The number of times the working gas can be withdrawn and injected on an annual basis.Gas quality MJ/m³ Calorific value, quantity of heat per unit of gas volumeUndeveloped capacity Additional capacity which could be developed in an existing underground gas storage, e.g. in-
crease of storage pressure or additional facilities such as wells, etc.
Storage well Newly drilled well or existing well completed for gas injection, production or both; also called oper-ating well.
Observation well Newly drilled well or existing well completed for the purpose of monitoring the storage horizonand/or the overlying or underlying strata, i.e. pressures, temperatures, saturations, fluid levels.
Abandoned well Well whose use has been permanently discontinued and which has been plugged.
Original reservoir pressure2) bar Pressure encountered in a reservoir before any change due to operation of the reservoir, for ex-ample start of production or injection. Pressure is related to a reference/datum depth. Also calledinitial reservoir pressure.
Maximum allowable storagepressure2)
bar Average maximum subsurface storage pressure normally at maximum inventory of gas in storage.This pressure has to be engineered in order to ensure containment of the storage. The maximumallowable pressure normally has to be approved by authorities.
Minimum storage pressure bar Minimum subsurface storage pressure, equivalent to the reservoir pressure after the withdrawal ofthe total working gas volume.
Pressure datum level belowsurface
meter Depth below surface storage pressures are referred to throughout the reservoir as a referencelevel.
Depth top structure/cavern roof meter Minimum depth below surface to the top of the storage formation/cavern roof.
Areal extent of storage km² Subsurface area of the gas bearing storage formation.Porosity average %Permeability average mDNet thickness meterConvergence rate of caverns %/a Annual reduction of geometrical volume of caverns.Installed compressor power MW
LTI – Lost Time Injury Sum of number of fatalities, of permanent total disabilities and of lost workday cases.LTIF – Lost Time Injury Fre-quency
Number of Lost Time Injuries per million exposure hours.
TRC - Total Reportable Case Sum of number of fatalities, of permanent total disabilities, of lost workday cases, of medical treat-ment cases and of occupational illness cases.
TRCF - Total Reportable CaseFrequency
Number of Total Reportable Cases per million exposure hours.

IGU WOC 2 Basic Activity Study2000 – 2003
43
*) Gasvolumes are related to standard conditions - temperature/pressure : 288,15 K / 10132,5 Pa
1) Despite clear definitions, some operators only report injected gas volumes as cushion gas volumes, thus excluding the indigenous insitu gas volumes.
2) Pressures derived from the AGA 1998 report are referred to mainly as surface well head pressures; the conversion to subsurfacepressures is not consistently possible, as depth data are missing.