international Engineering Safety Management
31
international Engineering Safety Management Good Practice Handbook Application Note 3 Tools and Techniques Published on behalf of the International Railway Industry by Technical Programme Delivery Ltd – Issue 1 May 2014
Transcript of international Engineering Safety Management
international
Engineering
Safety
Management
Good Practice Handbook
Application Note 3
Tools and Techniques
Published on behalf of the International Railway Industry
by Technical Programme Delivery Ltd – Issue 1 May 2014

Issue 1 2
© Technical Programme Delivery Ltd 2014
We are grateful to the organizations listed who have supported iESM in various ways:

Issue 1 3
© Technical Programme Delivery Ltd 2014
Cover pictures © 2012 Paul Cheeseman

Issue 1 4
© Technical Programme Delivery Ltd 2014
Disclaimer
Technical Programme Delivery Limited (TPD) and the other organizations and individuals involved in preparing this handbook have taken trouble to make sure that the handbook is accurate and useful, but it is only a guide. We do not give any form of guarantee that following the guidance in this handbook will be enough to ensure safety. We will not be liable to pay compensation to anyone who uses this handbook.
Acknowledgements
This handbook has been written with help from the people listed below.
• D Beacham • Dr G Bearfield • S Bickley • N Bowley • M Castles • P Cheeseman • Dr Chen Roger Lei • Dr R Davis • B Elliott • Dr KM Leung • Dr I Lucic
• J McDonald • Mrs Niu Yingming • Ng Nelson Wai Hung • G Parris • J Shaw • Shi Lisa • G Topham • Tse Shirley Lai • E Wells • Dr Fei Yan • Dr Zhang Simon
These people worked for the organizations listed below.
• Arbutus Technical Consulting • Beijing Metro Construction
Corporation • Beijing National Railway Research
and Design Institute of Signal and Communication Co. Ltd.
• Beijing Traffic Control Technology Company
• Bombardier Transportation • Crossrail • EC Harris
• Electrical and Mechanical Services Department, Hong Kong
• Lloyd’s Register • London Underground • MTR Corporation Limited, Hong Kong • RailCorp • Railway Safety & Standards Board, UK • Rio Tinto • Technical Programme Delivery Group • Tube Lines
This handbook does not necessarily represent the opinion of any of these people or organizations.

Issue 1 5
© Technical Programme Delivery Ltd 2014
Good practice in engineering safety management advances as people build on the work done before by others. This handbook has drawn on the work carried out by the contributors to the Yellow Book [YB4] and to guidance on European Common Safety Methods [CSM-RA] among many others and we acknowledge our debt to them.
If you have any comments on this Application Note or suggestions for improving it, we should be glad to hear from you. You will find our contact details on our web site, www.intesm.org. This web site contains the most up-to-date version of this Application Note. We intend to revise the handbook periodically and your comments and suggestions will help us to make the Application Note more useful for all readers.
Issue 1 6
© Technical Programme Delivery Ltd 2014
Contents
Disclaimer 4 Acknowledgements 4 Contents 6 1 Introduction 7 2 Tools and Techniques 8
2.1 Notations for representing the components of a system and their interfaces ........... 8 2.2 Techniques for delivering safety-related software ...................................................... 11 2.3 Failure Mode and Effects Criticality Analysis (FMECA) ............................................ 16 2.4 Hazard and Operability Studies (HAZOPS) ................................................................ 17 2.5 Fault Tree Analysis ........................................................................................................... 18 2.6 Cause Consequence Diagramming ................................................................................ 20 2.7 Event Tree Analysis (ETA) .............................................................................................. 21 2.8 State Transition Diagrams ............................................................................................... 22 2.9 Data Reporting Analysis and Corrective Action System (DRACAS) ....................... 23
3 Glossary 25 3.1 Abbreviations .................................................................................................................... 25 3.2 Specialized terms .............................................................................................................. 25
4 Referenced Documents 29
Issue 1 7
© Technical Programme Delivery Ltd 2014
1 Introduction
This Application Note (AN) is a component of the international Engineering Safety Management Good Practice Handbook, or ‘iESM’, for short. The handbook as a whole describes good practice in railway Engineering Safety Management (ESM) on projects. It covers both projects that build new railways and projects that change existing railways.
The iESM handbook is structured in three layers:
• Layer 1: Principles and process • Layer 2: Methods, tools and techniques • Layer 3: Specialized guidance
The first layer comprises one volume, Volume 1. Volume 1 describes some of the safety obligations on people involved in changing the railway or developing new railway products. It also describes a generic ESM process designed to help discharge these obligations.
Volume 2 provides guidance on implementing the generic ESM process presented in Volume 1 on projects. Volume 2 belongs in the second layer. At the time of writing, Volume 2 was the only document in the second layer but further volumes may be added to this layer later.
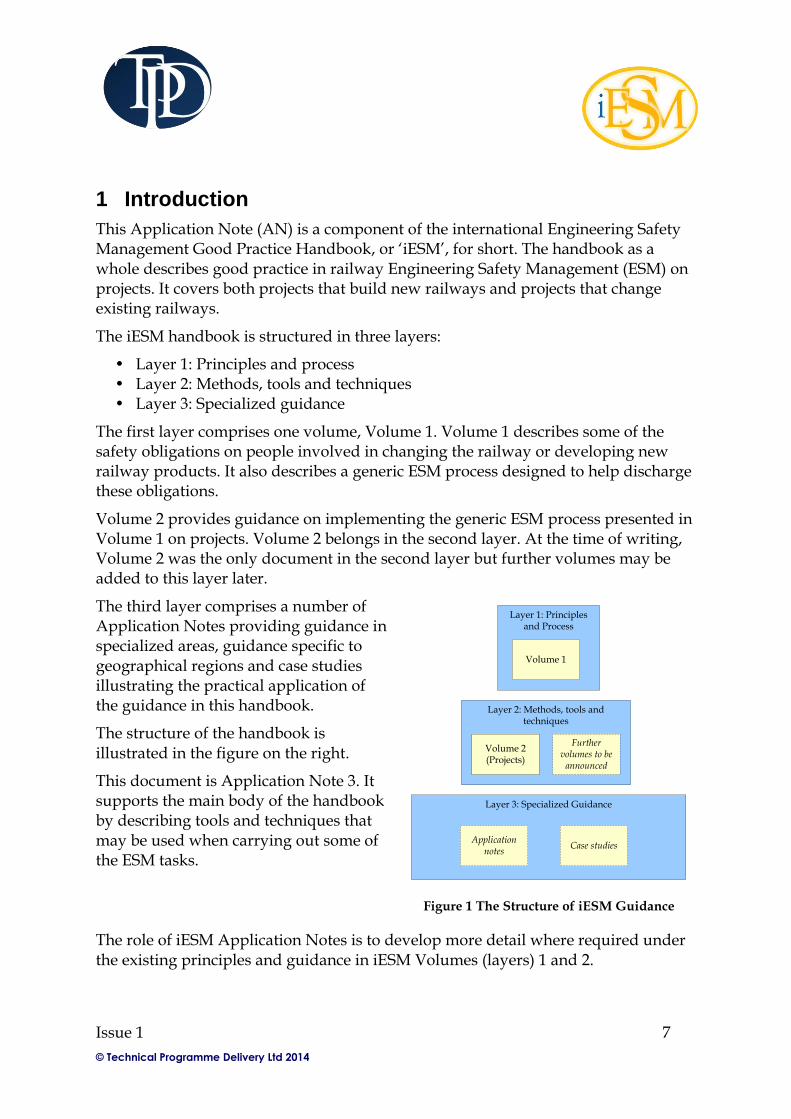
The third layer comprises a number of Application Notes providing guidance in specialized areas, guidance specific to geographical regions and case studies illustrating the practical application of the guidance in this handbook.
The structure of the handbook is illustrated in the figure on the right.
This document is Application Note 3. It supports the main body of the handbook by describing tools and techniques that may be used when carrying out some of the ESM tasks.
Layer 1: Principles and Process
Volume 1
Layer 2: Methods, tools and techniques
Volume 2(Projects)
Further volumes to be
announced
Layer 3: Specialized Guidance
Application notes
Case studies
Figure 1 The Structure of iESM Guidance
The role of iESM Application Notes is to develop more detail where required under the existing principles and guidance in iESM Volumes (layers) 1 and 2.

Issue 1 8
© Technical Programme Delivery Ltd 2014
2 Tools and Techniques
This Application Note provides guidance on the execution of the following techniques:
1 Notations for representing the components of a system and their interfaces 2 Techniques for delivering safety-related software 3 Failure Mode and Effects Criticality Analysis (FMECA) 4 Hazard and Operability Studies (HAZOPS) 5 Fault Tree Analysis 6 Cause Consequence Diagramming 7 Event Tree Analysis 8 State Transition Diagrams 9 Data Reporting Analysis and Corrective Action System (DRACAS)
These are not the only tools and techniques that are available but they are those most commonly used on rail projects. ISO31010 [31010] contains more information and additional tools and techniques that may be useful from time to time.
Techniques numbered 3 to 8 may be used when carrying out the Identifying
hazards and Estimating risk activities. A DRACAS may be used when carrying out the Monitoring risk activity.
2.1 Notations for representing the components of a system and
their interfaces
A common notation for describing the system and its components is a system hierarchy, in which the system is broken down into subsystems and then each of the subsystems is broken down into more detailed components and so on.
The system hierarchy may be developed into a more general system architecture drawing in which the components are drawn as rectangles or other shapes and then interfaces may be indicated as connections between these shapes. The drawings may be annotated with additional information such as:
• Type of interface (command or information); • Type of system/subsystem constituent (hardware/software/human); and • Boundaries between system and its environment including interactions
between the system and environment.
An example system architecture diagram is shown in Error! Reference source not
ound. below.

Issue 1 9
© Technical Programme Delivery Ltd 2014
Figure 1 A System Architecture Diagram
A system architecture diagram is an effective notation for showing internal interfaces within the system but is less effective for showing external interfaces. A context diagram is a common method for showing external interfaces. The system is shown as a circle in the middle of the diagram, the systems, people and other things with which it interacts are shown outside the circle and interfaces are indicate by arrows. An example of a context diagram is presented in Error! Reference source not
ound. below.
AUT OI (SIL-0)
ACC OI (SIL-2)
(MAIN/DISTRIBUTED) PL
MSSCC CO-LOCATED PSP
CO-LOCATED ACC MAIN-PL PSP
ACC-CP CIU (SIL-4)
LOCATION CASE
AUT TD (SIL-0)
ACC-OIART (SIL-2/1)
Trackside
Signalling
Objects
Central
Office
Equipment
(MSSCC)
[PL02]
Distributed
Field
Equipment
Telecom
Bearer
Network
Main
Peripheral
Locations &
Distributed
Peripheral
Locations
(ACC)
Equipment split
between Main
PLs & Distributed
PLs (DPLs)
#1 = equipment
only in Main PLs,
not in DPLs
OIART
Subsystem
(ACC)
AUT
Subsystem
Peripheral Subsystems &
Users
Trackside
Location
Cases
Rugby ClockAdjacent/Fringe TDs (combined Stage A & SHWW areas)
Crewe SCC (SHWW), Salop Goods SB (SHWW),
Greenbank SB (SHWW), MPSCC (SHWW), Edgely Jcn.1
SB (A/A+), Macclesfield SB (A/A+)
X2
fibre
2Mbps
HDLC
Location Case
Power Supply
Diagnostics
Peripheral Post
Power Supply
Diagnostics
Loc Case Power
Supply
(230/230
Transformer)
ELM
FDC
VIO
FDC
DEV
FDC
POT
FDC
POT
FDC
Track Circuit
Diagnostics Unit
(TRDG)
CDEV
FIU
LAPS
FIU
CTRC
FIU
166Hz
& 250Hz50Vac 50Vac
DC
Track
TF DB
ASF
SDO
Signal
T72
Point
m/c
150Vdc
& 160Hz
/ 250Hz
110Vac
@ 250Hz
/ 364Hz
/ 576Hz
200V/
110/48
Trans-
former
BR867
TFU
BR939
TR
166Hz
& 250Hz
110Vac
200Vac
& 250Hz
‘OFF’
(F/O)
BR
(F/O)
PLJRI
(SL35)AWS
Fringe
IXL
Relay
Circuits
RA
Plungr
230Vac
critical
166Hz
& 250Hz
DC
Track
TR DB
Point
Machine
Heaters
110Vac
critical
Actors / Users
X2
fibre
2Mbps
HDLC
SMART Link 1
(Crewe SCC)
BR1810 BR1810
x2
TAS FDC
TAS FDC
TAS FDC x2
x2
x2
Emrgcy
Alarm
Relay
Ccts
48Vac
230Vac
Loc
critical
400Vac 3ph
non-critical
400Vac
1ph OLE
Backup
400Vac
3ph REC
Main
TPWS
Equipt
Central Post
CIU
Subsystem
(ACC)
2Mbps
(E1)
400Vac
3ph GEN
Emergcy
SPAD
Indic
POT
FDC
POT
FDC
VIO
FDC
VIO
FDC
VIO
FDC
POT
FDC
VIO
FDC
VIO
FDC
48Vdc PP
critical supply
50Vdc PP
relay supply
50Vdc
critical110Vac
critical
400Vac 3ph
critical supply
to DPLs
48Vdc
ACC Simulation & Training LAN (10/100 Base TX Ethernet on UTP & Hub)
2Mbps
(E1)
110Vac
critical
50Vdc
critical
ACC Signalling LAN (Redundant 100 Base T Ethernet, including Hub)
Diagnostic
F/O Hub
Diagnostic
F/O Hub
Raid drive &
Data Logger
Vital F/O
Hub
Vital F/O
Hub
50Vdc
critical
NR-WAN
CIU (2oo3)
CTOM
AUT LAN (Redundant FDDI Ring and 10/100 Base T Switched Ethernet; TCP-IP)
#1
#1
#1#1
Rear Projection DLP
Videowall (8 x 84)
Area
Controller 1
Area
Controller 2
Maintainers FK
Signallers FK 2
Signallers FK 1
TRUST
Terminal
ACC D&M Desk
AUT Server 1
(NT4)
AUT Server 2
(NT4)
ART 3
D&M
Server
(NT4)
ART 1 “Main”
Server (NT4)
ART 2
“Standby”
Server (NT4)
Communications
Server 1 (Normal) NT4
Communications
Server 2 (Standby) NT4
Simulation
& Training
Server
(UNIX)
D&M Printer
230Vac
non-critical
PL supply
400Vac 1ph
non-critical
230Vac
non-critical
PL supply
Incoming
Switchboard
&
Non-Critical
Bus400Vac 3-phase
fixed GEN
Backp Supply
400Vac 3-phase
REC
Main Supply
400Vac 3-phase
portable GEN
Emergcy Supply
400Vac 1ph
non-critical
supply
400Vac 3ph
non-critical
supply
400V
UPS,
TJs, &
Critical
Bus
230Vac
non-critical
supply
48Vdc CIU
critical supply
400Vac 3-phase UPS &
Critical Bus
Incoming Switchboard &
Non-Critical Bus
48V
dc230V
ac48V
dc50V
dc
400V
ac48V
dc
400V
ac48V
dc
400Vac 3ph
critical supply
Location Case
Power Supply
Distribution Unit
Track Circuit
Monitoring Unit
(ICDR)
230Vac
ACC-CP
critical supply
POT
FDC
POT
FDC
SRI
(F/O)
MRI
(F/O)
Train
Driver
Track
Worker
Train
Driver
Train
Driver
Station
Staff
Train
Driver
Train
Driver
Train
Driver
POT
FDC
RA
Indic
Train
Driver
Train
AWS
Train
TPWSS&C
Rails &
Wheels
Rails &
WheelsS&C
To other PLs / DPLs
400V
ac48V
dc
400Vac 3ph
critical supply
48Vdc CIU
critical supply
CLAM
FIU
CLAM
FIU
CLAM
FIU
CLAM
FIU
CLAM
FIU
CLAM
FIU
ACC Signallers
Desk 2 (Stdby)
(x4 Monitors)
ACC Signallers
Desk 1 (Main)
(x4 Monitors)
AUT
Signallers
OI 2 (Stdby)
AUT
Signallers
OI 1 (Main)
AUT
Maintenance
OI
AUT
Simulation
& Training OI
Rear
Projection
Clients (x2)
(NT4)
To other MPLs / DPLs
PLS
(F/O)
POT
FDC
Train
Driver
CLAM
FIU
GPLS
(F/O)
POT
FDC
Train
Driver
CLAM
FIU
SMART Link 2
(MPSCC)
Memory channelswitch
x2HDSL
Modem
HDSL
Modem
Modem
Modem
ModemModem
TCI
VIO
FDC
Train
wheels
Lock-
out
LBL(R)
& PDL
Monomode Optical Fibre Backbone (dual redundant dark fibres from Telecom FTN 48-fibre cable)
ACC OI and
FK Simulator
(UNIX)
ACC Server, CIU
Simulator, PP &
Station Simulator
(UNIX)
Duplicated serial bus (115kb/s) Duplicated serial bus (115kb/s)Duplicated serial bus (115kb/s)
FAUFAUFAUFAUFAUFAUFAU
Fringe Location
Cases (adjacent
interlocking ccts.)
230V
UPS
230V
UPS
Data
Preparer/
Tester
Maintainer
Signaller
Signaller
Maintainer
Diagnostic LAN (Star-connected Non-Redundant 10/100 Base T Ethernet & Hub)
115 kbps serial
PS9 (BR1810)
Maintainer
Station
Staff
ARTAUT
Maintainer
Signaller
RA
Indicatr
Train
Driver
BR930 Relay Interface
SimPC
Ethernet
SimPC
48Vdc
D&M Laptop
Local PL
Maintenance
Terminal
200V/
100V
Trans-
former
200V/
100V
Trans-
former
200V/
100V
Trans-
former
200V/
100V
Trans-
former
200V/
100V
Trans-
former
200V/
100V
Trans-
former
200V/
100V
Trans-
former
200V/
100V
Trans-
former
200Vac
@ 250Hz
200Vac
@ 250Hz
200Vac
@ 250Hz
200Vac
@ 250Hz
200Vac
@ 250Hz
200Vac
@ 250Hz
200Vac
@ 250Hz
200Vac
@ 250Hz

Issue 1 10
© Technical Programme Delivery Ltd 2014
Figure 2 A Context Diagram.
Neither of the diagrams above represents behavior. Additional diagrams may be drawn to add a representation of behavior
State transition diagrams may be used for this purpose. They are discussed in section 2.7 above. State transition diagrams may be developed into Markov models to support quantified analysis.
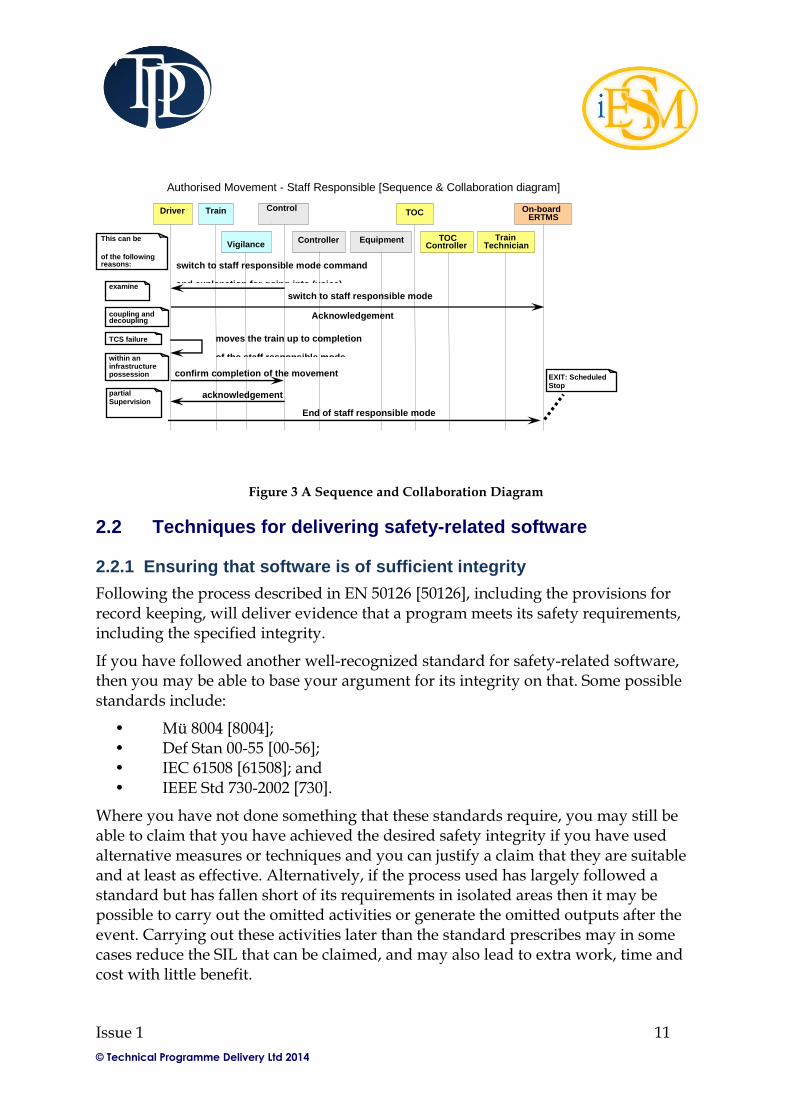
Sequence and collaboration diagrams may be used to capture dynamic nature of energy, information or action exchanges between system constituents or a system and the environment. For each state of the state transition model a sequence and collaboration model can be produced to represent the system interactions for each system state.
System constituents are represented by shapes (usually rectangles) from which a vertical line (representing the existence of the relevant shape in time) is drawn downwards to capture the time and arrows are drawn to represented the exchanges between system constituents. Shapes (usually rectangles with folded corners) represent the entry and exit points.
Sequence and collaboration diagrams may be used to represent temporal and spatial aspects of the system behavior. An example sequence and collaboration diagram is shown in Figure 3 below.
Ob038 Rugby Clock
Time Reference
Ob150 General Public
(Pedestrians)
Ob156 Public
Utilities
& Roads
IF063
Time ref
IF578
Vandalism[+]
IF577
Log & record
evidence[+]
IF585
Services[+]
Ob157 External
Comms suppliers
(BT)
IF587
Comms
services[+]
Ob155 NeighboursIF583
Infrastructure
Interference[+]
Ob144
Running
Water
Ob145
Mineral
Extraction
Ob023 External
Power Sources
(REC)
Ob151 General Public (Road
Vehicles)
Ob149 Earth
IF580
Hit
structures[+]
IF547
Earth
Ob008 HMRI &
Accident
Investigators
IF548
Power
IF492
Confine
& constrain
IF501
Foundation
reinforcementIF491
Erosion
IF570
Obstruct
IF582
EMI[+]
IF584
Rights of way
IF551
Isolation
IF549
Bonding
IF550
EMI
Ob166 Railway System - Level 0 Context
IF586
Pass over/under[+]
Ob146
Weather
Bureau
IF572
Weather
Forecast
IF576
Level crossing
road lights
IF579
Obstruct[+]
IF581
Obstruct[+]
Ob164 GPS Time
Reference
IF421
Time ref
Ob147
Emergency
Services
IF004
Voice Comms
MSCIP-SW
Ob166 Railway System
(Includes: Infrastructure and Control Systems
IF082
Status
IF575
Level crossing
road lights
IF483
Control AccessIF319
Control
Access
IF488
Parking
Ob176 Environment
IF612 Environmental
Parameters
IF613
EMI[+]
Ob177 TETRA &
other radio systems
Ob014 Train
(incl. Driver)
IF432
Traction power
IF593
Clearance[+]
IF592
Spillage[+]
IF427
Traction power
return
IF564
Forces and wear
IF560
Support
IF598
Radio IF229
Fixed Voice
(SPT)
IF600
Signal aspects [+]
IF599
EMI[+]
IF597
Brake Demand
(Air Gap)[+]
IF433
Pantograph
Characteristics
Issue 1 11
© Technical Programme Delivery Ltd 2014
Figure 3 A Sequence and Collaboration Diagram
2.2 Techniques for delivering safety-related software
2.2.1 Ensuring that software is of sufficient integrity
Following the process described in EN 50126 [50126], including the provisions for record keeping, will deliver evidence that a program meets its safety requirements, including the specified integrity.
If you have followed another well-recognized standard for safety-related software, then you may be able to base your argument for its integrity on that. Some possible standards include:
• Mü 8004 [8004]; • Def Stan 00-55 [00-56]; • IEC 61508 [61508]; and • IEEE Std 730-2002 [730].
Where you have not done something that these standards require, you may still be able to claim that you have achieved the desired safety integrity if you have used alternative measures or techniques and you can justify a claim that they are suitable and at least as effective. Alternatively, if the process used has largely followed a standard but has fallen short of its requirements in isolated areas then it may be possible to carry out the omitted activities or generate the omitted outputs after the event. Carrying out these activities later than the standard prescribes may in some cases reduce the SIL that can be claimed, and may also lead to extra work, time and cost with little benefit.
EXIT: Scheduled Stop
TOC
TOC Controller
Train Technician Vigilance
Train On-board ERTMS
Driver Control
Centre
Controller Equipment This can be
entered for any
of the following
reasons:
within an infrastructure possession
coupling and decoupling
partial
Supervision
area
examine
the line
TCS failure
End of staff responsible mode
switch to staff responsible mode
Acknowledgement
moves the train up to completion
of the staff responsible mode
confirm completion of the movement
acknowledgement
switch to staff responsible mode command
and explanation for going into (voice)
Authorised Movement - Staff Responsible [Sequence & Collaboration diagram]

Issue 1 12
© Technical Programme Delivery Ltd 2014
When developing software you should be aware that much of the data produced during software development is easily lost but expensive to replace. Even if you have no specific plans to base a safety argument on the development process used, it may still be a good investment to keep records of the process in case you need them later.
Sometimes it may not be practicable to use the standards. One reason may be that the designer wishes to use software that has already been developed. This is sometimes referred to as COTS (Commercial Off The Shelf) software. There are other situations where you may be unable to apply standards, including software developed within your organization for which there is no surviving design process documentation. For brevity we will talk about COTS in the remainder of this section but the advice given is applicable to other classes of previously-developed software.
EN 50126 [50126] includes requirements relating to the use of COTS but following these may not be the most practicable approach in every case.
You will need to show that the COTS meets your safety requirements, including its safety integrity requirements. It is possible to make a convincing argument for this in many cases. However, it may be difficult for higher SILs and it is not guaranteed to be possible in every case. You should work out, at least in outline, how you will make the argument before committing yourself to using COTS.
The safety argument for COTS may be complicated by the fact that COTS often includes functions that are not required and not used. You will need to show that the presence of these functions has no hazardous side-effects. It may also be impossible for the user to find out exactly how COTS software was developed.
Activities that may deliver evidence to support your argument, include reliance on other standards, process assessment, design analysis and analysis of service record. It is usual to use a mixture of several of these.
Software is generally too complex, and has too many states, to prove by analysis that it behaves exactly as it should.
It may, however, be possible to show that some simple properties hold and this may be enough to show that a software safety requirement is met or to form part of such a demonstration.
For example, it may be possible by careful analysis of the input/output statements in a program and its control flow, to show that two output instructions will always occur in a particular order.
It may also be possible, by careful inspection of the data path for an item of data, to show that it cannot be corrupted on the way. It is generally much harder to show that it will always be delivered.

Issue 1 13
© Technical Programme Delivery Ltd 2014
Tools exist that allow you to perform static analysis of program code, in order to prove certain properties of a system, such as the absence of run-time exceptions, or the adherence to certain coding standards.
You should bear in mind the SIL you are trying to achieve when considering whether this approach is workable and if so what tools and techniques to use.
Conclusions from analysis typically depend upon assumptions such as ‘code cannot be overwritten’ and ‘return addresses on the stack cannot be corrupted’, which you should identify and confirm. If you analyze the source code rather than the object code, there will always be an assumption about the integrity of the compiler which you will have to confirm (see volume 2 for more information about managing assumptions).
If the possible safety arguments are considered during the architectural design of the system it may be possible to design the system to make the safety arguments easier.
If your software is already in service, it may be possible to make a direct claim for the frequency of hazardous software failures without recourse to SILs from records of its operation in service, provided that you can show all of the following:
• The records of failures are thorough and accurate. • The software is under change control and the version for which the claim is
made is substantially the same as the versions for which records were kept. • The software will be subject to a similar pattern of use to that for which
records were kept. • The total time in operation of the software is known.
The data used needs to be either complete or a statistically valid subset. Any bias in the collection of data will invalidate conclusions drawn from it. The data needs to include information about the environment that the system was operating in, and the manner in which it was being used. If you are basing part of a safety argument upon such data, you should be able to demonstrate that the data used is of a high enough quality. This may require that the party providing the data also provides details of the collection method, sampling techniques and storage regime used.
It may also be possible to make a direct claim for the frequency of hazardous software failures, without recourse to SILs, from records of testing, provided that:
• the test inputs were random; and • the software will be subject to a similar pattern of use to that for which it
was tested.
However, it is not generally statistically valid to claim that the mean time between a hazardous failure is more than one third of the total duration of use or testing for which records were kept, and then only if no hazardous failures occurred. In practice
Issue 1 14
© Technical Programme Delivery Ltd 2014
it is difficult to make claims for a Safety Integrity better than SIL 2 using a service record or testing data.
2.2.2 Ensuring that transmission processes for configuration data are of
sufficient integrity
You should define and write down the process and tools to be used for preparing, checking and inputting the data. You should ensure that any tools used to prepare or test data have sufficient integrity that they will not compromise the integrity of the data.
You should take every practicable opportunity to introduce automated checks of data values or of relationships that should hold between data items.
You should ensure that anyone entering data at a screen is given feedback of the values that they have entered.
You should maintain data under configuration management. You should use the same methods of configuration management as you would for software of the same Safety Integrity Level.
Data may be stored on magnetic (floppy/hard disk, magnetic tape), optical (CDs, DVDs), or solid-state (Flash RAM (Random Access Memory), Static or Dynamic RAM, [E]EPROM ([Electrically] Erasable Programmable Read-Only Memory)) media. Data may be transmitted over wires (serial, Ethernet), optical fiber, optical wireless (infra-red), and radio.
Stored data may be susceptible to corruption from a range of environmental factors:
• electric or magnetic fields; • excessive heat or cold; • chemical reactions; • ionizing radiation; • unwanted modification (either human or automatic).
All storage media will deteriorate over time. You should assess the possible aspects of the environment that may affect the media on which you store configuration data. You should assess the time that data is to be stored and the possible factors that may influence the persistence of data on the media. Some media (especially magnetic and optical) will deteriorate from use, and will therefore have a lifespan determined in part by the frequency of use (both reading and writing). When selecting media you should take into account the likely frequency that data will be read and written, and choose the media appropriately. You should have procedures in place for the assessment of media being used in order to prevent the loss of data through media deterioration.

Issue 1 15
© Technical Programme Delivery Ltd 2014
Corruption during the read or write process may occur due to electrical or mechanical failure. In order to minimize this possibility several strategies may be used:
• Read back data that is written. Be aware that many storage devices (especially hard-drives) use temporary storage to improve performance; ensure that the version stored is read back in order to ensure that it has been written correctly.
• Write data in multiple locations on a single medium, or use redundant media. Read all copies of the data, in order to discover individual recording errors.
• Where data will not be changed often, you may wish to use some method to prevent it being accidentally overwritten. Such methods may include:
o physically disabling the data writing component of the hardware, for example providing a switch to disable writes to memory after data is loaded;
o using media that cannot be overwritten, such as CDs or PROMs; o using protection provided by operating systems.
Transmission of data is also subject to environmental influences and system failures. The environmental factors will depend on the medium:
• Both wired electrical, and radio will be subject to electromagnetic interference.
• Radio and optical will be susceptible to problems with propagation. Infrared and certain frequencies of radio will require line of sight, or will have a range that is affected by obstacles.
There are five main classes of failure for a transmission system:
1. loss of data; 2. corruption of data; 3. delay to data; 4. incorrect ordering of data; 5. insertion of spurious data.
You may also need to consider the possibility that someone may deliberately introduce correct-looking data into the transmission channel.
There are many well-understood protocols that can manage these failures. You should use one that is appropriate for the medium, and the information that you are sending. You may also wish to consider other techniques for improving the reliability, both of the connection and the data sent across it, such as:
• using multiple wired connections that follow diverse paths to eliminate common causes; or

Issue 1 16
© Technical Programme Delivery Ltd 2014
• using mechanisms to minimize interference such as balanced lines, or spread spectrum wireless transmission.
When sending or storing data, you should consider the use of error detecting codes. EN 50159 [50159] provides further guidance in this area.
2.3 Failure Mode and Effects Criticality Analysis (FMECA)
FMEA should be carried out in compliance with established standards such as IEC60802 [60802]. Excel is usually effective for creating and managing the analysis.
Note that users of this standard should ensure that they use a common set of units, if they wish their risk ratings to be comparable.
The analyst should consider components at a detailed level of indenture and record their failure modes along with causes and effects. The failure effects of these sub-components then become failure modes of components at the next higher level of indenture. The process is repeated up the functional hierarchy to yield the individual failure modes of the whole system.
The criticality (or severity from a safety view point) of each failure can then be determined. Some failures will have no, or little, effect on safety others may severely compromise a safety requirement.
The depth of the analysis should be adjusted according to the preliminary appraisal of the hazards. The components which contribute to higher risk hazards should be analyzed in greater detail. The approach is typically “bottom up” using a hierarchical breakdown of the system’s structure or functionality. Failure modes at one level become failure causes at the next. A Top-down approach can also be adopted at an early design or specification phase before the whole system structure is decided. The analysis is usually function oriented. The analysis starts with the main system functions - and how these may fail.
Through determining the affects of component and subassembly failures, the FMECA can be used to design fault detection and isolation methodologies. However, it can only be used to analyze single point failures and it can be time consuming. If done properly, in a targeted way, it is cost effective and its benefits outweigh the limitations.
Checklists, HAZOPS or other techniques may be used to identify basic failure modes.
The analysis is recorded on a worksheet which has at least the following columns:
Item Ref The unique identifier of the sub-component being considered.
Description A description of this sub-component.

Issue 1 17
© Technical Programme Delivery Ltd 2014
Failure Ref A unique identifier for the failure mode entered.
Mode A description of the failure mode.
Causes For this failure.
Effect Of this failure (local and system-wide).
Criticality Of the effect of this failure mode
Compensating Provisions Which may cause the effects of this failure not to be promulgated.
How detected The means by which the failure may be detected.
Remarks Any other notes made by the analyst.
Typical criticality measures could be:
Minor - it would be unreasonable to expect that the minor nature of this failure would cause any real effect on system capability. The failure might not be noticed.
Low - the nature of the failure causes only a slight deterioration of system capability that may require minor rework action.
Moderate - failure causes some deterioration in system capability which my generate the need for unscheduled rework /repairs or may cause minor injury.
High - failure causes loss of system capability or may cause serious injury.
Critical - failure could cause complete system loss and/or death.
2.4 Hazard and Operability Studies (HAZOPS)
Where detailed design information is available and a high-level of assurance is required a Hazard and Operability Study or HAZOPS can be carried out.
HAZOPS is a systematic, creative examination of a design by a multi-disciplinary team.
HAZOPS is recommended for systems with potential catastrophic accidents, novel features or for systems that span several engineering disciplines.
HAZOPS is an analysis technique developed originally for the chemical industry and described in the Reference Guide [CIA], Hazop and Hazan [Kletz]and CAP 760 [760]. The technique should be carried out as described in these documents.
The principal difference between application of HAZOPS in the chemical industry and application in other engineering fields is in the way in which the design documentation is examined. In the chemical industry, examination is guided by traversing the flowchart, a schematic showing the connection of vessels, pipes and valves. In engineering applications an alternative representation of the parts and their interactions, such as a mechanical drawing, circuit schematic or data flow

Issue 1 18
© Technical Programme Delivery Ltd 2014
diagram should be used. The same technique can be applied at a number of levels within the design.
If no convenient form of the design exists, then the analyst should construct a Functional Block Diagram. At each level of indenture this shows the components of the system or a sub-system as blocks with lines drawn between each pair of boxes that directly interacts.
The team collects the design documentation, including a full functional breakdown of the system. Each component, including the interfaces, of the system is inspected in turn. The team considers the intention of the system and by applying a list of guide
words attempts to reveal plausible deviations from the design intention.
The guide words for hardware systems typically are as follows. Alternative guide words for are provided in [760]:
NO or NOT No part of the intention is achieved but nothing else happens
MORE Some quantitative increase over what was intended
LESS Some quantitative decrease over what was intended
AS WELL AS Some qualitative increase over what was intended
PART OF Some qualitative decrease over what was intended
REVERSE The logical opposite of the intention happens
OTHER THAN Something quite different happens
The team should be constituted to cover the areas of expertise required to fully understand the system. For example, the examination of a signaling system may require a safety process expert, a hardware engineer, a software engineer, an expert in signaling principles and potential users and maintainers.
It is quite likely that the team will be unable to establish immediately whether a possible deviation can occur or what its effect can be. In that case an action can be recorded to establish this outside the meeting.
2.5 Fault Tree Analysis
Fault Tree Analysis (FTA) is a widely known and accepted top-down or deductive system failure analysis technique. The Fault Tree Handbook, NUREG-0492 [0492], is a comprehensive reference document for FTA, and may be used in conjunction with other FTA standards.
FTA begins with a single undesired top event and provides a method for determining all the possible causes of that event.

Issue 1 19
© Technical Programme Delivery Ltd 2014
A correctly constructed fault tree is a graphical and logical model of the various parallel and sequential combinations of events that will result in the occurrence of the top event.
FTA can be used for both qualitative as well as quantitative analysis. The graphical nature of the technique aids the qualitative identification of potential sources of single-point failures and safety-critical failure combinations.
The precise definition of the top event is critical to the success of the analysis, since an incorrect top event will, in most cases, invalidate the whole analysis.
The system is analyzed, from the identified top events, in the context of its environment, and modes of operation, to find all credible causal events.
The fault tree is made up of gates, which serve to permit or inhibit the flow of fault logic up the tree. The gates show the relationship of lower events – the inputs to the gate – needed for the occurrence of a higher event – the output of the gate. The gate symbol denotes the relationship of the input events required for the output event.
The fault tree is used to produce the minimal cut sets - the minimum combination of independent base events which, if they occur or exist at the same time, will cause the top event to occur. The minimal cut sets provide the basis for both the qualitative and quantitative analysis of the system.
Fault trees are relatively simple in concept, but can be very difficult in practice. This is particularly true when quantitative analysis is required. Chapter V of NUREG-0492 [0492] provides a detailed explanation of the technique. The following key concepts and rules from that document are given here to guide the analyst in the approach required to the construction of the tree.
In determining the causes of an event in a fault tree, the analyst should identify the immediate, necessary and sufficient causes for the occurrence of that event. The temptation to jump directly to the basic causes should be resisted, even if these may appear obvious.
The dependence between base events within a minimal cut set should be identified during FTA. This is achieved by performing Common Cause Failure Analysis on the Minimal Cut Sets to identify potential dependencies.
The following basic rules should be applied when constructing a fault tree:
• Write the statements that are entered into the event boxes as faults: state precisely what the fault is and when it occurs.

Issue 1 20
© Technical Programme Delivery Ltd 2014
• If the answer to the question ‘Can this fault consist of a component failure?’ is ‘Yes’, classify the event as a ‘State of Component Fault’. If the answer is ‘No’, classify the event as a ‘State of System Fault’. If an event is classified as a ‘State of Component Fault’, add an OR-gate below the event and look for primary, secondary and command faults that may cause the event. If an event is classified as a ‘State of System Fault’, an AND-gate, OR-gate, INHIBIT-gate, or possibly no gate at all may be required, and the minimum, necessary and sufficient causes should be determined.
• If the normal functioning of a component propagates a fault sequence, then it is assumed that the component functions normally.
• All inputs to a particular gate should be completely defined before further analysis of any one of them is undertaken.
• Gate inputs are to be connected to fault events. Gates are not to be connected directly to other gates.
• Identify fixed probabilities, that is, non-failure conditions, with inhibit gates.
2.6 Cause Consequence Diagramming
Cause Consequence Diagramming (or Cause Consequence Analysis) is a technique that embodies both causal and consequence analysis. However, in the context of the iESM it is useful primarily as a consequence analysis tool.
The technique provides a diagrammatic notation for expressing the potential consequences of an initiating event (normally a hazard) and the factors that influence the outcome.
The basic notation is introduced in the context of the example in Figure 4. In this diagram the hazard is Ignition. The final outcomes (or ‘significant consequences’) are shown in octagons and vary from no incident to a major fire. The major factors that influence the outcomes are shown in ‘condition vertices’.
The diagram shows that a major fire will only occur as a result of the ignition hazard if both the sprinkler and alarm system fail. If we can estimate the frequency with which the hazard will occur and the probability that the sprinkler and alarm systems will fail on demand (and, importantly, we know to what degree these failures are correlated) then we can estimate the frequency with which the hazard will give rise to this accident. This is an essential step on the way to estimating the risk arising from the hazard.
There are variations in notation.
The notation allows further symbols. For a slightly fuller exposition refer to ‘Safeware: System Safety and Computers’ [Leveson], pages 332-335.

Issue 1 21
© Technical Programme Delivery Ltd 2014
Ignition
Sprinkler
Works
YES
Fire Put
Out
YES
NO
NO
Alarm Sounds
Minor Fire Major Fire
Figure 4 Example Cause-Consequence Diagram
2.7 Event Tree Analysis (ETA)
The overall goal of Event Tree Analysis is to determine the likelihood of possible outcomes that can cause harm and result from the chosen initiating event (normally a hazard). Railways are robust with multiple layers of protection through responding to previous incidents and accidents so typically the most common outcome is “no harm”
It is necessary to use detailed information about the application of the system to understand intermediate events, accident scenarios, and initiating events to construct the Event Tree diagram. The Event Tree begins with the initiating event where consequences of this event follow in a binary (success/failure) manner. Each event creates a path in which a series of successes or failures will occur where the overall probability of occurrence for that path can be calculated. The probabilities of failures for intermediate events (or nodes) can be determined through the following main methods normally used for railways:
• Direct derivation based on known facts, e.g. Peak/Off-peak ratio, length of track in different surround conditions, i.e. tunnel, viaduct, at-grade, etc.
• Supporting fault trees or reliability analyses, e.g. failure of fire protection systems to control fire
• Expert estimate - many events will have no supporting data or experience and therefore the best we can hope for is a sensible assumption
Figure 5 (below) shows a typical Event Tree. They can be constructed and managed in Excel with care or a bespoke tool can be used.
Even if the likelihood of the initiating event is not known, it can be assumed that the event occurs (by setting it to “1”) and the Event Tree will then show the outcomes in relative way.

Issue 1 22
© Technical Programme Delivery Ltd 2014
Coupled with an accident model it is possible to use the Event Tree to derive a measure of fatalities and weighted injuries which is needed under some acceptance regimes.
Figure 5 Example Event Tree Extract
2.8 State Transition Diagrams
State transition diagrams are simple diagrams that show the state that a system can be in and the possible transitions between these states.
Figure 6 (below) is an example state transition diagram. The black circles and the round-cornered boxes represent the states of the system, and the arrows represent the transitions between those states. This example models debris being on a track, and the driver of a train on the neighboring track spotting it, and notifying the control center. All the states within the box are ones for which the railway is at risk.

Issue 1 23
© Technical Programme Delivery Ltd 2014
State 1 State 2
State 3 State 4
State 5 State 7 State 6
State 8
State 1
Key
Initial State
Final state
Transition
Intermediate State
At risk states
[Condition]
[Debris deposited
[Train A enter section
[Drive A spots debris
[DriverA notifies control]
[Signals set to danger
[Train B not passed signal]
[Train B stopped at signal]
[Train B already passed signal]
[Control contacts train B]
[Train B stopped]
Figure 6 Example State Transition Diagram
2.9 Data Reporting Analysis and Corrective Action System
(DRACAS)
The Data Reporting Analysis and Corrective Action System (DRACAS), sometimes referred to as a Failure Reporting Analysis and Corrective Action System (FRACAS), is a closed loop data reporting and analysis system. The aim of the system is to aid design, to identify corrective action tasks and to evaluate test results, in order to provide confidence in the results of the safety analysis activities and in the correct operation of the safety features.
Its effectiveness depends on accurate input data in the form of reports documenting incidents. These reports should therefore document all the conditions relating to the incident.
The project manager or their delegate should be part of the team that reviews the incidents, in order that their impact on the safety characteristics of the system can be quickly assessed and any corrective actions requiring design changes quickly approved.

Issue 1 24
© Technical Programme Delivery Ltd 2014
The DRACAS process is illustrated in Figure 77 and may be summarized as follows:
1. The incident is raised and recorded on a database.
2. A data search is carried out for related events.
3. The incident is reviewed. If the incident is a new hazard it is recorded as such in the register of hazards.
4. Information concerning the incident is communicated to those that need to know, in order to control risk.
5. Corrective actions are recommended as necessary.
6. If no corrective action is required the database is updated and the process ends.
7. The corrective action is authorized and implemented and assessed for success.
8. If the corrective action is successful the database is updated and the process ends.
9. If the corrective action is unsuccessful the incident is re-reviewed (the process returns to step 5).
Incident raised and recorded
Search for related events
Review incident
Corrective action necessary?
Authorise, implement and assess action
Corrective action successful?
Communicate information as necessary
Update database
YES
YES
YES
NO
NO
Figure 7 The DRACAS process

Issue 1 25
© Technical Programme Delivery Ltd 2014
3 Glossary
This glossary defines the specialized terms and abbreviations used in this Application Note.
3.1 Abbreviations
COTS Commercial Off The Shelf
DRACAS Data Reporting Analysis and Corrective Action System
ESM Engineering Safety Management
FMEA Failure Mode and Effects Analysis
FMECA Failure Mode, Effects and Criticality Analysis
FTA Fault Tree Analysis
HAZOPS Hazard and Operability Study
SIL Safety Integrity Level
3.2 Specialized terms
accident An unintended event or series of events that results in harm to people.
accident likelihood The likelihood of an accident occurring. May be expressed as numeric probability or frequency or as a category.
accident sequence A potential progression of events that results in an accident.
accident severity A measure of amount of harm. May be expressed as a financial value or as a category.
accident trigger A condition or event which is required for a hazard to give rise to an accident.
approval Any process by which someone reviews the evidence that risk has been controlled and takes an explicit decision as to whether a system may be placed into operation, including trial operation and operation for testing, or whether a product may be applied.
Note. Some people distinguish different sorts of approval and give some sorts different names, such as ‘acceptance’ or ‘endorsement’.

Issue 1 26
© Technical Programme Delivery Ltd 2014
barrier (In the context of risk estimation) anything which may act to prevent a hazard giving rise to an accident. Barriers may be physical, procedural or circumstantial,
causal factor Any event, state or other factor which might contribute to the occurrence of a hazard.
Commercial Off The Shelf (COTS)
A term used to describe products manufactured for a market.
configuration management
A discipline applying technical and administrative direction and surveillance to identify and document the functional and physical characteristics of a configuration item, to control changes to those characteristics, to record and report change processing and implementation status and to verify compliance with specified requirements.
control measure A measure taken to reduce risk.
Data Reporting Analysis and Corrective Action System (DRACAS)
An administrative system used to collect and analyze data concerning the performance of a system or product and to support the management of corrective actions, where necessary.
Engineering Safety Management (ESM)
The activities involved in making a system or product safe and showing that it is safe.
Note: despite the name, ESM is not performed by engineers alone and is applicable to changes that involve more than just engineering.
error A mistake made by a person.
Event Tree Analysis A method of illustrating the intermediate and final outcomes which may arise after the occurrence of a selected initial event.
failure A deviation from the specified performance of a system, product or other change. A failure is the consequence of a fault or error.
Failure Mode and Effects Analysis (FMEA)
A process for reliability, availability and safety analysis, where all known failure modes of components or features of a system or product are considered in turn and the outcomes are identified.

Issue 1 27
© Technical Programme Delivery Ltd 2014
Failure Mode, Effects and Criticality Analysis (FMECA)
An extension to FMEA in which the criticality of the effects is also assessed.
fault A fault is a defect in a system, product or other change which may cause a failure.
Fault Tree Analysis (FTA) A method for representing the logical combinations of various states which lead to a particular outcome (top event).
hazard A condition that could lead to an accident. A potential source of harm. A hazard should be referred to a system or product definition.
Hazard and Operability Study (HAZOPS)
A structured study carried out by application of guide words to identify all deviations from the design intent with undesired effects for safety or operability.
human factors The field of study and practice concerned with the human element of any system, the manner in which human performance is affected, and the way that humans affect the performance of systems.
hazard log A common name for a register of hazards.
incident An unintended event or series of events that results in harm to people or could, in other circumstances have resulted in harm to people.
Note. All accidents are incidents. Some incidents are not accidents.
risk The combination of the likelihood of harm to people and the severity of that harm associated with some cause or type of accident.
minimal cut set A set of basic events in the fault tree which are sufficient to cause the top event to occur, such that removing any event from the set would mean that the top event would not occur.
random failure A failure resulting from random causes such as variations in materials, manufacturing processes or environmental stresses.

Issue 1 28
© Technical Programme Delivery Ltd 2014
register of hazards A document which records details of hazards identified during safety analyses of a system or product, including the status of each hazard, as well as relevant decisions made, solutions used and their implementation status.
reliability The probability that an item can perform a required function under given conditions for a given time interval.
risk Combination of the likelihood of occurrence of harm and the severity of that harm.
risk estimation The process of producing a measure of the level of risk being analyzed.
safety Freedom from unacceptable risk of harm to people.
safety analysis A general term encompassing identifying hazards, analyzing hazards and assessing risk.
safety integrity The likelihood of a safety-related function being performed satisfactorily under stated conditions within a stated operational environment and a stated period of time.
Safety Integrity Level (SIL)
One of a number of defined discrete levels for specifying the safety integrity requirements of the safety functions to be allocated to the safety related systems.
safety-related An item is safety-related if any of its features or capabilities has the potential to contribute to or prevent an accident.
severity See accident severity.
standard An authorized document, including specification, procedure, instruction, directive, rule or regulation, which sets requirements.
System A set of elements which interact according to a design, where an element of a system can be another system, called a subsystem and may include hardware, software and human interaction.

Issue 1 29
© Technical Programme Delivery Ltd 2014
systematic failure A failure due to errors, which causes the product, system or process to fail deterministically under a particular combination of inputs or under particular environmental or application conditions.
triggering event An event, outside the system or product of interest, which is required in order for a Hazard to result in an Accident.
4 Referenced Documents
This section provides full references to the documents referred to in the body of this volume.
[00-56] UK Ministry of Defence, DEF-STAN 00-56, Safety Management Requirements for Defence Systems, Issue 4, June 2007
[0492] NUREG 0492, The Fault Tree Handbook, 1981
[31010] ISO/IEC 31010 (ISO31010):2009 Risk Management – Risk assessment techniques
[50126] EN 50126, Railway applications – The specification and demonstration of dependability, reliability, availability, maintainability and safety (RAMS)
At the time of writing the current issue of EN 50126 was dated 1999 but the standard was being revised to cover the scope of EN 50128 and EN 50129 as well. As far as we can, we have aligned this handbook with the emerging issue. If an issue of EN 50126 dated later than 1999 is available at the time of reading then this issue should be consulted. If no issue of EN 50126 dated later than 1999 is available then the reader may find it useful to consult the current issues of EN 50126, EN 50128 and EN 50129 but may not find the information referred to in any particular citation of the standard.
[50159] EN 50159:2010, Railway Applications – Communications, signalling and processing systems – safety related communications in transmission systems
[50506] PD CLC/TR 50506-1: 2007, Railway applications. Communication, signalling and processing systems. Application guide for EN 50129. Cross-acceptance
[60802] IEC 61802: 2006, Analysis techniques for system reliability – Procedure for failure mode and effects analysis (FMEA)

Issue 1 30
© Technical Programme Delivery Ltd 2014
[61508] IEC 61508:2003, Functional safety of electrical/electronic/programmable electronic safety-related systems
[730] IEEE Std 730-2002 - IEEE Standard for Software Quality Assurance Plans, 2002
[760] Civil Aviation Authority Safety regulation Group, CAP 760, Guidance on the Conduct of Hazard Identification, Risk estimation and the Production of Safety Cases for Aerodrome Operators and Air Traffic Service Providers, 13 January 2006
[8004] German Federal Railways Standard Mü 8004
[CIA] Chemical Industries Association, A Guide to Hazard and Operability Studies, Kings Buildings, Smith Square, London SW1P 3JJ, 1992
[CSM-RA] Commission Regulation (EC) No 352/2009 of 24 April 2009 on the adoption of a Common Safety Method on Risk Evaluation and Assessment
[DoT] U.S. Department of Transportation, Federal Aviation Administration (ed.): System Safety Handbook, December 30, 2000: Chapter 9, Table 9-1
[Kletz] Kletz Trevor A., Hazop and Hazan, (The Institution of Chemical Engineers, 2006), ISBN 0852955065
[Leveson] Leveson N., Safeware: System Safety and Computers, Addison-Wesley 1995, ISBN 0-201-11972-2
[YB4] Engineering Safety Management, issue 4, “Yellow Book 4”, ISBN 978-0-9551435-2-6
Yellow Book 4 now has the status of a withdrawn document.
International Engineering Safety Management
Good Practice Handbook Application Note 3
Published on behalf of the International Railway Industry by Technical Programme Delivery Ltd