International Economics Prof. D. Sunitha Raju Introduction to International Economics.
Upload
daphne-toddCategory
view
52download
0description

International Economics

Chapter3 The Specific Factor ModelChapter3 The Specific Factor Model
Main Contents
The Specific Factors Model
International Trade in the specific Factors
Model
The Political Economy of TradeThe Political Economy of Trade

Key Terms
Budget constrains production function
Diminishing returns mobile factors
marginal product of labor specific factors
production possibility frontier
Specific factors model

Ⅰ. The Specific Factors Model
ⅰ. Assumptions of the model
Two goods:
manufacture
food
Three factors: Capital(C) Labor(L)
Land(L)
The specific factor in producing manufacture
The specific factor in producing food

The production function for manufactures:
QM=QM(K,LM)
The production function for foods:
QF=QM(T,LF)
LM: the labor used in manufactures
LF: the labor used in foods
Obviously, LM +LF= L

ⅱⅱ. . Production possibility FrontierProduction possibility Frontier
MPLM
MPLM
LM
MPLF
MPLF
LF

The production curves
QMQM=QM(K,LM)
LM
QF
QF=QF(K,LF)
LF
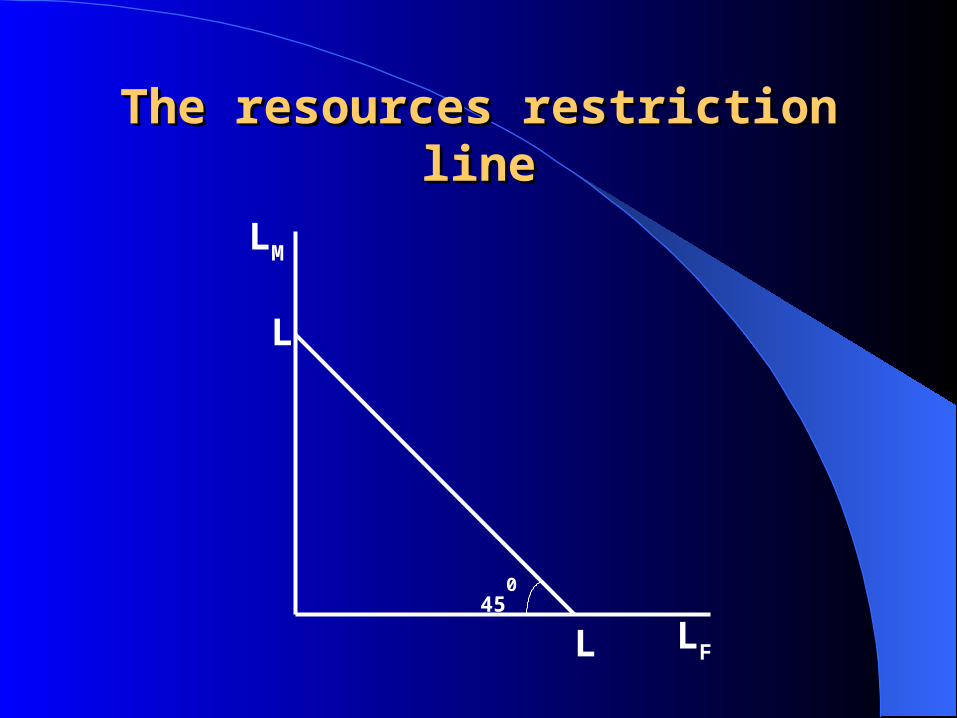
The resources restriction lineThe resources restriction line
LM
L
L LF
450

Production Possibility Frontier (PPF)Production Possibility Frontier (PPF) QF
QF=Q(T,LF)
QM
1`2`
3`
12
3
LF
LM
QM=Q(K,LM)

Slope of PP curve=-- MPLF /MPLM
The difference between the Ricardo Model and the Specific Factors Model: P43
QF
PPF
QM

ⅲⅲ. . Prices, Wages and Labor AllocationPrices, Wages and Labor Allocation
MPLM ------falls downward because of
diminishing returns
MPLM*PW ------falls downward accordingly
W------falls downward synchronously
wPMPL FF
wPMPL MM

The equilibrium of the labor marketThe equilibrium of the labor market
MPLM× PMMPLF× PF
w`
LM` LF`
total labor supply, L
LM LF
wPMPLPMPL FFMM
FMMF PPMPLMPL //
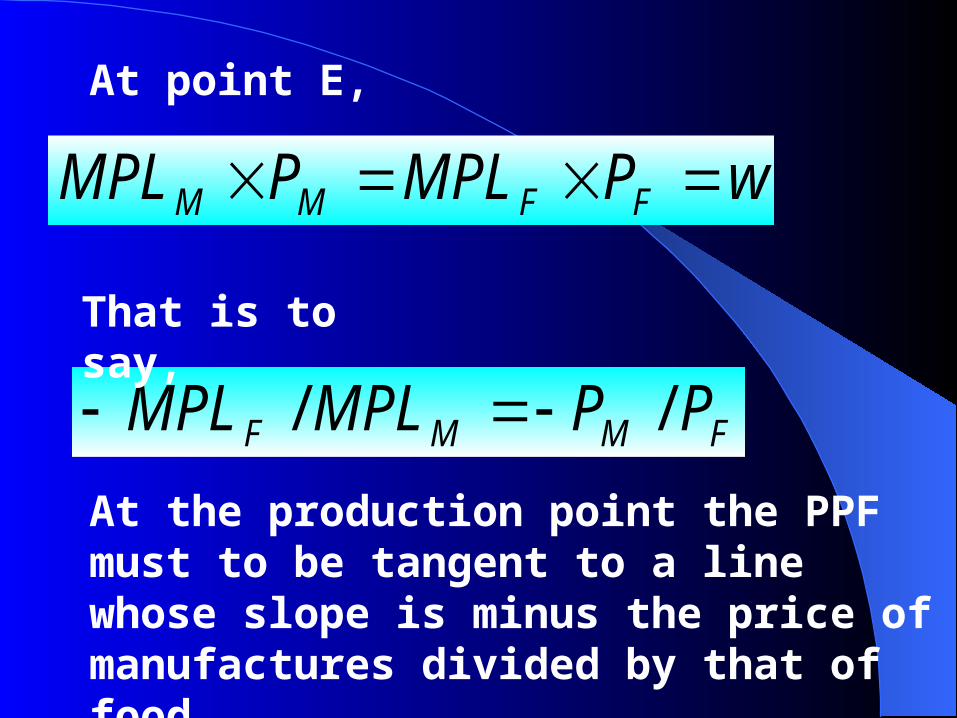
At point E,
That is to say,
At the production point the PPF must to be tangent to a line whose slope is minus the price of manufactures divided by that of food.

Production in the Specific Factors ModelProduction in the Specific Factors Model
QF
QM
slope=-(PM/PF )1 1 Q1F
Q1M
PPF

Prices changes and the distribution of Prices changes and the distribution of laborlabor
(1)An equal proportional change in prices
PM :+10% PF :+10% w: +10%
(2)A change in relative prices
PM :+10% PF:unchanged
w: rises by less than 10%
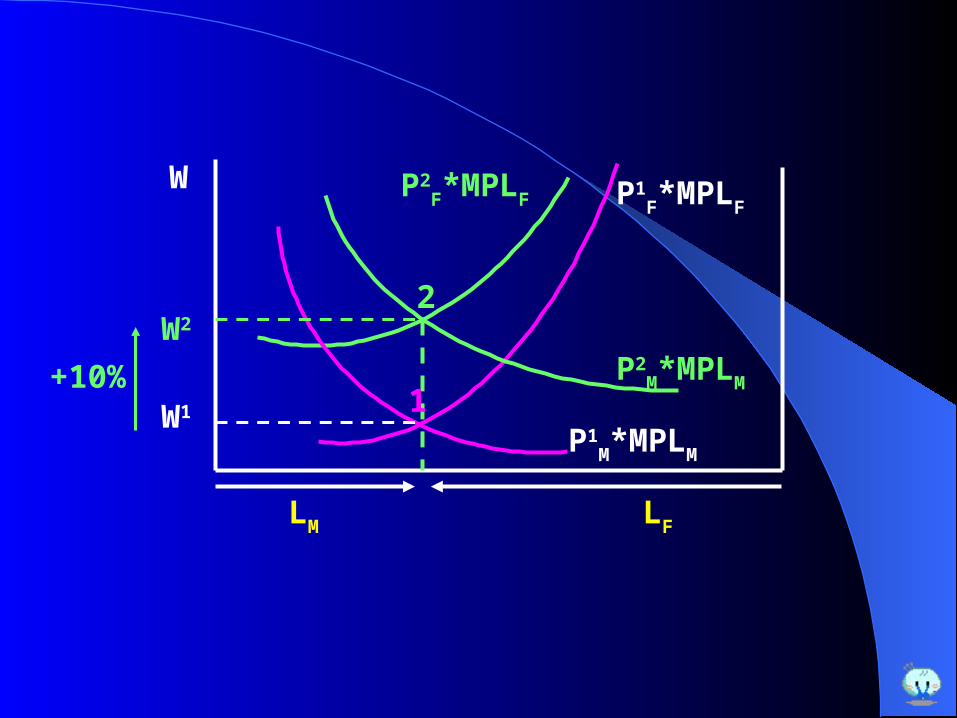
P2F*MPLF P1
F*MPLF
P1M*MPLM
P2M*MPLM
W2
W1
LM LF
2
1+10%
W

2
1
P1F*MPLF
P1M*MPLM
P2M*MPLM W2
W1
LM LF
+6%
W

ⅳⅳ. Relative Prices and the Distribution . Relative Prices and the Distribution of Income of Income
Suppose,
PM rises 10%, w rises 5%(< 10%).
Workers: w/ PM falls, w/ PF rises
The effects on workers are uncertain.

Owners of capital:
w/ PM falls, then the cost fall;
PM rises, PM / PF rises too, then the
purchasing power rises.
The welfare of them is better off.
Owners of land:
w/ PF rises, the costs rises;
PM rises, PM / PF rises too, then the
purchasing power falls.
The welfare of them is worse off.

How about the case if PM
drops 10% and PF remains unchanged?

Ⅱ. International Trade in the specific
Factors Model
Suppose,
Japan: abundant in capital
America: abundant in land
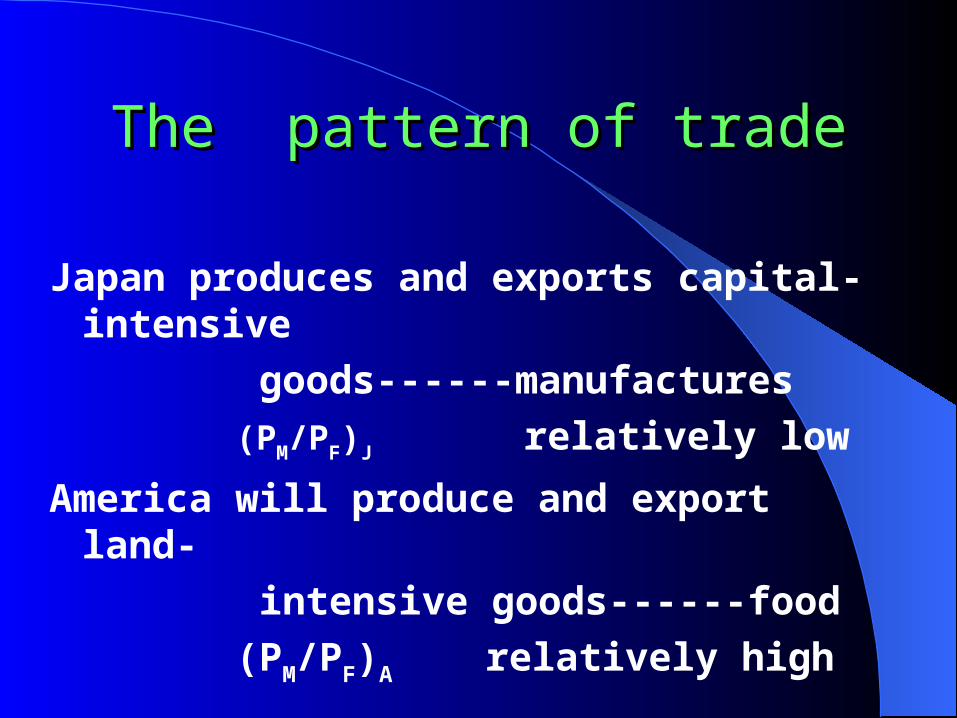
The pattern of tradeThe pattern of trade
Japan produces and exports capital-intensive
goods------manufactures
(PM/PF)J relatively low
America will produce and export land-
intensive goods------food
(PM/PF)A relatively high
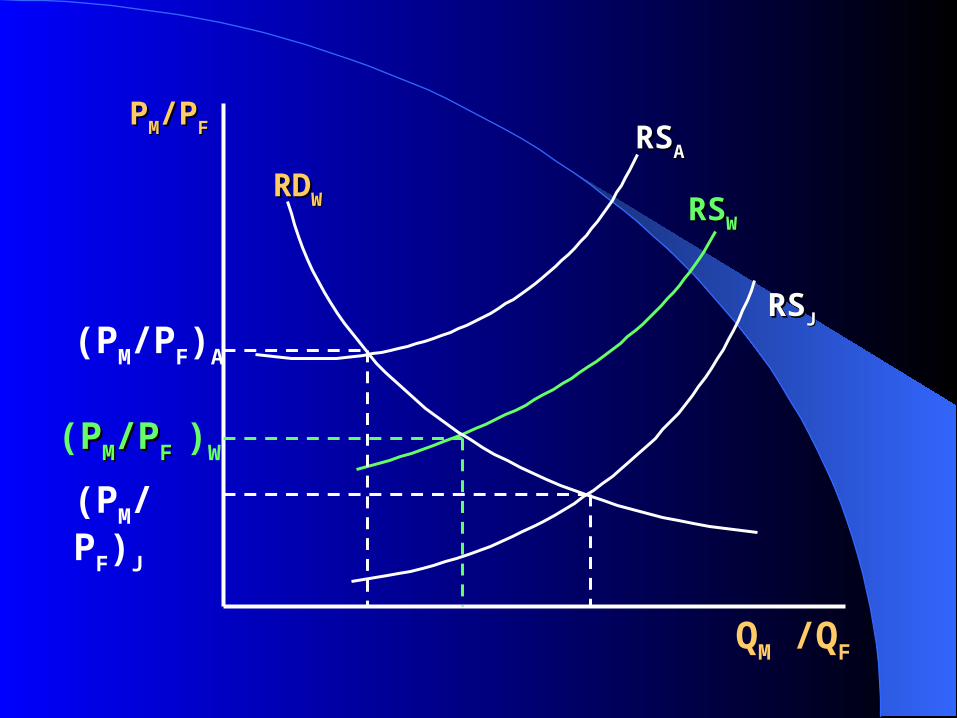
PPMM/P/PFF
(PM/PF)A
(PPMM/P/PF F )W
(PM/PF)J
RSRSAA
RSRSWW
RSRSJJ
QM /QF
RDRDWW
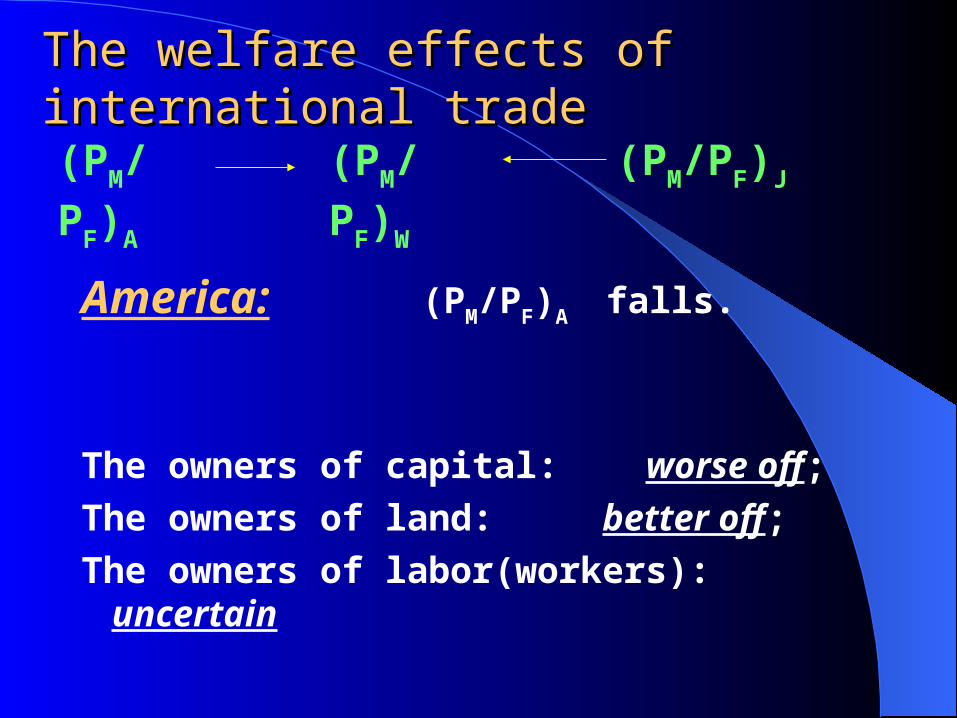
The welfare effects of international tradeThe welfare effects of international trade
America: (PM/PF)A falls.
The owners of capital: worse off;
The owners of land: better off;
The owners of labor(workers): uncertain
(PM/PF)A (PM/PF)W (PM/PF)J

The welfare effects of international tradeThe welfare effects of international trade
Japan: (PM/PF)J rises.
The owners of capital: better off;
The owners of land: worse off;
The owners of labor(workers): uncertain
(PM/PF)A (PM/PF)W (PM/PF)J

The general outcome:P55
Trade benefits the factor that is specific to the export sector of each country but hurts the factor specific to the import-competing sectors, with ambiguous effects on mobile factors.

ⅢⅢ. . The Political Economy of TradeThe Political Economy of Trade
ⅰⅰ. . Lobbying power and trade policiesLobbying power and trade policies
?? ??? ??
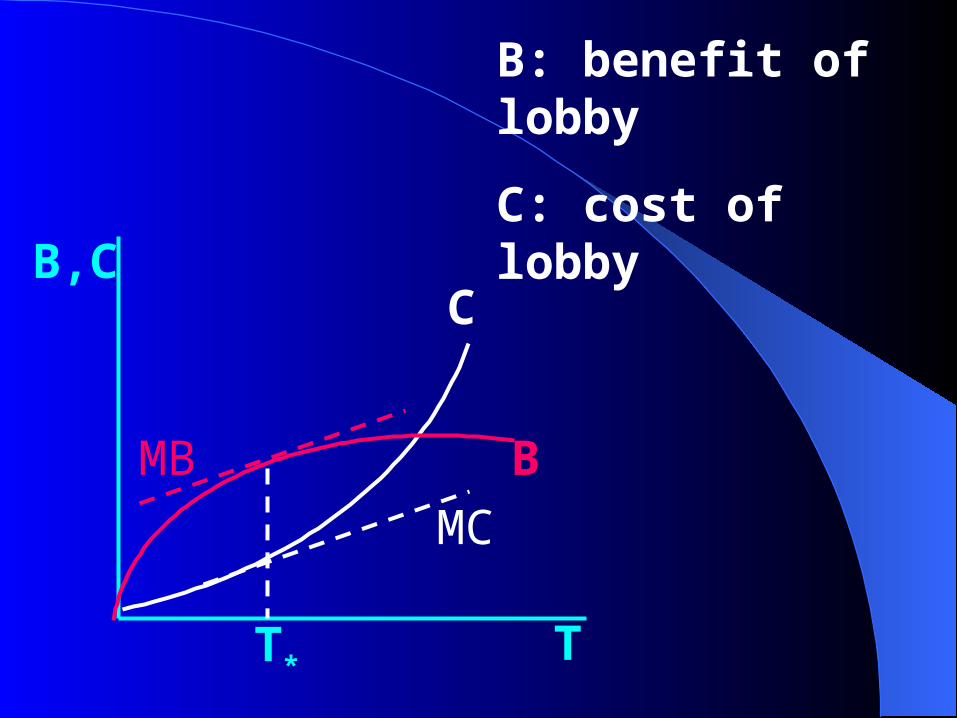
C
B
B,C
MB
MC
TT*
B: benefit of lobby
C: cost of lobby
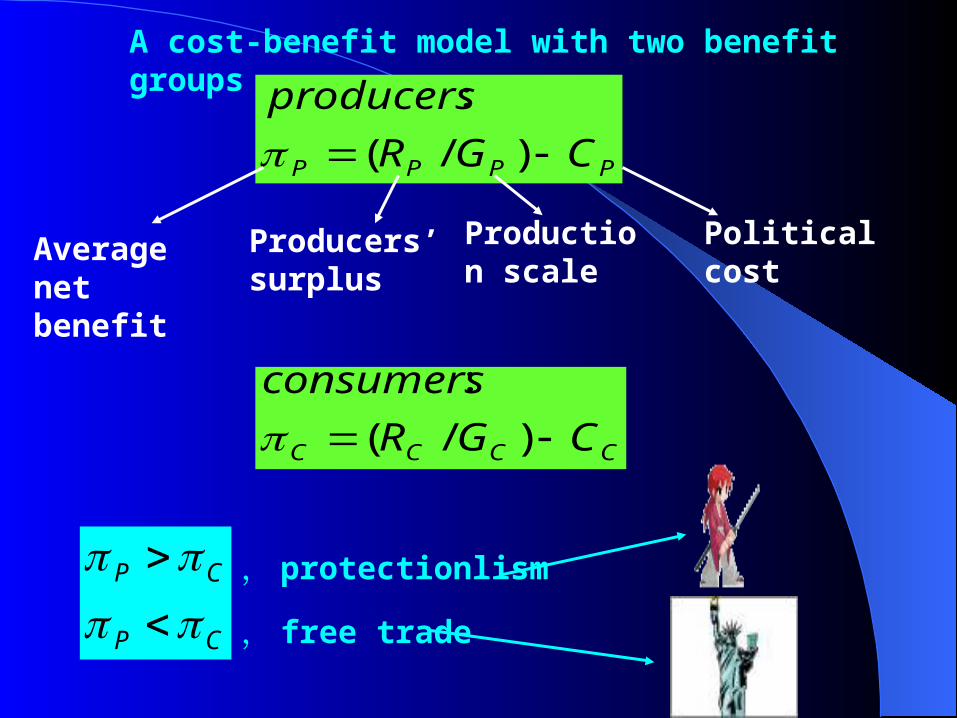
A cost-benefit model with two benefit groups
PPPP CGR
producers
)/(:
Average net benefit
Producers’ surplus
Production scale
Political cost
CCCC CGR
consumers
)/(:
CP
CP
, protectionlism
, free trade

Import quota Import quota
on sugaron sugar
Producers loss about 1.5 billion dollars per year
Consumers gain about 2 billions dollars per year

ⅱⅱ. . The theoretical support of protection- The theoretical support of protection-
ismism
1. The Second Best Theory1. The Second Best Theory ① ① J. Viner: J. Viner:
The Customs Union Issue 1950The Customs Union Issue 1950
②② J.E.Meade Graphic example 1955J.E.Meade Graphic example 1955
③③ R.G.Lipsey and K.Lancaster R.G.Lipsey and K.Lancaster
Generalize 1956Generalize 1956

H
t
A
B
CD
E
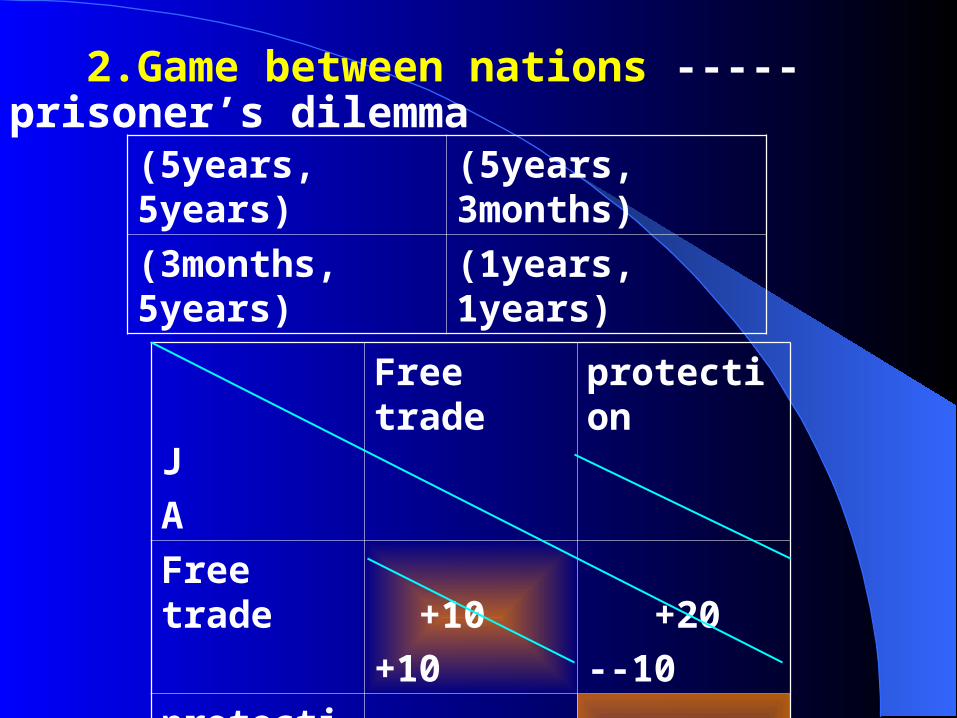
2.Game between nations -----prisoner’s dilemma
(5years, 5years) (5years, 3months)
(3months, 5years) (1years, 1years)
J
A
Free trade protection
Free trade +10
+10
+20
--10
protection --10
+20
--5
--5

ⅲⅲ. The reasons that most economists . The reasons that most economists
remain strongly in favor of more or lessremain strongly in favor of more or less
free trade?free trade?
P58 1.2.3P58 1.2.3


1.If Australia has relatively more land per worker, and Belgium has relatively more capital per worker, then if trade were to open up between these two countries, A. the relative price of the capital-intensive product would rise in Australia. B. the world price of the land-intensive product would be higher than it had been in Belgium. C. the world price of the land intensive product would be higher than it had been in Australia. D.the relative price of the land intensive product would rise in Belgium. E.None of the above.
Answer: C

2. If Australia has more land per worker, and Belgium has more capital per worker, then if trade were to open up between these two countries, A. Australia would export the land-intensive product. B. Belgium would import the capital-intensive product. C. Both countries would export some of each product. D. trade would not continue since Belgium is a smaller country. E.None of the above.
Answer: A

3. If Australia has more land per worker, and Belgium has more capital per worker, then if trade were to open up between these two countries, A. the real income of capital owners in Australia would rise. B. the real income of labor in Australia would clearly rise. C. the real income of labor in Belgium would clearly rise. D. the real income of landowners in Belgium would fall. E. the real incomes of capital owners in both countries would rise.
Answer: D

Essay Questions
In 1986, the price of oil on world markets dropped sharply. Since the United States is an oil-importing country, this was widely regarded as good for the U.S. economy. Yet in Texas and Louisiana, 1986 was a year of economic decline. Why?
Answer: The major exporting industry located in these two States is Oil extraction and refining. Since the factors of production specific to the oil industry could not shift out of them smoothly and quickly, their real income suffered.