International Competition in the Footwear...
72
E. iX b ^ ' SoG INDUSTRY AND ENERGY DEPARTMENT WORKING PAPER INDUSTRY SERIES PAPER No. 51 International Competition in the Footwear Industry Keeping Pace withTechnological Change" December 1991 * < t !,-t'2.-'?' tS';; ' '.":>, *(t >'ts The WorldBank Industry and EnergyDepartment, OSP Public Disclosure Authorized Public Disclosure Authorized Public Disclosure Authorized Public Disclosure Authorized
Transcript of International Competition in the Footwear...
E. iX b ^ ' SoG
INDUSTRY AND ENERGY DEPARTMENT WORKING PAPERINDUSTRY SERIES PAPER No. 51
International Competitionin the Footwear IndustryKeeping Pace with Technological Change "
December 1991
* < t !,-t'2.-'?' tS';; ' '.":>, *(t >'ts
The World Bank Industry and Energy Department, OSP
Pub
lic D
iscl
osur
e A
utho
rized
Pub
lic D
iscl
osur
e A
utho
rized
Pub
lic D
iscl
osur
e A
utho
rized
Pub
lic D
iscl
osur
e A
utho
rized

INDUSTRY AND ENERGY DEPARTMENT WORKING PAPERINDUSTRY SERIES PAPER NO. 51
International Competitionin the Footwear IndustryKeeping Pace with Technological Change
December 1991
The World Bank Industry and Energy Department, OSP
INTERNATIONAL COMPETITION INTHE FOOTWEAR INDUSTRY:
KEEPING PACE WITH TECHNOLOGICAL CHANGE
Ashoka Mody*, Rajan Suri**, Jerry Sanders**and
David VanZoest***
December, 1991
* The World Bank, Washington, D.C.** University of Wisconsin, Madison*** Caterpillar Inc., Peoria

TABLE OF CONTENTS
Page No.
PREFACE
1. IlNFRODUCTION .............................................. 1
1.1 Overview 1......... ,1.2 World Market Tends ............................ * 213 Location of Production .*.................. 31.4 Scope of the Study .................................... S1.5 CountrySyliztions .............................. 61.6 Plan of the Study ............................... 7
2.. THREE MANUFACIURERS: A STUDY IN CONTR'SS TS. ............... 12
2.1 Objectives ........................................... 92.2 Technology Usage Summary .............................. 92.3 Developed Country Fim: Company A ...................... 102.4 Newly Industrializing Economy Firm: Co.npany D .... .......... 122.5 Less Devloped Countty Firm: Company G. ................. 13
3. FOOTWEAR MANUFACrURING: THE BENCHMARK ................. 15
3.1 Background ........................................... 1S3.2 Manuicturing Process .................................. 163.3 The Benchm-irk Factories: Physical Indicators ................. 183.4 Input Costs .......................................... 223.5 Benchmark Costs ...................................... 233.6 Scale Economies ...................................... 253.7 Discussion of the Bendhmark .............................. 25
4. LEARNING TO PRODUCE ...................................... 29
4.1 Objective ........................................... 294.2 Currnt Best Prwice ................................... 304.3 Future Best Practice .................................... 314.4 Th Learning Process ................................... 32
TIhning and Organizational Change ..... .................. . 32Productivity 'Dip and OthaIn estments ..................... 34Infrastructure . . . 36
4.5 Summay ............................................ 36
5. AUTOM4AI1ON AIND NEW MLATERALS ...... ................... ... 38
5.1 CuttingAutomation: CAD N . ............. ............. 385.2 Asembly Automaton ....... ........... ................. 405.3 he bFuture and Action Leater ........ .. ................. 41

Table of Contents (contd.)
Page No.
6. CONCLUSIONS ............................................... 46
6.1 Technical Change ...................................... 466.2 Players: Old and New .................................. 4763 PolicyImplications ..................................... 48
APPENDIX A. CHINA'S LEAD IS DUE TO LOW WAGES AND FOREIGN EXPERTISE 51
APPENDIX B: MODELING THE FACTORIES ............................. 54
BIBLIOGRAPHY .................................................. 57

PREFACE
Competition in a period of rapid technological change is the subject ofthis and three companion reports.i' Four relatively mature industries of considerableintere t to less developed countries were chosen to investigate whether organizationaland technological innovations are of any relevance to them. The answer is arcsounding yes. Organizational changes, automation, and use of new materials tochange the production process and to transform the product itself were found to be oftremendous importance in each sector. These changes quite overwhelm simpledifferences in factor costs.
This research was financed by the World Bank's Research Committee, towhich we are all very grateful. Numerous colleagues have supported this work and wewould like specially to thank Nancy Barry, Carl Dahlman, Sandra Salmans, and MasamiShimizu. Our greatest debt is to managers and engineers in dozens of companies in sixcountries who speiit their valuable time with us.
1/ International Trends in the Steel Mini-Mill Industry.International Competition in Printed Circuit Board Assembly.International Competition in the Bicycle Industry.

1. INTRODUCTION
1.1 Overview
Diffusion of innovation proceeds at varying rates in differentcountries, creating differences in the productivity with which resources areused, and hence affecting the competitive position of nations. At thismoment, there is a special ferment in the world of manufacturing as organiza-tional innovations, automation, and new materials are transforming not onlythe manufacturing process but also, in many cases, the product itself. Thespeed at which these innovations are absorbed is likely to have a significantimpact on a country's ability to compete. Developing countries face a specialchallenge as they determine how best to keep pace with the changes.
In this study, we project the effect of innovative manufacturingtechnologies on the long-term productivity of firms and countries. We believethat, through such analysis, we are enriching the debate on differences inirternational productivity, and suggesting new policy directions to improveproductivity in developing countries.
Manufacturing processes worldwide are being transformed bycomplementary developments. Perhaps the more important relates to organiza-tional change within the firms. Pioneered by the Japanese and associated withvarious names, such as total quality control, kaizen and just-in-time, it hasset new standards for scrap maragement, machine reliability, inventorycontrol, and worker training and participation. Firms successfully adoptingthese practices have uniformly reported large gains in productivity.
The other major influence on manufacturing has come from micro-electronics-based technologies. These technologies are permitting increasedautomation of a wide range of operations in many industries. Ultimately, itis expected that, in specific sectors, electronics controls could transformdiscrete (or batch) production into an almost continuous process requiringlimited human intervention.
What implications does this have for the footwear industry? Willthe advent of new technologies pose a threat to footwear manufacturing indeveloping countries? If so, what options are available to companies in thesecountries and how can these options best be exploited?
In this report (as in companion repcrts), our central task is toaccount for differences in costs of production acrosz countries and to predicthow the level and structure of costs will evolve as organizational changes andautomation diffuse more widely. The evolution in costs will influenceproduction and trade patterns. We relate our findings on technology trends totrends in international trade. The systemic nature of the technologicalchange is emphasized. Hence the need for better information, long-terminternational relationships with producers and buyers, improved workertraining and incentives, and the key role of infrastructure are discussed inthe concluding chapter.

-2-
1.2 World Market Trends
International trade in footwear exploded in the mid-1980s, after aperiod of relative stagnation. In 1983, shoes worth $10 billion crossedinternational borders. By 1987, the value of trade had doubled to $20billion. Markets in the United States, Europe and Japan shared in thisexpansion. Since 1987, however, trade has again slowed down, as Table 1.1indicates. The quantity of shoes purchased by the United States actually fellin 1987, 1988 and 1989; European imports declined in volume and value in 1989.Only Japan has continued as a steadily growing market.
Table 1.1: MAJOR IMPORTERS OF FOOTWEAR
198u 1981 1982 1983 1984 1985 1986 1987 1988 1989
Value of Trade (USS billions)
World 10.7 10.1 10.3 10.5 11.9 13.1 16.4 19.7 21.4 21.9United States 2.8 3.0 3.3 3.8 5.0 5.9 6.7 7.4 8.1 8.3Japan 0.3 0.3 0.3 0.3 0.4 0.4 0.5 0.8 .1 1.1West Germany, France,and United Kingdom 3.9 3.2 3.2 3.1 3.2 3.3 4.6 5.8 5.6 6.1
Unit Value index(US 1980-100)
United States 100 90.3 93.0 91.2 93.1 127.3 125.1 133. 1A4.0 -Japan 76.8 79.5 84.0 82.8 84.8 83.2 99.3 122.4 145.1 149.1West Germany, Franceand United Kingdom 154.4 134.5 128.8 132.9 130.7 123.4 171.9 194.5 200.6 197.4
'lote: Footwear Trade is the sum of SITC categories 85101 and 85102.
Source: UN Comtrade Database. Geneva.
Many factors have contributed to this sluggishness. The U.S.market for shoes appears to be finally saturated. Per capita consumption ofleather-based athletic shoes has fallen in the last few years. Rising pricesof inputs and a weaker dollar have contributed to stemming the seeminglyendless demand.
Increased competition in a sluggish market has forced companies toraise their investment substantially in "high-tech" and marketing. The latestfootwear products have been described as: "Not just athletic shoes, they arespace age wonders that boast such features as air-cylinder suspension systems,anatomically molded ankle collars, outrigger soles and adjustable supportstraps" (business Week, August 28, 1989). In addition, major companies, suchas Nike, are building obsolescence into their products by changing most oftheir line every six months. Such an aggressive approach does not come cheap,and the costs of entry into the athletic footwear business are sharply higher.
The turbulence of the athletic shoe market does not extend to mostother shoe products. However, product differentiation is a key element ofcorporate strategy and international trade in all categories of footwear.Trade in differentiated footwear is particularly evident in Europe. Europeancountries ship relatively high-priced and differentiated products across

borders, mainly to each other. The average price of a shoe purchased by majorEuropean countries is more than 50 percent higher than that of a shoe importedinto the United States or even Japan. As growth in the shoe market slows,product differentiation will be used increasingly as a competitive tool.
Trends in product differentiation and rapid obsolescence are beingaided by new technological developments. The most significant innovationshave been compu-er-aided-design (CAD) and microcomputer-based managementsystems. CAD seems tailor-made to the footwear industry. It allows designersto create new styles on computer without constructing many prototypes. It alsoconverts designs into patterns, and grades the patterns by computer, thusspeeding up the design process. CAD systems can save time, labor andmaterial, as well as inmprove quality. Microcomputer-based management systems,more generally, are relevant for variotus industrial processes; they includesoftware for accounting, materials management and production scheduling andinventory control.
Other technologies that either save labor or reduce the cycle timeof production include computer-controlled stitching (which can lead toproductivity increases of at least 25 percent), numerically-controlled upperroughing (which automatically directs a brush to roughen part of the upper toprovide a base for cementing), injection molding (which automatically molds ashoe bottom to the upper), and automatic sole laying (which determines thecontour of a shoe's bottom and adjusts accordingly in attachirg the sole).
Admittedly, there are limits to both the new technologies andtheir degree of acceptance by industry. Stitching, the most labor-intensiveaspect of shoemaking, is still largely unautomated. And most of the tech-nologies require large-scale production and long runs to be cost-effective;thus they have been adopted only by the largest footwear marufacturers.
However, the advent of these technologies has had the effect ofreviving the moribund footwear industry in the United States - and raising anunexpected competitive challenge to firms in NIEs and LDCs. In the shortterm, the low cost of production will continue to work in favor of NIEs andLDCs. But in the long run, mass producers in developed countries could gain acompetitive advantage over even low-cost LDCs.
1.3 Location of Production
For years, the direction of footwear manufacturing - from high-wage, developed country to low-wage, developing country - has been one of theindustrial world's more predictable trends. Although styles and materialsmight change each season, it seemed inevitable that the labor-intensivebusiness of shoemaking would shift increasingly each year to nations withlarge, inexpensive puols of labor.
Two new participants of significance have emerged in the league ofmajor exporters: Portugal, exporting mainly to Europe, and China, exportingto the United States and also to Japan. Other challengers waiting in thewings are Thailand and Indonesia. Since 1987, China has come to dominateexport markets and will soon export more shoes than any other countiy.

- 4 -
Already in the first quarter of 1990, China was the second largest exporter ofshoes (after Taiwan) to the United States. (See Appendix A on China.)
The movement of the footwear industry toward lower-wage countriesis often initiated by manufacturers in the newly industrializing economies(NIEs) -- some of whom make shoes under contract for Nike, Reebok Interna-tional, and other large companies headquartered in developed countries (DCs).A number of Korean footwear companies, including the HS Corporation, perhapsKorea's largest exporter of shoes, are involved in some form of manufactur'ng,including joint ventures, in Indonesia. Scores of Taiwanese footwear com-panies have recently moved into China, often - because of Taipei's restric-tions on direct investment in China - through Hong Kong-based partners.
Yet now, footwear manufacturing, as tradition-bound as virtuallyany industry, is in the throes of change that could slow, if not reverse, thattrend. Recent technological changes such as computer-aided design andmanufacturing (CAD/CAM) and laser cutting have suddenly made it feasible forcompanies in developed countries to reclaim their domestic market, if not tocompete overseas.
As a result, the U.S. industry, which had been contractingsteadily since at least the late 1960s, is actually recovering lost ground -reopening plants, increasing employment, raising its rates of factory utiliza-tion and productivity.
For long the world's largest importer, the U.S. has started buyiagfewer shoes. U.S. imports of shoes rose rapidly in the early 1980s (doublingfrom 300,000 pairs per year to 600,000 between 1980 and 1984). Between 1987and 1989 imports declined, though they increased again in 1990. (Because ofdifferences in classification, U.S. import statistics show a very sharp fallbetween 1987 and 1988 and a continued decline in 1989).
Three factors appear to account for the recent trends in U.S.footwear imports. First, the large expansion in consumption following theintroduction of many new types of shoes seems to have run its course. Afterrising sharply, per capita consumption has stabilized. Second, the devalua-tion of the U.S. dollar has made imports more expensive.
And finally, U.S. shoe producers have become more competitive.U.S. footwear production, having spiralled downwards for over two decades, hassteadied itself and may even have risen somewhat. U.S. production of nonrub-ber footwear increased 6 percent in 1988 to about 235 million pairs - thefirst increase since 1976, and a reversal of the downward trend that began in1968, when U.S. production peaked at 642 million pairs. U.S. exports are alsoup substantially, although from a very low base.
The adoption of microelectronics-based technologies has had someeffect in sustaining the competitiveness of developed country firms. Largefirms that have survived the onslaught of low-wage competitors have made themost significant investments in automation. These firms are simultaneouslyadopting just-in-time type practices. Some of them already have close linkswith suppliers and retailers, further strengthening their position. With a
- 5 -
clearer emphasis on product differentiation, DC firms could certainly stem thehistoric decline of the industry, even reverse it.
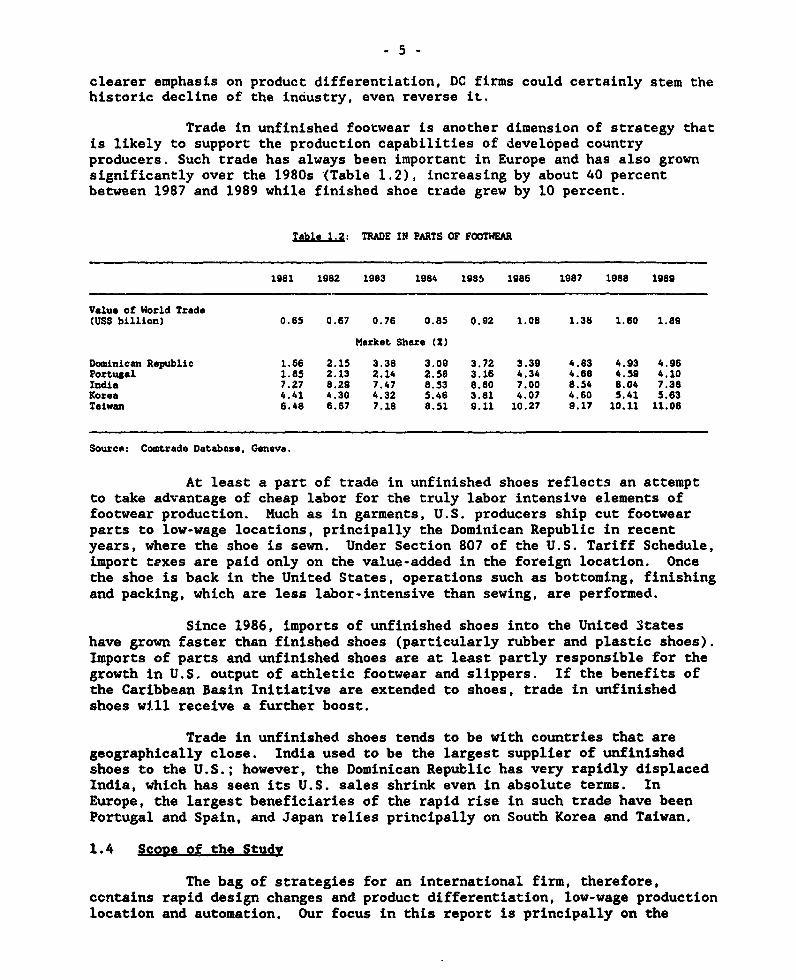
Trade in unfinished footwear is another dimension of strategy thatis likely to support the production capabilities of developed countryproducers. Such trade has always been important in Europe and has also grownsignificantly over the 1980s (Table 1.2), increasing by about 40 percentbetween 1987 and 1989 while finished shoe trade grew by 10 percent.
Tgble 1.2: TRADE IN PARTS OF FOOTWEAR
1981 1982 1983 1984 1985 1986 1987 1988 1989
Valuo of World Trade(USS billion) 0.65 0.67 0.76 0.85 0.92 1.08 1.36 1.60 1.89
Market Sbare (X)
Dominican Republic 1.66 2.15 3.38 3.09 3.72 3.39 4.83 4.93 4.96Portugal 1.85 2.13 2.14 2.58 3.16 4.34 4.68 4.59 4.10India 7.27 8.29 7.47 8.53 8.80 7.00 8.54 8.04 7.38Korea 4.41 4.30 4.32 5.46 3.81 4.07 4.60 5.41 5.63Taiwan 6.48 6.67 7.18 8.51 9.11 10.27 9.17 10.11 11.06
Source: Comtrade Database, Geneva.
At least a part of trade in unfinished shoes reflects an attemptto take advantage of cheap labor for the truly labor intensive elements offootwear production. Much as in garments, U.S. producers ship cut footwearparts to low-wage locations, principally the Dominican Republic in recentyears, where the shoe is sewn. Under Section 807 of the U.S. Tariff Schedule,import texes are paid only on the value-added in the foreign location. Oncethe shoe is back in the United States, operations such as bottoming, finishingand packing, which are less labor-intensive than sewing, are performed.
Since 1986, imports of unfinished shoes into the United Stateshave grown faster than finished shoes (particularly rubber and plastic shoes).Imports of parts and unfinished shoes are at least partly responsible for thegrowth in U.S. output of athletic footwear and slippers. If the benefits ofthe Caribbean Basin Initiative are extended to shoes, trade in unfinishedshoes will receive a further boost.
Trade in unfinished shoes tends to be with countries that aregeographically close. India used to be the largest supplier of unfinishedshoes to the U.S.; however, the Dominican Republic has very rapidly displacedIndia, which has seen its U.S. sales shrink even in absolute terms. InEurope, the largest beneficiaries of the rapid rise in such trade have beenPortugal and Spain, and Japan relies principally on South Korea and Taiwan.
1.4 Scope of the Study
The bag of strategies for an international firm, therefore,contains rapid design changes and product differentiation, low-wage productionlocation and automation. Our focus in this report is principally on the

- 6 -
emergence of low-wage producers as major exporters and on the possibility thatautomation may curtail or reverse that development. We will also examine thepotential role of NIEs both as production centers and as mediators betweenlow-wage producers and international markets.
Being internationally competitive takes a lot of doing: materialsmust be procured efficiently from domestic and overseas sources, productionmust be organized efficiently and staff motivated appropriately, links withbuyers must be maintained to obtain timely information on trends in demand,and so on. We are in no position to analyze the entire chain of activities.Our focus is on the manufacturing process (See Figure 1).
There can be little doubt that efficiency in manufacturing will bea key ingredient of success, at least for the less developed and newlyindustrializing countries. It is our conjecture, moreover, that certainunderlying principles of rianufacturing (efficient management and good flow ofinformation) hold equally for other components of the value chain.
A related boundary on the quantitative exercise is our focus onproduction costs. We have emphasized above that competition is multi-facetedand depends on the firm's ability to respond flexibly to customer needs,implying that low costs are not the only factor determining competitiveability. We have been able tc quantify costs in very great detail, as willbecome evident in the following chapters. However, quantifying the benefitsof flexibility and superior product characteristics is much more difficult.This is unfortunate since many of the more innovative processes we study leadprimarily to gains in flexibility and r-oduct enhancement. Our approach hasbeen to discuss quality and flexibility ith ordinal measures and, moreimportantly, to discuss the trade-offs I .ween product characteristics,flexibility, and cost. For example, wh .i a process leads to an obviousimprovement in product characteristics but limited increase in productioncost, then it is relatively safe to conzlude that the procei.s is likely todiffuse widely,
1.5 Countrv Stylizations
It is a long-held principle among economists that systematicdifferences in operational efficiency across countries cannot persist overlong periods of time. Any such differences, acc-r-ring to the conventionalwisdom, would soon be wiped out by economics' inv' .ble hand. Leamer 1984,for example, says that unless there exist "biologi :1 differences" between thenationals of different countries, or "effective counterintelligence agents,"all economies should be equally efficient in the tasks they perform.
Like other researchers, however, we have observed empirically thatthis mind set does not correspond to reality. In this sector and others, wefind that some of the newly-industrializing economies operate at a consistent-ly higher level of efficiency than other country types. They invest moreeffectively, learn faster, and stabilize their production at higher levels ofefficiency.

It would be pointless to dismiss such differences as illusory.Indeed, we strongly believe that, by examining their causes, we can enrich thedebate on international productivity differences.
In this and companion studies, the firm has emerged as a dynamicorganization, even in those industries previously thought to be mature. Thesuccessful firm is in a constant state of flux as it introduces and absorbstechnical and, above all, orgartzational innovation: automation in design andmanufacture, design for manufacture, quality control and inventory management.
For the firm, then, the learning curve is extremely steep - but sois the reward. In fact, it is probably safe to say that the firm's positionon the learning curve is more critical to its success than other, exogenousfactors. Firms - notably LDC manufacturers - that are only at the beginningof the curve are substantially less efficient than those at the end, and noteven cheap labor - as in the case of LDCs - can make up the differences.
Accordingly, we set ourselves the task of accounting fot efficien-cy differences in terms of operational characteristics, and then discussinghow performance, as defined by those characteristics, could be improved. Wedo not trace the learning curve, or limit our analysis to the beginning andend. Rather, we observe the process at several points in time - almost likesnapshots - and discuss, in a qualitative way, how to advance from one to thenext.
In our quantitative exercises, therefore, we introduce importantstylizations regarding the level of efficiency attained. Of the three groupsof countries we study, we assume the newly-industrializing economies (NIEs) tobe the most efficient. These were represented in our study by South Korea andSingapore. Although our interviews in Japan provided us with substantialinformation on the frontiers of production technology, the benchmark costestimates for developed countries (DCs) are based on conditions in the UnitedStates. Less-developed countries (LDCs) are represented by Mexico andIndonesia. After demonstrating the impact of inefficiencies, we examine costdifferewtials across groups if they all operated at the NIE level of efficien-cy. That comDarison allows us to study the effect of factor costs--the costsof labor, land and capital--and technology choices.
1.6 Plan of the Study
Product and manufacturing strategies of a sampling of firmsvisited for this project are described in the next chapter. On the basis ofthese visits, the manufacturing literature, and our engineering knowledge andexperience, we created benchmark factory cost models defined at a fine levelof specification (Chapter 3). These benchmark models are intended toreplicate production costs of "representative" factories in the countriesvisited. A series of cost scenarios based on the adoption of modernmanagement practices and new hardware technologies are examined in Chapters 4and 5. Throughout, the lessons from our cost models are illustrated withconcrete case studies based on our field visits and the industry literature.The concluding chapter comments on the shifts occurring in the competitiveabilities of different country types.

*~ XI
Corporate | AccountingI Manag ement 1
,... .. .... ..................:Management Mater_
-. 0 aeil
~~ i § | § § \ ~~~~~~~~~~Procuremn
| ', | ~Design | |\+
Z <S>: ~~Materials:T S ' ~~~Inventoryr
a ;E i I Assembly
t i i .~~Control|i
FinishedGoods
i Inventory
,__________________ Cost of Production'' Estmated at this Point
Distnbution
Figure 1.1

- 9 -
2. THREE MANUFACTURERS: A STUDY IN CONTRASTS
2.1 objectives
In the following chapters, we will simulate changes in unit costswhen alternative techniques are adopted by stylized, country-specific bench-mark factories. The discussion here provides some of the basis for styliza-tions discussed later in the report. We summarize first the basic pattern oftechnology adoption by companies visited for this project and then discuss insome detail three companies, each representing one of the three country types.The objective is to relate the choice of production technique to the company'seconomic environment, product strategy, and human resource strategy.
ThLirteen shoe producers in six countries were studied in con-siderable depth, usually over a day with some follow-up questions and visits.In additiou, similar interviews were conducted with 29 other firms (in theelectronics assembly, bicycle, and steel industries), and the stylizationsthat emerge for shoe production conform with the overall project results.
The manufacturers we visited were chosen for their represen-tativeness of one of the three country types. Extensive consultation withindustry and country experts, review of the industry literature, and ourindustrial consulting experience was the basis for choosing particular firms.The visits were not intended to generate primary data on the basic manufactur-ing process; that was derived from our experience and expertise. The visitswere intended, instead, to enhance our grasp of the range of manufacturingcompetence. Within a country type, factories in the four industries resembledeach other more closely in terms of key operational characteristics than didfactories in the same industry across country types. Thus, the relativelymodest number of visits to manufacturers in each sector was effectivelyamplified by visits to manufacturers in other sectors.
2.2 TechnologX Usage SummarX
Before examining in detail three footwear companies, one each inthe three country types, consider first the summary of technologies in use atthe footwear factories visited. See Table 2.1.
Computer-Aided Design (CAD) is well on its way to becoming anindustry requirement, but Computer-Aided Manufacturing (CAM) for cutting andautomation for sewing are spreading only slowly. This is consistent with ourresults on the limited impact of such automation technologies. CAD is beingused less for immediate cost reduction and more for the learning it issupporting as firms prepare to introduce automation down the line.
Though, as expected, DC firms are most advanced in design andmanufacturing automation, NIE firms have made greater progress in the area of

- 10 -
internal quality control and inventory management.)' These efforts do notstrictly correspond to the purist's view of total quality control (TQC) orjust-in-time (JIT) techniques. However, they were sufficiently developed togive the NIE firms a solid cost advantage over firms in other countries.
As we shall discuss below, consciousness of product qualityassurance programs has risen greatly in the United States and formalprocedures are being instituted widely in footwear and other industries.However, our observation is consistent with that of others who also find NIEsto have taken the lead over some DCs in shop-floor planning and reduction ofwaste (see Womack and associates 1991).
JIT is not merely an inventory reduction method but is also aninstitutionalization of continuous learning through incremental changes.Unlike MRP, which is serves as a high-level database and provides overallmaterials management function, JIT emphasizes focus on shop-floor practices.JIT is a tool for the systematic elimination of waste in all aspects ofmanufacturing. It is clear bcth through the factory visits and through ourconsulting experience that the NIE firms have progressed beyond U.S. firms inthis regard. This is reflected, as will be discussed in the next chapter, inindicators such as lower scrap, shorter cycle times, greater machine relia-bility at the NIE factories when compared with the U.S. factories.
2.3 Develooed Country Firm: ComDany A
Company A is a large mautufacturer of leather dress shoes, withsales of over $100 million from its footwear division. It operates manyfactories, the newest of which is 10 years old, along with component factoriesthat supply its sub-assemblies. The Company has been making shoes for over100 years and is well-established in its domestic market.
Company A was the most advanced firm we visited. It has a largeresearch and development department that is aware of modern manufacturingtechnologies and strategies, and has begun to plan and implement some of thesetechnologies within its design and manufacturing processes.
Our visit included an extensive tour of Company A's "showcase"factory. It employs 350 people and has a capacity slightly greater than the1.1 million pairs produced by the MANUCOST benchmark model.
1/ Firm J, an LDC firm, made an injection molded shoe and hence processautomation there was of a very different character than the sewingoperation in other firms.

- 11 -
COUNTRY DC NIE j LOCCOMPANY EI I I
A a | C D |E f G | I |J |K |L |
TECHNOLOGY
CAD o o °
CAD/CAI I I I I -- F -I I I I I-dI Cutting Automation l lICAD/tCAM o I Io I I I I I I I I I I I
Assembly Aut omat iono[ o 1Internal Quality ll l l l l Control [0° .. I..I. l lj.Il I.IInventory Control j 0o o ,*j* |*|l oIllj
New MateriaLs T I
General Use l l I lComputers I * * * * I . 1.
Technology in PLaceo TechnoLogy Being Considered
Table 2.1: TECHNOLOGY USAGE SUMMARY
The highly competitive, fashion-conscious market for leather dressshoes has forced Company A to be design-driven. The initial shoe design iscreated on a three-dimensional CAD system developed in-house by softwareengineers. Company A's management believes the design and development of aCAD system are justified solely on the system's merits as a design aid, andthat its ability to decrease significantly the lag time between design andproduction is critical to the company's success. In the future, Company Ahopes to eliminate the need for a shoe prototype by creating and presenting acomputerized three-dimensional "solid" representation of each new style.
The CAD system performs a number of non-design functions, too. Itcreates the patterns (as flat representations) required to produce the baseshoe, and then 'grades" these patterns across all shoe sizes. Each patterncan be downloaded to a laser cutter which, in turn, cuts highly accuratepatterns from which the dies required for manufacturing can be machined.
Although Company A has gained extensive technical expertise andknowledge from developing a CAD system capable of limited CAM interfacing, thecompany has not yet extended this technology to its shop floor. However,management is currently justifying the implementation of a CAD/CAM system thatcan optimize die placement at the synthetic cutting stage of insole produc-tion. Our CAD/CAM scenario suggests this will give the Company a significantcompetitive advantage through savings in labor and materials.
The factory operation itself is less highly automated. Stitchingis extremely labor-intensive, although some of the machines have been retro-fit with sewing guides that allow "automatic" stitching of fancy details onthe uppar. Because of the labor intensity of the closing operation, the

- 12 -
company imports a significant percentage of its uppers. Company A hasresearched the potential for automating the stitching operations, and hasconcluded that revolutionary techniques, such as stitching from one side ofthe material, must be developed.
The lasting department is the most advanced area of this factory.The relatively new (less than five years old) lasting machines are designedfor flexibility; they can be quickly set up to accommodate any size or styleof shoe. A rack conveyor system automatically transports the shoe assemblydirectly to the necessary operations. Each operation, however, requiresskilled employees to load, adjust, operate, and unload both the lastingmachines and the heat treating processes.
It is not until the packing department that the shoes are in-spected for quality. The problem with such a system is that the value-addedmanufacturing operations have already been performed; thus, scrapping orrepairing a defective shoe is expensive. Quality is an important, but not adriving, force at Company A. Its shoes sell for $30 to $60, and consumersview them as being of "reasonable" quality.
Company A has several inherent advantages that should help itadapt weli to JIT. First, its size puts it in a strong position to demandthat suppliers make JIT deliveries of components and raw materials. Second,since it manufactures many of its components in-house, it could work tocoordinate delivery times between its shoe and its component factories.Third, the Company owns its own retail outlets, allowing it to coordinatefinal goods shipment from the production line directly to the store, ratherthan the current practice of shipping from a centralized warehouse.
However, the Company must eliminate several obstacles before itcan completely assimilate JIT. It now contracts out at least half of thecomponents required for shoe production, using many different suppliers ofeach component to reduce risk. JIT implies a move to single-source suppliers- in-house as well as external - to encourage long-term relationships.
A second obstacle is the instability of the women's shoe market.JIT requires fairly constant demand and stable lead times, criteria that maybe difficult to attain. Thus the Company must have control of its manufactur-ing processes such that lead times are stable, and then work to establishconstant demand. Still, the Company would benefit from working toward JITwhile keeping these issues in mind.
2.3 Newly Industrializing Economg Firm: ComDanv D
Company D is a large Korean manufacturer of leather athleticshoes. It targets 20 percent of its production for the domestic market and 80percent for export by acting as a contractor for footwear firms headquarteredin the United States. The Company has been making shoes for over 40 years andis well established in both markets.
The Company is a progressive firm that understands currentmanufacturing technologies and practices, and is struggling to determine what
- 13 -
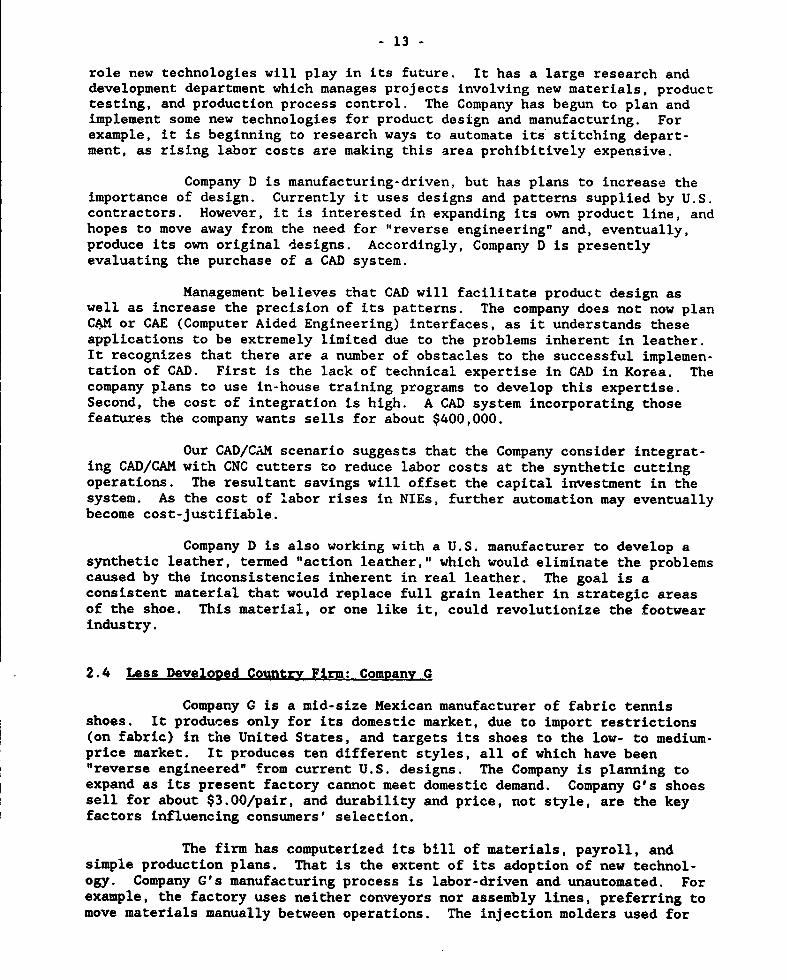
role new technologies will play in its future. It has a large research anddevelopment department which manages projects involving new materials, producttesting, and production process control. The Company has begun to plan andimplement some new technologies for product design and manufacturing. Forexample, it is beginning to research ways to automate its stitching depart-ment, as rising labor costs are making this area prohibitively expensive.
Company D is manufacturing-driven, but has plans to increase theimportance of design. Currently it uses designs and patterns supplied by U.S.contractors. However, it is interested in expanding its own product line, andhopes to move away from the need for "reverse engineering" and, eventually,produce its own original designs. Accordingly, Company D is presentlyevaluating the purchase of a CAD system.
Management believes that CAD will facilitate product design aswell as increase the precision of its patterns. The company does not now planCAM or CAE (Computer Aided Engineering) interfaces, as it understands theseapplications to be extremely limited due to the problems inherent in leather.It recognizes that there are a number of obstacles to the successful implemen-tation of CAD. First is the lack of technical expertise in CAD in Korea. Thecompany plans to use in-house training programs to develop this expertise.Second, the cost of integration is high. A CAD system incorporating thosefeatures the company wants sells for about $400,000.
Our CAD/CAM scenario suggests that the Company consider integrat-ing CAD/CAM with CNC cutters to reduce labor costs at the synthetic cuttingoperations. The resultant savings will offset the capital investment in thesystem. As the cost of 'Labor rises in NIEs, further automation may eventuallybecome cost-justifiable..
Company D is also working with a U.S. manufacturer to develop asynthetic leather, termed "action leather," which would eliminate the problemscaused by the inconsistencies inherent in real leather. The goal is aconsistent material that would replace full grain leather in strategic areasof the shoe. This material, or one like it, could revolutionize the footwearindustry.
2.4 Less Developed Country Firm: Comipan G
Company G is a mid-size Mexican manufacturer of fabric tennisshoes. It produees only for its domestic market, due to import restrictions(on fabric) in the United States, and targets its shoes to the low- to medium-price market. It produces ten different styles, all of which have been"reverse engineered" from current U.S. designs. The Company is planning toexpand as its present factory cannot meet domestic demand. Company G's shoessell for about $3.00/pair, and durability and price, not style, are the keyfactors influencing consumers' selection.
The firm has computerized its bill of materials, payroll, andsimple production plans. That is the extent of its adoption of new technol-ogy. Company G's manufacturing process is labor-driven and unautomated. Forexample, the factory uses neither conveyors nor assembly lines, preferring tomove materials manually between operations. The injection molders used for

- 14 -
its shoe fabrication, though relatively "high-tech," require an operator oneach machine.
Raw materials inventory varies between two and six weeks dependingon economic factors. When inflation is high the company will purchase as muchraw material as possible to protect itself from potential cost increases. Tomeintain optimal inventory, the company must balance inventory holding costsagainst the rate of inflation. Turnover of the final goods inventory is everytwo weeks. The main purpose of this inventory is to help the company processand group orders to facilitate distribution.
Our JIT scenario found companies in LDCs can gain a significantcompetitive advantage by minimizing their inventories, and thus their inven-tory holding costs, which are increased by high rates of interest and infla-tion. Company G has nearly achieved a JIT environment primarily because thestrong demand for its product allows it to operate at full capacity whilemaintaining low inventory levels. The company's success is a tribute to theeffects of implementing JIT, and shows how LDCs can implement procedures oftenthought to be exclusive to more advanced countries.
Company C prides itself on providing a quality product at thelowest possible price. However, its only method of quality control inmanufacturing is the final inspection of the completed shoe just prior topacking. At this stage 1.5 percent of the shoes are scrapped, at considerablecost to the company. Further efforts at quality control such as that sug-gested in our future best practice scenario, could help Company G reduce finalinspection costs and scrap rates by building quality into the product.
Based on our scenario analysis, increasing the span of controlsignificantly decreases management costs, altLlough this may not be as criticalfor Company G as for a manufacturer in a high-wage DC. Still, Company G hasimplemented some systems that increase its span of control. For example, therouting sheet that it attaches to all material that proceeds through produc-tion helps the shop floor worker understand which operation is to be performednext. This system, in effect, transfers some control to the employees,although foremen are still needed on the shop floor.
The company is trying in two ways to exploit the benefits ofeconomies of scale. First, it operates its capital-intensive machinery, theinjection molders, two shifts per day, while operating the rest of theequipment one shift per day. Thus it needs fewer injection molders. Second,the company plans to increase its production capacity soon by 30 to 40percent, to meet increased product demand; this will involve the purchase oftwo more injection molders and new sewing machines.
In summary, Company G is not advanced technologically, but it hasa firm grasp of what is necessary to manufacture fabric tennis shoes in anLDC. Our automation scenario confirms that neither advanced machinery norautomation is cost-justifiable in an LDC footwear company. Company G demonst-rates that careful inventory control, efficient use of inexpensive labor, andstrong management practices can result in a successful LDC footwear company.

- 15 -
3. FOOTWEAR MANUFACTURING: THE BENCHMARK
3.1 Backeround
To analyze the impact of innovation on the footwear industry, itis necessary to move from real-world case studies to stylized representationsof manufacturing operational parameters (benchmark models) and input costs ineach country type. It is only by doing so that we can introduce controls,eliminate extraneous variables and thus analyze the impact of change.
A benchmark factory for a particular product in a given country isintended to represent a prototypical firm manufacturing that type of productin the country. Thus, a benchmark model does not represent any particularfirm. The purpose of the benchmark models is twofold: to replicate therelative ranking of LDCs, NIEs, and DCs in terms of unit costs, and then toserve as the basis for simulating the effect on firms of the new technologies.
It is useful to clarify the relationship between a "benchmark"factory and "optimal" technique of production. Since input costs vary in thethree country types, we would expect that techniques of production mostcommonly in use reflect those differences. Our benchmarks show that thetechnique in use does, in general, vary by country type. DC techniques, inparticular, are significantly different from techniques in the other countrytypes, with the one exception of shoes, where the benchmark factory e-ven inthe DC is assumed to have the same technique as in the other two countrytypes. The difference between LDC and NIE benchmarks is smaller. In onecase, printed circuit board assembly, we have two benchmarks for the NIE, oneembodying the same technique as in the LDC and the other embodying a moreadvanced technique.
The benchmark factories in the three country types are assumedhere to produce the same product. This is necessary for making internationalcost comparisons. The list of types of footwear is almost endless: men'sleather dress shoes, women's leather pumps, women's vinyl pumps, leathermoccasins, leather athletic shoes, fabric tennis shoes, plastic sandals, andso on. Within each shoe type, there are thousands of possible combinations ofstyles, sizes, components and manufacturing processes.
We have chosen to focus on the men's leather dress shoe. Mostother types of footwear, including leather athletic shoes and fabric tennisshoes, can be produced by using a subset of the processes required forproducing a men's leather dress shoe. A detailed investigation of the men'sleather dress shoe will therefore help us examine the implications of or-ganizational and technological change in the most comprehensive manner.
Finally, we assume that firms in all countries can access materialinputs at the same price, thus focussing our spotlight on the manufacturingprocess.
l

- 16 -
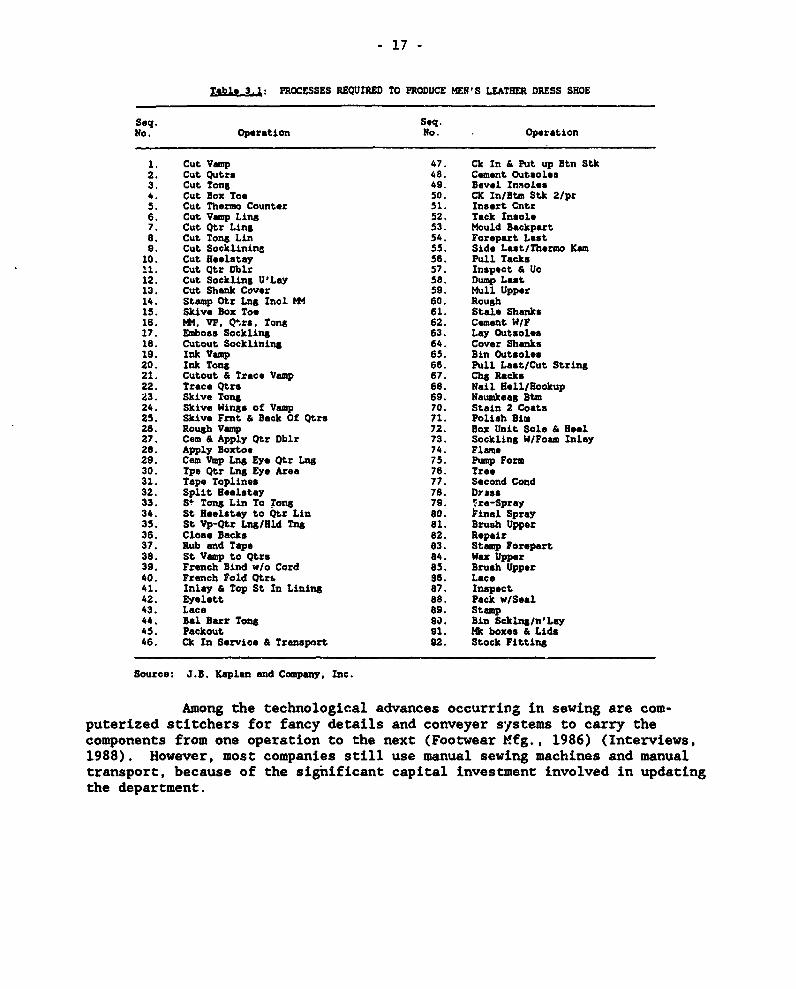
3.2 Manufacturing Processes
Table 3.1 presents an intimidating list of the processes requiredto manufacture a typical pair of men's leather dress shoes (Kaplan, 1985).These processes may be summarized for our purpose into five manufacturingdepartments. Figure 3.1 illustrates the material flow between thosedepartments.
First, the cutting department cuts the patterns for the upper ofthe shoe from leather hide or synthetic material. The cutting operation,commonly referred to as "clicking," may be done in many different ways,ranging from hand-cutting with a knife, to a semi-automatic press with dies,to a numerically-controlled laser or water-jet cutter (Footwear Mfg., 1986)(Interviews, 1988). Each process has its advantages and disadvantages, as wewill discuss later.
Due to its variations in grain, color and thickness, cutting theleather is a highly skilled operation. Recently the shoe iriustry has beenresearching ways to modernize this process (Interviews, 1988). For example,vision systems could potentially detect variations inherent in the hide. Suchinformation could then be downloaded, via an optimal cutting position al-gorithm, to a numerically-controlled press that could cut the required piecesautomatically. For now, however, the process remains highly dependent on the"feel" of a human operator.
After cutting, the patterns are bundled, placed in bins andtransported to the sewing department. In the sewing department, the edges ofthe patterns are skived (pared) and then sewn together to form the upper.Sewing of the upper is the most labor-intensive part of the entire shoemakingprocess.
- 17 -
Tabls 3.1: PROCESSES REQUIRED TO PRODUCE MEN S LEATHER DRESS SHOE
Seq. Seq.No. Operation No. Oporation
1. Cut Vamp 47. Ck In & Put up Btn Stk2. Cut Qutrs 48. Cement Outsoles3. Cut Tong 49. Bevel Insoles4. Cut Box Too 50. CK In/Btm Stk 2/pr5. Cut Thermo Counter 51. Insert Cntr6. Cut Vamp Ling 52. Tack Insole7. Cut Qtr Ling 53. Mould Backpart8. Cut Tons Lin 54. Forepart Lest9. Cut Socklining 55. Side Last/Thermo Kam10. Cut HBelstay 56. Pull Tacks'1. Cut Qtr Dblx 57. Inspect & Ue12. Cut Sockling U'Lay 58. Dump Last13. Cut Shank Cover 59. Mull Upper14. Stamp Otr Lng Incl M 60. Rough15. Skive Box Too 61. Stale Shanks16. MM. VP Q.rs, Tons 62. Cement W/F17. Emboss Sockling 63. Lay Outsoles18. Cutout Socklining 64. Cover Shanks19. Ink Vamp 65. Bin Outsoles20. Ink Tong 66. Pull Last/Cut String21. Cutout & Trace Vamp 67. Chg Racks22. Trace Qtrs 68. Nail Hell/Hookup23. Skive Tong 69. Naumkoeag Btm24. Skive Wings of Vamp 70. Stain 2 Coats25. Skive Frnt & Back Of Qtrs 71. Polish Bim26. Rough Vamp 72. Box Unit Sole & HDel27. Cam & Apply Qtr Dblr 73. Sockling W/Foam Inlay28. Apply Boxtoe 74. Flame29. Cem Vmp Lng Eye Qtr Lng 75. Pump Form30. Tpe Qtr Lng Eye Area 76. Tree31. Tape Toplines 77. Second Cond32. Split Heoletay 78. Drass33. S TonS Lin To Tong 79. Tre-Spray34. St Heelstay to Qtr Lin 80. inal Spray35. St Vp-Qtr Lng/Hld Tng 81. Brush Upper36. Close Backs 82. Repair37. Rub and Tape 83. Stamp Forepart38. St Vamp to Qtrs 64. Wax Upper39. French Bind w/o Cord 85. Brush Upper40. French Fold Qtrs. 86. Lace41. Inlay & Top St In Lining 87. Inspect42. Eyelett 88. Pack w/Seal43. Lace 89. Stamp44. Bal Barr Tong 90. Bin Scking/n'Lay45. Packout 91. Hk boxes & Lids46. Ck In Service & Transport 92. Stock Fitting
Source: J-B. Xaplan and Company Inc.
Among the technological advances occurring in sewing are com-puterized stitchers for fancy details and conveyer sJstems to carry thecomponents from one operation to the next (Footwear Mfg., 1986) (Interviews,1988). However, most companies still use manual sewing machines and manualtransport, because of the significant capital investment involved in updatingthe department.

- 18 -
Raw Materials Cutting
Inventory DL epartment
l[ Lasting Sew ing
Department D5epartment
Fi nishiing
Depart rent
PKinrg F inalI Goods
. Departzet Inventory
Figure 3.1: TYPICAL PRODUCTION FLOW
After sewing, the completed uppers are grouped with the requiredlasts and soles, so that they may move as one lot to the lasting process. Alast is a plastic, wood or polyurethane model of a foot. In the lastingdepartment, the components of the shoes are assembled on the last, andattached by means of a series of tacking, stretching and heat treatingoperations. Toge-;her these operations create the "fit" or comfort of theshoe. Therefore the shape of the last is critical to the quality of tne finalproduct. Recent advances in lasting technology have improved machineflexibility sucl that each machine can handle many designs and sizes quicklyand efficiently. After the upper has been assembled on the last, the outsoleand heel arrive from inventory and are attached to the semi-assembled shoe.
In the fourth department, the finishing room, the completed shoeis buffed and polished, and the last is removed. Inspectors check the shoefor defects in finish, and then send it to the packing department, where it isinspected for the last time before being boxed and sent to final goodsinventory.
3.3 The Benchmark Factories: Physical Indicatogrs
We have developed stylized representations of manufacturingoperational parameters (benchmark factories) and input costs in each countrytype. These parameters are inputs to ManuCost, a software package that modelsmanufacturing costs. MlanuCost estimates work-in-progress (WIP) and value ofscrap to arrive at total costs. Figure 3.2 is a schematic diagram of the costmodel.

- 19 .
Factory Model
Manufacturing Organization Manufacturing Outputs
l I I O l ManufacturingM anufacturing PerformanceData Inputs __E__ _ _ _Machine UtLlization
Production Target WIP
Lot Size Manuracturing Process Lead Times
RoutingSetup Time lCycle TimeYietds L
Bill of MaterialsLabor l
Equipment
Economic Ecoromic Model Unit Cost of ProductData Inputs
Wage Rates l
Interest Rates ManuCostLand CostsEtc.
Figure 3.2 SCHEMATIC OF THE COST MODEL
The key element of the ManuCost approach is that production is
modeled as a dynamic process that occurs over a period of time. This provides
the basis for the work-in-process (WIP) cost category, which does not exist in
aggregative models that rely only on measures such as capital-output ratio.
The physical performance characteristics of machines and labor, along with a
specification of how materials move from one stage to another, create the
basis for quantifying waste in the system. This model structure also enables
us to evaluate savings (or cost increases) that accrue when the process is
simplified or a technological change, such as a more highly automated piece of
equipment, is introduced into the process. See Appendix B for more details on
ManuCost.
We have developed three benchmark factories, one for each country
type. Table 3.2 specifies annual production and the input requirements for
meeting that production level. All factories are assumed to produce the same
number of shoes: 1.1 million a year in lot sizes of 36 shoes. The table also
specifies operational parameters, such as cycle time (the time taken for a
shoe to be assembled), machine reliability, and process yields (proportion of
shoes not requiring rework). Diffe-ences in these operational characteristics
determine the differences in the level ef efficiency.
For the benchmark models, we have assumed that firms in all three
country types are using essentially the same production technique. This is
supported by our observation that there is a broad similarity in equipment use
and process layout in firms across countries. The more innovative firms have

- 20 -
introduced new technologies in the past several years, but they are few innumber. For the purpose of the benchmark, therefore, none of the newertechnologies is part of these representations.
The basic difference between the countries then stems from theefficiency with which resources in the different country types is used. Inthe language of economists, the traditional technology for shoemaking offerslimited scope for substitution between inputs. Hence we would expect to seeessentially the same process (or technique) in different countries. However,firms do systematically vary in the efficiency with which they use theirresources,
Several features of Table 3.2 are especially noteworthy. The LDCfactory is significantly less efficient than its NIE counterpart in the use ofcapital and labor. To produce the same level of output, the LDC firm uses notonly more labor but also more equipment than does an NIE firm. NIE firms useless equipment because their machines are more reliable, work faster (shortercycle times), and are repaired faster.
There are other sources of inefficiency in the LDC plant. Slackwork methods and inadequate attention to testing lead to greater wastage ofmaterial. Higher scrap, longer cycle times, lower machine reliability andlarger buffers, lead to greater work-in-progress and hence further increasethe use of capital, an LDC's most expensive resource. Higher raw material andfinished goods inventory in LDCs similarly increase capital use.
Finally, LDCs, like DCs, have a smaller span of control (thenumber of employees that report to the next higher level of management). Alarger span of control leads to a "leaner" organization. It is characteristicthat in an LDC or a DC, seven persons report to an immediate superior.However, in an NIE, a supervisor has 10 persons working under him.

- 21 -
Table 32: 2 AWUFACTURINO PARAMETERS FOR BENCHMARK IMDELS
Parameter LDC HIE DC
Operating scheduleDays per year 240 288 240Hours per day 9 8 7.5
Staffing--Total 404 312 458Span of control j/ 7 10 7No. direct labor _/- Skilled 167 129 192- Semiskilled 59 47 66- Unskilled 94 77 108No. Indirect labor S/ 84 59 92
Absentee rate 32 0.52 22
No. of machines d/ 220 172 253Equipment value b/
Total value (3000) 1.285.8 1,072.4 1,412.4Annualized (3000) 631.9 528.3 628.9
Reliability e/ 90/8 160/4 150/8
Sample cycle times £/Upper stitching 6.8 6.1 6.8Skiving 0.9 0.8 0.9
Material inputs c/Leather hide 260.00 260.00 260.00Synthetic sheet 13.50 13.50 13.50Board 105.00 105.00 105.00Accessories 4.75 4.75 4.75
Sample yields ^/at leather cutting 702 802 702at final inspection 922 962 942
Lot size 36 36 36Inventory (months) h/
Raw materials 2.0 1.0 1.0Finished goods 4.0 1.5 3.0
Facility area (sq.ft.) 75,000 60.000 75,000Land & Buildings
Total Value (S000) 675.0 720.0 900.0Annualized (S000) 126.0 120.0 132.0
Admin. Costs (S000/Year) 486.4 497.6 606.4
Annual Production (O000a) 1,100 1.100 1.100
In-house buffers (days)Intermediate assemblies 6.0 3.0 3.0
&I The number of employees (labor or staff) that report to the next higher level of management.
_I These numbers are derived from the modeling process. They depend on the manufacturingparameters and the desired production rate.
L/ This includes the numbers of lupervisors derived from the Span of Control paramter.
/ This number is derived from the modeling process. It depends on the manufacturing parmetersand the desired production rate. It ia a totaL across all types of machines. A detailedbreakdown by type of machine is in the Appendix.
*/ The first number is the average number of hours betwoea' failures of a machine, and the secondis the average time to repair the machine, also in hours.
j/ These are in minutes. for selected operations. Details for all operations are in the Appendix.
/ These are selected examples of yields. Details for all yields are in the Appendix.
_/ These are for inventory before and after the shop floor operations. Inventory on the ahopfloor (i.e., shop floor WIP) is calculated by the model.

- 22 -
3.4 Input Costs
The cost of labor, capital, and land and facilities is specifiedin Table 3.3. These numbers, like the operational parameters discussed below,are based on the interviews but are necessarily stylized, given the variationwithin country types. The stylizations accord with generally perceivedopportunity costs of these inputs. Interest rates are highest in the LDC andlowest in the DC; the ordering of labor cost is reversed. The "long-term"interest rate is used to value fixed capital and the "short-term" interestrate is used to value inventory and work-in-progress (WIP). The virtue of ourmodeling procedure is that sensitivity of total costs estimates to variationsin input prices can be easily assessed.
Table 3.3: ECONOMIC PARAMETERS FOR BENCHMARK MODELS
Parameter LDC NIE DC
Production Labor (wage in $/hour)Skillud 1.75 2.75 8.50Semiskilled 1.25 2.00 7.00Unskilled 1.00 1.25 5.00
Benefits Rate 151 222 291
Indirect labor &/Salaries ($000/year) 7-50 10-60 20-75Benefits Rate 152 18X 202
Long-term interest rate 2 12 10 8
Short-term interest rate 2 25 20 15
Facility cost (S/sq. ft.) 9 12 12
I/ The figures shown are the ranges of salary for different categories ofemployees. Actual salaries and the number of employees in each category areshown in the Appendix. Also see the entry and related footnote for number ofindirect labor in Table 3.4
Costs of equipment and land and buildings are the sum of deprecia-tion (using the "straight-line" depreciation method) and interest costs withrespect to the current valuation of the asset. Thus if equipment has a valueof $V, a depreciation life of Y years, and the "long-term" interest rate isi%, the annualized cost will be V(1/Y + i/100). Different types of equipmentare assumed to have different depreciation rates and these are not reportedhere.
Unlike other inputs, which have been specified in physical terms,material inputs have been specified in US$/shoe. This has been done mainly toavoid clutter, since the list of actual inputs is long. The benchmark assumesthat prices of inputs are the same in all country types, and so the equalityin the dollar value of irputs across country types also implies that thequantity of inputs is the same. This is not necessarily a realistic assump-tion. It is likely, for example, that certain inputs (such as leather hidesand accessories) are more expensive in an LDC than in a DC from which they aretransported. However, since our main focus is on the manufacturing process,we have chosen to control the material prices at the same level in allcountries.
- 23 -
It should be noted though that certain indirect costs of import-ation (and delays involved in that process) are included in the higher levelso_ inventory in LDCs. Moreover, the input costs specified here should beinterpreted as the minimum required for every finished shoe. In addition, asdiscussed below, much material is wasted during the production process. Thelower the production "yields", the greater the wastage. We indicate a widerange of yields, the lowest prevailing in the LDC Manual factory. As aconsequence, greater scrap raises the effective material input per unit ofoutput.
3.5 Benchmark Costs
The manufacturing parameters (Table 3.2) and the economic paramet-ers (Table 3.3) are the inputs to ManuCost, which estimates the work-in-progress and the value of the scrap, based on the operational characteristicsspecified, to arrive at final costs of production. ManuCost also tracks thetime during which labor and capital equipment are actually being used. Onthat basis, it is possible to break down the use of labor and equipment intowhat we term "productive" and "unproductive" use.- When machine or workersare not being used, we term them "unproductive." ManuCost is capable ofproviding costs accumulated at different stages of production. We presentonly the costs of producing the entire product. In the following chapters,the benefits of working with a finely specified production process will becomeevident.
The NIE factory is the most cost competitive (Table 3.4). Higherunit costs in the DC are explained directly or indirectly by higher laborcosts. Even the higher value of scrap in the DC is a reflection of the valueadded (and hence essentially labor costs) in the material wasted and dis-carded.P The DC firm is also somewhat less efficient than the NIE firm interms of manufacturing parameters such as cycle times, yields and inventories.
That LDC costs are higher, compared with NIE costs, is moredirectly attributable to inefficiency. The basis for this inefficiency wasdescribed above when discussing the manufacturing parameters. Two significant
J,/ "Non-productive direct costs" are computed for both equipment and labor.Examples of non-productive times are equipment waiting for labor, equipmentthat has failed, and unused capacity of equipment or labor. Higher non-productive costs reflect an imbalance in the production line or productioninefficiencies due to machine down time.
,~/ During the entire accumulation process, whenever scrap is generated inmanufacturing, the full value of the scrapped items is noted. The valua-tion of scrap includes the cost of raw materials as well as any direct andindirect costs accumulated in that item. For example, labor and capitalcosts incurred on the production of the item scrapped are included inscrap value. Moreover, if, at an 'intermediate step, additional rawmaterial is required due to high scrap in the process, this additionalcost will not show up in the "material" category but, rather, in the"valued scrap" category.

- 24 -
cost disadvantages that result from these inefficiencies are in scrap costsand WIP costs. These more than wipe out any advantage in labor cost. Ascan also be seen, in the traditional form of this industry, the costs ofequipment, facilities and administration are virtually negligible in all threecountry types.
Table 3.4: COSTS PREDICTED BY BENCBMARK MDDELS
Cost Per Shoe (in US$) Percentage of Cost
Cost Category LDC NIE DC LDC NIE DC
Materiel 12.32 12.32 12.32 56.1 64.8 45.7
Direct Labor 0.62 0.90 3.52 2.6 4.7 13.1Direct Equipm nt 0.41 0.37 0.43 1.9 2.0 1.6
Non-productive Direct Labor 0.27 0.39 1.43 1.2 2.0 5.;Non-productive Diroct Equipment 0.14 0.09 0.27 0.6 0.5 1.0
Indirect Labor 0.96 1.16 2.42 4.4 6.1 9.0Land and Buildings 0.10 0.10 0.11 0.5 0.5 0.4Administrative 0.40 0.43 0.51 1.8 2.2 1.9
Inventory and WIP 2.18 0.65 1.14 9.9 3.4 4.2
Valued Scrap 4.57 2.59 4.78 20.8 13.6 17.7
TOTAL 21.99 19.00 26.94 1001 1001 1OOS
A final feature of these cost estimates that should be noted isthe high proportion of material costs. As we shall see in the followingchapters, despite the importance of labor costs in DCs, technical change andespecially new organizational practices, have been directed significantlytowards lowering material costs. Hence, many of the new organizationalpractices have direct relevance for developing countries.
The low share of labor cost in the total cost of producing shoeimplies that rising wages in an NIE are not likely to be sufficient to makethe LDC or DC competitive with an NIE. For example, it would take a doublingin NIE wages to raise costs to the LDC level. Similarly, if NIE wagesremained unchanged, DC wages would have to be reduced by half to reach NIEcost levels.
i/ The quantity of VIP predicted in the manufacturing model, and the short-term interest costs, leads to the WIP carrying costs. The calculation ismore complex than a simple multiplication for two reasons: i) The WIPcarrying cost at the first operation increases the valuation of the WIPfor the second operation, and so on, and thus the WIP carrying cost needsto be computed progressively; and ii) The presence of rework leads to"feedback" where the outputs of a downstream operation affect the inputsof an upstream operation. This requires a system of equations to be solvedto get the WIP valuation.

- 25 -
3.6 Scale Economies
Our estimates show that for the benchmark technologies, the costcurve essentially flattens out at about 1.1 million shoes a year, implyingthat no real cost advantage can be obtained by producing more shoes in asingle factory. In practice, much larger factories are observed. Forexample, HS Corporation of Korea produces 30 million shoes a year. Theeconomies derived from such a large scale relate more to marketing andsourcing of inputs than to manufacturing. NIE firms, such as HS Corporation,also view their growth as a mechanism for widely advertising their productquality attainments in order to eventually launch their own brand-nameproducts (See Box 3.1).
3.7 Discussion of the Benchmark
With their relatively high wages, how can companies in developedcountries such as the U.S. and Japan compete in the labor-intensive footwearindustry? Some companies cannot. Numerous DC firms have closed down in thepast few years. Most of these have been small firms. For example, Nunn Bush,a Wisconsin manufacturer of leather dress shoes, recently announced thatcompetition from overseas manufacturers was forcing it to close its doors.But other companies have overcome the wage differential by emphasizing eithertheir efficiency as manufacturers or their effectiveness as marketers, orboth.
To manufacture efficiently, companies must use both technology andpeople well. Currently, high technology in footwear is most apparent indesign. But to remain competitive, manufacturers in DCs have begun tomodernize the actual production process as well.
DC manufacturers have also used product differentiation andmarketing strategies to offset the disadvantage of higher wage costs. Forexample, marketing programs in the United States have emphasized such phrasesas 'made in the USA" and "hand-crafted quality." Such programs, when used inconjunction with established brand names, have proven effective (Interviews,1988).
U.S. footwear manufacturers are also taking advantage of theproximity of low-wage countries like Mexico and the Dominican Republic. Inthe case of leather dress shoes, the uppers are designed and the patterns cutat a U.S. company, sent to a low-wage subcontractor for stitching, andreturned to the U.S. company as a subassembly for final production. In eachcase the most labor-intensive process in shoemaking bypasses high-wage labor.
For NIEs, manufacturing efficiency is absolutely crucial; design,although increasingly important, remains a secondary concern. NIEs havetraditionally been followers reacting to new product developments in ochercountries. Typically, the U.S. or Japan supplies the design, contracts outproduction to the NIE shoe company, and markets and distributes the finishedproduct under their brand name at home.

- 26 -
BOX 3.1: BUILDING A BRAND NAME IN KOREA
In Korea, Reebok is the HS Corporation. The company, whichemploys 19,000 people in Pusan, manufactures 30 million pairs of shoesannually, most of them athletic shoes. Ninety percent are Reeboks,produced under a three-year contract; the remaining 10 percent go toNike, previously HS's biggest customer. HS alone accounts for 23percent of Korean shoe exports by unit volume, and 20 percent by dollarsales; nearly all its production goes abroad, with 55 percent to theU.S., 20 percent to Japan and 15 percent to Britain.
As a mass producer, HS is in a good position to exploiteconomies oZ scale - and is planning to do so, with its own line ofLeCaf-brand shoes. But first HS will have to develop certain capabili-ties that, as contractor to Nike and Reebok, it has not needed untilnow. Because HS gets its drawings and patterns from abroad, forexample, it has never adopted a CAD/CAM system; now it is putting onein place. The company plans to use it to make LeCaf's upper patterns.
By launching its own line, HS is not only seeking to exploiteconomies of scale; it is also trying to protect itself from competitionfrom lower-wage countries. HS notes that Nike came into Korea whenlabor costs there were low. Now that Korea's wage rates are risingrapidly, to about $15 per day for a worker with average skills,companies such as HS may find it harder to compete with manufacturersin LDCs. In fact, HS itself is considering building a plant inThailand, where wages are about one-third to one-half those of Korea andraw materials are also cheaper.
We can expect, therefore, that companies like HS will specializein international sourcing of materials and other inputs and also indistributing brand name products. They will also provide productionexpertise to their subsidiaries and affiliates. It is likely, moreover,that they will continue to produce shoes in their home base, though thetype of shoe being manufactured there will be higher quality than intheir LDC factories.
This practice has enabled NIE shoemakers to become "experts" infootwear manufacturing. This is especially true in the athletic shoe sector.One Korean manufacturer, though currently working as a contractor for U.S.firms, maintains that its "ultimate goal is to elevate the product quality andreputation of the company to the level of world's best footwear company bybeing the leader in innovative design and function of its product" (Inte-rviews, 1988). The auto and electronics industries have similar aspirations.
The production process in an LDC is similar to that of NIE and DCshoe companies, but the skills of management and workers are at a much lowerlevel. Low cost is not generally adequate compensation for low quality of the

- 27 -
labor force. Indeed, Low cost labor can be a hindrance if adaptation tochange is inhibited.
Although advanced management practices and technologies can, intheory, be accessed by LDC shoe companies, they are often ignored becausemanagement lacks the technical expertise to implement them or is too busytrying to keep the company afloat. Often the companies' choice of technologyis limited by government mandates that they buy their equipment from domesticsuppliers, who may be unreliable or even unaware of the latest technologies.While these manufacturers have standard shoemaking machinery, seldom is thiscoupled with the efficient use of low-cost automation (mechanical aids andpneumatic controls) so prevalent in NIEs.
Technical expertise is scarce, and those who have it are often thecompanies' managers or owners. They cannot singlehandedly run a complexmanufacturing system. Nonetheless, it is important that these companiesdevelop the knowledge needed to understand and implement new technologies.For example, efficient low-level technology has allowed the BATA factory inJakarta, Indonesia, to dominate its domestic market and contemplate sellingovers3eas. (See Box 3.2.)
The success of some LDC footwear manufacturers shows they have thepotential to produce quality shoes at competitive prices. The Emyco shoefactory in Leon, Mexico, recently announced exports of one million pairs ofleLther dress shoes to the North American market under the company's own label(Moffett, 1989). Brent Gardner, vice president of a retail shoe chain,states, "I'd say that Emyco consistently produces the finest quality productof any shoemaker in its price range. It was a big surprise.' How to reachthat position is a central theme of this report.

- 28 -
BOX 3.2: A PARAGON OF EFFICIENCY IN INDONESIA
Most Indonesians think that BATA is an ionesian company and, infact, the Jakarta factory - which opened in 1931 - was the first in the BATAgroup to develop and install a machine that vulcanizes its rubber footwearright on the conveyor line. BATA, a Canadian transnational corporationoperating in over 80 countries, is the world's largest manufacturer offootwear. But as the vulcanization example suggests, it has been exception-ally successful in producing shoes in less developed countries such asIndonesia, where both indigenous and foreign manufacturers have run intoproblems.
The Jakarta factory is a model of an efficient factory in an LDC.For its rubber footwear, BATA has a mixing room, in which it produces itsown rubber compounds. It uses 24 tables for the curing process and at leastten presses to stamp out the unit soles. The components, packed in boxes,are then sent to various stations for sewing. After the upper has beenstitched and glued to the sole, the shoe is ready to be vulcanized. It isplaced in a vulcanizing boiler for one hour, after which it is cooled andmoved on to the finishing process. The shoes are automatically "set" asthey pass through this operation.
For its leather footwear, BATA has also modernized operations inthe last few years, improving electrical wiring, importing dies and lasts,and using some simple, low-cost automation techniques to feed machines.
Most of the shoes made at the Jakarta plant are functional,sandals and slippers, and nearly all the production is sold domestically--largely through outlets under the BATA name. Bvi the BATA group has globalambitions for its Indonesian operation. The plant produces higher value-added shoes than most Indonesian footwear manufacturers, and is targetingits men's leather shoes for export.

- 29 -
4. LEARNING TO PRODUCE
4.1 Obiective
The state of manufacturing practice in a firm or a country is theresult of organizational and shop-floor learning that has been undertaken inthe past. The learning experiences of others may sometimes be embodied inadvanced machines, reducing the further need for "soft" investments in workertraining, improved work practices, and organizational changes. However, acentral proposition of this study is that these so-called soft investments,for which we use the short-hand term "learning", are critical to internationalcompetitiveness.
We view learning as a process of experimentation aimed at increas-ing productivity. As such, it is something of an art form. However, moderntools and practices embodied in, for example, Total Quality Control (TQC) andJust-in-Time (JIT) provide structure and content to the learning process byspecifying the elements of training, organizational change and infrastructureneeded to continuously improve the production process.
In this chapter, we evaluate the quantitative impact of improvedproduction practices that overcome inefficiencies in the production system.The procedure we follow is to generate a set of "scenarios." These are "what-if" exercises and, as such, are purely accounting devices that say nothingabout how the transition is made from one state to another. Hence, afterdemonstrating the quantitative importance of changes in factory operatingprocedures and practices, we discuss issues relating to their implementation.
The first set of scenarios brings the LDC and DC factories on parwith the NIE factories in terms of manufacturing parameters. The manufactur-ing parameters of the NIE factory can be considere. the "current best prac-tice," so this set of scenarios brings everyone to the current best practice.The cost difference that remains at the end of this sequence is due toeconomic parameters, not manufacturing parameters.
However, the current best practice in the NIEs is a moving target.Observed trends in the literature and our field interviews suggest clearlythat further improvements in production management will occur in the next fiveyears. These are modeled as future best practice.
When we "move" a factory from its benchmark level of efficiency tocurrent best practice and then to future best practice, we are assuming thatthe relevant learning process is in place. Learning, however, is not atrivial task, and it is costly for both the firm (e.g. investment in training)and the economy (e.g. provision of relevant infrastructure). These costs arenot easy to quantify, and so are discussed qualitatively. It could beconcluded that these costs are so high that LDC firms should not be producingeven a product as technically mature as the one considered in this study. Or,on a more positive note, we could conclude that significant efforts togenerate such learning are needed urgently if LDC firms are to be competitivein international markets.

- 30 -
4.2 Current Best Practice
The following changes were implemented (sequentially):
Improved process efficiency: Scrap rates, machine reliability and in-housebuffers all brought to the NIE levels. We start with these changes becausethese are internal to the firm and presumably under greatest control by thefirm.
Reduced inventories: Raw materials and finished goods inventories brought tothe NIE levels. These changes typically require cooperation from suppliersand buyers and from the transportation and communication system. However,high inventories cannot entirely be charged to shortcomings of others. Betterproduction managemenc, greater specialization in procurement and compositionof production can all help in inventory reduction.
Reduction in cycle tires: Process cycle times brought to the NIE levels.Once production is streamlined and inventories reduced, the cycle of produc-tion becomes shorter and that brings additional benefits.
ImDroved management and overall oReration: Span of control, absenteeism,facility area, and days worked per year, all brought to the NIE levels. Forthe DC, days worked per year was left at 240 (working on Saturdays was felt tobe a unrealistic addition for a DC factory).
The effects of all these scenarios on the cost of a shoe aresummarized in Table 4.1.
Table 4.1: IMPROVED PRODUCTION AND FMANGEMENT PRACTICES
Cost Per Shoe (in USS)_____________________________________
Scenario LDC NIE DC
Benchmark (as before) 21.99 19.00 26.94
Steps to current Best Practice:
Internal processimprovements 19.71 24.84
Reduced inventories 18.55 24.39
Reduced cycle times 18.39 23.72
Improvedmanasement 18.04 23.22
Recalling that the practices are initroduced cumulatively, an LDCshoe producer saves $4 per shoe (an 18 percent decline in cost) by improvingproduction and management practices. More than $2 of the savings comes frominter-.al process improvements such as reduced scrap rates, higher machinerel ability and lower in-house buffers. Once all the production and manage-ment laefficiencies have been removed, an LDC, not surprisingly, becomes themost efficient producer.

- 31 -
A DC firm also gains significantly from the same improvements. Iffirms in all country types operated at the same level of efficiency, theinternational cost differences would be much less than they are in practice.A possible interpretation of this observation is. that, even in a matureproduct such as a shoe, production learning is not trivial. Countries thathave invested in the learning process (the NIEs) have developed a costadvantage that they are able to sustain by continuously redefining thefrontiers of the possible, even within the context of "mature" technology.
4.3 Future Best Practice
We expect such redefinition of the frontier to continue. Lookingfive years into the future, we develop a second set of scenarios. Thesescenarios take the manufacturing parameters of all the factories from thecurrent best practice defined above, to a possible "future best practice."The following changes are implemented simultaneously:
* A further reduction in scrap rates (yield at cutting raised to 85percent; at final inspection, to 98 percent), improvement inmachine reliabilities (new parameters: 320/2), and reduction ofin-house buffers to 1 day.
* Raw material and finished goods inventories brought down to 0.5and 0.75 months respectively.
* Process cycle times reduced by another 10 percent.
- Span of control raised to 20 and facility area reduced by afurther 15 percent.
When these changes are implemented, an NIE would lower costs by anadditional $1.70 per shoe (a 9 percent decline), to $17.30. See Table 4.2.An LDC that remains at the benchmark costs will produce a leather dress shoecosting $4.70 more than the ever-leaner NIE firm. A cost difference of thatmagnituda would mean that the LDC would find it almost impossible to enterinternational markets. When we allow also for the near certainty that the NIEwould be delivering a more consistent product on time, the competitiveposition of a lagging LDC becomes completely unsustainable.
Table 4.2
Cost per Shoe (in USS)----------------------------------------
Scenario LDC NIE DC
Benchmark 21.99 19.00 26.94Current Best Practice 18.04 19.00 23.22Future Beat Practice 16.47 17.30 20.65
An interesting consequence of the move to future best practice isthe further narrowing of international cost differences. The streamliningallows the DC not only to reduce its inventories and scrap but also its labor

- 32 -
cost. While DC firms will still not be able to meet low-wage competitionhead-on, they will be more successful in differentiated product markets.
4.4 The Learning Process
Japanese and other East Asian firms have made an art form ofcontinuous incremental change that, over time, leads to major gains in produc-tivity. The art is being gradually codified into techniques covered under therubric of just-in-time (JIT), of which total quality control (TQC) is asubset.
These modern techniques of organizational change offer significantpossibilities for manufacturers in LIGs. Our cost analysis has shown thatadoption of these techniques restores the cost advantage of LDCs over NIEs.Scrap ana inventory reduction under JIT are especially beneficial to LDCs.Reduction in waste confers an obvious benefit and high Interest rates make itpunitive to maintain large inventories.
The deceptive charm of JIT also is that there appear to be nocosts associated with implementation. However, implementation of any changeis an expensive activity and JIT is no exception. More importantly, JITimplementation is expensive in a resource that LDCs are not well-endowed with:human capital. Implementation requires tuning the technology to the organiza-tion and tuning the organization to the technology (Leonard-Barton 1988 andSchroeder, Gopinath and Congden 1989). The skills required for such tuninginclude both formal training (to understarnd the principles underlying thetechnology and the theory of organizations) and experience in implementingchange.
In addition, there are costs due to lost production during theperiod of implementation and more conventional costs of buying new equipmentand hiring consultants.
It is also good to keep in mind that implementation of newtechnologies and practices in LDCs occurs in a context that is not conduciveto change. The ability to source inputs in a timely manner from specializedproducers is critical to the full implementation of JIT. This requires goodphysical communication, but it also requires the growth of specializedsuppliers working in a cooperative mode with their buyers. Infrastructuraldeficiencies, regulatory barriers, and constraints on input supplies are someof the handicaps from which firms in developing countries suffer. Firefight-ing on these fronts is very expensive in terms of scarce managerial andentrepreneurial resources.
We discuss below these specific costs of JIT implementation insome detail.
Trainine and Organizational Change
While popularly viewed as an inventory reduction practice, JIT isan organized process of incremental change aimed at creating a closelyintegrated flow of work. JIT requires microscopic attention to detail and isaimed at streamlining procedures, reducting set-up times and scrap rates,

- 33 -
improving machine reliability, reducing variability of production flow, andsuch like. Such internal efficiency measures make lower inventories possible;in turn, lower inventories unmask further inefficiencies and force changes.Greater decentralization of decision making (reduced span of control) reinfor-ces these efforts by generating more information from the shop-floor, feedingthe process of continuous minor modifications.
The process of implementing JIT is experimental in nature;however, well-defined techniques exist for such experimentation. The JITtoolbox consists of: industrial engineering techniques to redice machine set-up times and facilitate easy changeovers in the use of machines; methods forstreamlining plant layouts; techniques for quality control and maintenance;and organizational and engineering techniques for simpler product design(Zipkin 1991). Thus the most important investment required for implementingJIT is human capital. Only a workforce that is well-educated and trained canuse these tools effectively.
Training takes many different forms. Workers may be sent toexternal institutions, such as local community colleges and vocationals-hools. Within the firm, formal courses may be organized or training may beimparted in many informal ways.
Japanese scholars have emphasized that the so-called informaltraining is probably the most important and most eifective form of trainingfor improved shop-floor productivity (Koike 1988). The important observatic.ais that improvements are brought about by line workers who do not necessarilypossess industrial engineering diplomas and degrees. Hobever, effectivesupervisory support is crucial.
Informality in this context does not imply a lack of training planor direction. Paradoxical as it may sound, informal training requires astrong institutional commitment and well-defined process. Limited reliance onthe classroom is the main reason for using the term "informal". Mentoring bysupervisors, collaborative problem solving with peers (quality-circles), jobrotation through the plant and the firm are the more important elements ofinformal training.
The message on training is clearly out. U.S. firms attempting theadoption of JIT techniques are making serious efforts to institutionalizeformal and irformal training processes within firms.
A closely related concern that interacts with training is the needfor organizational change. Delayering the traditional organizational pyramidby expanding the span of control yields significant cost savings in companieslocated in all country types, but especially in those countries (DCs and NIEs)where the cost of management is high. Take the example, of a factory employ-ing 385 line workers. Using a span of control of ten; the plant require 35first level, four second level, and zero third level managers. Table 4.3shows that a relatively small change in the span of control produces adramatic change in the number of managers required.
The greater gains from reduced span of control arise in the formof better information generation and decision-making. Workers close to the

- 34 -
shop-floor have superior information on the work process and are potentiallybetter positioned to rapidly analyze the information and take correctivemeasures before problems cumulate (see especially Aoki 1990 on such benefitsin the Japanese context). These gains, however; are hard to quantify.
Table 4.3: SPAN OF CONTROL EFFECTS
Span of ControlManagerial ---------------------------------------------------------
Level 3 5 10 15 20
Third-Level 13 3 0 0 0Secoxid-Level 39 14 4 2 1First-Level 116 70 35 24 18
The pressure to increase span of control grows when greateremphasis is required on reducing lead times, improving quality, and increasingproduct variety. No longer is time available for problem-solving decisions tofilter through several layers of management and companies must flatten theirtraditional hierarchy. They must train production workers in problem-solvingtechniques and, at the same time, empower them to implement solutions.Autonomy and decision-making autbJrity must be transferred from management tothe shop floor (Deming, 1986).
However, the ability to delegate depends heavily on the quality ofboth management and labor. Management needs to be trained in the tools of JITand thereby simplify the tasks to be performed. On the other hand, workersneed skills to take on the responsibility of interpreting the operation of thefactory and discovering creative solutions to problems.
Given the limitations of both managers and workers, increasing thespan of control may not be cost effective. Savings are possible only whengreater responsibility can be safely delegated to the production line em-ployee. This creates particularly severe pressures on LDC firms to invest intraining. However, the ability to train is constrained by low basic educa-tional attainments of the employees. Limited knowledge exists on the form andmagnitude of training incentives to which LDC firms respond, and this isclearly an important area for further investigation. (See Box 4.1)
Productivity "Dip" and Other Investments
In addition to the costs of training often overlooked is the costof disruption in the manufacturing process that JIT causes by reducinginventories. Drastic inventory reduction, resulting in a shortfall of rawmaterials, will create idle stations and disrupt production - potentially tosuch a point that the problems incurred will cost the company more than thebenefits to be derived from JIT. Known as the "productivity dip," thisdisruption is common and should be addressed prior to JIT implementation (Suriand DeTreville, 1986).
The financial costs of such disruption may be minimized byproceeding sequentially. Experience has shown that JIT should be implementedin stages, in carefully selected areas, rather than being adopted immediately,

- 35 -
company-wide (Barrett, 1988). A step in the successful implementation of JITis a carefully chosen pilot project. A pilot project helps gain the con-fidence of both managers and workers, and provides training to engineers andemployees (Love, 1988). Starting with internal efficiency measures, overwhich the firm has more control, is a logical approach to implementing JIT.
Box 4.1: HIGH COST OF CHEAP LABOR
Wage rates are low, but labor is not inexpensive at the F.S.Santosa footwear company in Jakarta, Indonesia. The company, whichemploys between 500 and 600 people, faults their poor education andhigh turnover for the inconsistent quality of the 100,000 shoes thefactory produces each month.
Santosa argues that it is hard to train workers because of theirlimited education; the average employee has completed only primaryschool.
The weakest link in the labor chain, according to Santosa'sowner, is the lack of middle-level workers who would convey orders fromtop management to the line workers. Santosa believes that the best wayto find workers in this category is to develop them in-house.
Shop floor workers need continual attention, in Santosa's view.Their limits have severely circumscribed Santosa's ability to adopt moreadvanced technologies. The most high-tech machine at Santosa now is theinjection molder, and even that is not currently in *use; skilledoperators are a rarity.
For all Santosa's complaints, the low wage rate makes footwearproduction highly viable. Santosa is able to export 85 percent of itsproduction to Europe, Japan and the U.S. Unless product qualityproblems are addressed, however, competition from China, Thailand, andother Indonesian firms could limit future growth.
!
Consultancy costs of developing and implementing JIT can besignificant. In addition, LDCs tend to have underdeveloped consultancyservices, particularly those directed towards small and medium-sized firms.Programs that tap and train private individuals (retired executives, univer-sity professors and graduate students, vocational school trainers, and capitalgoods suppliers) to work with small and medium-sized firms could have big pay-offs.
A network of government and industry run technology diffusioncenters may act as a substitute (OTA 1990 and Cole 1989). National Bureaus ofStandards and public and private productivity organizations, often organizedby industry groups, play a very important role in technology diffusion. InJapan, for example, external consultants are used to a much smaller extent

- 36 -
than in the United States. Diffusion centers are both a source of expertiseand also a forum for exchange of lessons learnt.
Though JIT techniques are directed primarily at changing theorganization, new machinery is often required (Zipkin 1991). Improving thequality of machinery is sometimes a prerequisite to achieving lower set-uptimes and greater machine reliability. Often production capacity also needsto be increased as inventories are being lowered in order to accommodatesudden surges in demand.
Infrastructure
Besides the obvious need for transport and communications in-frastructure, unreliable suppliers also impede the movement toward JIT inLDCs. Manufacturers we interviewed most often cited the lack of reliablesuppliers as an impediment to JIT in an LDC company. This perception needs tobe interpreted cautiously. We have discussed above the importance of manyinternal improvements which lead to substantial productivity gains.
Manufacturers that have recently implemented JIT programs havereduced the total number of their suppliers, established long-term relation-ships with the remaining suppliers, and created certification programs for keysuppliers.
Such programs are not without precedent even in LDCs. Recently;Caterpillar Inc., in conjunction with P.T. Natra Raya of Indonesia, has begunto qualify suppliers for its Indonesian factories. There are few suchqualified suppliers in Indonesia now, but Caterpillar has offered training andtechnology to those suppliers willing to work toward qualification.Caterpillar thus hopes to manufacture in Indonesia internationally competitiveproducts and components (Cat World, 1989).
Programs that supplement the initiatives of major internationalcompanies such as Caterpillar are needed to diffuse widely internationalstandards in quality control practice and provide certification services.Such programs are, in principle, no different from the general technologydiffusion programs described above.
4.5 Summarl
JIT may be considered the institutionalization of a learningprocess within the firm. Economists are used to thinking of "learning" in asomewhat mechanistic manner. Learning is often viewed as a costless by-product of production or investment. If that were the case, Eastern Europeanfirms would be amongst the lowest cost producers in the world. The reality isthat learniLg is an expensive process requiring considerable experimentationwith the production process and, more fundamentally, with the organizationalstructure of the firm.
JIT implies one or both of the following propositions: 1) humancapital requirements, in particular, but also the need for physical capitalare so strong, even for so-called "low end" products, that most developingcountries do not have a real comparative advantage in simple manufactured
- 37 -
goods; 2) to overcome this disadvantage, access to international sources ofknowledge and increased domestic investment in knowledge creation, with aclear focus on improving basic manufacturing productivity, must be a majorpriority for LDCs.
The implication is that greater experience with modern industrialpractices is needed in a setting where such experience can be absorbed. Closelinks with foreign firms that possess the knowledge needed for efficientabsorption is likely to be a must.
In the early 1980s, JIT was labeled a strategy possible only inthe restrictive operating conditions prevalent in Japan. Yet today, U.S.manufacturers provide the success stories so abundant in the literature. Theyare learning to better manage suppliers, train employees and update theirmanufacturing techniques. Not long ago the U.S. manufacturing environment wasclassified as not conducive to the use of J'T. Today the same is being saidof the LDCs.

- 38 -
5. AUTOMATION AND NEW MATERIALS
5.1 Obiective
In the previous chapter, we discussed so-called "soft" changes tothe production system. In our discussion we indicated that "soft" should notbe read as "easy." In this chapter we analyze the effect of changes inmachines and materials.
Many of the technologies discussed in this chapter have emergedonly in the last five years and their adoption has so far been spotty. Thereis a general belief in their potential but a limited understanding of how soonthat potential will be realized.
In the last section of this chapter, we venture into furtheruncharted territories with our "blue-sky" scenarios. These represent ourreading of technologies currently under development and likely to enter theproduction process in the next five years.
5.2 Cutting Automation: CAD/CAN
Computer-Aided Design (CAD) is "the use of computer systems toassist in the creation, modification, analysis, or optimization of a design",while Computer-Aided Manufacturing (CAM) is "the use of computer systems toplan, manage, and control the operations of a manufacturing plant througheither direct or indirect computer interface with the plant's productionresources" (Groover and Zimmers, 1984). Combining CAD and CAM to integratethe design and manufacture of products is a first step toward ComputerIntegrated Manufacturing (CIM).
We made several changes to the benchmark leather shoe model tosimulate the implementation of a CAD/CAM system. First we incorporated a$400,000 CAD system into the benchmark factory (Interviews 1988). As a stand-alone tool--that is without the CAM interface--CAD is difficult to justifysolely on cost savings. However, some companies we interviewed citedintangible savings and improvements in design lead time and pattern grading,coupled with the promise of future CAM integration, as justification forstand-alone CAD systems.
The second addition to the benchmark factory was computernumerically controlled (CNC) cutters. CNC cutters provide the required CAMinterface: instructions from the CAD system are downloaded to computercontrolled cutters. These are used to cut the leather into the requiredpatterns. Traditionally, cutting is a skill-intensive task. A master cutterknows from experience how to save on material. The CNC cutter has certainquantifiable advantages over a master craftsman using a manual press. First,cutting alogrithms optimize die placement during cutting, resulting in about a10 percent materials saving (Kaplan 1985). CNC cutting, however, is moreapplicable to synthetic materials than to leather; on account of its unpredic-table surface, leather continues to require a human operator for correctpositioning of the cutter.

- 39 -
Second, the CNC cutters require approximately one-half theprocessing time of a manual cutter. Thus, in the synthetic cutting departmentof the benchmark factory, the number of cutters can be reduced from 16 toeight. Third, fewer employees are needed to operate the machines. The manualcutters require one employee per machine while CNC cutters require only oneemployee per four machines. With upgrading from manual to CNC cutters, theprimary responsibility of the operator changes from die placement and machineoperation to system monitoring and set up assistance.
CNC cutters range in price from $25,000 to over $250,000,depending upon size and features. We assumed a price of $100,000. Subse-quently, we analyze the effect of lower and higher CNC prices.
In Table 5.1 are presented the estimates of production costs afterthe introduction of cutting automation. An interesting conclusion follows.Even in a high-wage DC, the impact of this form of automation is very limited.Total costs do not change down to the last pennyl Labor costs and scrap valuefall somewhat and capital costs and engineering costs (indirect labor) rise tooffset that decline. In an LDC or NIE, costs actually rise.
Table 5.1: COSTS AFTER CUTTING AUTCOMTION
Cost Per Shoe (in US$)
Cost Catesory LDC NIE DC
material 12.32 12.32 12.32
Direct Labor 0.57 0.84 3.32Direct Equipent 0.60 0.55 0.63
Non-prod. Direct Labor 0.28 0.37 1.42Non-prod. Direct Equip. 0.19 0.14 0.32
Indirect Labor 1.01 1.20 2.51Land and Buildings 0.11 0.10 0.11Adinistrative 0.41 0.43 0.51
Inventory and WIP 2.20 0.65 1.14
Valued Scrap 4.55 2.57 4.65
TOTAL 22.23 19.17 26.094
Benchaxk Total 21.99 19.00 26.94
We performed a number of sensitivity tests to assess therobustness of this conclusion. Realistic changes in the number of operatorsdo not have much impact. Likewise, when the cost of numerically controlledcutters falls to $25,000 (and efficiency of the cutter remains the same), unitcost of a shoe falls by only about 20 cents. Alternatively, if the cuttercost rises to $200,000 then, even in a DC, automation leads to higher costs.
To summarize, CAD/CAM cannot currently be justified in footwear onthe basis of cost savings. Labor accounts for the primary cost reduction.Material savings--which CAD/CAM can achieve--remain insignificant, due to theunique properties of leather. It should be noted that in garment production,

- 40 -
modern cutting machines allow far greater material and savings and signi-ficantly lower unit production costs (Mody and Wheeler 1987).
However, cost savings are not the sole justification for CAD/CAM.Non-quantifiable improvements, such as reductions in design lead times,improved pattern grading and pattern development, and enhanced prototypes,have been used to justify CAD/CAM system in some footwear companies (Inte-rviews, 1988). The over-riding question when assessing the intangiblebenefits of CAD/CAM is: how critical is product design to a company'scompetitive position? Most of the companies we visited in NIEs and LDCsproduce designs in one of two ways: they either 'reverse engineer" shoesobtained from the U.S. or Europe, or they perform "contract production,"manufacturing shoes designed outside the company. Reverse engineering in theshoe industry involves copying a shoe design by breaking down an existing shoeinto its components. The individual components are then used as patterns fordies, from which similar patterns can be cut.
Whether the company uses reverse engineering or contract produc-tion, original design is not critical to its competitive position. Thereforea CAD/CAM system is not justified. However, if the quick development of newdesigns and prototypes, as in women's shoes, is central to a company'ssuccess, a CAD/CAM system may be justified on intangibles.
Other factors in assessing CAD/CAM are the availability and costof technical expertise. A CAD system requires trained operators. Similarly,CNC cutters need technical support for system installation and machinemaintenance. Such expertise is lacking now in many of the companies andcountries we visited.
5.3 Assembly Automation
In this scenario, we automate several operations in the assemblyof the upper and the shoe. The level of automation at present achievable iseven lower than in cutting. In fact, we find here that automation canactually disrupt the production process and increase scrap slightly, therebyraising costs even in a DC.
In the fitting department, we introduced automated stitcherscapable of both decorative and programmable stitching (both stitch length andspeed). These machines reduce processing time and also reduce labor by asmall amount labor. Traditionally, fitting is the department most resistantto automation (and also the most labor-intensive), due primarily toinconsistencies in the leather and the three-dimensional shape of the shoe.Other improvements we incorporated into the fitting department includedadvanced skiving and embossing machines.
In the lasting department, we added technological advances toimprove machine flexibility (Interviews, 1988, Rubery and Wilkinson, 1987).New lasting machines, capable of handling many designs and sizes quickly andefficiently, further reduce processing times. We also introduced advancedroughers capable of automatically adjusting to variations in the quality andthickness of leather, thereby further improving cycle times.

- 41 -
A final modification to the benchmark model was the addition ofnine engineers to help install and integrate the new equipment.
Though the improvements result in decreased processing times, onlyabout a 20 percent reduction in operators can be expected to occur. We havebeen conservative in estimating for reduction in operators. However, asomewhat larger reduction will not change the cost estimates significantly.
Table 5.2 summarizes the results of assembly automation along withother variations studied. At this time, automation clearly has minimal impacton lowering production costs; in fact, they rise slightly. Much greatermileage is to be gained from implementation of improved work practicesdiscussed in the previous chapter. As a general point, it is also the casethat any gains from automation are greater when automation is introduced afterstreamlining the production process. Prior streamlining prevents disruptionand unexpected increases in scrap and inventory.
TIbl, 52: AUTOMATION SUIMAY(USS)
LDC gIE DC
Benchmark 22.0 19.0 26.9
Only Cutting Automation 22.2 19.2 26.9Only Assembly Automation 23.1 19.5 27.1Total Automation* 23.4 19.7 27.3
Improved FutureBest Practice** 16.5 17.3 20.7
Improved Practices plusTotal Automation 17.0 17.5 20.6
- Both cutting and assembly automation^ As defined in Chapter 4* it includes internal efficiency improvements
an Idnventory reduction.
5.4 The Future and "Action Leather"
Though our results provide little immediate solace to thoseseeking to automate their way to competitiveness, enough change is occurringat present to warrant a continuing assessment of emerging technologies. Here,we glance into our crystal ball.
Three forces are likely to change simultaneously the nature ofcompetition in the shoe industry.
* The availability of CAD and the increasing emphasis on usercomfort (such as shock absorption and rebound capabilities) areincreasing potential for product differentiation, rapid changes instyle and even rapid obsolescence of certain types of shoes(primarily athletic). Ordering cycles as short as three days arebeing targeted so that production can track evolving demand asclosely as possible.
- 42 -
* Computer-based production technology is improving rapidly.Commonly accepted standards are being set for fully computer-integrated manufacturing. Diffusion of these standards willprovide a fillip to equipment manufacturers. Quick size and modelchanges using bar codes on lasts, automated material flow technol-ogy using robots, automated stitching, and laser cutting are someof the technologies being actively tested on experimental produc-tion lines (see DiMaria 1988 for trends in Europe, Pulda 1989 fordevelopments in Korea and Box 5.1 for ongoing changes in theUnited States).
* Perhaps the most "blue-sky' of all technologies is "ActionLeather," an inexpensive leather laminated with polyurethane.Action leather is presently half the price of full grain leather,and is used in small amounts in athletic footwear. Being mucheasier to process than full grain leather, it offers tremendouspossibilities for automation. The big question mark here, ofcourse, is the acceptability of such leather to consumers.
Armed with these technologies, what cost reductions can producersrealistically achieve in the next five years? The results are presented inTable 5.3. The estimates assume a cumulative adoption of all the practicesand technologies described in this report. Thus, moving from the benchmark,first the "future best practices" of the previous chapter are assumed to beadopted; then the future level of automation is introduced (Future AutomationScenario); and finally, action leather is substituted for natural leather. Itshould again be emphasized that we view both "future best practice" and'future automation" as feasible in the next five years.

- 43 -
Tabl* 5.3: "BLUE-SKY" TECHNOLOGIES IN DC*
FutureAutomation
withFuture BSet Futute "Action
Bonehmark Practice* Automation** Leather"**
Materiel 12.32 12.32 12.32 8.67
Direct Labor 3.52 2.'2 1.01 0.95Direct Equipzont 0.43 0.42 0.81 0.95
Non-prod. Direct Lab.ir 1.43 1.20 0.39 0.34Non.prod. Direct Equip. 0.27 0.09 0.29 0.38
Indirect Labor 2.42 1.25 1.46 1.48Land and Buildins 0.11 0.08 0.08 0.08Administrative 0.51 0.52 0.53 0.54
Inventory and WIP 1.14 0.22 0.20 0.14Valued Scrap 4.78 1.74 1.69 0.57
TOTAL 26.94 20.65 18.78 14.10
* As described in Chapter 4. it includes internal efficiency improvements and inventory reduction.
*- Includes "Future Beat Practice" as defined above.
In the Future Automation Scenario, it is assumed that automationis extended to several more operations (e.g., tacking, insertion and packing)and to a far greater depth than is practiced today. On the conservative side,it is assumed that hardware costs would be comparable to today's, though weallow for a 50 percent reduction in the cost of the CAD system. Machine cycletimes are reduced by an average 25 percent, while labor times are reduced by afurther 30 percent over the previous total automation scenario (which reflectscurrent practice). In addition, via the use of new materials andtechnologies, as well as a maturing of existing technologies, we assume a 25percent decline in the cost of lasts and dies.
Introduction of "future automation" creates a real impact. Lowerlabor costs, lower inventories and reduced scrap value contribute to costreduction of about 10 percent, from $20.65 to $18.78. In a sector likefootwear, such cost reduction is non-trivial and it is not surprising thatcompanies that have survived the onslaught of low-wage competition arepursuing it with vigor.
When "action leather" is added to the list of possibilities, afurther substantial decline follows. The basic material cost falls and scraprates also decline because the material is of uniform grain and thickness andcan therefore be treated and cut much like a synthetic.
A new material that could be treated as a synthetic with constantproperties would have dramatic implications for the role of automation. Sucha development would have an immediate impact on the cutting departments of DCcompanies as CNC cutters with optisal cutting algorithms could beincorporated, saving both material and labor.

44 -
box 5.1: AUTOMVION IN MISSOURI
The Brown Shoe Company, a subsidiary of the Brown Group of St.Louis, Missouri, has gone far to turn a traditional, labor-intensiveindustry into a business committed to microelectronics. It has investedheavily in technology, an outlay justified not only by the high wagesof a developed country but also by the company's size; it owns 16 shoefactories and four component factories, and had sales - includingretailing - of nearly $1 billion in 1989.
To produce the patterns for its outsoles, for example, Brownuses a laser cutter. The $100,000 cutter takes digitized shapes and,via a material saving nesting algorithm, cuts the patterns at a rate offour to six inches per second. Because the laser projects a one-inchbeam, multiple layers can be cut.
Brown is currently looking into a $250,000 laser cutter fromHughes. It has also tested a $150,000 waterjet cutter that uses a .004inch jewelled orifice to perform tile cutting operation; it will cutalmost anything, but the water saturates the edges of the pattern as itis being cut.
The research and development laboratory at Brown employs about'a dozen people--electrical, software, and mechanical engineers-i&6concentrate on the automation of old and new equipment, new materialsand chsmicals, and computer development. The researchers designedBrown's own CAD system, writing the insole algorithm themselves, and usethe cathode-ray tube as the starting point for any new shoe.
Sooner rather than later, Brown hopes. it can eliminate:prototypes altogether, and do all its styling by computer. It alreadyhas the ability to'take the 3-dimensional computerized design and, usinga digitizer, flatten.it into the two dimensions needed for patterns forits shoes.
Leather also poses many problems for the industry as it isexpensive, inconsistent, difficult to manipulate, and often in short supply(Rubery and Wilkinson, 1987). The environmental controls established tomonitor the tanning of leather hides have worsened the leather shortages insome countries, and generated price increases. These and other problems mightbe solved by a new material, if it is accepted by the consumer.
"Blue-sky" results have been presented only for DCs. But theimplications for other countries are straightforward. The future automationtechnology will save costs primarily in DCs. The technology clearlysubstitutes capital for labor, raising capital costs and lowering labor costsper shoe. While all automation increases the relative role of capital, in

- 45 -
some other sectors we have studied (certain garment operations and mini-steelprocessing), unit capital costs actually fall after the introduction ofautomation. In those cases, it makes sense to adopt the newer technology evenin a low-wage country.
However, shoemaking seems more akin to textile manufacture whereautomation primarily substitutes for labor without lowering unit capital costs(see Mody and Wheeler 1987 on textiles). Thus in shoemaking, evolvingtechnologies will increase the menu of techniques from which firms can chooseand we can expect to observe very different techniques in use in differentcountries.
.Action leather," on the other hand, saves primarily on materialcost and scrap value, and so would be adopted by all firms irrespective oftheir labor and capital costs. Plans to automate will, however, increase theattractiveness of "action leather."

- 46 -
6. CONCLUSIONS
Even in a relatively mature industry, the potential exists forsubstantial differences in the use of productive resources. These differencescan overwhelm any advantage accruing from low input (e.g., wage) costs. Asour snap-shots, or scenarios, showed, technical change (occurring in both"soft" practices and "hard" equipment) can easily magnify initial productivitydifferences if speeds of adoption vary.
We should reemphasize that our scenarios of new technologies weremeant to depict engineering practice that is considered well withir. reach, nowor in the next five years. As such, the range of productivity differencesdepicted here should be considered within the realm of current possibilities.Towards the end we took the liberty of examining more speculative, "blue-sky",scenarios which, if they come about, could create further productivity gaps.
A central implication of this study, therefore, is that factorsthat impede the diffusion of knowledge are likely to have a powerful effect oninternational competitive ability. As the speed of change and the knowledge-intensity of production increase, the effects of differences in knowledge willbecome more potent.
From the perspective of this report, knowledge absorption isimpeded by inadequate hauman capital, organizational inertia, anid deficienciesin infrastructure (including networks of supplies and sources of marketing andproduction information).
One conclusion of our study could be that the knowledge content ofeven mature, traditionally "labor-intensive" sectors is so high that many low-wage countries have no real comparative advantage in these sectors. Analternative, more positive, view is that efforts directed at *reating a broadknowledge infrastructure could have a major pay-off. The exa:uple of coastalareas of China discussed In this and companion reports indicates the impor-tance of actively seeking foreign sources of knowledge in any such strategy.Below we discuss some general policy initiatives, but first, we summarize ourmore detailed results.
6.1 Technical Change
Even the relatively sedate pace of Lachnical change in footwearproduction has had significant i'aplications for international competitivenessof firms and countries. Steady and unsensational improvement in productionpractices have been the main drivers vf cnange. Such change can be charac-terized as "learning-by-doing". We have predicted that learning-by-doing willcontinue and, indeed, accelerate as modern just-in-time practices become morewidespread in the shoe industry. Even the efficient NIE producers will lowertheir costs by over 10 percent; gains could be greater for less efficientproducers in LDCs and DCs.
Producers in developing countries can take a number of simple,low-technology measures to ensure that they remain competitive. Above all,they need to improve their access to raw materials, their quality control,

- 47 -
their inventory control and production scheduling, and the training andmotivation of management and staff.
Automation technologies have so far had limited impact. However,there is enough ferment on experimental production lines in the United States,Europe and East Asia to suggest that we may see significant changes in thenext five years. Gazing into our crystal ball, we find that real reductionsin cost will occur in developing countries as automation technology maturesand can be integrated across the production process. Adoption of thesetechnologies will be accompanied by a stronger movement towards productdifferentiation strategies.
In the shoe industry, unlike some other sectors studied, automa-tion will raise capital costs per unit produced and so is less likely to beadopted in low-wage countries than in high-wage DCs. We should, therefore,begin to observe a wider range of techniques for shoe production, as ishappening in textile production.
If "action leather" is upgraded to become an acceptable substitutefor full grain leather, the impact on the shoe industry could be trulyrevolutionary.
6.2 PlaXers: Old and New
Competition is driving firms to look for new, low-cost productionsites and, at the same time, find ways to automate production in high-wagecountries. Among the low-wage countries, Cnina and Portugal have made themost dramatic advances (See Appendix on China). In high-wage countries, manysmall firms closed du'ing the 1980s, leaving larger firms to pursue thepossibility of automation.
Footwear manufacture is undoubtedly a labor intensive process.But it 'oes not follow that low-wage countries will necessary dominateproduction and trade of footwear. The emerging constellation of a devaluedU.S. doilar and new technological practices is once more making certain U.S.firms competitive. Production of leather shoes has not been easy to automate,although incremental progress is being made all the time. Exploiting thepossibility of low-cost assembly in the Caribbean, U.S. firms are stabilizingand increasing production, while holding back imports. The continued develop-ment of computer based technologies and "action leather", as described in the"blue-sky" scenarios, will further strengthen their position.
A central implication of this report is that newly industrializedcountries have built large market shares in a variety of products not onlybecause they have had low wages but also because they have invested sig-nificantly in production engineering, raising the level of the workforce,developing input suppliers, and providing communications and transportinfrastructure.
Countries with much lower wages have vied for increasing presencein international markets and have met with limited success. Only in the lastfew years have some low-wage countries made an impact on world markets.However, NIEs are not going to fold up and move on. They are setting new
- 48 -
standards for production management and are taking advantage of emergingopportunities provided by new technologies. In a world of increased productdifferentiation, they are likely to continue as major players.
NIE firms have also been in the vanguard of the movement torelocate some production to LDCs. Such arrangements are advantageous not onlyto the DC-or NIE-based shoe company, but also to the LDC startup. To acquirethe manufacturing expertise, establish reputations for reliability and,ultimately, concentrate on higher value-added segments of the market, theseproducers need to establish links with foreign manufacturers. It is thus thatthey will get ready access to product design, manufacturing technology anddistribution channels, too.
6.3 Polic0 Implications
The main thesis of this report has been that continuous learningto produce better shoes is a key component of success in internationalmarkets. We have also argued that such learning has occurred faster in theNIEs than elsewhere. The question may be asked: why do the natural forces ofcompetition not induce learning more widely, particularly since much invest-ment in hardware often is not required? Surely, the argument would go, firmscompeting for survival would see what is best for them and make the necessarychanges.
Rarely can the required changes be quickly implemented. Westernfirms seeking quick fixes to compete against the Japanese have realized thistruth rather painfully. The interdependent nature of the integrated manufac-turing process raises a paradox. Learning inside the firm proceeds in smallsteps. However, to make learning possible, discrete changes need to occurinside the firm and in its environment.
An analogy is of help. For a firm to move from its conventionalsystem of manufacturing with large internal and external buffers supportingthe process to a new system in which such buffers disappear is akin to, butmuch wider-reaching than, an organizational shift from IBM PCs to Applecomputers. Just as the latter shift requires file translations, new trainingand new methods of networking, a shift to integrated manufacturing requiresnew methods and procedures of documentation, new individual and group skills,new plant lay-out and new relations with buyers and suppliers. Such changesare extremely disruptive and impose high short-term costs on the organization.Besides direct costs of new software and training, indirect costs of lostproduction add up to substantial sums. Many firms have suffered largefinancial losses in the process of transition.
A central proposition of this study has been that learning isoccurring increasingly through systematic techniques. While learning is aprocess of experimentation, the experiments themselves are conducted in wellorganized ways using tested tools and techniques. There are a few key reasonswhy these techniques are not widespread despite their proven efficacy. Theserelate to organizational and infrastructural inertia.
Thus the shift to integrated manufacturing within a firm must besupported by wider environmental changes that reduce the inertia. Better

- 49 -
educated workers, reliable and inexpensive transportation and communication,and industrial extension services are all elements of a support system.
The success of NIEs and, more recently, of China, must be seen inthis context (see also Appendix on China). It should be remembered here thatwhen we talk of China, we are referring principally to the regions on the eastcoast that have specialized in exporting. The four factors that have sup-ported competitive exports are:
* long-term relationships with buyers* investment in training* development of communication and transportation infrastructure.* institutional infrastructure (including support services and local
specialized supplier networks).
While these are closely related and reinforce each other, historical evidencefrom East Asia suggests that they may come partly in sequence (Rhee, Ross-Larson and Pursell 1984).
Long-term relationships with buyers serve a number of importantfunctions. They provide the inforration necessary to make the manufacturingchanges. More importantly for the present discussion, they allow for theleeway in time and resources to tide the firm over the period of disruptiveorganizational changes. East Asian NIEs built such links with Western buyers.China has had the benefit of links with Hong Kong and Taiwanese firms.
Long-term links with buyers are only one way to achieve thesegoals. The central theme here is the need to be tied into the best inter-national information networks and mechanisms that support organizationalchange within the firm. Singapore has relied more heavily than others onforeign investment for this purpose. All East Asian countries have extensiveand effective industrial extension services and credit schemes that financerecommended improvements.
Training has been a major focus of international alliances anddomestic extension efforts. A Taiwanese or Hong Kong firm that startssourcing shoes, clothes, bicycles or electronics products from China typicallyinvests substantially in training. Such training is not evident in a specifictraining budget. The Taiwanese (more so than the Hong Kong) firm locateshalf-a-dozen or more supervisors each with as much as 15 to 20 years ofexperience in the Chinese firms. These supervisors stay in the Chinese firmsas long as two years even when only simple products involving repetitivetasks, such as shoes and garments, are being produced.
In addition to close international links, firms need an enablingenvironment in which training can be provided, organizational changes can bemade, materials with consistent quality are readily available, and investmentsin learning processes that result in temporary losses represent a reasonablerisk. Establishing such an environment requires changes in laws and regula-tions that place certain restrictions on firms when conducting their business.
- 50 -
Investment in infrastructure is another critical area for publicpolicy. Asian NIEs have set very high standards in this regard. The scaleand efficiency of Singapore's port are well known. In telecommunications, allAsian NIEs have taken advantage of new technologies and leapfrogged to themost modern equipment ahead of Western nations (Hody and Sherman, 1990).
A more general point is that any artificial barriers to themovement of information or goods and services will seriously hinder theability of firms to organize their internal affairs efficiently. Lengthyimport procedures or restrictions on location of production create the need toinvest in buffer mechanisms which sharply reduce the capability and theincentives to reorganize for greater efficiency.

- 51 -
APPENDIX A: CHINA'S LEAD IS DUE TO LOW WAGES AND FOREIGN EXPERTISE
In international trade in footwear, it has become common for theleadership to shift from one newly industrializing economy to another. A newlocation has been found: China.
Only a few years ago, China was struggling to capture the interestof foreign name-brand shoe manufacturers - and when it succeeded in doing so,the results were sometimes disastrous. In 1985, a Shanghai-Hong Kong jointventure lost thousands of dollars when it was unable to ship 20,000 Nikes fora year. Then Nike went to a state-run factory in Fujian province, butreportedly became dissatisfied with production there. Even Japanese producershave faced an uphill task in China (see Box A.l).
Box A.A: MADE-FOR-JAPAN MOVES TO CHINA
In the 1970s, when footwear manufacturers in developed countrieswere shifting production to Korea and Taiwan, the Nisshin Rubber Company ofOkayama, Japan, took the leap and began manufacturing in China. Today zNisshin produces 700,000 pairs of rubber shoes in Japan each year, and 2.3million pairs in Anzan, China. All production is for the Japanese market.
Although Nisshin has been in China for about two decades,production quality problems continue. Shop-floor workers in China receivethe same training as their counterparts in Japan but are less efficient andmust be monitored closely to ensure low defect rates. Meeting deliverydeadlines is also difficult from the Chinese factory.
Nisshin's Japa.iese production is also labor-intensive and largelyunautomated; however, it produces higher-priced and better quality than itsshoes than the Chinese factory. Japanese production also has a quickerturnaround; shoes with shorter life cycles are made in Japan, not China.Technological standards in China are improving. And with labor in Japanbecoming prohibitively expensive, the Japanese are shifting more made-for-Japan production to China.
Now the shoe is on the other foot. Since 1989, Nike has importedseveral million pairs of shoes from China, and it is steadily increasing itsorders. And Nike is just one of several major Western companies producingfootwear in China for export; others include Reebok, Kangaroos, Adidas, Puma,Converse and New Balance. Puma, having subcontracted production to Sino-HongKong and Sino-Taiwan ventures, is now setting up its own facility to produce1.2 million athletic shoes annually.

- 52 -
In 1990, China became the largest single supplier of shoes to theU.S.; Chinese sales of non-rubber shoes was $1278 million up from $561 millionin 1989. China also the largest supplier of rubber shoes. In 1990, accordingto the Footwear Distributors and Retailers of America, China accounted for 32percent of all shoes imported by the U.S., and half of all low-priced shoes.
For China, seeking to become a major footwear manufacturer andexporter, cheap labor was only part of the answer. The rest was expertise -and that has been imported. China owes much of its transformation from would-be industrialist to premiere exporter to neighboring Taiwan.
In the past few years, Taiwanese shoe companies--stymied by risingwages and unfavorable exchange rates--have shifted production across theFormosa Strait to China's Fujian province. It has been reported that Taiwan'sshoe manufacturers have located 60 to 200 operations to China, where manufac-turing costs are said to be 20 to 30 percent cheaper. In 1989 Fujian was thecountry's largest shoe exporter, shipping $135 million worth of product to theU.S., Europe and other markets. (The province has also become a center fortextile and garment manufacturing by the Taiwanese.)
Most Taiwanese factories in China are joint ventures with state-run agencies. Because Taiwan prohibits direct investment in China, manufac-turers operate through a third party, typically a company in Hong Kong.Beijing, on the other hand, has encouraged foreign investors in joint ven-tures, with tax breaks, reduced duties and low or nonexistent importrestraints on materials, machinery and personal goods. Most of the machineryand components are imported from Taiwan, although Taiwanese companies arereportedly considering investing in leather tanneries and otner operationsthat would provide support to footwear manufacturing.
The tax breaks and other incentives give the China-Taiwan jointventures a sizable edge over state-run factories. The joint ventures alsotend to pay higher wages, presumably attracting better and more highlymotivated workers. Western manufacturers say that the China-Taiwan factoriesare superior not only to the state-run plants, but also the China-Hong Kongoperations, in quality control, variety of shoe production, delivery time,sample making and raw material sourcing. Small groups of resident Taiwanesecontinuously oversee operations, while at the same time they transfer theirlong years of experience.
So dramatic is China's rise as international shoemaker that it hasinspired a proposal for a gigantic, $500 million Shoe City on the outskirts ofZhongshan in southern Guangdong province. The plan, only on the drawing boardso far, calls for a vast shoe manufacturing complex that would turn outmillions of high-performance athletic shoes for China and world markets.
The centerpiece of Shoe City would be a 1.5 million-square-footshoe factory, fueled by its own power plant. Surrounding it in a horseshoeformation would be some 30 manufacturers of components and raw materials. Theentire complex would employ about 500,000 Chinese workers, trained and managedby a team of Japanese - and, under an arrangement with the Guangdong govern-ment, paid 32 cents an hour. According to the American businessman who ispromoting the scheme, more than a dozen branded athletic shoe firms are

- 53 -
interested in investing in the venture, which could begin operations in acouple of years.
Whether or not such a grandiose plan ever becomes reality, thevery notion of Shoe City is a measure of the distance that China has come.However, its new position is far from secure.
In May 1990, China was recertified by the United States as a MostFavo..ed Nation (MFN) trading partner, but only after a bitter fight inWashington. By law, no country that systematically violates human rights iseligible for MFN, and many members of Congress were still disturbed over thesupression of the Tiananmen Square student uprising in 1989. China's advocatein this matter was President Bush. If China were to lose its MFN status,tariffs on many types of Chinese-made shoes would rise substantially and, insome cases, they would more than double.
In 1991, the MFN issue has become even more bitter. The U.S.Congress has agreed to renewal of MFN status but with certain conditions onhuman rights. These conditions are likely to be unacceptable to China andPresident Bush is likely to veto the Congress proposal. However, he will haveto make concessions on other fronts. The United States Trade Representativehas assessed that many Chinese trade practices go against U.S. interests.President Bush will need to take strong action against these practices.
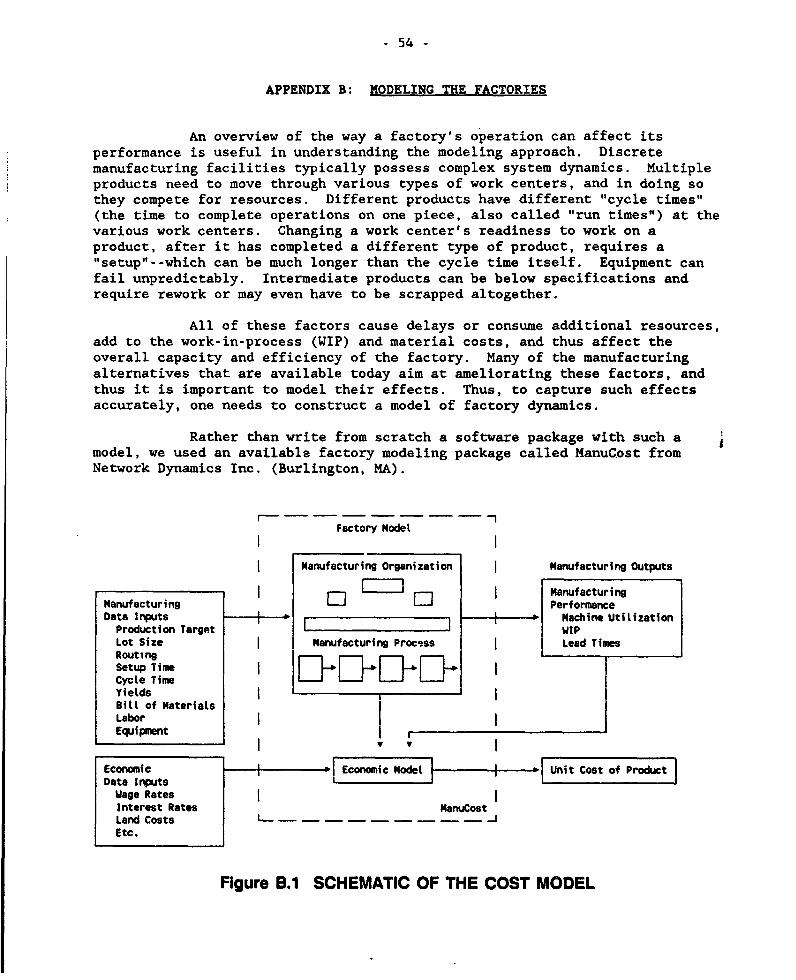
- 54 -
APPENDIX B: MODELING THE FACTORIES
An overview of the way a factory's operation can affect itsperformance is useful in understanding the modeling approach. Discretemanufacturing facilities typically possess complex system dynamics. Multipleproducts need to move through various types of work centers, and in doing sothey compete for resources. Different products have different "cycle times"(the time to complete operations on one piece, also called "run times") at thevarious work centers. Changing a work center's readiness to work on aproduct, after it has completed a different type of product, requires a"setup"--which can be much longer than the cycle time itself. Equipment canfail unpredictably. Intermediate products can be below specifications andrequire rework or may even have to be scrapped altogether.
All of these factors cause delays or consume additional resources,add to the work-in-process (WIP) and material costs, and thus affect theoverall capacity and efficiency of the factory. Many of the manufacturingalternatives that are available today aim at ameliorating these factors, andthus it is important to model their effects. Thus, to capture such effectsaccurately, one needs to construct a model of factory dynamics.
Rather than write from scratch a software package with such amodel, we used an available factory modeling package called ManuCost fromNetwork Dynamics Inc. (Burlington, MA).
Factory Model
Manufacturing Organization | Manufacturing Outputs
l l l ManufacturingManufacturing O O PerformanceData Irputs 4_ _ * r- --, Machine Utilization
Production Target WIPLot Size l Manufacturing Process l Lead TimesRoutingSetuip Time
Cycle Time l -D- -Yields lBill of HaterialsLabor l
Equipment
Economic *Economic Model -- * Unit Cost of ProductData Inputs
Wage RatesInterest Rates ManuCostLand Costs L_ _…Etc.
Figure B.1 SCHEMATIC OF THE COST MODEL

- 55 -
This factory modeling software package has a number of featuresthat make it well-suited for our use:
* It allGws detailed specification of operations and the linksbetween them. At each operation, the resources used (equipment,labor and materials) are specified. Labor is split by skillcategory.
* The routings (the sequence of operations required, as well as theequipment on which they must be performed), yields (the proportionof good parts obtained from an operation), rework rates, and set-up and cycle times (defined above) for each operation on eachavailable machine are also specified. If equipment is automatedor semi-automated, these times can be separated into those when anoperator is needed, and those when the operation can continueunattended.
* The model contains a set of dynamic equations. For given machinereliability rates, variability in arrival of material from onestation to another, yields, set-up and cycle times, the equationspredict the average utilization of various resources installed inthe factory. The model is, therefore, able to estimate perfor-mance measures such as total production capacity, work-in-progress(WIP), specific equipment and labor utilization rates, and productlead times (the time it takes for an order to go through theentire factory).
* The package also incorporates an economic model that allows one tospecify costs of various direct inputs (such as material, equip-ment and labor) as well as indirect inputs (such as managementsalaries and facility costs). It then combines the manufacturingmodel with the economic model to accumulate costs (includingappropriately allocated indirect costs) through the productionprocess, up through components, subassemblies and final products.
* A particularly interesting and important feature of the model isits system of scrap estimating. The model keeps track of scrapthrough data on yields and rework rates at each operation. Themodel not only estimates the material value of the scrap, but alsokeeps track of the value added at earlier stages that goes alongwith the scrapped material. Similarly, the model's ability topredict the quantity of WIP at each stage of production, leads toan accurate prediction of WIP carrying costs. As we shall see,these costs are important in determining opportunities forimprovement.
* The package is based on the Rapid Modeling approach to manufactur-ing modeling, as distinct from the "discrete-event simulation"approach (e.g. see Suri 1989). Rapid Modeling is less ambitious,but as a consequence also requires less data and allows muchfaster turnaround for examining alternatives. This package has

- 56 -
been successfully used in manufacturing analysis by firms such asAlcoa, Digital Equipment Corp., IBM, and Siemens.
Note that the model is purely an evaluation tool. No optimizationis done, only prediction. Thus if a desired production rate or other perfor-mance measure is not achieved, the analyst must decide on what alternative totry, and then modify the inputs accordingly. The performance reports providedby the model usually assist in directing the analyst towards the necessarymodification. For example, if a production rate is not achieved, the modelwill show the bottleneck resource(s). The analyst can then explore variousalternatives, the most obvious one being to add more resources.
Furthermore, in the benchmark cases, the set of alternatives maybe limited by the observed data in the actual factories. However, in thescenarios for improvement, many other alternatives may be available, such asthe use of methods to improve yields, or ways to shorten set-up or cycletimes, or the use of new materials or automation. These alternatives requirea wide knowledge of manufacturing processes as well as considerable designcreativity, and thus render the use of an optimization scheme extremelydifficult. Instead we use an iterative approach that allows the analyst totry alternatives until the desired performance indicators are obtained.
Relation to Activity Based Costing (ABC)
New accounting methods for manufacturing, such as Activity BasedCosting (ABC), are gaining acceptance (e.g. see Cooper and Kaplan, 1988).While our approach is in the spirit of ABC, there are some important-differences. ABC provides accurate cost analysis of existing operations, butwould have been less appropriate for our "what-ifs". In most of the scenariosthat we undertake, the structure and dynamics of the manufacturing systemchange in a nontrivial way. For example, new technology (e.g. fixtures andhydraulic clamps that reduce setup time) combined with a new operatingapproach (smaller lot sizes) can drastically decrease the amount of work-in-progress (WIP). It is important to model the manufacturing dynamics first, inorder to predict the new resource utilizations and the new WIP, and thenconduct the cost allocation on the outcomes. ABC is designed to do thelatter, thus it can only be meaningfully applied to what-ifs that are "in theneighborhood' of the current process structure and system. Our approachpredicts the new operating conditions first, and then does the cost analysis.However, both ABC and our methodology share an important attribute: theyunderscore the need for development of improved costing methods in evaluatingmanufacturing alternatives.

- 57 -
BIBLIOGRAPHY
Aoki, Masahiko. 1990. "Toward an Economic Model of the Japanese Firm".Journal of Economic Literature 28: 1-27.
Barrett, Jeff. 1988. IEs at CalComp are Integrating JIT, TQC, and EmployeeInvolvement for 'World Class Manufacturing'". Industrial EngineeringSeptember: 26-32.
Caterpillar Inc. 1989. "P.T. Natra Raya". Caterpillar World 1: 2-7.
Cole, Robert E. 1989. Strategies For Learning: Small-Group Activities inAmerican. Japanese. and Swedish Industry. Berkley: University ofCalifornia Press.
Cooper, R. and R.S. Kaplan. 1988. "Measure Costs Right: Make the RightDecisions". Harvard Business Review, 66(5), 96-105.
Deming, W. Edwards. 1986. Out of the Crisis. Cambridge Mass: M.I.T. Centerfor Advanced Engineering Study.
DiMaria, Eugene. 1988. "Computers 'Take Over' International Show". FootwearNews 44 (May 16): 1.
Drucker, Peter. F. 1988. "Workers' Hands Bound By Tradition". The WallStreet Journal August 2.
Footwear Manufacturing. 1986. "USM Introduces New Machines". FootwearManufacturing April.
Footwear Manufacturing. 1986. "Belcan-Logic Introduces New Waterjet System".Footwear Manufacturing April.
Groover, M.P. and E.W. Zimmers, Jr. 1984. CAD/CAM: Computer-Aided Design andManufacturing. New Jersey: Prentice Hall, Inc.
Hoer, J. and M.A. Pollock. 1986. "Management Discovers the Human Side ofAutomation". Business Week September 29.
Huang, Philip Y., Laren P. Rees, and Bernard W. Taylor III. 1983. "A Simula-tion Analysis of the Japanese Just-In-Time Technique (Wi .a Kanbans) fora Multiline, Multistage Production System". Decision Sciences 14.
Inglesby, Tom. 1988. "We Have Met the Enemy and It are Management". Manufac-turing Systems June: 16-19.
Kaplan. J.B. and Company. 1985. Analysis of Potential for ProductivityImRrovement and Cost Reduction in Non-Rubber Footwear Manufacture BasedUpon Utilization of Commercially Available Manufacturing and ManagementTechnology. Washington D.C.: Footwear Association of America.

- 58 -
King, Bob. 1988. "Taiwan Shoemakers Seek Foothold Abroad". Financial Times.September 1.
King, Bob. 1988. "Shoe Manufacture: Move to the Top of the Market". Einanciallimes. October 10.
Koike, Kazuo. 19&8. Understanding Industrial Relations in Modern Janan.London: MacM4 llan Press.
Leamer, Edward. 1984. Sources of International Comparative Advantage.Cambridge Mass: M.I.T. Press.
Leonard-Barton, Dorothry. 1988. "Implementation as Mutual Adaptation ofTechnology and Organization". Research Policy 17: 251-167.
Levin, D.P. 1988. "Smart Machines, Smart Workers". The New York Times.October 17.
Love, Ranuall K. 1988. "Competitive Advantage Achieved Through Mastering theArt oA JIT in South Korea". 1988 SME Autofact Conference Proceedings.
Meredith, J.R. and S.G. Green. 1988. "Managing the Introduction of AdvancedManufacturing Technologies". Manufacturing Review 1 (2).
Miller, Jeffrey, G. and associates. 1990. Factories of the Future. INSEAD,Fontainebleau, France.
Mody, Ashoka and Ron Sherman. 1990. "Leapfrogging in Switching Systems'.Technological Forecasting and Social Change 37 (1).
Mody, Ashoka and David Wheeler. 1987. "Towards a Vanishing Middle: Competi-tion in the World Garment Industry". World Development 15 (10/11):1269-1284.
Moffett, M. 1989. "Toe in the Door: A Mexican Shoemaker is Struggling to MeetForeign Competition". The Wall Street Journal April 5.
Office of Technology Assessment. 1990. Making Things Better: Competing inManufacturing. Report Number OTA-ITE-443. (Washington D.C.:U.S.Government Printing Office).
Peters, Tom. 1989. "Tomorrow's Companies: New Products, New Markets, NewCompetition, New Thinking". The Economist March 4.
Pulda, Ellen. 1989. "Korea's Kukje Goes Hi-Tech". Footwear News 45 (May 29):54.
Rhee, Yung Whee, Bruce Ross-Larson and Garry Pursell. 1984. Korea's Competi-tive Edge. Published for the World Bank. Baltimore: Johns HopkinsPress.

- 59 -
Rosenthal, Stephen R. and Mohan V. Taitkonda. Managing the Time Dimension inthe New Product Introduction Cycle. The Manufacturing Roundtable,Boston University, Boston.
Rubery, J. and F. Wilkinson. 1987. Industrial Organization and Com2etitive-ness: The Footwear Industry in the U.K. Cambridge: Cambridge University,Deparment of Applied Economics.
Schonberger, Richard J. 1982. "Some Observations on the Advantages andImplementation Issues of Just-In-Time Production Systems". Journal ofOperations Management 3 (1).
Schroeder, Dean M., C. Gopinath, and Steven W. Congden. 1989. "New Technologyand the Small Manufacturer: Panacea or Plague?" Journal of SmallBusiness Management July: 1-10.
Suri, Rajan. 1989. "Lead Time Reduction Through Rapid Modeling". Manufactur-ing Systems July: 66-68.
Suri, Rajan and Suzanne de Treville. 1986. "Getting From 'Just-In-Case' to'Just-In-Time': Insights From a Sinple Model". Journal of OperationsManagement 6 (3).
Womack, James P. Daniel T. Jones, and Daniel Roos. 1991. The Machine thatChanged the World. New York: Rawson Associates.
Zipkin, Paul. 1991. Harvard Business Review.
,I
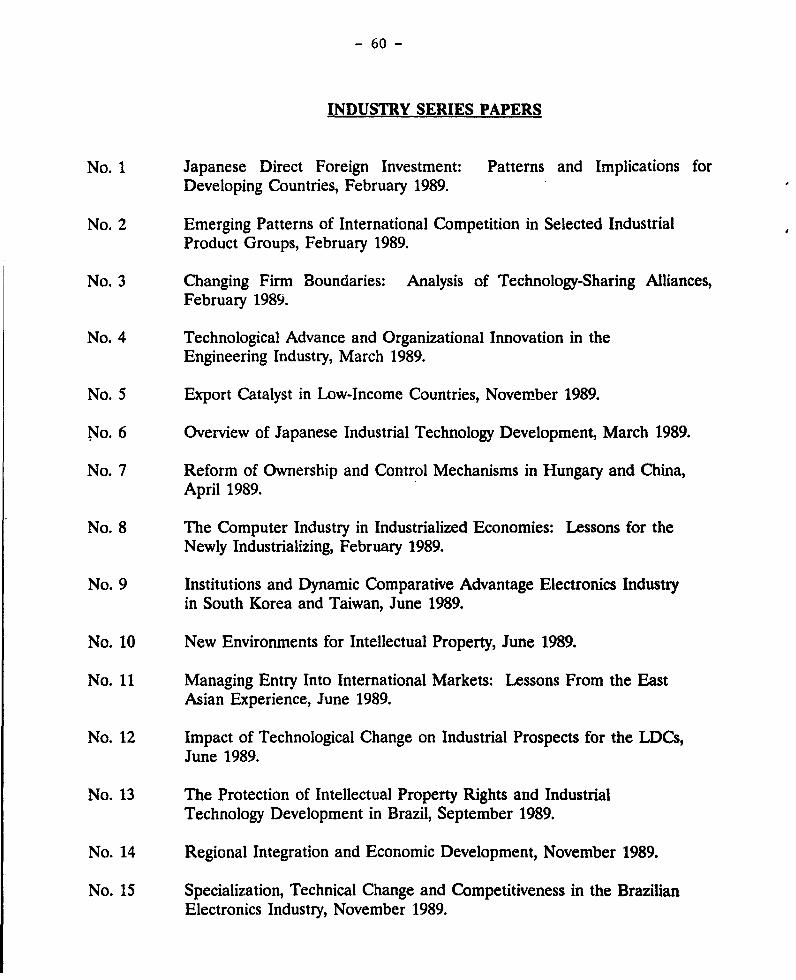
- 60 -
INDUSTRY SERIES PAPERS
No. 1 Japanese Direct Foreign Investment: Patterns and Implications forDeveloping Countries, February 1989.
No. 2 Emerging Patterns of International Competition in Selected IndustrialProduct Groups, February 1989.
No. 3 Changing Firm Boundaries: Analysis of Technology-Sharing Alliances,February 1989.
No. 4 Technological Advance and Organizational Innovation in theEngineering Industry, March 1989.
No. 5 Export Catalyst in Low-Income Countries, November 1989.
No. 6 Overview of Japanese Industrial Technology Development, March 1989.
No. 7 Reform of Ownership and Control Mechanisms in Hungary and China,April 1989.
No. 8 The Computer Industry in Industrialized Economies: Lessons for theNewly Industrializing, February 1989.
No. 9 Institutions and Dynamic Comparative Advantage Electronics Industryin South Korea and Taiwan, June 1989.
No. 10 New Environments for Intellectual Property, June 1989.
No. 11 Managing Entry Into International Markets: Lessons From the EastAsian Experience, June 1989.
No. 12 Impact of Technological Change on Industrial Prospects for the LDCs,June 1989.
No. 13 The Protection of Intellectual Property Rights and IndustrialTechnology Development in Brazil, September 1989.
No. 14 Regional Integration and Economic Development, November 1989.
No. 15 Specialization, Technical Change and Competitiveness in the BrazilianElectronics Industry, November 1989.

- 61 -
INDUSTRY SERIES PAPERS cont'd
No. 16 Small Trading Companies and a Successful Export Response: LessonsFrom Hong Kong, December 1989.
N.o. 17 Flowers: Global Subsector Study, December 1989.
No. 18 The Shrimp Industry: Global Subsector Study, December 1989.
No. 19 Garments: Global Subsector Study, December 1989.
No. 20 World Bank Lending for Small and Medium Enterprises: Fifteen Yearsof Experience, December 1989.
No. 21 Reputation in Manufactured Goods Trade, December 1989.
No. 22 Foreign Direct Investment From the Newly Industrialized Economies,December 1989.
No. 23 Buyer-Seller Links for Export Development, March 1990.
No. 24 Technology Strategy & Policy for Industrial Competitiveness: ACase Study of Thailand, February 1990.
No. 25 Investment, Productivity and Comparative Advantage, April 1990.
No. 26 Cost Reduction, Product Development and the Real Exchange Rate,April 1990.
No. 27 Overcoming Policy Endogeneity: Strategic Role for DomesticCompetition in Industrial Policy Reform, April 1990.
No. 28 Conditionality in Adjustment Lending FY80-89: The ALCID Database,May 1990.
No. 29 International Competitiveness: Determinants and Indicators,March 1990.
No. 30 FY89 Sector Review Industry, Trade and Finance, November 1989.
No. 31 The Design of Adjustment Lending for Industry: Review of Current Practice,June 1990.

- 62 -
INDUSTRY SERIES PAPERS cont'd
No. 32 * National Systems Supporting Technical Advance in Industry: The BrazilianExperience, June 26, 1990.
No. 33 Ghana's Small Enterprise Sector: Survey of Adjustment Response andConstraints, June 1990.
No. 34 Footwear: Global Subsector Study, June 1990.
No. 35 Tightening the Soft Budget Constraint in Reforming Socialist Economies,May 1990.
No. 36 Free Trade Zones in Export Strategies, December 1990.
No. 37 Electronics Development Strategy: The Role of Government, June 1990
No. 38 Export Finance in the Philippines: Opportunities and Constraints forDeveloping Country Suppliers, June 1990.
No. 39 The U.S. Automotive Aftermarket. Opportunities and Constraints forDeveloping Country Suppliers, June 1990
No. 40 Investment As A Determinant of Industrial Competitiveness and ComparativeAdvantage: Evidence from Six Countries, August 1990 (not yet published)
No. 41 Adjustment and Constrained Response: Malawi at the Threshold ofSustained Growth, October 1990.
0
No. 42 Export Finance - Issues and Directions Case Study of the Philippines,December 1990
No. 43 The Basics of Antitrust. Policy: A Review of Ten Nations and the EEC,February 1991.
No. 44 Technology Strategy in the Economy of Taiwan: Exploiting Foregin Linkagesand Investing in Local Capability, January 1991
No. 45 The Impact of Adjustment Lending on Industiy in African Countries,June 1991.
N- 46 Banking Automation and Productivity Change: The Brazilian Experience,July 1991. -

- 63 -
No. 47 Global Trends in Textile Technology and Trade, December 1991.
Note: For extra copies of these papers please contact Miss Wendy Young-onextension 33618, Room S-4101

- 64 -
ENERGY SERIES PAPERS
No. 1 Energy Issues in the Developing World, February 1988.
No. 2 Review of World Bank Lending for Electric Power, March 1988.
No. 3 Some Considerations in Collecting Data on Household Energy Consumption,March 1988.
No. 4 Improving Power System Efficiency in the Developing Countries throughPerformance Contracting, May 1988.
No. 5 Irnpact of Lower Oil Prices on Renewable Energy Technologies, May 1988.
No. 6 A Comparison of Lamps for Domestic Lighting in Developing Countries, June1988.
No. 7 Recent World Bank Activities in Fnergy (Revised October 1989).
No. 8 A Visual Overview of the World Oil Markets, July 1988.
No. 9 Current International Gas Trades and Prices, November 1988.
No. 10 Promoting Investment for Natural Gas Exploration and Production inDeveloping Countries, January 1988.
No. 11 Technology Survey Report on Electric Power Systems, February 1989.
No. 12 Recent Developments in the U.S. Power Sector and Their Relevance for theDeveloping Countries, February 1989.
No. 13 Domestic Energy Pricing Policies, April 1989.
No. 14 Financing of the Energy Sector in Developing Countries, April 1989.
No. 15 The Future Role of Hydropower in Developing Countries, April 1989.
No. 16 Fuelwood Stumpage: Considerations for Developing Country Energy Planning,June 1989.
No. 17 Incorporating Risk and Uncertainty in Power System Planning, June 1989.
No. 18 Review and Evaluation of Historic Electricity Forecasting Experience, (1960-1985), June 1989.
No. 19 Woodfuel Supply and Environmental Management, July 1989.
No. 20 The Malawi Charcoal Project - Experience and Lessons, January 1990.
No. 21 Capital Expenditures for Electnic Power in the Developing Countries in the1990s, February 1990.
No. 22 A Review of Reguladon of the Power Sectors in Developing Countries,February 1990.

- 65 -
No. 23 Summary Data Sheets of 1987 Power and Commercial Energy Staistics for 100Developing Countries, March 1990.
No. 24 A Review of the Treatment of Environmental Aspects of Bank Energy Projects,March 1990.
No. 25 The Status of Liquified Natural Gas Worldwide, March 1990.
No. 26 Population Growth, Wood Fuels, and Resource Problems in Sub-SaharanAfrica, March 1990.
No. 27 The Status of Nuclear Power Technology - An Update, April 1990.
No. 28 Decommissioning of Nuclear Power Facilities, April 1990.
No. 29 Interfuel Subsdtution and Changes in the Way Households Use Energy: TheCase of Cooking and Lighting Behavior in Urban Java, October 1990.
No. 30 Regulation, Deregulation, or Reregulation--What is Needed in LDCs PowerSector? July 1990.
No. 31 Understanding the Costs and Schedules of World Bank Supported HydroelectricProjects, July 1990.
No. 32 Review of Electricity Tariffs in Developing Countries During the 1980s,November 1990.
No. 33 Private Sector Participation in Power through BOOT Schemes, December 1990.
No. 34 Identifying the Basic Conditions for Economic Generation of Public Electicityfrom Surplus Bagasse in Sugar Mills, April 1991.
No. 35 Prospects for Gas-Fueled Combined-Cycle Power Generation in the DevelopingCountries, May 1991.
No. 36 Radioactive Waste Management - A Background Study, June 1991.
No. 37 A Study of the Transfer of Petroleum Fuels Pollution, July 1991.
No. 38 Inproving Charcoaling Efficiency in the Traditional Rural Sector, July 1991.
No. 39 Decision Making Under Uncertainty - An Opdon Valuation Approach to PowerPlanning, August 1991.
No. 40 Summary 1988 Power Data Sheets for 100 Developing Countries, August 1991.
No. 41 Health and Safety Aspects of Nuclear Power Plants, August 1991.
No. 42 A Review of International Power Sales Agreements, August 1991.
No. 43 Guideline for Diesel Generating Plant Specification and Bid Evaluation,September 1991.
No. 44 A Methodology for Regional Assessment of Small Scale Hydro Power,September 1991.

- 66 -
No. 45 Guidelines for Assessing Wind Energy Potential, September 1991.
No. 46 Core Report of the Electric Power Utility Efficiency Improvement Study,September 1991.
For copies, please call extension 33616.