International Comparison - EURAMET · Web viewThe new gravimetric results with the new purity...
37
Bilateral comparison EUROMET 900a CO in nitrogen (5 µmol.mol -1 ) Draft B Angelique Botha 1 , Mellisa Janse van Rensburg 1 , James Tshilongo 1 , Ipeleng Mokgoro 1 , Nompumelelo Leshabane 1 , Rob M. Wessel 2 , 1 CSIR National Metrology Laboratory (CSIR NML), CSIR, Building 5, Meiring Naudé Road, Brummeria, Pretoria, 0001, South Africa 2 NMi Van Swinden Laboratorium B.V. (NMi VSL), Thijsseweg 11, 2629 JA Delft, the Netherlands Field Amount of substance Subject Permanent gases (carbon monoxide in nitrogen) Participants NMi VSL, CSIR NML Organising body EUROMET 1
Transcript of International Comparison - EURAMET · Web viewThe new gravimetric results with the new purity...

Bilateral comparison EUROMET 900aCO in nitrogen (5 µmol.mol-1)Draft BAngelique Botha1, Mellisa Janse van Rensburg1, James Tshilongo1, Ipeleng Mokgoro1, Nompumelelo Leshabane1, Rob M. Wessel2,
1CSIR National Metrology Laboratory (CSIR NML), CSIR, Building 5, Meiring Naudé Road, Brummeria, Pretoria, 0001, South Africa2NMi Van Swinden Laboratorium B.V. (NMi VSL), Thijsseweg 11, 2629 JA Delft, the Netherlands
FieldAmount of substance
SubjectPermanent gases (carbon monoxide in nitrogen)
ParticipantsNMi VSL, CSIR NML
Organising bodyEUROMET
1

Table of contents
Field..........................................................................................................1Subject......................................................................................................1Participants...............................................................................................1Organising body........................................................................................1Table of contents......................................................................................2Introduction...............................................................................................3Measurements standards.........................................................................3Measurement protocol..............................................................................3Schedule...................................................................................................4Measurement methods.............................................................................5Degrees of equivalence............................................................................5Computation of degrees of equivalence and associated uncertainties.....5Results......................................................................................................7Discussion of results...............................................................................12Conclusions............................................................................................13References..............................................................................................14Appendix: Measurement reports............................................................15
2

Introduction
The first key comparison on carbon monoxide in nitrogen dates from 1992 (CCQM-K1a) [1]. It is in fact one of the first types of gas mixtures that was used in an international (key) comparison. Since then, numerous national metrology institutes (NMIs) have been setting up facilities for gas analysis, and have developed claims for their calibration and measurement capabilities (CMCs) for these mixtures. Furthermore, in the April 2005 meeting of the CCQM Gas Analysis Working Group, a policy was proposed to repeat key comparisons for stable mixtures every 10 years. Consequently, this comparison is consistent with the proposed policy and provides an opportunity for NMIs that could not participate in the previous comparison.
In preparation for a CCQM key comparison on CO in nitrogen (1-10 µmol.mol-1 range) a bilateral comparison is organised between the coordinating laboratory and another laboratory which participated in CCQM-K1. In this comparison CSIR NML will prepare two gas mixtures to be analysed by NMi VSL and NMi VSL will also prepare two mixtures to be analysed by CSIR NML. This would allow for the CSIR NML to validate its capabilities for this component in this range.
Measurement standards
Table 1 gives the nominal composition used throughout this comparison.
Table 2: Nominal composition for the comparisonComponent x
(µmol.mol-1)Carbon monoxide 5Nitrogen balance
Measurement protocol
A set of mixtures of carbon monoxide in nitrogen at approximately 5 µmol.mol-1 will be prepared gravimetrically. The mixtures will be verified against primary standard mixtures (PSMs). After verification of the composition of the mixtures, the gravimetric value will be adopted as key comparison reference value (KCRV).
The pressure in the cylinders will be approximately 100 bar; cylinders of 5 dm3 nominal volume will be used. The amount-of-substance fractions as obtained from gravimetry and purity verification of the parent gases will be used as reference values. Each cylinder will have its own reference value.
Participating laboratories are requested to specify in detail which analytical method(s) have been used and how the evaluation of the measurement uncertainty was performed. Each participating laboratory will be responsible for the calibration of its own equipment. For a proper evaluation of the data, it is necessary that the calibration method, as well as the way in which the calibration mixtures have been prepared is reported to the co-ordinator. This
3

information is needed for the evaluation of the preparation facilities (as part of this bilateral comparison).
After each calibration, the measurements on the gas mixture can be performed and recorded. Each laboratory has to express the uncertainty on all results submitted, as expanded uncertainty. The evaluation of measurement uncertainty should be in accordance to the “Guide to the expression of uncertainty in measurement” (ISO GUM). The participant should provide a detailed description of the uncertainty budget, including– method of evaluation (type A or type B)– (assumed) probability distribution– standard uncertainties and sensitivity coefficients
After the measurements, the participants have to return the cylinders with a sufficient amount of gas (pressure at least 30 bar) to the coordinating laboratory for re-analysis. Transport of the cylinders to the participating laboratories will be arranged by the coordinating laboratory and paid for by each participant. The return of the cylinders must be arranged and paid for by the participants.
The measurement report requires per cylinder at least three independent measurements, obtained under repeatability conditions with (at least) three independent calibrations, e.g. calibration measurement calibration measurement calibration measurement (etc.). This is a strict requirement to come to proper statistical analysis of the reported data.One single measurement result is usually obtained from multiple readings (sub measurements), without recalibrations. Its standard deviation provides information about the performance of the measurement system.
Additional measurement reports and additional information can be submitted jointly with the report forms to the CSIR NML and will be taken into consideration during the evaluation. Please send all information in Word 2000 format1 (or compatible, such as RTF) by e-mail and /or by mail/fax.
Schedule
The schedule for this part of the comparison is presented in Table 2.
Table 2: Schedule followed for EUROMET 900aJanuary 2006 CSIR NML sent two 5 µmol.mol-1 cylinders to NMi VSL for
measurementMarch 2006 Measurement report received from NMi VSLApril 2006 NMi VSL sent a 10 µmol.mol-1 and a 8 µmol.mol-1 cylinder to
CSIR NML for measurementJune 2006 Measurement report submitted by CSIR NMLJuly to September 2006
CSIR NML perform maintenance work on the primary standard mixtures for CO in nitrogen
December 2006 CSIR NML sent a second set of 5 µmol.mol-1 mixtures to NMi 1 Earlier formats of Word are also acceptable
4

VSLJanuary 2007 Measurement report received from NMi VSLJanuary 2007 Draft A reportApril 2007 Draft B reportMay to June 2007 Another round of cylinder exchange between NMi VSL and
CSIR NML
Measurement methods
Table 3: Summary of the measurement methods of the participantsLaboratory code
Calibration Traceability
Matrix standards
Measurement technique
CSIR NML ISO 6143 Own standards
Nitrogen GC-FID
NMi VSL ISO 6143 Own standards
Nitrogen NDIR
Degrees of equivalence [4]Usually all participants perform analyses on the same artefact and the key comparison reference value is calculated from the mean of the individual results. In the current comparison on gas mixtures, measurements were performed on individually prepared gas mixtures with (slightly) different concentrations. Since the coordinating laboratory prepared these mixtures using the same methods and materials, the individual gravimetric values can be adopted as reference values, despite the small differences that exist. There is a problem that these small differences are of the same order of the differences found between the national metrology institutes, and will thus influence the outcome of the key comparison if it would be operated with a single reference value.
In order to evaluate the differences between the participating national metrology institutes, the value is taken as the reference value for laboratory .The degree of equivalence of each laboratory with respect to the reference value is given by a pair of numbers:
(1)
and , its expanded uncertainty,
(2)
Computation of degrees of equivalence and associated uncertainties
The model of CCQM-K1 has been adapted for this bilateral comparison. Although the uncertainty on the assigned value comes close to the reported uncertainties from some of the participants, the model of CCQM-K1 can still be used.
The degree of equivalence between two laboratories is defined as
5

(3)The uncertainty in the degree of equivalence can be expressed as
(4)Whereby
(5)
Looking at the results, can generally not be neglected compared to . The degree of correlation between and has been assessed and lead to the following simplification
(6)
This simplification is the result of the establishment of (see equation (5)). From the stability data and the calibration of the equipment, it becomes clear that is a combined standard uncertainty from three main contributors: uncertainty of mixtures used, position of the “unknown(s)” on the curve, including lack of fit, and the repeatability of measurement. In formula, this expression reads as
(7)whereby denotes the contribution from the mixtures used for calibrating the equipment, denotes the contribution due to the fitting and interpolation procedure, and ur denotes the contribution due to repeatability of measurement. In this expression, is by far the dominant factor. It is also a factor, that is the same for all mixtures prepared for this comparison. As a result, the covariance between and can be approximated by
(8)Substitution of (5) and the approximation for the covariance in (8) leads then to (6).
6

Results
First comparison – March 2006
At the beginning of 2006 the CSIR NML prepared two mixtures of 5 µmol.mol-1 CO in nitrogen and sent it to NMi VSL for comparison. The results are presented in Table 4 with the following data:
amount of substance fraction, from preparation (10-6 mol.mol-1)uncertainty of (10-6 mol.mol-1)uncertainty from verification (10-6 mol.mol-1)uncertainty of reference value (10-6 mol.mol-1)result of laboratory (10-6 mol.mol-1)stated uncertainty of laboratory, at 95% level of confidence (10-6 mol.mol-1)stated coverage factordifference between laboratory result and reference value (10-6 mol.mol-1)assigned coverage factor for degrees of equivalenceexpanded uncertainty of difference, , at 95% level of confidence (10-6 mol.mol-1)
Table 4: A summary of the results for the first comparison.Laboratory code
Cylinder
NMi VSL MG3907 5.041 0.019 0.019 0.027 5.006 0.034 2 0.035 2 0.064 6664E 5.188 0.019 0.019 0.027 5.166 0.034 2 0.022 2 0.064
Figure 1: Degrees of equivalence for cylinder MG3907 and 6664E in the first comparison.
7
EUROMET 900: CO in nitrogenCylinder nr: MG3907
4.92
4.97
5.02
5.07
5.12
CSIR NML NMi VSL
Conc
entra
tion
(µm
ol/m
ol)
EUROMET 900: CO in nitrogenCylinder nr: 6664E
5.055.1
5.15
5.25.255.3
CSIR NML NMi VSL
Conc
entra
tion
(µm
ol/m
ol)
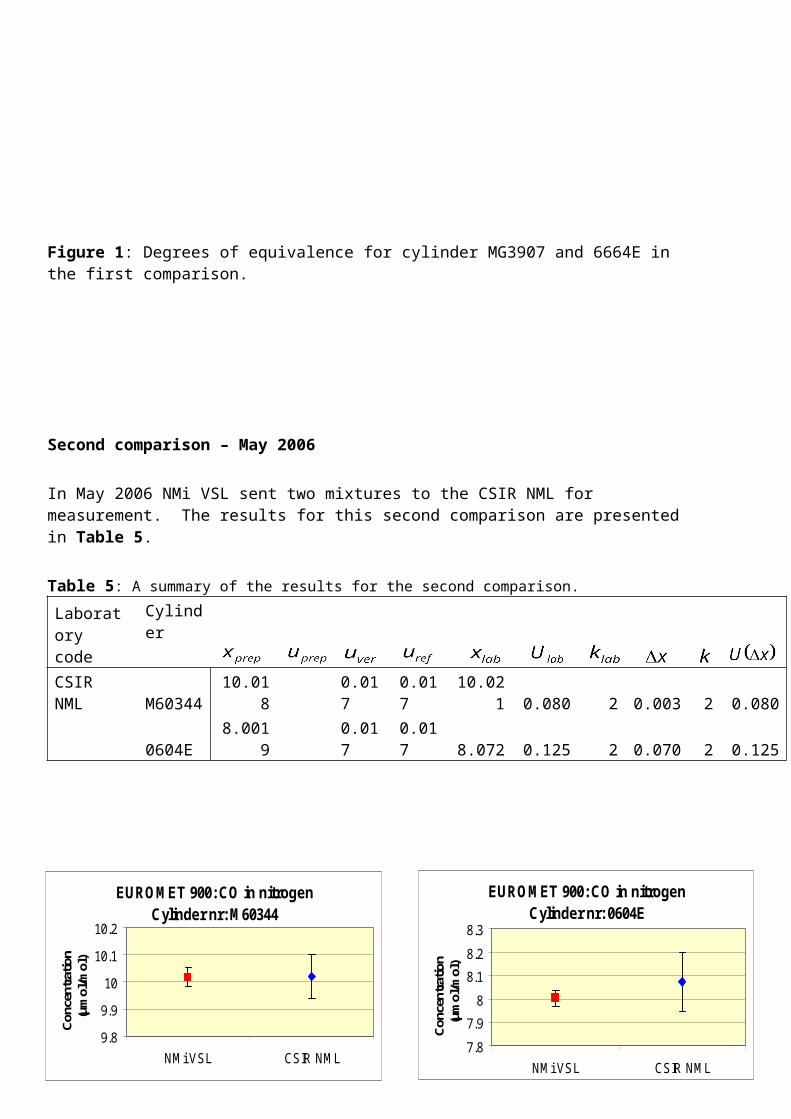
Second comparison – May 2006
In May 2006 NMi VSL sent two mixtures to the CSIR NML for measurement. The results for this second comparison are presented in Table 5.
Table 5: A summary of the results for the second comparison.Laboratory code
Cylinder
CSIR NML M60344 10.018 0.017 0.017 10.021 0.080 2 0.003 2 0.0800604E 8.0019 0.017 0.017 8.072 0.125 2 0.070 2 0.125
Figure 2: Degrees of equivalence for cylinder M60344 and 0604E in the second comparison.
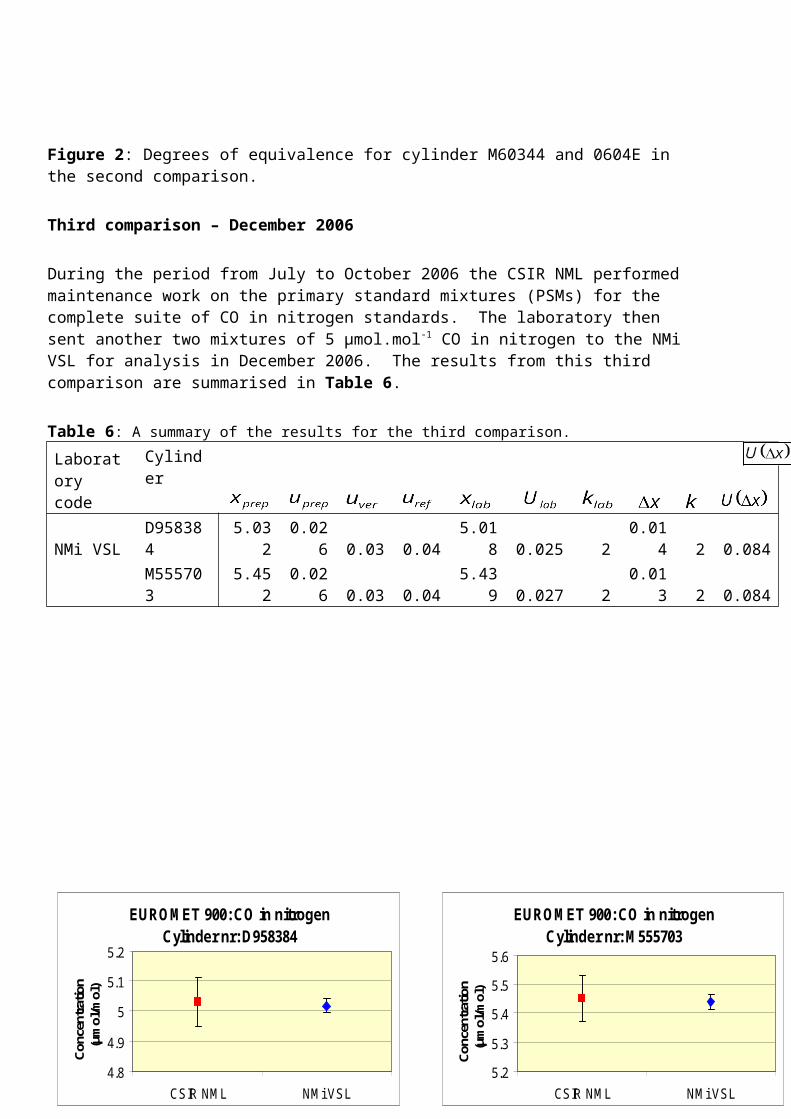
Third comparison – December 2006
During the period from July to October 2006 the CSIR NML performed maintenance work on the primary standard mixtures (PSMs) for the complete suite of CO in nitrogen standards. The laboratory then sent another two mixtures of 5 µmol.mol-1 CO in nitrogen to the NMi VSL for analysis in December 2006. The results from this third comparison are summarised in Table 6.
Table 6: A summary of the results for the third comparison.Laboratory code
Cylinder
NMi VSL D958384 5.032 0.026 0.03 0.04 5.018 0.025 2 0.014 2 0.084 M555703 5.452 0.026 0.03 0.04 5.439 0.027 2 0.013 2 0.084
8
EUROMET 900: CO in nitrogenCylinder nr: M60344
9.8
9.9
10
10.1
10.2
NMi VSL CSIR NML
Conc
entra
tion
(µm
ol/m
ol)
EUROMET 900: CO in nitrogenCylinder nr: 0604E
7.8
7.9
8
8.1
8.2
8.3
NMi VSL CSIR NML
Conc
entra
tion
(µm
ol/m
ol)

Figure 3: Degrees of equivalence for cylinder D958384 and M5555703 in the third comparison.
Further work – March 2007
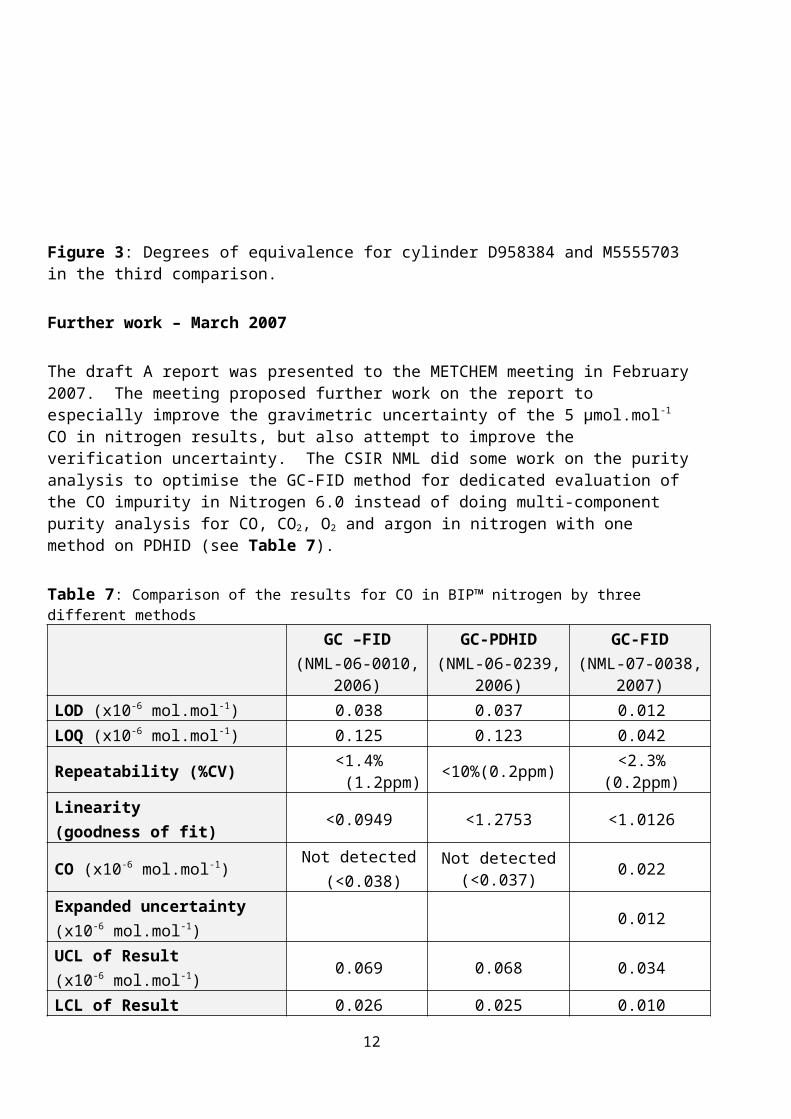
The draft A report was presented to the METCHEM meeting in February 2007. The meeting proposed further work on the report to especially improve the gravimetric uncertainty of the 5 µmol.mol-1 CO in nitrogen results, but also attempt to improve the verification uncertainty. The CSIR NML did some work on the purity analysis to optimise the GC-FID method for dedicated evaluation of the CO impurity in Nitrogen 6.0 instead of doing multi-component purity analysis for CO, CO2, O2 and argon in nitrogen with one method on PDHID (see Table 7).
Table 7: Comparison of the results for CO in BIP™ nitrogen by three different methodsGC –FID
(NML-06-0010, 2006)
GC-PDHID(NML-06-0239,
2006)
GC-FID(NML-07-0038,
2007)LOD (x10-6 mol.mol-1) 0.038 0.037 0.012LOQ (x10-6 mol.mol-1) 0.125 0.123 0.042Repeatability (%CV) <1.4% (1.2ppm) <10%(0.2ppm) <2.3% (0.2ppm)Linearity (goodness of fit) <0.0949 <1.2753 <1.0126
CO (x10-6 mol.mol-1)Not detected
(<0.038)Not detected
(<0.037) 0.022
Expanded uncertainty(x10-6 mol.mol-1)
0.012
9
EUROMET 900: CO in nitrogenCylinder nr: D958384
4.8
4.9
5
5.1
5.2
CSIR NML NMi VSL
Conc
entra
tion
(µm
ol/m
ol)
EUROMET 900: CO in nitrogenCylinder nr: M555703
5.2
5.3
5.4
5.5
5.6
CSIR NML NMi VSL
Conc
entra
tion
(µm
ol/m
ol)
UCL of Result (x10-6 mol.mol-1)
0.069 0.068 0.034
LCL of Result (x10-6 mol.mol-1)
0.026 0.025 0.010
The new gravimetric results with the new purity analysis data for CO in nitrogen 6.0 in comparison with the measured results by NMi VSL for cylinders D958384 and M555703 are summarised in Table 8.
Table 8: A comparison of the improved gravimetric results with the measurement results of NMi VSL during the third comparison.Laboratory code
Cylinder
NMi VSL D958384 5.029 0.006 0.025 0.026 5.018 0.025 2 0.011 2 0.029 M555703 5.449 0.006 0.025 0.026 5.439 0.027 2 0.010 2 0.030
The latest results for the measurements performed by the CSIR NML with the improved verification uncertainty for the 5 µmol.mol-1 CO in nitrogen mixtures are summarised in Table 9.
Table 9: A summary of the results for the most recent measurements of 5 µmol.mol-1 CO in nitrogen by the CSIR NML.Laboratory code
Cylinder
CSIR NML D958384 5.029 0.006 0.025 0.026 5.025 0.058 2 0.007 2 0.078 M555703 5.449 0.006 0.025 0.026 5.435 0.063 2 0.017 2 0.082
Figure 4: Latest results for cylinder D958384 and M5555703 for measurements performed by the CSIR NML.
Fourth comparison – May to August 2007
10
EUROMET 900: CO in nitrogenCylinder nr: D958384
4.8
4.9
5
5.1
5.2
CSIR NML NMi VSL CSIR NML CSIRNML(grav)
Con
cent
ratio
n (µ
mol
/mol
)
EUROMET 900: CO in nitrogenCylinder nr: M555703
5.2
5.3
5.4
5.5
5.6
CSIR NML NMi VSL CSIR NML CSIRNML(grav)
Con
cent
ratio
n (µ
mol
/mol
)
After the METCHEM and CCQM GAWG meetings in February and April 2007, respectively, the CSIR NML and NMi VSL decided to exchange another round of mixtures in an attempt to explain and eliminate the remaining bias between the two laboratories. In May 2007 the CSIR NML shipped a 4, 5 and 6 µmol.mol-1 CO in nitrogen mixture to the NMi VSL and received the measurement report at the end of June.
Table 10: A summary of the results for the analysis performed by NMi VSL on the CSIR NML mixtures during the fourth comparison.
cyl. # xprep uprep uver uref xlab Ulab Δx U(Δx) klabNMi VSL D958306 3.969 0.006 0.012 0.013416 3.962 0.020 0.007 0.033 2 D958363 4.996 0.006 0.009 0.010817 4.983 0.025 0.013 0.033 2 D954870 6.029 0.006 0.023 0.02377 6.027 0.030 0.002 0.056 2
Figure 5: Results of the 4, 5 and 6 µmol.mol-1 mixtures prepared by CSIR NML and analysed by NMi-VSL in June 2007.
During the same period the CSIR NML received a 4, 5 and 6 µmol.mol-1 CO in nitrogen mixture from the NMi-VSL and the measurement report was submitted to the NMi-VSL in August 2007.
Table 11: A summary of the results for the analysis performed by CSIR NML on the NMi VSL mixtures during the fourth comparison.
cyl. # xprep uprep uver uref xlab Ulab Δx U(Δx) klabCSIR NML 152995 5.9956 0.0028 0.012 0.012 5.985 0.024 -0.0106 0.027 2 153048 4.9986 0.0023 0.010 0.010 5.009 0.017 0.0104 0.020 2 153190 3.9976 0.0022 0.010 0.010 4.015 0.018 0.0174 0.021 2
11
EUROMET 900: CO in nitrogenCylinder nr: D958306
3.9
3.95
4
CSIR NML NMi VSL
Con
cent
ratio
n (µ
mol
/mol
)
EUROMET 900: CO in nitrogenCylinder nr: D958363
4.95
5
5.05
CSIR NML NMi VSL
Con
cent
ratio
n (µ
mol
/mol
)
EUROMET 900: CO in nitrogenCylinder nr: D954870
5.95
6
6.05
6.1
CSIR NML NMi VSLCon
cent
ratio
n (µ
mol
/mol
)
EUROMET 900: CO in nitrogenCylinder nr: 152995
5.9
5.95
6
6.05
NMi VSL CSIR NML
Con
cent
ratio
n (µ
mol
/mol
)
EUROMET 900: CO in nitrogenCylinder nr: 153048
4.95
5
5.05
NMi VSL CSIR NML
Con
cent
ratio
n (µ
mol
/mol
)
EUROMET 900: CO in nitrogenCylinder nr: 153190
3.95
4
4.05
NMi VSL CSIR NML
Con
cent
ratio
n (µ
mol
/mol
)
Figure 6: Results of the 4, 5 and 6 µmol.mol-1 mixtures prepared by NMi-VSL and analysed by CSIR NML in June 2007.
Discussion of results
In the first comparison there was an apparent bias of approximately 20 ppb between the two laboratories where the CSIR NML result was higher for both cylinders. The uncertainties reported by the CSIR NML were also approximately double the uncertainties reported by the NMi-VSL. The amount of CO in the nitrogen balance gas for cylinders MG3907 and 6664E was 32 ppb.
In the second comparison the CSIR NML experienced some problems with the calibration of the GC-FID results. Closer inspection of the chromatogram for the 8 µmol.mol-1 CO in nitrogen mixture (Cylinder nr. 0604E) revealed that a small contamination peak of methane co-eluted with the CO peak, which resulted in a bias the measurement results. The measurement method on the GC-FID was adopted to resolve the methane peak from the CO peak and the bias was eliminated. However, for the effective resolution of the CO and methane peaks the temperature of the column oven was reduced in the GC method, which resulted in a broadening of the CO peak. This resulted in deterioration in the precision of the method and the uncertainties of the measurement results increased.
12

Figure 7: Chromatogram of the methane peak resolved from the CO peak in cylinder nr. 0604E
The CSIR NML embarked on an exercise to reduce the bias between the two laboratories by performing maintenance work on the primary standard mixtures for CO in nitrogen with improved purity analysis of the nitrogen balance gas. The amount of CO in the nitrogen balance gas used for cylinders D958384 and M 555703 was 24 ppb. The actual CO in the nitrogen balance gas was still below the detection limit of the GC-PDHID method. The next step that will be investigated in an attempt to quantify the amount of CO in the nitrogen gas more accurately is to make use of packed columns that has a larger sample capacity than capillary columns.
The results from the third comparison (Figure 3) indicate a good comparison between the measurement results for the two mixtures, but the uncertainties reported by the CSIR NML is still significantly larger than those of the NMi VSL.The results in Table 7 summarises the improvements the CSIR NML has made in the purity analysis of CO in nitrogen 6.0. Figure 4 shows the effect of the improved purity analysis on the comparison between the NMi VSL measurement and the gravimetric value of the CSIR NML. Due to the reduction in the effect of atmospheric pressure on the GC results the verification uncertainties have also improved.
Conclusions
The CSIR NML has purchased an NDIR monitor for the measurement of CO over the concentration range of 1 to 100 µmol/mol, but the new instrument arrived in the laboratory in April 2007 and is not yet fully commissioned. It is expected that analysis of the CO in nitrogen by NDIR will reduce the uncertainty of the results by 50%. In the meantime the
13

laboratory is continuing to work on the GC-FID method in an attempt to improve the repeatability.
Further work on the purity analysis of CO in nitrogen has resulted in a reduction in the gravimetric uncertainty of the 5 µmol.mol-1 CO in nitrogen of the CSIR NML and a slight reduction in the bias between the gravimetric measurement result of the CSIR NML and the analytical measurement result of the NMi VSL. The verification uncertainty of the CSIR NML has also improved.
During the fourth comparison between the CSIR NML and the NMi VSL it is shown with the uncertainties of the analytical capabilities of the two laboratories that they are now comparable.
References[1] Alink A., The first key comparison on Primary Standard gas Mixtures, Metrologia 37
(2000), pp. 35-49[2] International Organization for Standardization, “ISO 6142 -- Gas analysis --
Preparation of calibration gas mixtures -- Gravimetric method”, ISO, Geneva (CH), 2001
[3] International Organization for Standardization, “ISO 6143 -- Gas analysis -- Comparison methods for determining and checking the composition of calibration gas mixtures”, ISO, Geneva (CH), 2001
[4] Van der Veen A.M.H., Cox M.G., “Degrees of equivalence across key comparisons in gas analysis”, Metrologia 40 (2003), pp. 18-23
CoordinatorAngelique BothaCSIR National Metrology Laboratory (CSIR NML)CSIR, Building 5Meiring Naudé RoadBrummeria, PRETORIA, 0001South AfricaTel: +27 12 841 3800Fax: +27 12 841 2131e-mail: [email protected] referenceEUROMET 900Completion dateIn progress
14

Appendix
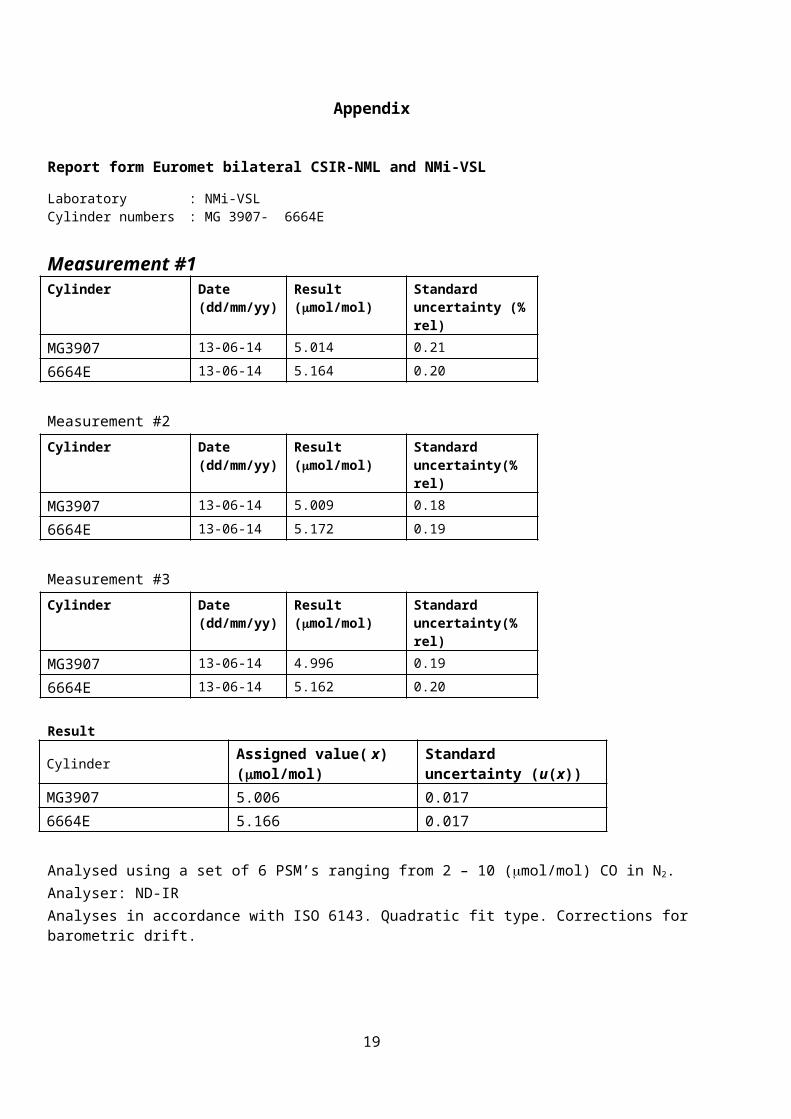
Report form Euromet bilateral CSIR-NML and NMi-VSL
Laboratory : NMi-VSLCylinder numbers : MG 3907- 6664E
Measurement #1Cylinder Date
(dd/mm/yy)Result(mol/mol)
Standard uncertainty (% rel)
MG3907 13-06-14 5.014 0.21
6664E 13-06-14 5.164 0.20
Measurement #2 Cylinder Date
(dd/mm/yy)Result(mol/mol)
Standard uncertainty(% rel)
MG3907 13-06-14 5.009 0.18
6664E 13-06-14 5.172 0.19
Measurement #3 Cylinder Date
(dd/mm/yy)Result(mol/mol)
Standard uncertainty(% rel)
MG3907 13-06-14 4.996 0.19
6664E 13-06-14 5.162 0.20
Result
Cylinder Assigned value( x) (mol/mol)
Standard uncertainty (u(x))
MG3907 5.006 0.0176664E 5.166 0.017
Analysed using a set of 6 PSM’s ranging from 2 – 10 (mol/mol) CO in N2. Analyser: ND-IR Analyses in accordance with ISO 6143. Quadratic fit type. Corrections for barometric drift.
15

Report Form EUROMET 900 Carbon monoxide in nitrogenLaboratory name: NMLCylinder number: M60344
Measurement #1 Component Date
(dd/mm/yy)Result(mol/mol)
Standard deviation(% relative)
number of replicates
CO 05/05/2006 10,031 0,27 15
Measurement #2 Component Date
(dd/mm/yy)Result(mol/mol)
Standard deviation(% relative)
number of replicates
CO 22/05/2006 10,043 0,22 15
Measurement #32 Component Date
(dd/mm/yy)Result(mol/mol)
Standard deviation(% relative)
number of replicates
CO 23/05/2006 9,9877 0,33 15
ResultsComponent Result
(mol/mol)Expanded Uncertainty
Coverage factor3
CO 10,021 0,080 2
2 If more than three measurements are taken, please copy and insert a table of the appropriate format as necessary3 The coverage factor shall be based on approximately 95% confidence.
16
Report Form EUROMET 900 Carbon monoxide in nitrogenLaboratory name: NMLCylinder number: 0604E
Measurement #1 Component Date
(dd/mm/yy)Result(mol/mol)
Standard deviation(% relative)
number of replicates
CO 05/05/2006 8,1373 0,40 15
Measurement #2 Component Date
(dd/mm/yy)Result(mol/mol)
Standard deviation(% relative)
number of replicates
CO 22/05/2006 8,0427 0,30 15
Measurement #34 Component Date
(dd/mm/yy)Result(mol/mol)
Standard deviation(% relative)
number of replicates
CO 23/05/2006 8,0373 0,32 15
ResultsComponent Result
(mol/mol)Expanded Uncertainty
Coverage factor5
CO 8,072 0,125 2
4 If more than three measurements are taken, please copy and insert a table of the appropriate format as necessary5 The coverage factor shall be based on approximately 95% confidence.
17
Report Form Euromet project 900 Carbon monoxide in nitrogenLaboratory name: NMi-VSL
Cylinder number: D 95 8384
Measurement #1 Component Date
(dd/mm/yy)
Result(mol/mol)
Standard deviation(% relative)
number of replicates
CO 19/12/06 0,000005015
0,23 4*30
Measurement #2 Component Date
(dd/mm/yy)
Result(mol/mol)
Standard deviation(% relative)
number of replicates
CO 21/12/06 0,000005021
0,21 3 * 30
ResultsComponent Result
(mol/mol)Expanded
Uncertainty (% relative)
Coverage factor6
CO 0,000005018 0,5 2
Cylinder number: M555703
Measurement #1 Component Date
(dd/mm/yy)
Result(mol/mol)
Standard deviation(% relative)
number of replicates
CO 19/12/06 0,000005445
0,21 4*30
Measurement #2 Component Date
(dd/mm/yy)
Result(mol/mol)
Standard deviation(% relative)
number of replicates
CO 21/12/06 0,000005433
0,18 3 * 30
ResultsComponent Result Expanded Coverage factor7
6 The coverage factor shall be based on approximately 95% confidence.
7 The coverage factor shall be based on approximately 95% confidence.
18
(mol/mol) Uncertainty (% relative)
CO 0,000005439 0,5 2
Reference Method:
For the determination of Carbon monoxide (CO):ISO 6143;2001 was used and the generalized distance regression (GDR) method was applied using 7 NMi PSM’s and a cubic regression model. Instrument Calibration:The following NMi-VSL PSMs were used to calibrate the ND-IR analyser (ABB URAS 14). All 7 PSMs contained CO in a matrix of nitrogen similar to the sample mixture.
Cylinder No Gravimetric composition
Standard uncertainty
VSL205201 0,9998 · 10-6 mol/mol
1,82 · 10-9 mol/mol
VSL305260 2,0012 · 10-6 mol/mol
1,85 · 10-9 mol/mol
VSL205149 3,9915 · 10-6 mol/mol
1,92 · 10-9 mol/mol
VSL308613 5,0013 · 10-6 mol/mol
2,84 · 10-9 mol/mol
VSL300990 6,0014 · 10-6 mol/mol
2,17 · 10-9 mol/mol
VSL308615 7,9997 · 10-6 mol/mol
3,03 · 10-9 mol/mol
VSL238362 9,9971 · 10-6 mol/mol
2,50 · 10-9 mol/mol
Sample handling:Each cylinder was equipped with a stainless steel pressure regulator that was adequately purged.A flow of approx. 350 mL/min was flushed for three minutes through the ND-IR analyser before the readings were taken.
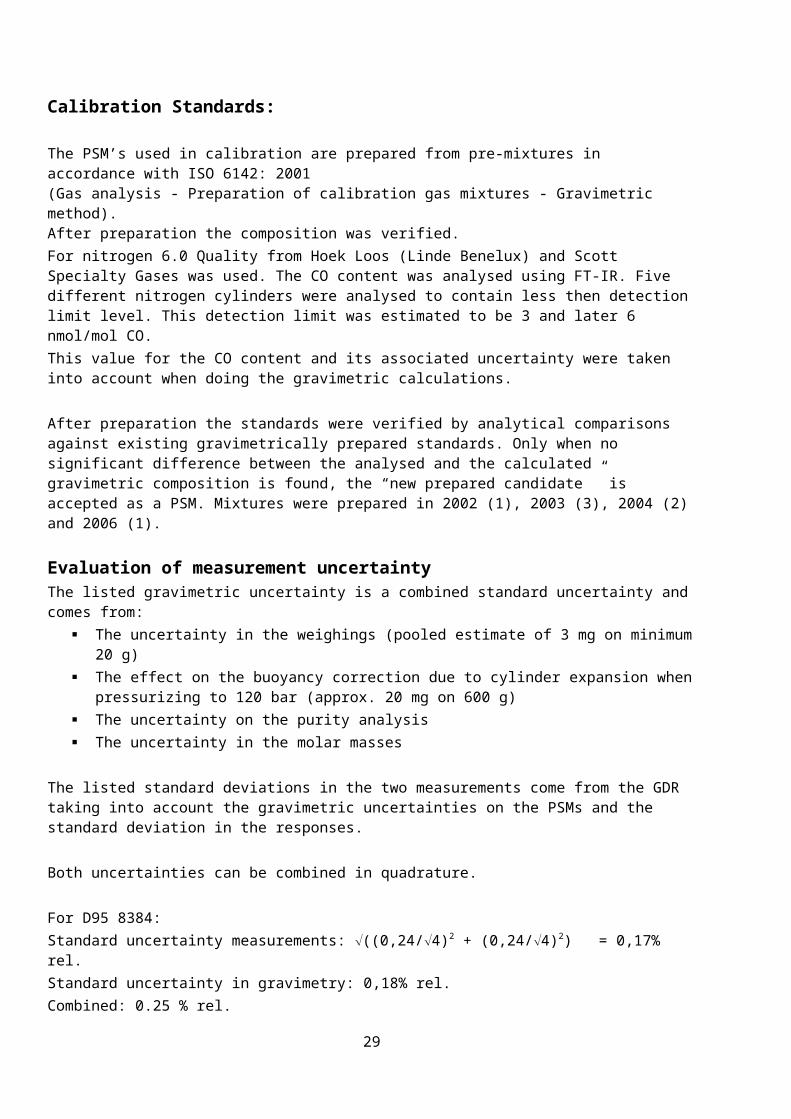
Calibration Standards:
The PSM’s used in calibration are prepared from pre-mixtures in accordance with ISO 6142: 2001(Gas analysis - Preparation of calibration gas mixtures - Gravimetric method). After preparation the composition was verified. For nitrogen 6.0 Quality from Hoek Loos (Linde) and Scott Specialty Gases was used. The CO content was analysed using FT-IR. Five different nitrogen cylinders were
19

analysed to contain less then detection limit level. This detection limit was estimated to be 3 and later 6 nmol/mol CO.This value for the CO content and its associated uncertainty were taken into account when doing the gravimetric calculations.
After preparation the standards were verified by analytical comparisons against existing gravimetrically prepared standards. Only when no significant difference between the analysed and the calculated gravimetric composition is found, the “new prepared candidate ” is accepted as a PSM. Mixtures were prepared in 2002 (1), 2003 (3), 2004 (2) and 2006 (1). Evaluation of measurement uncertainty
The listed gravimetric uncertainty is a combined standard uncertainty and comes from: The uncertainty in the weighings (pooled estimate of 3 mg on minimum 20 g) The effect on the buoyancy correction due to cylinder expansion when
pressurizing to 120 bar (approx. 20 mg on 600 g) The uncertainty on the purity analysis The uncertainty in the molar masses
The listed standard deviations in the two measurements come from the GDR taking into account the gravimetric uncertainties on the PSMs and the standard deviation in the responses.
Both uncertainties can be combined in quadrature.
For D958384:Standard uncertainty measurements: ((0,23/4)2 + (0,21/3)2) = 0,17% rel.Standard uncertainty in gravimetry: 0,18% rel.Combined: 0.25 % rel.Expanded: 0.5 % rel. (k=2)
For M555703:Standard uncertainty measurements: ((0,21/4)2 + (0,18/3)2) = 0,15% rel.Standard uncertainty in gravimetry: 0,18% rel.Combined: 0.23 % rel.Expanded: 0.5 % rel. (k=2)
20

Report Form Euromet project 900 Carbon monoxide in nitrogenLaboratory name: NMi-VSLCylinder number: D 95 8306
Measurement #1 Component Date
(dd/mm/yy)Result(mol/mol)
Standard deviation(% relative)
number of replicates
CO 07/06/2007 0,000003962 0,24 4
Measurement #2 Component Date
(dd/mm/yy)Result(mol/mol)
Standard deviation(% relative)
number of replicates
CO 13/06/2007 0,000003960 0,24 4
ResultsComponent Result
(mol/mol)Expanded
Uncertainty (% relative)
Coverage factor8
CO 0,000003961 0,5 2
Cylinder number: D 95 8363
Measurement #1 Component Date
(dd/mm/yy)Result(mol/mol)
Standard deviation(% relative)
number of replicates
CO 07/06/2007 0,000004984 0,20 4
Measurement #2 Component Date
(dd/mm/yy)Result(mol/mol)
Standard deviation(% relative)
number of replicates
CO 13/06/2007 0,000004982 0,17 4 8 The coverage factor shall be based on approximately 95% confidence.
21

ResultsComponent Result
(mol/mol)Expanded
Uncertainty (% relative)
Coverage factor9
CO 0,000004983 0,5 2Cylinder number: D 95 4870
Measurement #1 Component Date
(dd/mm/yy)Result(mol/mol)
Standard deviation(% relative)
number of replicates
CO 07/06/2007 0,000006027 0,22 4
Measurement #2 Component Date
(dd/mm/yy)Result(mol/mol)
Standard deviation(% relative)
number of replicates
CO 13/06/2007 0,000006027 0,10 4
ResultsComponent Result
(mol/mol)Expanded
Uncertainty (% relative)
Coverage factor10
CO 0,000006027 0,5 2
9 The coverage factor shall be based on approximately 95% confidence.
10 The coverage factor shall be based on approximately 95% confidence.
22

Reference Method:
For the determination of Carbon monoxide (CO):ISO 6143;2001 was used and the generalized distance regression (GDR) method was applied using 6 NMi PSM’s and a quadratric regression model. Instrument Calibration:The following NMi-VSL PSMs were used to calibrate the ND-IR analyser (ABB URAS 14). All 6 PSMs contained CO in a matrix of nitrogen similar to the sample mixture.
Cylinder No Gravimetric composition
Standard uncertainty
VSL305260 2,0012 · 10-6 mol/mol
1,85 · 10-9 mol/mol
VSL205149 3,9915 · 10-6 mol/mol
1,92 · 10-9 mol/mol
VSL308613 5,0013 · 10-6 mol/mol
2,84 · 10-9 mol/mol
VSL300990 6,0014 · 10-6 mol/mol
2,17 · 10-9 mol/mol
VSL308615 7,9997 · 10-6 mol/mol
3,03 · 10-9 mol/mol
VSL238362 9,9971 · 10-6 mol/mol
2,50 · 10-9 mol/mol
Sample handling:Each cylinder was equipped with a stainless steel pressure regulator that was adequately purged.A flow of approx. 350 mL/min was flushed for five minutes through the ND-IR analyser before the readings were taken. Calibration Standards:
The PSM’s used in calibration are prepared from pre-mixtures in accordance with ISO 6142: 2001(Gas analysis - Preparation of calibration gas mixtures - Gravimetric method). After preparation the composition was verified. For nitrogen 6.0 Quality from Hoek Loos (Linde Benelux) and Scott Specialty Gases was used. The CO content was analysed using FT-IR. Five different nitrogen cylinders were
23

analysed to contain less then detection limit level. This detection limit was estimated to be 3 and later 6 nmol/mol CO.This value for the CO content and its associated uncertainty were taken into account when doing the gravimetric calculations.
After preparation the standards were verified by analytical comparisons against existing gravimetrically prepared standards. Only when no significant difference between the analysed and the calculated gravimetric composition is found, the “new prepared candidate ” is accepted as a PSM. Mixtures were prepared in 2002 (1), 2003 (3), 2004 (2) and 2006 (1).
Evaluation of measurement uncertaintyThe listed gravimetric uncertainty is a combined standard uncertainty and comes from:
The uncertainty in the weighings (pooled estimate of 3 mg on minimum 20 g) The effect on the buoyancy correction due to cylinder expansion when
pressurizing to 120 bar (approx. 20 mg on 600 g) The uncertainty on the purity analysis The uncertainty in the molar masses
The listed standard deviations in the two measurements come from the GDR taking into account the gravimetric uncertainties on the PSMs and the standard deviation in the responses.
Both uncertainties can be combined in quadrature.
For D95 8384:Standard uncertainty measurements: ((0,24/4)2 + (0,24/4)2) = 0,17% rel.Standard uncertainty in gravimetry: 0,18% rel.Combined: 0.25 % rel.Expanded: 0.5 % rel. (k=2)
For D95 8363:Standard uncertainty measurements: ((0,20/4)2 + (0,17/4)2) = 0,13% rel.Standard uncertainty in gravimetry: 0,18% rel.Combined: 0.23 % rel.Expanded: 0.5 % rel. (k=2)
For D19 4870:Standard uncertainty measurements: ((0,22/4)2 + (0,10/4)2) = 0,12% rel.Standard uncertainty in gravimetry: 0,18% rel.Combined: 0.22 % rel.Expanded: 0.5 % rel. (k=2)
24

Report Form CCQM-K51 Carbon monoxide in nitrogenLaboratory name: NMLCylinder number: NMi – VSL 152995
Measurement #1 Component Date
(dd/mm/yy)Result(mol/mol)
Standard deviation(% relative)
number of replicates
CO 04/06/2007 5,973636 0,05 10
Measurement #2 Component Date
(dd/mm/yy)Result(mol/mol)
Standard deviation(% relative)
number of replicates
CO 05/06/2007 5,973221 0,07 10
Measurement #311 Component Date
(dd/mm/yy)Result(mol/mol)
Standard deviation(% relative)
number of replicates
CO 06/06/2007 6,006877 0,06 10
ResultsComponent Result
(mol/mol)Expanded Uncertainty
Coverage factor12
CO 5,985 0,024 2
11 If more than three measurements are taken, please copy and insert a table of the appropriate format as necessary12 The coverage factor shall be based on approximately 95% confidence.
25

Report Form EUROMET 900 Carbon monoxide in nitrogenLaboratory name: NMISACylinder number: NMi-VSL 153048
Measurement #1 Component Date
(dd/mm/yy)Result(mol/mol)
Standard deviation(% relative)
number of replicates
CO 04/06/2007 5,005869 0,05 10
Measurement #2 Component Date
(dd/mm/yy)Result(mol/mol)
Standard deviation(% relative)
number of replicates
CO 05/06/2007 4,998170 0,10 10
Measurement #313 Component Date
(dd/mm/yy)Result(mol/mol)
Standard deviation(% relative)
number of replicates
CO 06/06/2007 5,023040 0,07 10
ResultsComponent Result
(mol/mol)Expanded Uncertainty
Coverage factor14
CO 5,009 0,017 2
13 If more than three measurements are taken, please copy and insert a table of the appropriate format as necessary14 The coverage factor shall be based on approximately 95% confidence.
26

Report Form EUROMET 900 Carbon monoxide in nitrogenLaboratory name: NMISACylinder number: NMi-VSL 153190
Measurement #1 Component Date
(dd/mm/yy)Result(mol/mol)
Standard deviation(% relative)
number of replicates
CO 04/06/2007 4,027588 0,10 10
Measurement #2 Component Date
(dd/mm/yy)Result(mol/mol)
Standard deviation(% relative)
number of replicates
CO 05/06/2007 3,999380 0,10 10
Measurement #315 Component Date
(dd/mm/yy)Result(mol/mol)
Standard deviation(% relative)
number of replicates
CO 06/06/2007 4,016804 0,07 10
ResultsComponent Result
(mol/mol)Expanded Uncertainty
Coverage factor16
CO 4,015 0,018 2
15 If more than three measurements are taken, please copy and insert a table of the appropriate format as necessary16 The coverage factor shall be based on approximately 95% confidence.
27

Details of the measurement method used:Gas Chromatography with flame ionisation detection after conversion of the CO peak to methane through a methaniser. The column used was a Molesieve 13X packed column, 60/80 packing size, length of 1,2m. Sample size was 2mℓ.
Detailed uncertainty budget:Please include a list of the uncertainty contributions, the estimate of the standard uncertainty, probability distributions, sensitivity coefficients, etc.
The intermediate reproducibility uncertainty was calculated as below in Equation 1
(1)
Table 1: Verified concentrations of NMi VSL Cylinders 152995, 153048 and 153190.
Cylinder NMi VSL 152995Verified [CO]
Cylinder NMi VSL 152995Verificationuncertainty
Cylinder NMi VSL 153048Verified [CO]
Cylinder NMi VSL 153048Verificationuncertainty
Day 1 5,973636 0,0027127 5,005869 0,0026179Day 2 5,973221 0,0040542 4,998170 0,0047525Day 3 6,006877 0,0033295 5,023040 0,0036697
Average 5,984578 5,009026Standard deviation
0,0193126 0,0127321
Reproducibility uncertainty
0,011150 0,007351
Cylinder NMi VSL 153190Verified [CO]
Cylinder Verificationuncertainty
Day 1 4,027588 0,0041342Day 2 3,999380 0,0038046Day 3 4,016804 0,0028855
Average 4,014591Standard deviation
0,0142337
Reproducibility uncertainty
0,008218
28
The verification uncertainties from Table 1 were combined as in Equation 2, where the sensitivities are all equal to 1 since uncertainties in the same units are being combined.
(2)
The reproducibility uncertainty and the combined standard verification uncertainty are combined as shown in Equation 3. The sensitivities are equal to 1 for the individual uncertainties since they are all in the same unit (µmol.mol-1).
(3)
Table 2: Calculation of combined uncertainty
Cylinder NMi VSL 152995
Cylinder NMi VSL 153048
Cylinder NMi VSL 153190
0,0034098 0,0037818 0,00364660,0111501 0,0073509 0,00821780,0116599 0,0082666 0,0089905
The effective degrees of freedom ( ) can be evaluated by the Welch-Satterthwaite formula as shown in Equation 3, where is the combined standard uncertainty,
is the contribution from each uncertainty component.
(3)
The CSIR NML has chosen a level of confidence of 95,45% for all measurements made. From t-distribution tables, the appropriate value of (the factor by which the uncertainty is multiplied to ensure a 95,45% degree of certainty in the final result) for
is chosen and the standard uncertainty converted to an expanded uncertainty for a 95,45% level of confidence.
The degrees of freedom for each day’s calculation is , since the degrees of freedom for the standard concentrations are and 10 measurements were made for each concentration standard. The degrees of freedom for the short term stability uncertainty is 2 because this uncertainty was calculated using the measurements from 3 days. Using the values calculated in Table 2, the effective degrees of freedom, , evaluates to and the corresponding value for is 2 for a 95,45% confidence level. The result and the expanded uncertainty are shown in Table 3.
29

Table 3: Calculation of expanded uncertainty
Cylinder NMi VSL 152995
Cylinder NMi VSL 153048
Cylinder NMi VSL 153190
0,0116599 0,0082666 0,00899052 2 20,024 0,017 0,018
Verified concentration (µmol.mol-1) 5,985 5,009 4,015% relative expanded uncertainty 0,39 0,33 0,45
30