International Collaborative Study on Evaluation of an In ... · Ref. Biologicals 40 (2012) 456-465...
19
International collaborative study on evaluation of an in vitro assay system as an alternative to current histamine sensitization test for acellular pertussis vaccines Ref. Biologicals 40 (2012) 456-465
Transcript of International Collaborative Study on Evaluation of an In ... · Ref. Biologicals 40 (2012) 456-465...
International collaborative study on evaluation
of an in vitro assay system as an alternative to
current histamine sensitization test for
acellular pertussis vaccines
Ref. Biologicals 40 (2012) 456-465
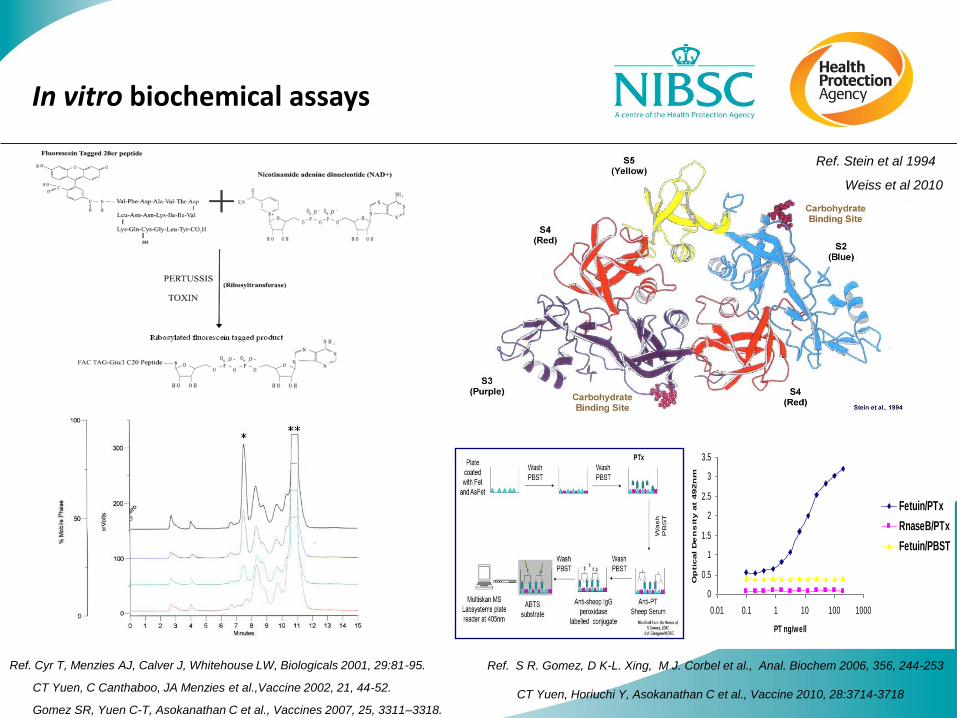
In vitro biochemical assays
0
0.5
1
1.5
2
2.5
3
3.5
0.01 0.1 1 10 100 1000
PT ng/well
Op
tic
al D
en
sit
y a
t 4
92n
m
Fetuin/PTx
RnaseB/PTx
Fetuin/PBST
Ref. Cyr T, Menzies AJ, Calver J, Whitehouse LW, Biologicals 2001, 29:81-95.
CT Yuen, C Canthaboo, JA Menzies et al.,Vaccine 2002, 21, 44-52.
Gomez SR, Yuen C-T, Asokanathan C et al., Vaccines 2007, 25, 3311–3318.
Ref. S R. Gomez, D K-L. Xing, M J. Corbel et al., Anal. Biochem 2006, 356, 244-253
CT Yuen, Horiuchi Y, Asokanathan C et al., Vaccine 2010, 28:3714-3718
Ref. Stein et al 1994
Weiss et al 2010

Aims of the study
• To assess the methodology transferability of the enzyme coupled-
HPLC (E-HPLC) and carbohydrate-binding assays
• To further assess the suitability of the in vitro assay system for three
different types of ACV products
• To further evaluate the relationship between the in vivo activity by
HIST (temperature reduction assay) and the enzymatic and binding
activities in the in vitro assay system

Participants
Laboratories that are currently involved in quality control test of
acellular pertussis containing vaccines by HIST and are willing to
perform the in vitro assays were invited
16 participants, from 9 countries: EU (5), North American (3*); Asia(3)
including:
• National Control Laboratories (9*)
• Vaccine manufacturers (8#)
Each laboratories is identified by a randomly assigned code number from 1 to 16 in
all analysis to maintain confidentiality
* Two participants were from the same organisation, but different department # Laboratory 15 did not submit result due to staff shortage problem

Sample information
Vaccine sample Code
Description
Samples 1, 6, 8
A purified acellular pertussis vaccine (three-component), detoxified with glutaraldehyde and formaldehyde, in combination with diphtheria and tetanus.
Samples 2, 4, 7
A purified acellular pertussis vaccine (five-component), detoxified with glutaraldehyde, in combination with diphtheria, tetanus, inactivated poliomyelitis and Haemophilus influenza type b conjugate vaccine
Samples 3, 5, 9
A co-purified acellular pertussis vaccine detoxified with formaldehyde in combination with diphtheria and tetanus.
5

Critical reagents
– Pertussis toxin reference preparation
(NIBSC code 90/518) for HIST
(temperature) assay
– Pertussis toxin antigen preparation for
in vitro assays
– Anti-PT sheep serum preparation
(NIBSC code 97/572)
– PT ADP-ribosyltransferase substrate
working solution
Documents
- Sample/document List
- Study Design
- Instruction for use (IFU) (5)
- Protocols:
i) E-HPLC assay
ii) Carbohydrate Binding assay
- Reporting sheets:
i) E-HPLC
ii)Binding Assay
iii)HIST Temperature
Other materials included in the study

Study Design Outline-1
In vitro assays:
Primary Step: In vitro assay system set up:
• The detailed protocols for the E-HPLC assay and the carbohydrate binding assay provided
• Critical reagents provided, including pertussis toxin reference, substrate and detection antibody
• Participants are encouraged :
– First to use the pertussis toxin reference only and other critical reagents to set up their assay system
– To get hands on experience of the assay system
– To set up preliminary in-house validity criteria before starting analysis of the vaccine samples
provided

Study Design Outline-2
In vitro assays:
Second step:
Analysis of the 9 vaccine samples using the in vitro assay system
established in their laboratory
For each vaccine sample
– A minimum of three independent assays of enzyme-HPLC assay
– A minimum of three independent assays of carbohydrate binding assay
– To use the pertussis toxin reference, substrate and detection antibody
supplied by the study

Study Design Outline-3
HIST - measuring reduction in body temperature after histamine
challenge
• Laboratories who currently perform the HIST temperature reduction
measurement assays
• The PTx activities expressed relative to the PTx reference (90/518)
– Quantitative values
- Two independent HIST assays on the vaccine preparations
– use their own procedure, reagents and calculation methods, and use assay runs that
meet internal validity criteria.

Results returned by participants
Laboratories E-HPLC Carbohydrate binding HIST
(temperature reduction assay)
14 15 11
All 3 assays E-HPLC + binding HIST HIST + binding
9 5 1 1
In which
Assays E-HPLC Carbohydrate binding HIST
(temperature reduction assay)
42* 46* 28
* In addition, three laboratories also submitted data using their in-house in vitro assay protocols
Laboratories E-HPLC Carbohydrate binding HIST
(temperature reduction assay)
14 15 11

Statistical methods
• Raw data were returned to NIBSC for analysis, to ensure as far as possible consistent calculation of results.
• ADP-ribosyltransferase activity (E-unit) and binding activity (B-unit) in vaccine samples
were calculated from the standard curve, constructed from the results using PTx reference
preparation (90/518). For all assays the data for each vaccine preparation were analysed
separately against the reference preparation.
• Homogeneity of the results for each sample was examined. Data which showed out of
homogeneity range were defined as outliers which were eliminated from the analysis. – Ref. Sokal, R.R, Rohlf F. J. Biometry, 3rd ed. W. H. Freeman and Co., New York. 1995.
• The HIST activity in the test vaccine was calculated in comparison with that of the
reference toxin groups. Relative potency estimates were calculated by parallel line analysis
of log transformed response against log dose using the linear section of the dose-response
curve and expressed as IU/dose.
11
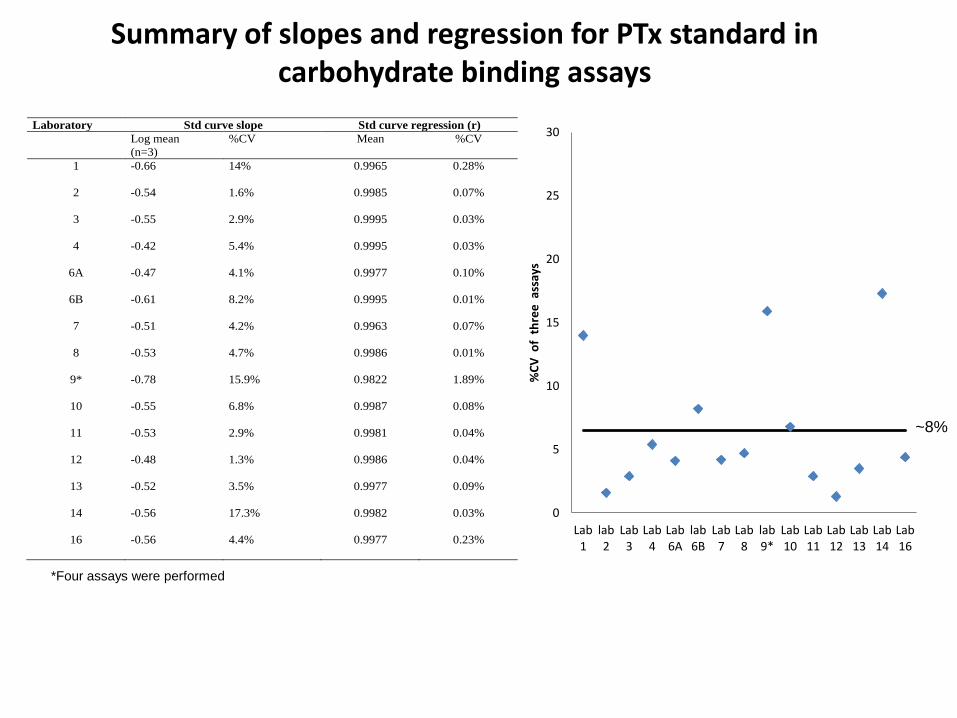
Summary of slopes and regression for PTx standard in carbohydrate binding assays
Laboratory Std curve slope Std curve regression (r)
Log mean
(n=3)
%CV Mean %CV
1 -0.66 14% 0.9965 0.28%
2 -0.54 1.6% 0.9985 0.07%
3 -0.55 2.9% 0.9995 0.03%
4 -0.42 5.4% 0.9995 0.03%
6A -0.47 4.1% 0.9977 0.10%
6B -0.61 8.2% 0.9995 0.01%
7 -0.51 4.2% 0.9963 0.07%
8 -0.53 4.7% 0.9986 0.01%
9* -0.78 15.9% 0.9822 1.89%
10 -0.55 6.8% 0.9987 0.08%
11 -0.53 2.9% 0.9981 0.04%
12 -0.48 1.3% 0.9986 0.04%
13 -0.52 3.5% 0.9977 0.09%
14 -0.56 17.3% 0.9982 0.03%
16 -0.56
4.4% 0.9977 0.23%
0
5
10
15
20
25
30
Lab 1
lab 2
Lab 3
Lab 4
Lab 6A
lab 6B
Lab 7
Lab 8
lab 9*
Lab 10
Lab 11
Lab 12
Lab 13
Lab 14
Lab 16
%C
V o
f t
hre
e a
ssay
s
*Four assays were performed
~8%

-3 -2.5
-2 -1.5
-1 -0.5
0 0.5
1 1.5
2 2.5
Lab
1
Lab
2
Lab
3
Lab
4
Lab
6a
Lab
6b
Lab
7
Lab
8
Lab
9
Lab
10
Lab
11
Lab
12
Lab
13
Lab
14
Log
BU
/do
se
Sample 1
-3 -2.5
-2 -1.5
-1 -0.5
0 0.5
1 1.5
2 2.5
Lab
1
Lab
2
Lab
3
Lab
4
Lab
6a
Lab
6b
Lab
7
Lab
8
Lab
9
Lab
10
Lab
11
Lab
12
Lab
13
Lab
14
Log
BU
/do
se
Sample 2
-3 -2.5
-2 -1.5
-1 -0.5
0 0.5
1 1.5
2 2.5
Lab
1
Lab
2
Lab
3
Lab
4
Lab
6a
Lab
6b
Lab
7
Lab
8
Lab
9
Lab
10
Lab
11
Lab
12
Lab
13
Lab
14
Log
BU
/do
se
Sample 3
-3 -2.5
-2 -1.5
-1 -0.5
0 0.5
1 1.5
2 2.5
Lab
1
Lab
2
Lab
3
Lab
4
Lab
6a
Lab
6b
Lab
7
Lab
8
Lab
9
Lab
10
Lab
11
Lab
12
Lab
13
Lab
14
Sample 4
-3 -2.5
-2 -1.5
-1 -0.5
0 0.5
1 1.5
2 2.5
Lab
1
Lab
2
Lab
3
Lab
4
Lab
6a
Lab
6b
Lab
7
Lab
8
Lab
9
Lab
10
Lab
11
Lab
12
Lab
13
Lab
14
Lab
16
Sample 5
-3 -2.5
-2 -1.5
-1 -0.5
0 0.5
1 1.5
2 2.5
Lab
1
Lab
2
Lab
3
Lab
4
Lab
6a
Lab
6b
Lab
7
Lab
8
Lab
9
Lab
10
Lab
11
Lab
12
Lab
13
Lab
14
Sample 6
-3 -2.5
-2 -1.5
-1 -0.5
0 0.5
1 1.5
2 2.5
Lab
1
Lab
2
Lab
3
Lab
4
Lab
6a
Lab
6b
Lab
7
Lab
8
Lab
9
Lab
10
Lab
11
Lab
12
Lab
13
Lab
14
Sample 7
-3 -2.5
-2 -1.5
-1 -0.5
0 0.5
1 1.5
2 2.5
Lab
1
Lab
2
Lab
3
Lab
4
Lab
6a
Lab
6b
Lab
7
Lab
8
Lab
9
Lab
10
Lab
11
Lab
12
Lab
13
Lab
14
Sample 8
-3 -2.5
-2 -1.5
-1 -0.5
0 0.5
1 1.5
2 2.5
Lab
1
Lab
2
Lab
3
Lab
4
Lab
6a
Lab
6b
Lab
7
Lab
8
Lab
9
Lab
10
Lab
11
Lab
12
Lab
13
Lab
14
Sample 9

Summary of slopes and regression for PTx standard in E-HPLC assays
Laboratory Std curve slope Std curve regression (r2)
Log Mean %CV Mean %CV
1 -0.21 8.6% 0.999 0.06%
1*
0.09 17.6% 0.994 0.15%
2 4.87 2.2% 0.976 0.27%
3 3.07 21.9% 0.998 0.20%
4 6.30 0 0.998 0.06%
6A 5.95 10.7% 0.996 0.67%
6A*
4.61 16.2% 0.998 0.15%
6B 8.13 10.2% 0.985 1.67%
6B*
6.53 10.0% 0.995 0.41%
7 3.81 18.3% 0.982 1.50%
9# 4.48 0.998 0.21%
10 5.96 8.3% 0.969 2.84%
11 4.68 17.9% 0.983 0.62%
12# 6.87 6.7% 0.976 2.03%
13 1.90 8.9% 0.991 0.27%
14 3.53 4.2% 0.996 0.42%
16 -0.16 5.5% 0.986 1.23%
0
5
10
15
20
25
30
lab
1
lab
1*
lab
2
lab
3
lab
4
lab
6A
lab
6A
*
lab
6B
lab
6B
*
lab
7
lab
9
lab
10
lab
11
lab
12
lab
13
lab
14
lab
16
CV
% o
f th
ree
ass
ays
~10%
* In-house protocol
# data from 1 or 2 assay

-1.5
-1
-0.5
0
0.5
1
1.5
2
Lab
1
Lab
2
Lab
3
Lab
4
Lab
6A
Lab
6B
Lab
7
Lab
9
Lab
10
Lab
11
Lab
12
Lab
13
Lab
14
Lab
16
Log
EU/d
ose
Sample 1
-1.5
-1
-0.5
0
0.5
1
1.5
2
Lab
1
Lab
2
Lab
3
Lab
4
Lab
6A
Lab
6B
Lab
7
Lab
9
Lab
10
Lab
11
Lab
12
Lab
13
Lab
14
Lab
16
Log
EU/d
ose
Sample 2
-1.5
-1
-0.5
0
0.5
1
1.5
2
Lab
1*
Lab
2
Lab
3
Lab
4
Lab
6A
Lab
6B
*
Lab
7
Lab
9*
Lab
10
Lab
11
Lab
12
Lab
13
Lab
14
Lab
16
Log
EU/d
ose
Sample 3
*
-1.5
-1
-0.5
0
0.5
1
1.5
2
Lab
1
Lab
2
Lab
3
Lab
4
Lab
6A
Lab
6B
Lab
7
Lab
9
Lab
10
Lab
11
Lab
12
Lab
13
Lab
14
Lab
16
Sample 4
-1.5
-1
-0.5
0
0.5
1
1.5
2
Lab
1*
Lab
2
Lab
3
Lab
4
Lab
6A
Lab
6B
*
Lab
7
Lab
9
Lab
10
Lab
11
Lab
12
Lab
13
Lab
14
Lab
16
Sample 5
*
-1.5
-1
-0.5
0
0.5
1
1.5
2
Lab
1
Lab
2
Lab
3
Lab
4
Lab
6A
Lab
6B
Lab
7
Lab
9
Lab
10
Lab
11
Lab
12
Lab
13
Lab
14
Lab
16
Sample 6
-1.5
-1
-0.5
0
0.5
1
1.5
2
Lab
1
Lab
2
Lab
3
Lab
4
Lab
6A
Lab
6B
Lab
7
Lab
9
Lab
10
Lab
11
Lab
12
Lab
13
Lab
14
Lab
16
Sample 7
-1.5
-1
-0.5
0
0.5
1
1.5
2
Lab
1
Lab
2
Lab
3
Lab
4
Lab
6A
Lab
6B
Lab
7
Lab
9
Lab
10
Lab
11
Lab
12
Lab
13
Lab
14
Lab
16
Sample 8
-1.5
-1
-0.5
0
0.5
1
1.5
2
Lab
1*
Lab
2
Lab
3
Lab
4
Lab
6A
Lab
6B
*
Lab
7
Lab
9
Lab
10
Lab
11
Lab
12
Lab
13
Lab
14
Lab
16
Sample 9
*

Carbohydrate binding assay E-HPLC assay HIST
Num
ber of estim
ate
s
0
1
2
3
4
5
6
7
8
9
10
11
12
13
14
15
16
Result (BU)
<.01 0.01 0.02 0.04 0.08 0.16 0.32 0.64 1.25 2.5 5.0 10.0 20.0
1
1
6b
6b
6b
12
12
12
1
9
9
10 9
10
13
7
7
7
10
13
13
2
2
2
11
11
11
14
14
14
1
8
1
6b
6a
8
8
1
6b
6b
4
4
4
6a
6a
12
12
13
13
3
3
3
10
10
11
11
12
13
8
11
8
8
9
9
10
4
4
7
9
3
4
6a
7
14
14
2
3
6a
6a
7
14
2
3
2 6a 1
6b
6a
6b
8
10
1
7
10
12
13
2
6a
6b
7
7
8
13
14
1
4
4
8
9
10
11
12
13
2
3
4
9
9
11
11
12
14
14
2
3
3
Samples 3, 5, 9
Samples 1, 6, 8
Samples 2, 4, 7
Num
ber of estim
ate
s
0
1
2
3
4
5
6
7
8
9
10
11
12
13
14
15
16
Result (EU)
<.01 0.01 0.02 0.04 0.08 0.16 0.32 0.64 1.25 2.5 5.0 10.0 20.0
1
1
1
6b
6b
6b
9
12
12
12
9 2 2
4
14 6a
1
2 6a 4
4
6a
9
13
3
7
7
13
14
14
13
6b
2
2
4
6b
14
3
7
1
1
2
4
6a
6a
6a
6b
13
14
14
3
11
3
4
7
9
12
13
13
11
11
9
3
3
7
7
11
11
11
10 10
9
10
12
10
10
10
12
2
2
9
9
12
4
13
1
4
9
12
14
1
3
3
6a
6a
6b
6b
7
11
13
13
14
1
4
6a
7
10
10
11
12
14
2
3
6b
7
10
11
Samples 3, 5, 9
Samples 1, 6, 8
Samples 2, 4, 7
Num
ber of estim
ate
s
0
1
2
3
4
5
6
7
8
9
10
11
12
13
14
15
16
Result (IU)
<.01 0.01 0.02 0.04 0.08 0.16 0.32 0.64 1.25 2.5 5.0 10.0 20.0
9
4
9
4
4
4
9
9
1 1
9
14
11
11
14
5
14
14
5
11
14
1
8
14
11
5
9
8
1
5
8
8
8
11
14
1
8
11
14
5
7
8
11
1
8
11
3
7
10
10
5
9
7
8
11
3
3
1
3
3
7
7
7
7
10
4
3
10
7
10
10
5
7
14
2
2
4
2
2
3
3
4
5
10
1
2
2
2
4
2
3
5
2
10
4 10
1
9 9
Samples 3, 5, 9
Samples 1, 6, 8
Samples 2, 4, 7
Geometric mean (GM) and 95% Confidence Limits (CL) of carbohydrate binding activity (BU), enzymatic
activity (EU) and HIST activity (IU) for the three types of acellular pertussis based vaccine products
included in the study
Sample Number Activities
BU/dose EU/dose IU/dose
Sample 1, 6, 8 GM 0.49 0.27 0.24
95% CL (0.41-0.59) (0.39-0.75) (0.11-0.54)
Sample 2, 4, 7 GM 10.80 2.77 0.37
95% CL (5.57-20.93) (2.39-12.83) (0.13-1.09)
Sample 3, 5, 9 GM 0.10 0.12 0.20
95% CL (0.09-0.11) (0.15-0.34) (0.05-0.75)

Discussion
• The methodology of the E-HPLC and carbohydrate-binding assays are transferable between laboratories worldwide
• This system is suitable for the three types of ACV products included in the study.
• Although direct correlation between the in vitro assay system and the in vivo HIST for each individual vaccine lot cannot be established due to the small range of the activities/large variation in the HIST results, geometric mean estimates of the in vitro and in vivo activities gave the same rank order of the three vaccine types which is encouraging.
• The in vitro systems provide reproducible product specific profiles which proved the principal of this approach as a potential alternative to the HIST.
• Due to limitation in capacity, investigation of the adsorption/desorption effect on the assay system was not addressed in the present study. These factors may be product specific and have to be further evaluated.
• PT activities in the vaccine samples included in the study represented the range in most products in current market, they are relatively low and within a very narrow range. Further study using spiked sample may provide further information on assay sensitivity.
• In the present study only 3 batches of each product were examined because of restricted capacity for assay evaluation. Therefore further product specific validation study involving more batches under each laboratory setting would be needed, e.g. precise assay condition, desorption, detection limits, precision, validity criteria, specification etc.

This in vitro assay system could not address directly the mechanism of translocation/internalisation of PTx
Discussion
• Comparison of PTx and different PTds in translocation to CHO cells shown by the fluorescence intensity of target protein in confocal images.
• CHO cells were treated with PTx or PTd for 12 h.
• PTds with different detoxification procedures showed great reduction in their translocation/internalization activities compared to the native toxin.
• All PTds at higher concentrations could translocate into the target cells with differences in fluorescence intensity under the same conditions, indicating different detoxification methods could result in PTds with different activities.
•The differences in translocation capacity on CHO cells between PTx and PTds or between PTds are consistent with their carbohydrate binding activities which added further scientific evidence to support the developed in vitro assay system as a potential alternative to HIST as safety test for ACV quality control. PT Nucleus F-actin of cytoskeleton Scale bar =20µm
Ref. Human Vaccines & Immunotherapeutics, Volume 9 Issue 2, in press

Acknowledgements
• All Participants for their generous contributions Blaise Descampe, GlaxoSmithKline Biologicals, Belgium; Sue Nelson, Sanofi Pasteur Ltd, Canada; Richard Isbrucker
and Dean Smith, Health Canada ; Shumin Zhang, NIFDC, China; Honggang Xue, Wuhan Institute of Biological
Products, China; Sten Erik Jensen, Statens Serum Institute, Denmark; Thomas Montag-Lessing and Dr Christina
Bache, Paul-Ehrlich-Institute, Germany; Kazunari Kamachi ,National Institute of Infectious Diseases (NIID),Japan;
Kengo Tamura & Akihiro Suehara,Takeda,Japan; Satoru Sasaki & Hideo Goto, The Kitasato Institute, Japan; Toshiyuki
Onishi,Biken, Japan; Eiji Tokunaga, The Chemo-Sero-Therapeutic Research Institute (Kaketsuken),Japan; Hokyung
Oh, Korea Food & Drug Administration, Korea; Arnoud Akkermans, RIVM, The Netherlands; Johan W.van der Gun,
National Vaccine Institute, The Netherlands; CT Yuen, C. Asokanathan & D. Xing, NIBSC, UK.
• All Vaccine Manufacturers who kindly donated the vaccine samples NIBSC Team
• CT Yuen
• Cathy Asokanathan
• Sheena R Gomez
• Peter Rigsby
• Roland Fleck
• Dorothy Xing
NIID, Japan
• Yoshi Horiuchi
• Masaki Ochiai
• APC, Home Office, UK for supporting the early research
• NC3Rs, UK for supporting the second phase research
• WHO for supporting the International collaborative study
NIFDC, China
• Yajun Tan
• Junzhi Wang
• Shumin Zhang