
International Bank for Reconstruction and...
37
International Bank for Reconstruction and Development Management’s Discussion & Analysis and Condensed Quarterly Financial Statements March 31, 2011 (Unaudited)
Transcript of International Bank for Reconstruction and...

International Bank for Reconstruction and Development
Management’s Discussion & Analysis and
Condensed Quarterly Financial Statements March 31, 2011
(Unaudited)

INTERNATIONAL BANK FOR RECONSTRUCTION AND DEVELOPMENT (IBRD) CONT EN TS March 31, 2011
MANA GE MENT’S DISCU S SION A N D ANALY SIS Section 1: Basis of Reporting 3
Section 2: Overview 3
Section 3: Contractual Terms of Loans 4
Section 4: Equity-To-Loans Ratio 4
Section 5: Commercial Credit Risk 5
Section 6: Fair Value Analysis 6
Section 7: Reported Basis Analysis 8
Section 8: Senior Management Changes 9
LIST OF BOXES AND TABLES Box 1. Selected Financial Data 2 Tables
1. Exchange Rate Movements vs U.S. Dollar 4 2. Equity-to-Loans Ratio 5 3. Commercial Credit Exposure, Net of Collateral Held, by Counterparty Rating 5 4. Condensed Balance Sheet at March 31, 2011 and June 30, 2010 6 5. Condensed Statement of Income for the nine months ended March 31, 2011 and March 31,
2010 7 6. Summary of Fair Value Adjustment on Non-Trading Portfolios, net 8 7. Reported Basis Operating Income for the nine months ended March 31, 2011 and March 31,
2010 9
CONDE NSED QU A RTE RL Y FINANCI AL STAT EMENTS
Condensed Balance Sheet 10
Condensed Statement of Income 11
Condensed Statement of Comprehensive Income 12
Condensed Statement of Changes in Retained Earnings 12
Condensed Statement of Cash Flows 13
Notes to Condensed Quarterly Financial Statements 14
Report of Independent Accountants 35

2 IBRD MANAGEMENT’S DISCUSSION AND ANALYSIS: MARCH 31, 2011
Box 1: Selected Financial Data In millions of U.S. dollars, except ratios and return data in percentages As of and for the nine months ended Full Year
March 31, 2011 March 31, 2010 June 30, 2010
Lending (Discussed in Section 2) Commitmentsa 16,035 26,725 44,197 Gross disbursementsb 18,204 20,505 28,855 Net disbursementsb 10,756 11,475 17,230
Reported Basis Income Statement (Discussed in Section 7) Operating incomec 925 827 800 Board of Governors-Approved Transfers (438) (839) (839) Net income (loss) 912 (1,022) (1,077) Balance Sheet (Discussed in Section 7) Total assets 297,896 277,644 281,913 Unrestricted cash and investments, net 28,370 33,972 36,513 Net loans outstanding 132,639 114,331 118,104 Borrowing portfolio 122,611 111,705 119,775 Total equity 38,569 37,574 36,261 Performance Ratios (Discussed in Section 4) Net return on average earning assets
Based on operating income 0.77 0.76 0.54 Based on net income (loss) 0.76 (0.94) (0.73)
Return on equity Based on operating income 3.40 3.03 2.21 Based on net income (loss) 3.26 (3.62) (2.88)
Equity-to-loans ratiod 27.37 30.56 29.37
Fair Value Basis Income Statement (Discussed in Section 6) Net income (loss) 869 220 (870) Net income (loss) excluding Board of Governors-Approved Transfers 1,307 1,059 (31) Balance Sheet (Discussed in Section 6) Total assets 296,860 277,300 281,745 Unrestricted cash and investments, net 28,370 33,972 36,513 Net loans outstanding 131,603 113,987 117,936 Borrowing portfolio 122,592 111,685 119,761 Total equity 37,552 37,250 36,107 Performance Ratios (Discussed in Section 4) Net return on average earning assetse 1.09 0.98 (0.02) Return on equitye 4.69 3.82 (0.08) Equity-to-loans ratiod 27.75 31.10 29.97
a. Commitments include guarantee commitments and guarantee facilities. b. Amounts include transactions with the International Finance Corporation (IFC) and capitalized loan origination fees. c. Operating income is defined as income before fair value adjustment on non-trading portfolios, net and Board of Governors-
Approved Transfers. d. Ratios are computed using usable equity and excludes the respective period’s operating income. (Full year June 30, 2010
amount includes proposed transfers to the General Reserve). e. Ratios exclude Board of Governors-Approved Transfers.
IBRD MANAGEMENT’S DISCUSSION AND ANALYSIS: MARCH 31, 2011 3
0.3
0.6
0.9
1.2
Jun Sep Dec Mar
% Six Month USD LIBOR Interest Rates
FY 2010
FY 2011
0.0
1.0
2.0
3.0
4.0
5.0
1 3 5 7 9 15 30
Rate
Years
USD Swap Rates
3/31/20116/30/2010
0.00.30.60.91.21.5
FY 2010 FY 2011
USD Bns Net Interest Income
Interest Margin Equity SavingsEquity Duration
This document should be read in conjunction with the International Bank for Reconstruction and Development's (IBRD) financial statements and management's discussion and analysis issued for the fiscal year ended June 30, 2010 (FY 2010). IBRD undertakes no obligation to update any forward-looking statements.
Section 1. BASIS OF REPORTING
IBRD prepares its financial statements in conformity with accounting principles generally accepted in the United States of America (U.S. GAAP), referred to in this document as the “reported basis”.
IBRD reports all instruments in the investment, borrowing and asset/liability management portfolios at fair value, with changes in fair value reported in the statement of income. Loans are reported at amortized cost, except for loans with embedded derivatives which are reported at fair value.
Management believes this mixed measurement model creates an asymmetry such that reported net income does not capture the true economic income of IBRD. Therefore, management believes that the fair value financial statements, which include the loan portfolio at fair value, are a better measure of the financial strength of the institution.
Additionally, when making decisions on income allocation and distribution, management monitors the fair value balance sheet, the results from stress tests, and the equity-to-loans ratio as indicators of IBRD’s financial health within an overall Strategic Capital Adequacy Framework.
For details relating to the allocation and transfers out of the net income earned in FY 2010 and from Surplus that have been recommended by the Executive Directors and approved by the Board of Governors during the fiscal year ending June 30, 2011 (FY 2011), refer to Note G−Retained Earnings, Allocations and Transfers, of the Notes to the Condensed Quarterly Financial Statements.
Section 2. OVERVIEW
Box 1 presents IBRD’s lending summary and selected financial data on both the reported and fair value bases.
Economic Environment
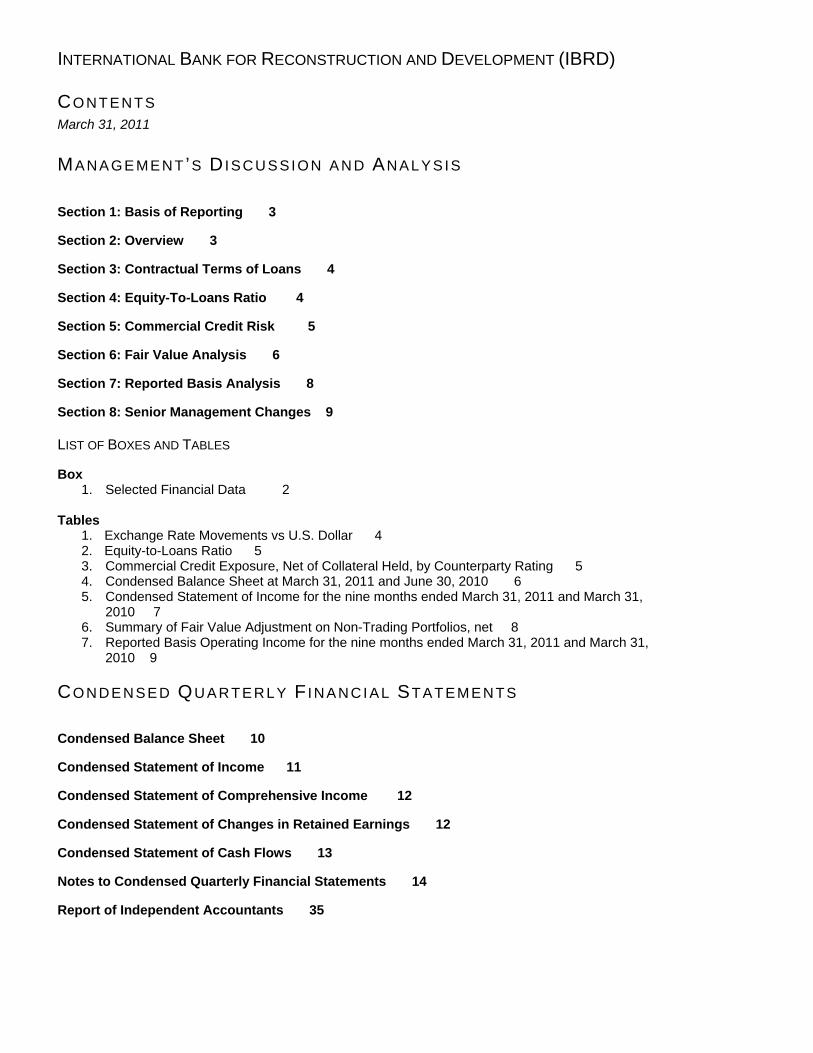
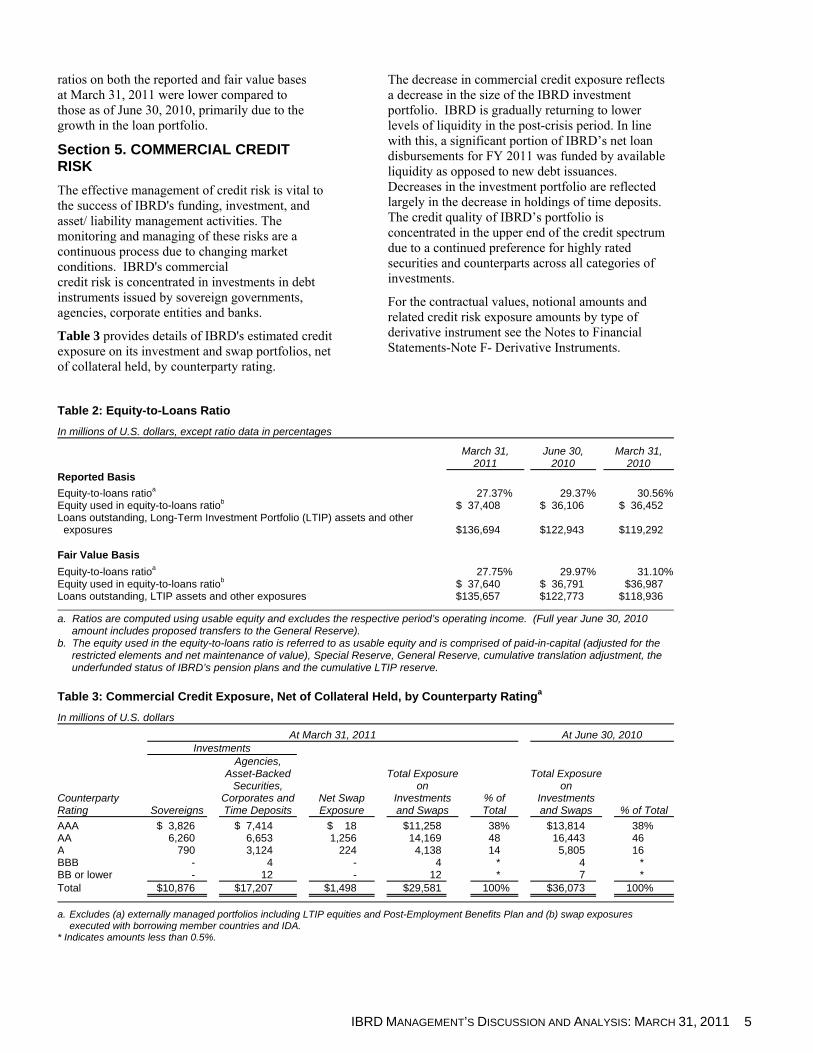
Effect of Interest Rates: IBRD’s net interest income has been relatively stable despite the lower interest rate environment, as evidenced by the U.S. dollar six-month LIBOR interest rates. This stability is primarily due to the equity duration extension strategy, which was implemented in FY 2008. The shift by IBRD’s borrowers towards variable-rate
loans over the years has increased the sensitivity of IBRD’s income from equity-funded loans to changes in short-term interest rates. The equity duration extension strategy mitigates this sensitivity to short-term interest rates, by extending the duration of IBRD’s equity from three
months to approximately four years. This has been achieved by entering into interest rates swaps with a
10-year ladder repricing profile. The strategy has resulted in interest income from the swaps (where IBRD is a variable interest rate payer and a fixed interest rate receiver), significantly offsetting
the decline in interest income from equity-funded loans (where IBRD is a variable interest rate receiver). (See Section 7)
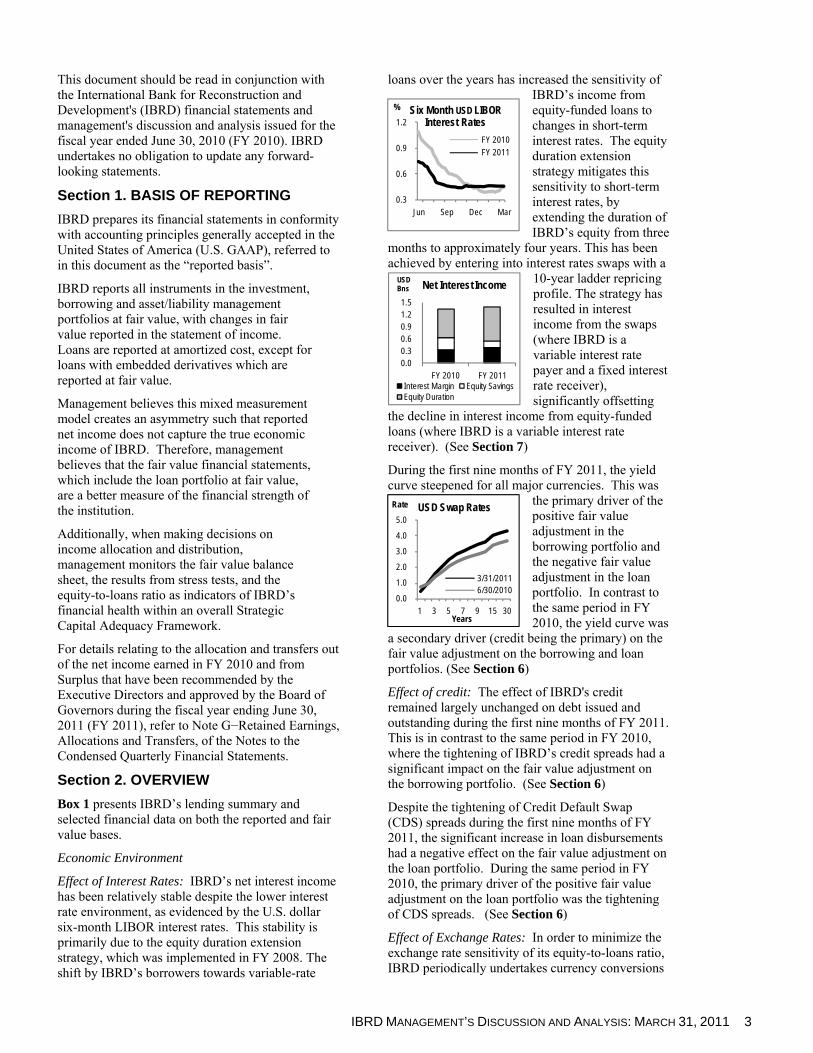
During the first nine months of FY 2011, the yield curve steepened for all major currencies. This was
the primary driver of the positive fair value adjustment in the borrowing portfolio and the negative fair value adjustment in the loan portfolio. In contrast to the same period in FY 2010, the yield curve was
a secondary driver (credit being the primary) on the fair value adjustment on the borrowing and loan portfolios. (See Section 6)
Effect of credit: The effect of IBRD's credit remained largely unchanged on debt issued and outstanding during the first nine months of FY 2011. This is in contrast to the same period in FY 2010, where the tightening of IBRD’s credit spreads had a significant impact on the fair value adjustment on the borrowing portfolio. (See Section 6)
Despite the tightening of Credit Default Swap (CDS) spreads during the first nine months of FY 2011, the significant increase in loan disbursements had a negative effect on the fair value adjustment on the loan portfolio. During the same period in FY 2010, the primary driver of the positive fair value adjustment on the loan portfolio was the tightening of CDS spreads. (See Section 6)
Effect of Exchange Rates: In order to minimize the exchange rate sensitivity of its equity-to-loans ratio, IBRD periodically undertakes currency conversions

4 IBRD MANAGEMENT’S DISCUSSION AND ANALYSIS: MARCH 31, 2011
0
25
50
FY04
FY05
FY06
FY07
FY08
FY09
FY10
FY11
(Pro
j)
USD Bns
Commitment and Disbursement Trend
CommitmentsGross Disbursements
0
10
20
30
Jul Sep Dec Mar
USD Bns
Commitments
FY 2010FY 2011
0.0
0.2
0.4
0.6
0.8
1.0
FY 2010 FY 2011
USD Bns
Operating Income
to align the currency composition of its loan portfolio with that of its equity. As a result of this policy, while the appreciation of the euro and Japanese yen against the U.S. dollar (See Table 1) impacted the individual portfolios, there was no material impact on the equity-to-loans ratio (See Section 4).
Table 1: Exchange Rate Movements vs. U.S. Dollar
Nine months ended March 31 2011 2010 Euro 15.63% 4.60% Japanese Yen 7.05% 2.74%
Equity
To enhance IBRD’s financial capacity following its response to the global economic crisis, the Executive Directors of IBRD, in April 2010, recommended to the Board of Governors the first general capital increase in over 20 years. On March 16, 2011, three resolutions increasing IBRD's authorized capital were approved by the Board of Governors. The total increase in authorized capital was $87.6 billion, of which $58.4 billion and $27.8 billion relate to the General Capital Increase (GCI) and the Selective Capital Increase (SCI) respectively, and $1.4 billion relates to additional shares to be held for new members. Under the terms of the GCI and SCI resolutions, subscribed capital will increase by $86.2 billion over the next five years, of which $5.1 will be paid-in.
Lending Operations
For the first nine months of FY 2011, loan commitments decreased by $10,690 million compared to the same period in FY 2010, when IBRD experienced record levels of loan commitments associated
with the global economic crisis. Development policy operations accounted for most of this decrease during FY 2011.
Since July 1, 2008 (FY 2009), in response to the global economic crisis, IBRD’s commitments have totaled $93 billion. Despite the decrease in FY 2011, demand for IBRD’s loan products still remains strong and
is substantially above pre-FY 2008 levels.
Operating Income
For the first nine months of FY 2011, IBRD’s operating income was $925 million, an increase of $98 million over the same period in FY 2010. See Section 7 for more details.
Fair Value Net Income
For the first nine months of FY 2011, IBRD’s net income on a fair value basis was $869 million, an increase of $649 million over the same period in FY 2010. This was primarily due to the net positive currency translation adjustments resulting from the appreciation of the euro against the U.S. dollar and lower Board of Governors transfers, partially offset by the lower net fair value adjustment. (See Section 6).
Section 3. CONTRACTUAL TERMS OF LOANS
For FY 2011, the Executive Directors approved a new pricing structure for fixed and variable IBRD Flexible Loans1 (IFLs) and also realigned the average maturity terms for IFLs with a fixed spread. IBRD restored the average loan maturity limits for new loans and guarantees from 18 years to the pre-2008 level of 12 years. Borrowing members have the option to extend the average loan maturity from 12 years to 18 years by paying a maturity premium of 10 to 20 basis points. The maturity premium is a new component of the spread charge over LIBOR, and accounts for the cost of the incremental capital needed for the longer maturities.
The contractual spread and maturity premium, which apply to all IFLs are subject to the Executive Directors' annual pricing review. Those IFLs with a fixed spread have two additional components: a projected funding cost and a market risk premium. These components are reviewed and set by management based on market conditions and are communicated quarterly to the Executive Directors.
Section 4. EQUITY-TO-LOANS RATIO
The equity-to-loans ratio is a summary statistic that management uses as one measure of the adequacy of its risk-bearing capacity. Table 2 presents this ratio computed on both reported and fair value bases. IBRD’s equity-to-loans
1 The new loan pricing applies to IBRD loans and guarantees
approved after June 30, 2010, with the exception of a limited number of FY 2010 loan and guarantee proposals, whose consideration by the Board was deferred to early FY 2011.
IBRD MANAGEMENT’S DISCUSSION AND ANALYSIS: MARCH 31, 2011 5
ratios on both the reported and fair value bases at March 31, 2011 were lower compared to those as of June 30, 2010, primarily due to the growth in the loan portfolio.
Section 5. COMMERCIAL CREDIT RISK
The effective management of credit risk is vital to the success of IBRD's funding, investment, and asset/ liability management activities. The monitoring and managing of these risks are a continuous process due to changing market conditions. IBRD's commercial credit risk is concentrated in investments in debt instruments issued by sovereign governments, agencies, corporate entities and banks.
Table 3 provides details of IBRD's estimated credit exposure on its investment and swap portfolios, net of collateral held, by counterparty rating.
The decrease in commercial credit exposure reflects a decrease in the size of the IBRD investment portfolio. IBRD is gradually returning to lower levels of liquidity in the post-crisis period. In line with this, a significant portion of IBRD’s net loan disbursements for FY 2011 was funded by available liquidity as opposed to new debt issuances. Decreases in the investment portfolio are reflected largely in the decrease in holdings of time deposits. The credit quality of IBRD’s portfolio is concentrated in the upper end of the credit spectrum due to a continued preference for highly rated securities and counterparts across all categories of investments.
For the contractual values, notional amounts and related credit risk exposure amounts by type of derivative instrument see the Notes to Financial Statements-Note F- Derivative Instruments.
Table 2: Equity-to-Loans Ratio In millions of U.S. dollars, except ratio data in percentages
March 31,
2011June 30,
2010 March 31,
2010 Reported Basis
Equity-to-loans ratioa 27.37% 29.37% 30.56%Equity used in equity-to-loans ratiob $ 37,408 $ 36,106 $ 36,452 Loans outstanding, Long-Term Investment Portfolio (LTIP) assets and other
exposures $136,694 $122,943 $119,292
Fair Value Basis
Equity-to-loans ratioa 27.75% 29.97% 31.10%Equity used in equity-to-loans ratiob $ 37,640 $ 36,791 $36,987 Loans outstanding, LTIP assets and other exposures $135,657 $122,773 $118,936
a. Ratios are computed using usable equity and excludes the respective period’s operating income. (Full year June 30, 2010 amount includes proposed transfers to the General Reserve).
b. The equity used in the equity-to-loans ratio is referred to as usable equity and is comprised of paid-in-capital (adjusted for the restricted elements and net maintenance of value), Special Reserve, General Reserve, cumulative translation adjustment, the underfunded status of IBRD’s pension plans and the cumulative LTIP reserve.
Table 3: Commercial Credit Exposure, Net of Collateral Held, by Counterparty Ratinga
In millions of U.S. dollars
At March 31, 2011 At June 30, 2010 Investments
Net Swap Exposure
Total Exposure on
Investments and Swaps
Total Exposure on
Investments and Swaps
Counterparty Rating Sovereigns
Agencies, Asset-Backed
Securities, Corporates and Time Deposits
% of Total % of Total
AAA $ 3,826 $ 7,414 $ 18 $11,258 38% $13,814 38% AA 6,260 6,653 1,256 14,169 48 16,443 46 A 790 3,124 224 4,138 14 5,805 16 BBB - 4 - 4 * 4 * BB or lower - 12 - 12 * 7 * Total $10,876 $17,207 $1,498 $29,581 100% $36,073 100%
a. Excludes (a) externally managed portfolios including LTIP equities and Post-Employment Benefits Plan and (b) swap exposures executed with borrowing member countries and IDA.
* Indicates amounts less than 0.5%.

6 IBRD MANAGEMENT’S DISCUSSION AND ANALYSIS: MARCH 31, 2011
110
115
120
125
130
135
Jul Sep Dec Mar
USD Bns
FY 2011 Net Loans Oustanding
0
10
20
30
40
Jul Sep Dec Mar
USD Bns
FY 2011 NAV of Investments
Table 4: Condensed Balance Sheet at March 31, 2011 and June 30, 2010
In millions of U.S. dollars
March 31, 2011 June 30, 2010Reported
Basis Adjustments Fair Value
Basis Reported
Basis Adjustments Fair Value
Basis
Due from banks $ 1,061 $1,061 $ 1,803 $ 1,803 Investments 29,481 29,481 36,301 36,301 Receivable from derivatives 131,001 131,001 121,823 121,823 Net loans outstanding 132,639 $(1,036) 131,603 118,104 $(168) 117,936 Other assets 3,714 3,714 3,882 3,882
Total assets $297,896 $(1,036) $296,860 $281,913 $(168) $281,745
Borrowings $133,591 $(19)a $133,572 $128,577 $ (14)a $128,563 Payable for derivatives 118,951 118,951 110,615 110,615 Other liabilities 6,785 6,785 6,460 6,460 Total liabilities 259,327 (19) 259,308 245,652 (14) 245,638 Paid in capital 11,492 11,492 11,492 11,492 Retained earnings and other equity 27,077 (1,017) 26,060 24,769 (154) 24,615 Total equity 38,569 (1,017) 37,552 36,261 (154) 36,107
Total liabilities and equity $297,896 $(1,036) $296,860 $281,913 $(168) $281,745
a. Amount represents transition adjustment on adoption of a new U.S. GAAP guidance on derivatives and hedging on July 1, 2000.
Section 6. FAIR VALUE ANALYSIS
Balance Sheet
During the first nine months of FY 2011, IBRD’s total assets on a fair value basis increased by $15,115 million. The main reason for this increase was the growth in the loan portfolio.
The Condensed Fair Value Balance Sheets in Table 4 present IBRD’s estimates of the fair value of its financial assets and liabilities, taking into account interest rate, currency and credit risks. As non-financial assets and liabilities are not reflected at fair value, IBRD’s equity is not intended to reflect fair value. The Condensed Fair Value Balance Sheets are presented with a reconciliation to the reported basis.
Loan Portfolio
IBRD’s fair value model for the loan portfolio incorporates CDS spreads as an indicator of the credit risk for each borrower. Recovery levels are modified to incorporate IBRD’s recovery levels.
The loan portfolio increased by $13,667 million compared with June 30, 2010. The increase comprises net loan disbursements of $10,756 million and currency translation gains of $3,675 million
mainly due to the appreciation of the euro against the U.S. dollar during the period. This was partially offset by a negative net fair value adjustment of $825 million primarily due to the steepening of the yield curves of all major currencies.
Investment Portfolio
At March 31, 2011, the net asset value (NAV) of the investment portfolio decreased by $8,105 million as compared to June 30, 2010 (See Notes to Condensed Quarterly Financial Statements-Note C-Investments). This decrease was
primarily due to net loan disbursements of $10,756 million, partially offset by cash inflows from net borrowing activities of $1,315 million as well as net mark-to-market gains of $165 million, primarily from LTIP.
IBRD MANAGEMENT’S DISCUSSION AND ANALYSIS: MARCH 31, 2011 7
100
120
140
Jul Sep Dec Mar
USD Bns
FY 2011 Borrowing Portfolio
Table 5: Condensed Statement of Income for the nine months ended March 31, 2011 and March 31, 2010 In millions of U.S. dollars
March 31, 2011 March 31, 2010
Reported Basis Adjustments
Fair Value Comprehensive
BasisaReported
Basis Adjustments
Fair Value Comprehensive
Basisa
Income from loans $1,829 $1,829 $ 1,930 $ 1,930 Income from investments, netb 322 322 411 411 Equity duration extension swaps, net 849 849 713 713 Other income 191 191 169 169
Total income 3,191 3,191 3,223 3,223
Borrowing expenses 1,257 1,257 1,356 1,356 Administrative expenses including
contributions to special programs 1,075 1,075 1,102 1,102 Provision for losses on loans and other
exposures – (decrease) (66) $ 66 - (62) $ 62 - Total expenses 2,266 66 2,332 2,396 62 2,458
Operating income 925 (66) 859 827 (62) 765 Board of Governors-Approved Transfers (438) (438) (839) (839) Fair value adjustment on non-trading
portfolios, netc 425 425 (1,010) (1,010) Fair value adjustment on loansd (759) (759) 1,452 1,452 Other comprehensive income 782 782 (148) (148) Net Income (Loss) $ 912 $ (43) $ 869 $(1,022) $1,242 $ 220
a. Fair value comprehensive basis comprises net income on a reported basis, the components of other comprehensive income as reported in the financial statements, and the fair value adjustments.
b. Unrealized gains (losses) on derivatives in the investments trading portfolio are included in income from investments, net. c. Excludes the fair value adjustment on loans which are not carried at fair value for reporting purposes. d. Excludes the reversal of the provision for losses on loans and other exposures.
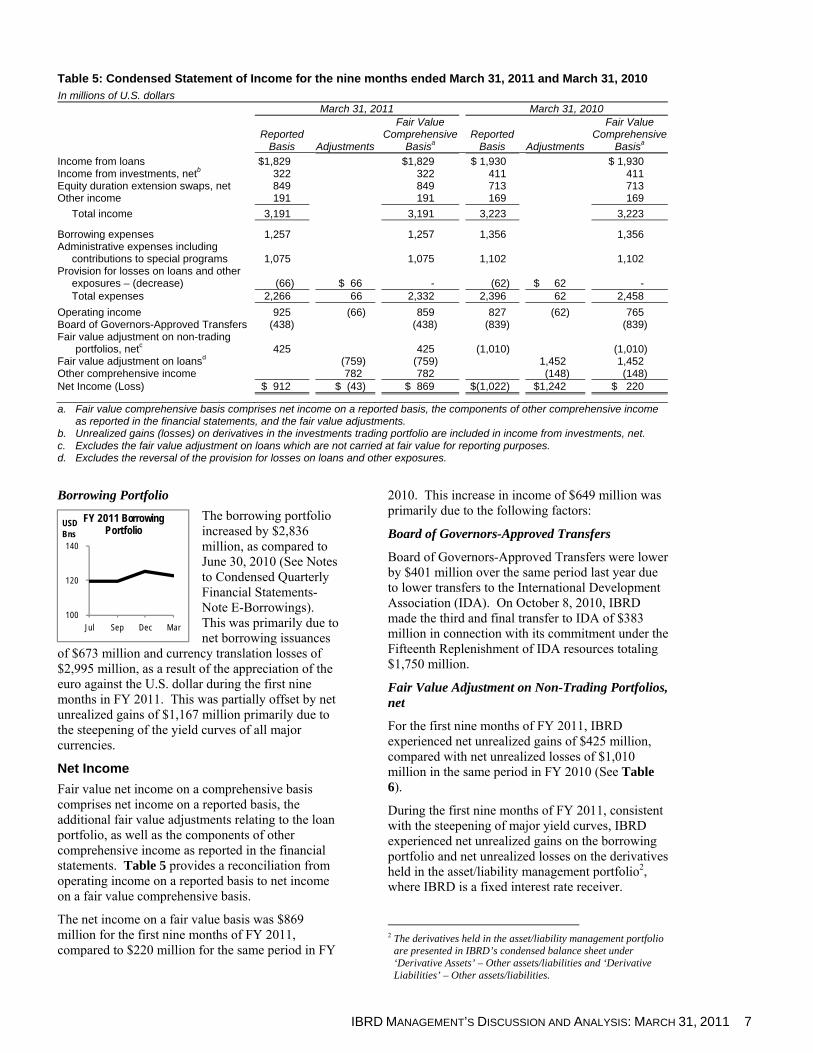
Borrowing Portfolio
The borrowing portfolio increased by $2,836 million, as compared to June 30, 2010 (See Notes to Condensed Quarterly Financial Statements-Note E-Borrowings). This was primarily due to net borrowing issuances
of $673 million and currency translation losses of $2,995 million, as a result of the appreciation of the euro against the U.S. dollar during the first nine months in FY 2011. This was partially offset by net unrealized gains of $1,167 million primarily due to the steepening of the yield curves of all major currencies.
Net Income
Fair value net income on a comprehensive basis comprises net income on a reported basis, the additional fair value adjustments relating to the loan portfolio, as well as the components of other comprehensive income as reported in the financial statements. Table 5 provides a reconciliation from operating income on a reported basis to net income on a fair value comprehensive basis.
The net income on a fair value basis was $869 million for the first nine months of FY 2011, compared to $220 million for the same period in FY
2010. This increase in income of $649 million was primarily due to the following factors:
Board of Governors-Approved Transfers
Board of Governors-Approved Transfers were lower by $401 million over the same period last year due to lower transfers to the International Development Association (IDA). On October 8, 2010, IBRD made the third and final transfer to IDA of $383 million in connection with its commitment under the Fifteenth Replenishment of IDA resources totaling $1,750 million.
Fair Value Adjustment on Non-Trading Portfolios, net
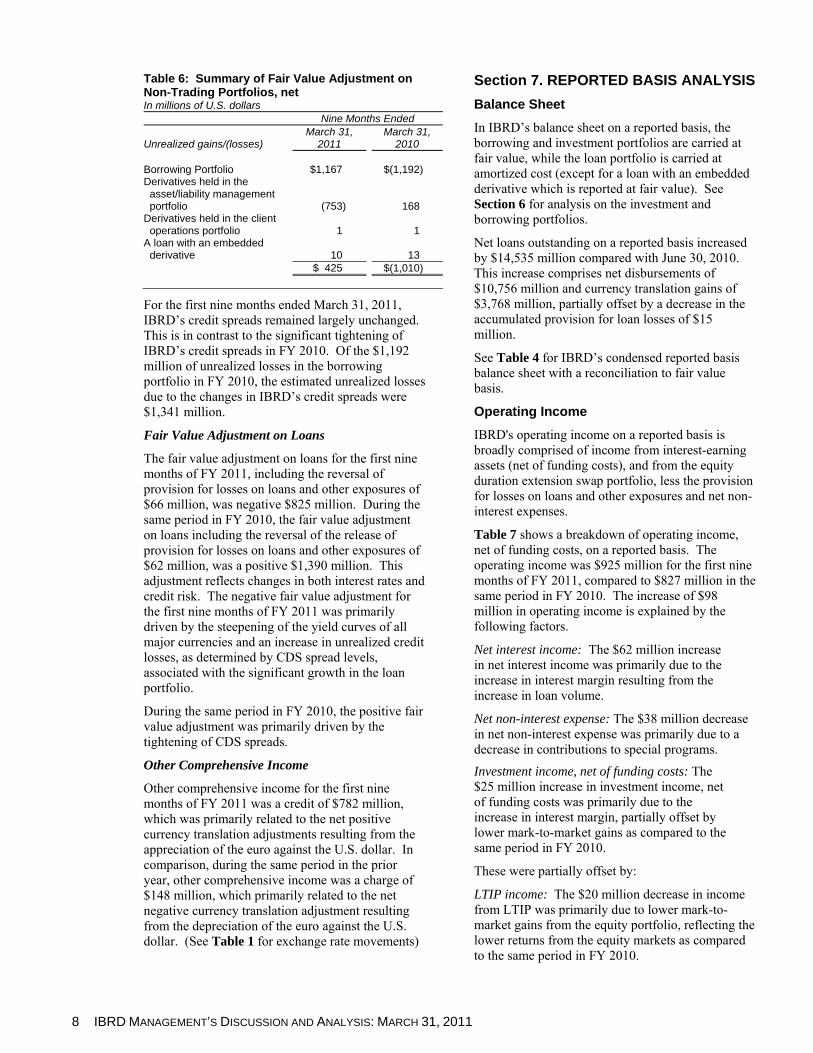
For the first nine months of FY 2011, IBRD experienced net unrealized gains of $425 million, compared with net unrealized losses of $1,010 million in the same period in FY 2010 (See Table 6).
During the first nine months of FY 2011, consistent with the steepening of major yield curves, IBRD experienced net unrealized gains on the borrowing portfolio and net unrealized losses on the derivatives held in the asset/liability management portfolio2, where IBRD is a fixed interest rate receiver.
2 The derivatives held in the asset/liability management portfolio
are presented in IBRD’s condensed balance sheet under ‘Derivative Assets’ – Other assets/liabilities and ‘Derivative Liabilities’ – Other assets/liabilities.
8 IBRD MANAGEMENT’S DISCUSSION AND ANALYSIS: MARCH 31, 2011
Table 6: Summary of Fair Value Adjustment on Non-Trading Portfolios, net In millions of U.S. dollars Nine Months Ended
Unrealized gains/(losses) March 31,
2011 March 31,
2010 Borrowing Portfolio $1,167 $(1,192) Derivatives held in the
asset/liability management portfolio (753) 168
Derivatives held in the client operations portfolio 1 1
A loan with an embedded derivative 10 13
$ 425 $(1,010)
For the first nine months ended March 31, 2011, IBRD’s credit spreads remained largely unchanged. This is in contrast to the significant tightening of IBRD’s credit spreads in FY 2010. Of the $1,192 million of unrealized losses in the borrowing portfolio in FY 2010, the estimated unrealized losses due to the changes in IBRD’s credit spreads were $1,341 million.
Fair Value Adjustment on Loans
The fair value adjustment on loans for the first nine months of FY 2011, including the reversal of provision for losses on loans and other exposures of $66 million, was negative $825 million. During the same period in FY 2010, the fair value adjustment on loans including the reversal of the release of provision for losses on loans and other exposures of $62 million, was a positive $1,390 million. This adjustment reflects changes in both interest rates and credit risk. The negative fair value adjustment for the first nine months of FY 2011 was primarily driven by the steepening of the yield curves of all major currencies and an increase in unrealized credit losses, as determined by CDS spread levels, associated with the significant growth in the loan portfolio.
During the same period in FY 2010, the positive fair value adjustment was primarily driven by the tightening of CDS spreads.
Other Comprehensive Income
Other comprehensive income for the first nine months of FY 2011 was a credit of $782 million, which was primarily related to the net positive currency translation adjustments resulting from the appreciation of the euro against the U.S. dollar. In comparison, during the same period in the prior year, other comprehensive income was a charge of $148 million, which primarily related to the net negative currency translation adjustment resulting from the depreciation of the euro against the U.S. dollar. (See Table 1 for exchange rate movements)
Section 7. REPORTED BASIS ANALYSIS
Balance Sheet
In IBRD’s balance sheet on a reported basis, the borrowing and investment portfolios are carried at fair value, while the loan portfolio is carried at amortized cost (except for a loan with an embedded derivative which is reported at fair value). See Section 6 for analysis on the investment and borrowing portfolios.
Net loans outstanding on a reported basis increased by $14,535 million compared with June 30, 2010. This increase comprises net disbursements of $10,756 million and currency translation gains of $3,768 million, partially offset by a decrease in the accumulated provision for loan losses of $15 million.
See Table 4 for IBRD’s condensed reported basis balance sheet with a reconciliation to fair value basis.
Operating Income
IBRD's operating income on a reported basis is broadly comprised of income from interest-earning assets (net of funding costs), and from the equity duration extension swap portfolio, less the provision for losses on loans and other exposures and net non-interest expenses.
Table 7 shows a breakdown of operating income, net of funding costs, on a reported basis. The operating income was $925 million for the first nine months of FY 2011, compared to $827 million in the same period in FY 2010. The increase of $98 million in operating income is explained by the following factors.
Net interest income: The $62 million increase in net interest income was primarily due to the increase in interest margin resulting from the increase in loan volume.
Net non-interest expense: The $38 million decrease in net non-interest expense was primarily due to a decrease in contributions to special programs.
Investment income, net of funding costs: The $25 million increase in investment income, net of funding costs was primarily due to the increase in interest margin, partially offset by lower mark-to-market gains as compared to the same period in FY 2010.
These were partially offset by:
LTIP income: The $20 million decrease in income from LTIP was primarily due to lower mark-to-market gains from the equity portfolio, reflecting the lower returns from the equity markets as compared to the same period in FY 2010.

IBRD MANAGEMENT’S DISCUSSION AND ANALYSIS: MARCH 31, 2011 9
Table 7: Reported Basis Operating Income for the nine months ended March 31, 2011 and March 31, 2010
In millions of U.S. dollars March 31, 2011 March 31, 2010 Net Change
Interest income, net of funding costs Interest margin $ 393 $ 330 $ 63 Equity savings 154 291 (137) Equity duration extension, net 849 713 136
Net interest income 1,396 1,334 62 Other loan income 16 27 (11) Provision for losses on loans and other exposures–
decrease 66 62 4 Investment income, net of funding costs 97 72 25 LTIP Income 164 184 (20) Net non-interest expense (814) (852) 38 Operating Income $ 925 $ 827 $ 98
Section 8. SENIOR MANAGEMENT CHANGES
Effective October 4, 2010, Mahmoud Mohieldin joined IBRD as a Managing Director.

CONDENSED BALANCE SHEET Expressed in millions of U.S. dollars
10 IBRD CONDENSED QUARTERLY FINANCIAL STATEMENTS: MARCH 31, 2011
March 31,2011
(Unaudited) June 30, 2010(Unaudited)
Assets Due from banks—Note C
Unrestricted currencies $ 863 $ 1,581 Currencies subject to restrictions 198 222
1,061 1,803 Investments—Trading (including securities transferred under repurchase
agreements or securities lending agreements of $146 million—March 31, 2011; $204 million—June 30, 2010)—Note C 29,468 36,012
Securities purchased under resale agreements—Note C 13 289 Derivative assets—Notes C, F and I
Investments 15,670 13,446 Client operations 19,277 17,633 Borrowings 93,467 87,457 Other assets/liabilities 2,587 3,287
131,001 121,823 Loans outstanding—Notes D and I
Total loans 192,277 183,677 Less undisbursed balance 57,632 63,574
Loans outstanding (including a loan at fair value of $136 million—March 31, 2011; $109 million—June 30, 2010) 134,645 120,103
Less: Accumulated provision for losses on loans 1,538 1,553 Deferred loan income 468 446
Net loans outstanding 132,639 118,104 Other assets—Notes C and I 3,714 3,882
Total assets $297,896 $281,913 Liabilities Borrowings—Note E $133,591 $128,577 Securities sold under repurchase agreements, securities lent under
securities lending agreements, and payable for cash collateral received—Note C 690 998
Derivative liabilities—Notes C, F and I Investments 16,463 13,557 Client operations 19,262 17,623 Borrowings 82,487 78,655 Other assets/liabilities 739 780
118,951 110,615 Other liabilities—Notes C, D and I 6,095 5,462
Total liabilities 259,327 245,652
Equity
Capital stock—Authorized (2,307,600 shares—March 31, 2011; 1,581,724 shares— June 30, 2010) —Note B Subscribed (1,574,526 shares—March 31, 2011; and June 30, 2010) 189,943 189,943 Less uncalled portion of subscriptions—Note B 178,451 178,451 Paid-in capital 11,492 11,492
Nonnegotiable, noninterest-bearing demand obligations on account of subscribed capital)—Note A (1,140) (1,123)
Receivable amounts to maintain value of currency holdings—Note A (86) (171) Deferred amounts to maintain value of currency holdings 822 313 Retained earnings (see Condensed Statement of Changes in Retained
Earnings; Note G) 29,705 28,793 Accumulated other comprehensive loss—Note J (2,224) (3,043)
Total equity 38,569 36,261 Total liabilities and equity $297,896 $281,913
The Notes to Condensed Quarterly Financial Statements are an integral part of these Statements.

CONDENSED STATEMENT OF INCOME Expressed in millions of U.S. dollars
IBRD CONDENSED QUARTERLY FINANCIAL STATEMENTS: MARCH 31, 2011 11
Three Months Ended March 31,
(Unaudited)
Nine Months Ended March 31,
(Unaudited) 2011 2010 2011 2010
Income Loans—Note D $ 617 $ 585 $1,829 $ 1,930 Investments—Trading, net—Note C 103 67 322 411 Equity duration extension swaps, net—Note F 288 277 849 713 Other—Note I 73 66 191 169
Total income 1,081 995 3,191 3,223
Expenses Borrowings 408 404 1,257 1,356 Administrative— Notes H and I 298 336 980 983 Contributions to special programs 84 52 95 119 Provision for losses on loans and other exposures
— increase (decrease)—Note D 19 12 (66) (62) Total expenses 809 804 2,266 2,396
Income before fair value adjustment on non-trading portfolios, net and Board of Governors-approved transfers 272 191 925 827 Fair value adjustment on non-trading portfolios,
net—Notes D, E, F and K (17) (261) 425 (1,010)
Board of Governors-approved transfers—Note G — — (438) (839)
Net income (loss) $ 255 $ (70) $ 912 $ (1,022)
The Notes to Condensed Quarterly Financial Statements are an integral part of these Statements.

CONDENSED STATEMENT OF COMPREHENSIVE INCOME Expressed in millions of U.S. dollars
12 IBRD CONDENSED QUARTERLY FINANCIAL STATEMENTS: MARCH 31, 2011
Three Months Ended March 31,
(Unaudited)
Nine Months Ended March 31,
(Unaudited) 2011 2010 2011 2010
Net income (loss) $255 $ (70) $ 912 $(1,022)
Other comprehensive income—Note J Reclassification to net income:
Derivatives and hedging transition adjustment (1) (2) (9) 1 Amortization of unrecognized net actuarial loss 41 27 124 81
Amortization of unrecognized prior service cost 2 1 6 4
Currency translation adjustments 295 (331) 698 (241) Total other comprehensive income (loss) 337 (305) 819 (155)
Comprehensive income (loss) $592 $(375) $1,731 $(1,177)
CONDENSED STATEMENT OF CHANGES IN RETAINED EARNINGS Expressed in millions of U.S. dollars
Nine Months Ended March 31,
(Unaudited) 2011 2010
Retained earnings at beginning of the fiscal year $28,793 $29,870
Net income (loss) for the period 912 (1,022)
Retained earnings at end of the period $29,705 $28,848
The Notes to Condensed Quarterly Financial Statements are an integral part of these Statements.

CONDENSED STATEMENT OF CASH FLOWS Expressed in millions of U.S. dollars
IBRD CONDENSED QUARTERLY FINANCIAL STATEMENTS: MARCH 31, 2011 13
Nine Months Ended March 31,
(Unaudited) 2011 2010
Cash flows from investing activities Loans
Disbursements $(18,167) $(20,447) Principal repayments 7,441 7,941 Principal prepayments 7 1,089 Loan origination fees received 20 28
Other investing activities, net (280) (43)
Net cash used in investing activities (10,979) (11,432)
Cash flows from financing activities Medium and long-term borrowings
New issues 25,796 14,772 Retirements (15,268) (15,999)
Net short-term borrowings (9,524) 7,117 Net derivatives—Borrowings 311 164 Net derivatives—Other assets/liabilities — 16 Net capital transactions 169 399
Net cash provided by financing activities 1,484 6,469
Cash flows from operating activities Net income (loss) 912 (1,022) Adjustments to reconcile net income (loss) to net cash provided by
operating activities Fair value adjustment on non-trading portfolios, net (425) 1,010 Depreciation and amortization 622 672 Provision for losses on loans and other exposures—(decrease) (66) (62) Changes in: Investments—Trading, net 7,677 2,716 Other assets and liabilities 36 52
Net cash provided by operating activities 8,756 3,366
Effect of exchange rate changes on unrestricted cash 21 6
Net decrease in unrestricted cash (718) (1,591)
Unrestricted cash at beginning of the fiscal year 1,581 2,380
Unrestricted cash at end of the period $ 863 $ 789
Supplemental disclosure Increase (decrease) in ending balances resulting from exchange rate
fluctuations Loans outstanding $3,768 $(874) Investment portfolio 251 (7) Borrowing portfolio 2,953 (597)
Capitalized loan origination fees included in total loans 37 58 Interest paid on Borrowing portfolio 897 1,331
The Notes to Condensed Quarterly Financial Statements are an integral part of these Statements.
14 IBRD CONDENSED QUARTERLY FINANCIAL STATEMENTS: MARCH 31, 2011 (UNAUDITED)
NOTE A—SIGNIFICANT ACCOUNTING AND RELATED POLICIES
Basis of Preparation
These unaudited condensed quarterly financial statements should be read in conjunction with the June 30, 2010 audited financial statements and notes included therein. The condensed comparative information that has been derived from the June 30, 2010 audited financial statements, has not been audited. In the opinion of management, the condensed quarterly financial statements reflect all adjustments necessary for a fair presentation of IBRD's financial position and results of operations in accordance with accounting principles generally accepted in the United States of America (U.S. GAAP).
Management makes estimates and assumptions that affect the reported amounts of assets and liabilities and disclosure of contingent assets and liabilities at the date of the condensed quarterly financial statements and the reported amounts of income and expenses during the reporting periods. Due to the inherent uncertainty involved in making those estimates, actual results could differ from those estimates. Areas in which significant estimates have been made include, but are not limited to, the provision for losses on loans and other exposures, valuation of certain instruments carried at fair value, and valuation of pension and other postretirement plan-related liabilities. The results of operations for the first nine months of the current fiscal year are not necessarily indicative of results that may be expected for the full year.
Certain reclassifications of the prior period’s information have been made to conform with the current period’s presentation. In particular, as permitted under U.S. GAAP, IBRD reclassified amounts relating to Nonnegotiable, noninterest-bearing demand obligations on account of subscribed capital and Receivable amounts to maintain value of currency holdings, of $1,123 million and $171 million as of June 30, 2010, respectively, from Assets to Equity. These reclassifications had no effect on IBRD's income before fair value adjustment on non-trading portfolios, net and Board of Governors-approved transfers, or Net loss for the fiscal year ended June 30, 2010.
Accounting and Reporting Developments
The Financial Accounting Standards Board’s (FASB) Accounting Standards Update (ASU) 2009-16, Accounting for Transfers of Financial Assets - an Amendment of FAS 140 became effective on July 1, 2010. This guidance eliminates the concept of a “qualified special purpose entity” and addresses the information that a reporting entity provides in its financial reports about transfers of financial assets including: the effect of transfers on its financial position, financial performance and cash flows; and a transferor’s continuing involvement in transferred assets. The adoption of this ASU resulted in additional qualitative disclosures relating to securities lending under Note C—Investments.
ASU 2009-17, Improvements to Financial Reporting by Enterprises Involved with Variable Interest Entities, which amends existing guidance for consolidation of variable interest entities, also became effective on July 1, 2010. This ASU did not have an impact on IBRD’s financial statements.
In July 2010, FASB issued ASU 2010-20, Disclosures about the Credit Quality of Financing Receivables and the Allowance for Credit Losses. The ASU expands credit quality disclosure requirements to include more detailed information regarding financing receivables and the allowance for credit losses, as well as additional information regarding accounting policies and methodology. For IBRD, the expanded disclosures became effective for interim and annual reporting periods ending on or after December 15, 2010 (quarter ended December 31, 2010). The adoption of this ASU resulted in additional qualitative and quantitative disclosures relating to loans under Note D—Loans and Other Exposures.
In July 2010, the Dodd-Frank Wall Street Reform and Consumer Protection Act (the Act) became law in the United States. The Act seeks to reform the U.S. financial regulatory system by introducing new regulators and extending regulation over new markets, entities, and activities. The implementation of the Act is dependent on the development of various rules to clarify and interpret its requirements. Pending the development of these rules, no impact on IBRD has been determined as of March 31, 2011. IBRD continues to evaluate the potential future implications of the Act.
NOTES TO CONDENSED QUARTERLY FINANCIAL STATEMENTS
IBRD CONDENSED QUARTERLY FINANCIAL STATEMENTS: MARCH 31, 2011 (UNAUDITED) 15
NOTE B—CAPITAL STOCK
On March 16, 2011, the resolutions to increase IBRD’s authorized capital by 725,876 shares through a general capital increase, a selective capital increase and additional shares to be held for new members, were approved by the Board of Governors. At March
31, 2011, IBRD’s capital stock comprised of 2,307,600 authorized shares (1,581,724—June 30, 2010) of which 1,574,526 shares (1,574,526—June 30, 2010) were subscribed.
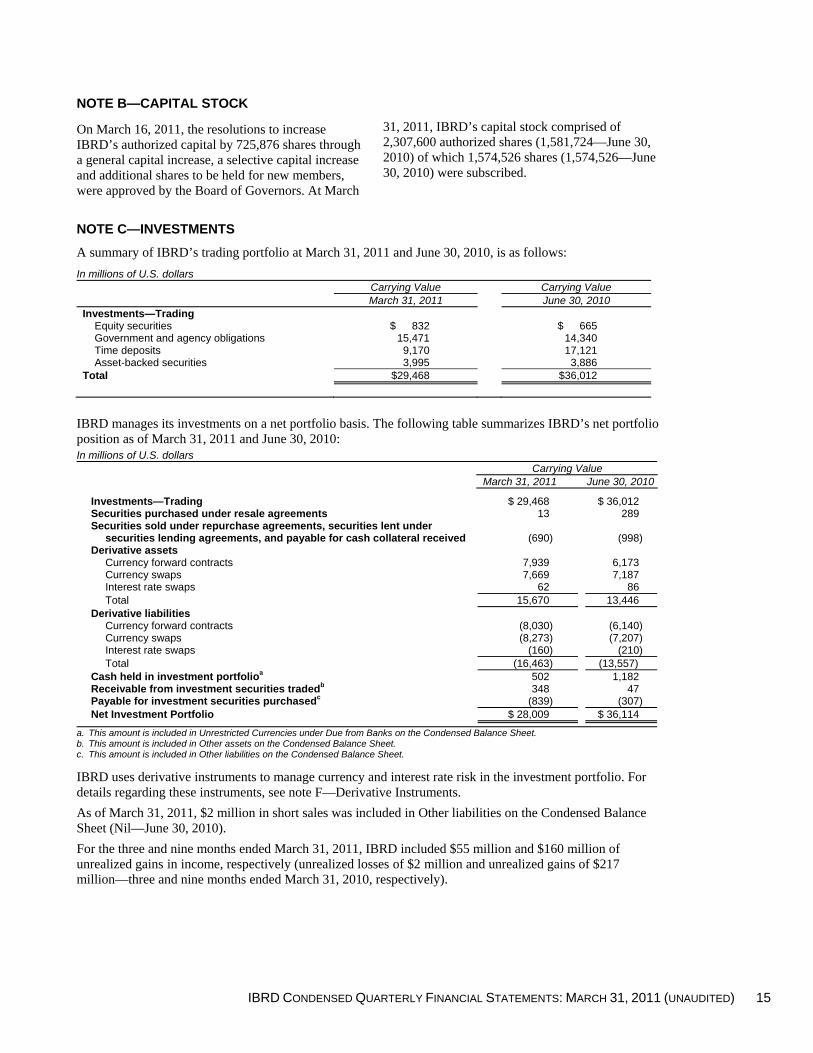
NOTE C—INVESTMENTS
A summary of IBRD’s trading portfolio at March 31, 2011 and June 30, 2010, is as follows:
In millions of U.S. dollars Carrying Value Carrying Value March 31, 2011 June 30, 2010
Investments—Trading Equity securities $ 832 $ 665 Government and agency obligations 15,471 14,340 Time deposits 9,170 17,121 Asset-backed securities 3,995 3,886
Total $29,468 $36,012
IBRD manages its investments on a net portfolio basis. The following table summarizes IBRD’s net portfolio position as of March 31, 2011 and June 30, 2010: In millions of U.S. dollars Carrying Value March 31, 2011 June 30, 2010
Investments—Trading $ 29,468 $ 36,012 Securities purchased under resale agreements 13 289 Securities sold under repurchase agreements, securities lent under
securities lending agreements, and payable for cash collateral received (690) (998) Derivative assets
Currency forward contracts 7,939 6,173 Currency swaps 7,669 7,187 Interest rate swaps 62 86 Total 15,670 13,446
Derivative liabilities Currency forward contracts (8,030) (6,140) Currency swaps (8,273) (7,207) Interest rate swaps (160) (210) Total (16,463) (13,557)
Cash held in investment portfolioa 502 1,182 Receivable from investment securities tradedb 348 47 Payable for investment securities purchasedc (839) (307) Net Investment Portfolio $ 28,009 $ 36,114
a. This amount is included in Unrestricted Currencies under Due from Banks on the Condensed Balance Sheet. b. This amount is included in Other assets on the Condensed Balance Sheet. c. This amount is included in Other liabilities on the Condensed Balance Sheet.
IBRD uses derivative instruments to manage currency and interest rate risk in the investment portfolio. For details regarding these instruments, see note F—Derivative Instruments.
As of March 31, 2011, $2 million in short sales was included in Other liabilities on the Condensed Balance Sheet (Nil—June 30, 2010).
For the three and nine months ended March 31, 2011, IBRD included $55 million and $160 million of unrealized gains in income, respectively (unrealized losses of $2 million and unrealized gains of $217 million—three and nine months ended March 31, 2010, respectively).
16 IBRD CONDENSED QUARTERLY FINANCIAL STATEMENTS: MARCH 31, 2011 (UNAUDITED)
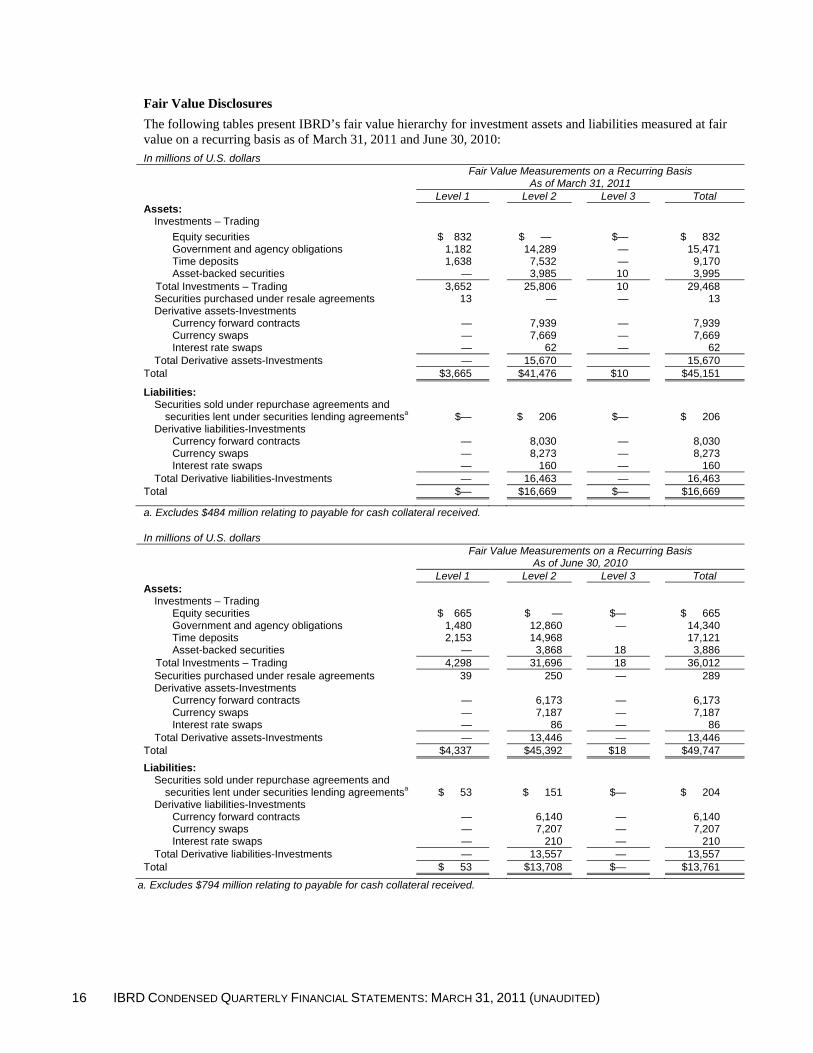
Fair Value Disclosures
The following tables present IBRD’s fair value hierarchy for investment assets and liabilities measured at fair value on a recurring basis as of March 31, 2011 and June 30, 2010: In millions of U.S. dollars
Fair Value Measurements on a Recurring Basis
As of March 31, 2011 Level 1 Level 2 Level 3 Total
Assets: Investments – Trading
Equity securities $ 832 $ — $— $ 832 Government and agency obligations 1,182 14,289 — 15,471 Time deposits 1,638 7,532 — 9,170 Asset-backed securities — 3,985 10 3,995
Total Investments – Trading 3,652 25,806 10 29,468 Securities purchased under resale agreements 13 — — 13 Derivative assets-Investments
Currency forward contracts — 7,939 — 7,939 Currency swaps — 7,669 — 7,669 Interest rate swaps — 62 — 62
Total Derivative assets-Investments — 15,670 15,670 Total $3,665 $41,476 $10 $45,151
Liabilities: Securities sold under repurchase agreements and securities lent under securities lending agreementsa $— $ 206 $— $ 206 Derivative liabilities-Investments
Currency forward contracts — 8,030 — 8,030 Currency swaps — 8,273 — 8,273 Interest rate swaps — 160 — 160
Total Derivative liabilities-Investments — 16,463 — 16,463 Total $— $16,669 $— $16,669
a. Excludes $484 million relating to payable for cash collateral received.
In millions of U.S. dollars
Fair Value Measurements on a Recurring Basis
As of June 30, 2010 Level 1 Level 2 Level 3 Total
Assets: Investments – Trading
Equity securities $ 665 $ — $— $ 665 Government and agency obligations 1,480 12,860 — 14,340 Time deposits 2,153 14,968 17,121 Asset-backed securities — 3,868 18 3,886
Total Investments – Trading 4,298 31,696 18 36,012 Securities purchased under resale agreements 39 250 — 289 Derivative assets-Investments
Currency forward contracts — 6,173 — 6,173 Currency swaps — 7,187 — 7,187 Interest rate swaps — 86 — 86
Total Derivative assets-Investments — 13,446 — 13,446 Total $4,337 $45,392 $18 $49,747
Liabilities: Securities sold under repurchase agreements and securities lent under securities lending agreementsa $ 53 $ 151 $— $ 204 Derivative liabilities-Investments
Currency forward contracts — 6,140 — 6,140 Currency swaps — 7,207 — 7,207 Interest rate swaps — 210 — 210
Total Derivative liabilities-Investments — 13,557 — 13,557 Total $ 53 $13,708 $— $13,761
a. Excludes $794 million relating to payable for cash collateral received.
IBRD CONDENSED QUARTERLY FINANCIAL STATEMENTS: MARCH 31, 2011 (UNAUDITED) 17
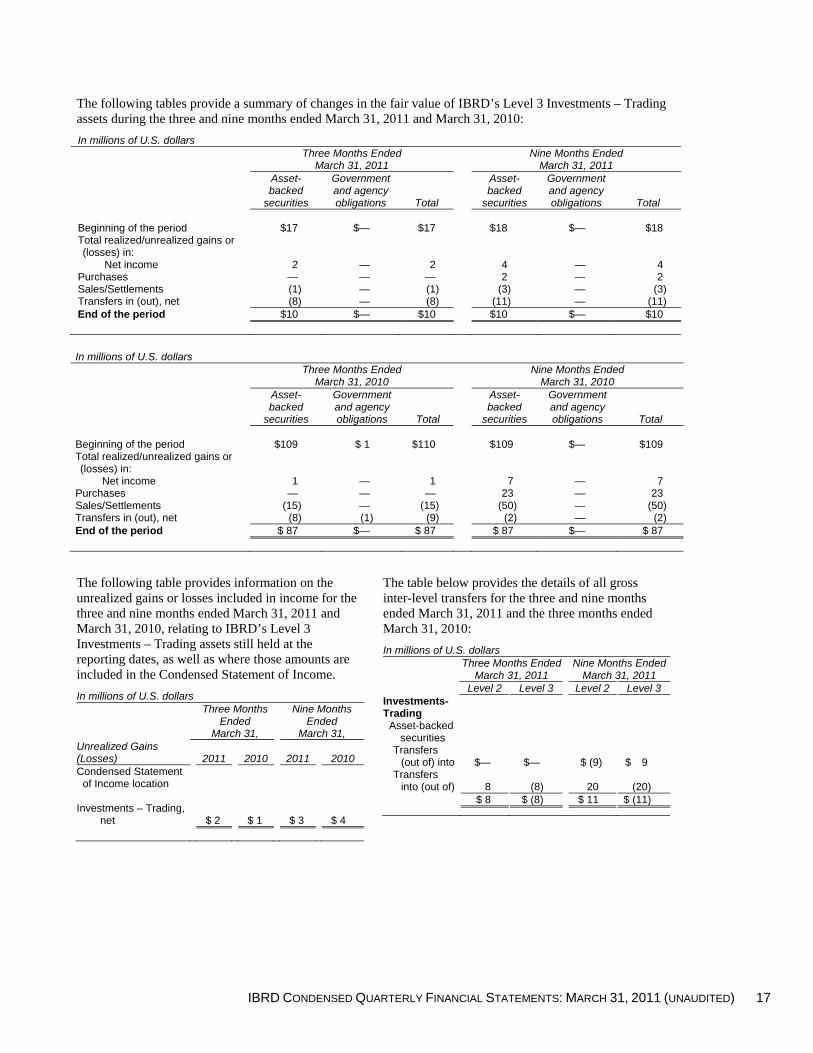
The following tables provide a summary of changes in the fair value of IBRD’s Level 3 Investments – Trading assets during the three and nine months ended March 31, 2011 and March 31, 2010:
In millions of U.S. dollars
Three Months Ended
March 31, 2011 Nine Months Ended
March 31, 2011
Asset- backed
securities
Government and agency obligations Total
Asset- backed
securities
Government and agency obligations Total
Beginning of the period $17 $— $17 $18 $— $18 Total realized/unrealized gains or (losses) in:
Net income 2 — 2 4 — 4 Purchases — — — 2 — 2 Sales/Settlements (1) — (1) (3) — (3) Transfers in (out), net (8) — (8) (11) — (11) End of the period $10 $— $10 $10 $— $10
In millions of U.S. dollars
Three Months Ended
March 31, 2010 Nine Months Ended
March 31, 2010
Asset- backed
securities
Government and agency obligations Total
Asset- backed
securities
Government and agency obligations Total
Beginning of the period $109 $ 1 $110 $109 $— $109 Total realized/unrealized gains or (losses) in:
Net income 1 — 1 7 — 7 Purchases — — — 23 — 23 Sales/Settlements (15) — (15) (50) — (50) Transfers in (out), net (8) (1) (9) (2) — (2) End of the period $ 87 $— $ 87 $ 87 $— $ 87
The following table provides information on the unrealized gains or losses included in income for the three and nine months ended March 31, 2011 and March 31, 2010, relating to IBRD’s Level 3 Investments – Trading assets still held at the reporting dates, as well as where those amounts are included in the Condensed Statement of Income.
In millions of U.S. dollars
Three Months Ended
March 31,
Nine Months Ended
March 31, Unrealized Gains (Losses)
2011 2010 2011 2010
Condensed Statement of Income location
Investments – Trading,
net $ 2 $ 1 $ 3 $ 4
The table below provides the details of all gross inter-level transfers for the three and nine months ended March 31, 2011 and the three months ended March 31, 2010:
In millions of U.S. dollars
Three Months Ended
March 31, 2011 Nine Months Ended
March 31, 2011 Level 2 Level 3 Level 2 Level 3 Investments- Trading
Asset-backed securities
Transfers (out of) into $— $— $ (9) $ 9
Transfers into (out of) 8 (8) 20 (20)
$ 8 $ (8) $ 11 $ (11)

18 IBRD CONDENSED QUARTERLY FINANCIAL STATEMENTS: MARCH 31, 2011 (UNAUDITED)
In millions of U.S. dollars
Three Months Ended
March 31, 2010 Level 2 Level 3 Investments-Trading
Asset-backed securities Transfers (out of) into $(5) $ 5 Transfers into (out of) 13 (13)
$ 8 $ (8)
Government and agency obligations Transfers into (out of) $ 1 $ (1)
Valuation Methods and Assumptions
Summarized below are the techniques applied in determining the fair values of investments.
Investment securities:
Where available, quoted market prices are used to determine the fair value of trading securities. Examples include some government securities, mutual funds, futures contracts and exchange-traded equity securities. For instruments for which market quotations are not available, fair values are determined using model-based valuation techniques, whether internally-generated or vendor-supplied, that includes the standard discounted cash flow method using market observable inputs such as yield curves, credit spreads, and prepayment speeds. Unless quoted prices are available, money market instruments (time deposits) are reported at face value which approximates fair value.
Securities purchased under resale agreements, Securities sold under repurchase agreements, Securities lent under securities lending agreements and payable for cash collateral received:
These securities are reported at face value which approximates fair value.
Commercial Credit Risk
For the purpose of risk management, IBRD is a party to a variety of financial transactions, certain of which involve elements of commercial credit risk. Credit risk exposure represents the maximum potential loss due to possible nonperformance by obligors and counterparties under the terms of the contracts for all securities. For all securities, IBRD limits trading to a list of authorized dealers and counterparties. In addition, credit limits have been established for
counterparties by types of instruments and maturity category.
Swap Agreements: For all of IBRD’s swap agreements (in addition to those in the investment portfolio), credit risk is mitigated through the application of eligibility criteria and volume limits for transactions with individual counterparties and through the use of mark-to-market collateral arrangements for swap transactions. IBRD may require collateral in the form of cash or other approved liquid securities from individual counterparties in order to mitigate its credit exposure.
IBRD has entered into master derivatives agreements which contain legally enforceable close-out netting provisions. These agreements may further reduce the gross credit risk exposure related to the swaps. Credit risk with financial assets subject to a master derivatives arrangement is further reduced under these agreements to the extent that payments and receipts with the counterparty are netted at settlement. The reduction in exposure as a result of these netting provisions can vary due to the impact of changes in market conditions on existing and new transactions. The extent of the reduction in exposure may therefore change substantially within a short period of time following the balance sheet date.
The following is a summary of the collateral received by IBRD as of March 31, 2011 and June 30, 2010.
In millions of U.S. dollars
March 31,
2011
June 30, 2010
Collateral received
Cash $ 484
$ 794 Securities 10,963
9,764
Total collateral received $11,447
$10,558
Collateral permitted to be repledged $11,447
$10,558
Amount of collateral repledged —
—
Securities Lending: IBRD may engage in securities lending and repurchases, against adequate collateral, as well as securities borrowing and reverse repurchases (resales) of government and agency obligations, and corporate and asset-backed securities. Transfers of securities by IBRD to counterparties are not accounted for as sales as the accounting criteria for the treatment as a sale have not been met. Counterparties are permitted to repledge these securities until the repurchase date.
IBRD CONDENSED QUARTERLY FINANCIAL STATEMENTS: MARCH 31, 2011 (UNAUDITED) 19
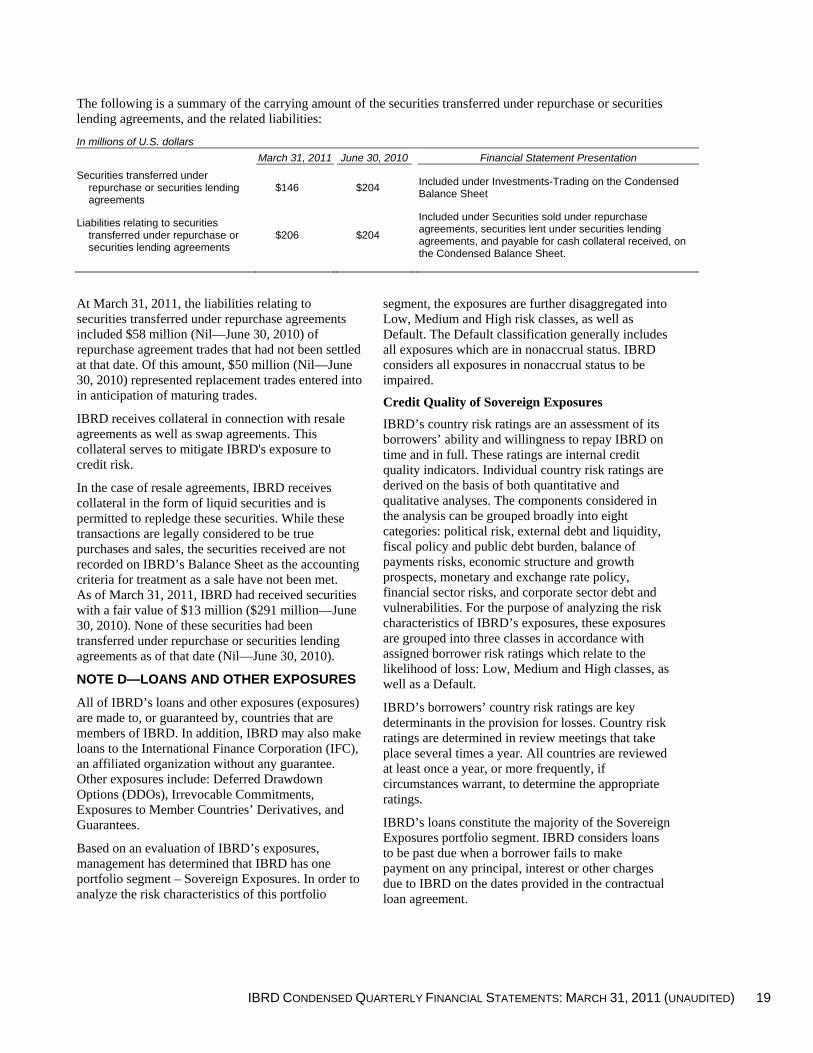
The following is a summary of the carrying amount of the securities transferred under repurchase or securities lending agreements, and the related liabilities:
In millions of U.S. dollars
March 31, 2011 June 30, 2010 Financial Statement Presentation
Securities transferred under repurchase or securities lending agreements
$146 $204 Included under Investments-Trading on the Condensed Balance Sheet
Liabilities relating to securities transferred under repurchase or securities lending agreements
$206 $204
Included under Securities sold under repurchase agreements, securities lent under securities lending agreements, and payable for cash collateral received, on the Condensed Balance Sheet.
At March 31, 2011, the liabilities relating to securities transferred under repurchase agreements included $58 million (Nil—June 30, 2010) of repurchase agreement trades that had not been settled at that date. Of this amount, $50 million (Nil—June 30, 2010) represented replacement trades entered into in anticipation of maturing trades.
IBRD receives collateral in connection with resale agreements as well as swap agreements. This collateral serves to mitigate IBRD's exposure to credit risk.
In the case of resale agreements, IBRD receives collateral in the form of liquid securities and is permitted to repledge these securities. While these transactions are legally considered to be true purchases and sales, the securities received are not recorded on IBRD’s Balance Sheet as the accounting criteria for treatment as a sale have not been met. As of March 31, 2011, IBRD had received securities with a fair value of $13 million ($291 million—June 30, 2010). None of these securities had been transferred under repurchase or securities lending agreements as of that date (Nil—June 30, 2010).
NOTE D—LOANS AND OTHER EXPOSURES
All of IBRD’s loans and other exposures (exposures) are made to, or guaranteed by, countries that are members of IBRD. In addition, IBRD may also make loans to the International Finance Corporation (IFC), an affiliated organization without any guarantee. Other exposures include: Deferred Drawdown Options (DDOs), Irrevocable Commitments, Exposures to Member Countries’ Derivatives, and Guarantees.
Based on an evaluation of IBRD’s exposures, management has determined that IBRD has one portfolio segment – Sovereign Exposures. In order to analyze the risk characteristics of this portfolio
segment, the exposures are further disaggregated into Low, Medium and High risk classes, as well as Default. The Default classification generally includes all exposures which are in nonaccrual status. IBRD considers all exposures in nonaccrual status to be impaired.
Credit Quality of Sovereign Exposures
IBRD’s country risk ratings are an assessment of its borrowers’ ability and willingness to repay IBRD on time and in full. These ratings are internal credit quality indicators. Individual country risk ratings are derived on the basis of both quantitative and qualitative analyses. The components considered in the analysis can be grouped broadly into eight categories: political risk, external debt and liquidity, fiscal policy and public debt burden, balance of payments risks, economic structure and growth prospects, monetary and exchange rate policy, financial sector risks, and corporate sector debt and vulnerabilities. For the purpose of analyzing the risk characteristics of IBRD’s exposures, these exposures are grouped into three classes in accordance with assigned borrower risk ratings which relate to the likelihood of loss: Low, Medium and High classes, as well as a Default.
IBRD’s borrowers’ country risk ratings are key determinants in the provision for losses. Country risk ratings are determined in review meetings that take place several times a year. All countries are reviewed at least once a year, or more frequently, if circumstances warrant, to determine the appropriate ratings.
IBRD’s loans constitute the majority of the Sovereign Exposures portfolio segment. IBRD considers loans to be past due when a borrower fails to make payment on any principal, interest or other charges due to IBRD on the dates provided in the contractual loan agreement.

20 IBRD CONDENSED QUARTERLY FINANCIAL STATEMENTS: MARCH 31, 2011 (UNAUDITED)
The following table provides an aging analysis of IBRD’s loans as at March 31, 2011:
In millions of U.S. dollars Days past due Up to 45 46-60 61-90 91-180 Over 180 Total Past Due Current Total Risk Class
Low $ — $ — $ — $ — $ — $ — $ 14,615 $ 14,615 Medium — — — — — — 74,219 74,219 High 1 — — 2 — 3 45,207 45,210
Loans in accrual statusa 1 — — 2 — 3 134,041 134,044
Default - Loans in nonaccrual statusa
5 — 10 2 398 415 50 465
Loan at fair valueb — — — — -— — 136 136
Total $ 6 $ — $ 10 $ 4 $398 $418 $134,227 $134,645
a. At amortized cost b. For the loan that is reported at fair value, and which is in accrual status, credit risk assessment is incorporated in the
determination of fair value.
Accumulated Provision for Losses on Loans and Other Exposures
Management determines the appropriate level of accumulated provisions for losses, which reflects the probable losses inherent in IBRD’s exposures. Probable losses comprise estimates of potential losses arising from default and nonpayment of principal amounts due, as well as present value losses. Delays in receiving loan payments result in present value losses to IBRD since it does not charge fees or additional interest on any overdue interest or charges. These present value losses are equal to the difference between the present value of payments of interest and charges made according to the related instrument's contractual terms and the present value of its expected future cash flows. It is IBRD’s practice not to write off its loans. All contractual obligations associated with exposures in nonaccrual status have eventually been cleared, thereby allowing borrowers to eventually emerge from nonaccrual status. To date, no loans have been written off. Notwithstanding IBRD’s historical experience, the risk of losses associated with nonpayment of principal amounts due is included in the accumulated provision for losses on loans and other exposures.
Several steps are taken to determine the appropriate level of provisions. First, the exposures are disaggregated into two groups: exposures in accrual status and exposures in nonaccrual status. In each group, the respective borrower’s exposures are then
assigned the credit risk rating of that borrower. With respect to countries with exposures in accrual status, these exposures are grouped according to the assigned borrower risk rating. Each risk rating is mapped to an expected default frequency (probability of default to IBRD) using IBRD's credit migration matrix which is based on IBRD’s historical experience. The provision required is calculated by multiplying the value of loans disbursed and outstanding as well as other exposures, by the expected default frequency and by the assumed severity of loss given default. The severity of loss, which is assessed periodically, is dependent on the borrower’s eligibility, namely: IBRD-only borrowers, Blend (IBRD and IDA) borrowers and IDA-only borrowers, with the highest severity of loss associated with IDA-only borrowing countries. Borrower’s eligibility is assessed at least annually. This methodology is also applied to countries with exposures in nonaccrual status. Generally, all exposures in nonaccrual status have the same risk rating.
The determination of borrowers' risk ratings is based on both quantitative and qualitative analyses of various factors. IBRD periodically reviews these factors and reassesses the adequacy of the accumulated provision accordingly. Adjustments to the accumulated provision are recorded as a charge against or addition to income.
IBRD CONDENSED QUARTERLY FINANCIAL STATEMENTS: MARCH 31, 2011 (UNAUDITED) 21
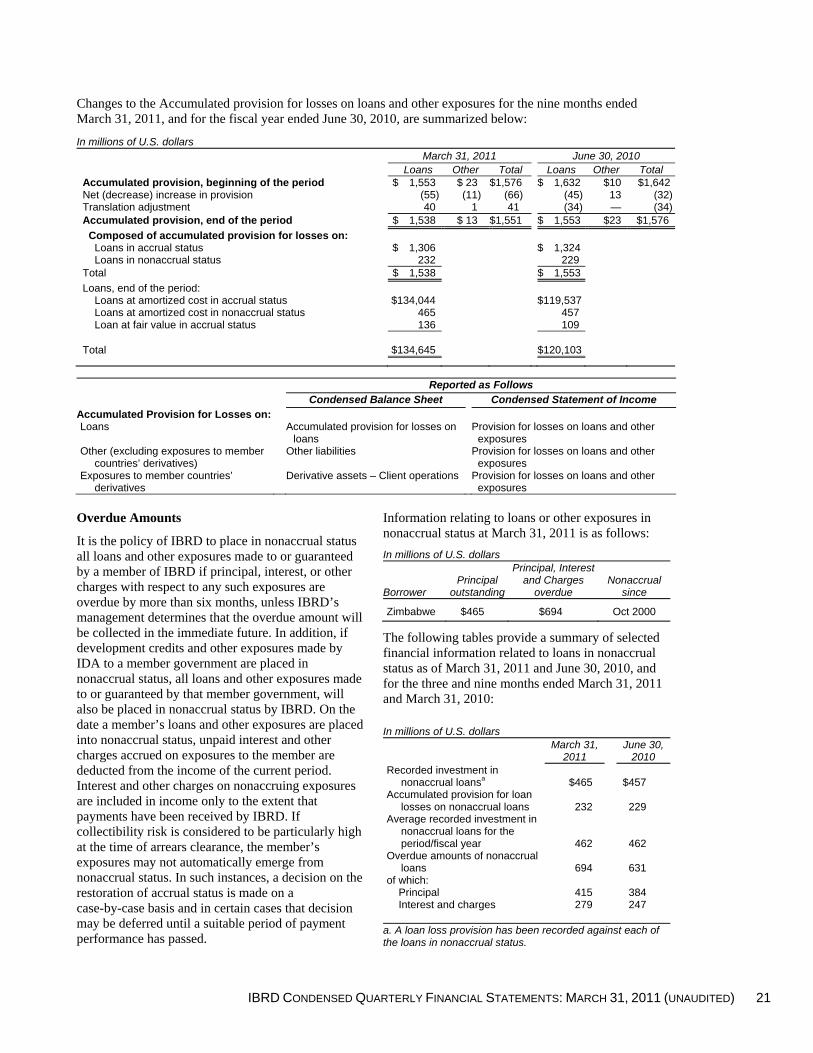
Changes to the Accumulated provision for losses on loans and other exposures for the nine months ended March 31, 2011, and for the fiscal year ended June 30, 2010, are summarized below:
In millions of U.S. dollars March 31, 2011 June 30, 2010
Loans Other Total Loans Other Total Accumulated provision, beginning of the period $ 1,553 $ 23 $1,576 $ 1,632 $10 $1,642Net (decrease) increase in provision (55) (11) (66) (45) 13 (32)Translation adjustment 40 1 41 (34) — (34)Accumulated provision, end of the period $ 1,538 $ 13 $1,551 $ 1,553 $23 $1,576
Composed of accumulated provision for losses on: Loans in accrual status $ 1,306 $ 1,324 Loans in nonaccrual status 232 229
Total $ 1,538 $ 1,553
Loans, end of the period: Loans at amortized cost in accrual status $134,044 $119,537 Loans at amortized cost in nonaccrual status 465 457 Loan at fair value in accrual status 136 109
Total $134,645
$120,103
Reported as Follows Condensed Balance Sheet Condensed Statement of Income Accumulated Provision for Losses on: Loans Accumulated provision for losses on
loans Provision for losses on loans and other
exposures Other (excluding exposures to member
countries’ derivatives) Other liabilities Provision for losses on loans and other
exposures Exposures to member countries’
derivatives Derivative assets – Client operations Provision for losses on loans and other
exposures
Overdue Amounts
It is the policy of IBRD to place in nonaccrual status all loans and other exposures made to or guaranteed by a member of IBRD if principal, interest, or other charges with respect to any such exposures are overdue by more than six months, unless IBRD’s management determines that the overdue amount will be collected in the immediate future. In addition, if development credits and other exposures made by IDA to a member government are placed in nonaccrual status, all loans and other exposures made to or guaranteed by that member government, will also be placed in nonaccrual status by IBRD. On the date a member’s loans and other exposures are placed into nonaccrual status, unpaid interest and other charges accrued on exposures to the member are deducted from the income of the current period. Interest and other charges on nonaccruing exposures are included in income only to the extent that payments have been received by IBRD. If collectibility risk is considered to be particularly high at the time of arrears clearance, the member’s exposures may not automatically emerge from nonaccrual status. In such instances, a decision on the restoration of accrual status is made on a case-by-case basis and in certain cases that decision may be deferred until a suitable period of payment performance has passed.
Information relating to loans or other exposures in nonaccrual status at March 31, 2011 is as follows:
In millions of U.S. dollars
Borrower Principal
outstanding
Principal, Interest and Charges
overdue Nonaccrual
since
Zimbabwe $465 $694 Oct 2000
The following tables provide a summary of selected financial information related to loans in nonaccrual status as of March 31, 2011 and June 30, 2010, and for the three and nine months ended March 31, 2011 and March 31, 2010:
In millions of U.S. dollars
March 31,
2011 June 30,
2010 Recorded investment in
nonaccrual loansa $465 $457 Accumulated provision for loan
losses on nonaccrual loans 232 229 Average recorded investment in
nonaccrual loans for the period/fiscal year 462 462
Overdue amounts of nonaccrual loans 694 631
of which: Principal 415 384 Interest and charges 279 247
a. A loan loss provision has been recorded against each of the loans in nonaccrual status.

22 IBRD CONDENSED QUARTERLY FINANCIAL STATEMENTS: MARCH 31, 2011 (UNAUDITED)
In millions of U.S. dollars
Three Months Ended
March 31,
Nine Months Ended
March 31, 2011 2010 2011 2010
Interest income not recognized as a result of loans being in nonaccrual status $9 $9 $27 $27
During the nine months ended March 31, 2011 and March 31, 2010, no interest income was recognized on loans in nonaccrual status and there were no loans placed in nonaccrual status or restored to accrual status.
Guarantees
Guarantees of $1,594 million were outstanding at March 31, 2011 ($1,726 million—June 30, 2010). This amount represents the maximum potential amount of undiscounted future payments that IBRD could be required to make under these guarantees, and is not included on the Condensed Balance Sheet. These guarantees have original maturities ranging between 2 and 20 years, and expire in decreasing amounts through 2029.
At March 31, 2011, liabilities of $30 million ($32 million—June 30, 2010), related to IBRD's obligations under guarantees have been included in Other liabilities on the Condensed Balance Sheet. These include the accumulated provision for guarantee losses of $3 million ($3 million—June 30, 2010).
During the nine months ended March 31, 2011, and March 31, 2010, no guarantees provided by IBRD were called.
Waivers of Loan Charges
The reduction in net income for the three and nine months ended March 31, 2011 and March 31, 2010 resulting from waivers of loan charges is summarized below:
In millions of U.S. dollars Three Months
Ended March 31,
Nine Months Ended
March 31, 2011 2010 2011 2010
Interest waivers $39 $40 $119 $124 Commitment charge
waivers 9 15 32 51 Loan origination fee
waivers 5 5 14 19 Total $53 $60 $165 $194
Segment Reporting
Based on an evaluation of IBRD’s operations, management has determined that IBRD has only one reportable segment.
For the nine months ended March 31, 2011, loans to three countries each generated in excess of 10 percent of total loan income; these amounted to $208 million, $193 million and $188 million, respectively. Loan income comprises interest, commitment fees, loan origination fees and prepayment premia, net of waivers.
Information about IBRD’s loan outstanding balances and associated loan income by geographic region, as of and for the nine months ended March 31, 2011, and March 31, 2010, is presented in the following table:
In millions of U.S. dollars March 31, 2011 March 31, 2010 Region Loans Outstanding Loan Income Loans Outstanding Loan Income
Africa $ 1,282 $ 6 $ 885 $ 9 East Asia and Pacific 26,204 385 24,886 424 Europe and Central Asia 36,518 413 31,200 449 Latin America and the Caribbean 48,635 813 41,080 813 Middle East and North Africa 9,043 124 7,902 134 South Asia 12,913 87 10,314 99 Othera 50 1 50 2 Total $134,645 $1,829 $116,317 $1,930
a. Represents loans to IFC, an affiliated organization.

IBRD CONDENSED QUARTERLY FINANCIAL STATEMENTS: MARCH 31, 2011 (UNAUDITED) 23
Fair Value Disclosures
The only loan carried at fair value is classified as Level 3. The following table provides a summary of changes in the fair value of IBRD’s Level 3 loan for the three and nine months ended March 31, 2011 and March 31, 2010:
In millions of U.S. dollars
Three Months Ended
March 31,
Nine Months Ended
March 31, 2011 2010 2011 2010
Beginning of the period $124 $104 $109 $ 78 Total unrealized gains
(losses) in: Net income 8 9 18 19 Other comprehensive income 4 (*) 9 15
End of the period $136 $112 $136 $112
* Indicates amount less than $0.5 million.
The following table provides information on the unrealized gains or losses included in income for the three and nine months ended March 31, 2011 and March 31, 2010, relating to IBRD’s Level 3 loan still held at the reporting dates, as well as where these amounts are included in the Condensed Statement of Income.
In millions of U.S. dollars
Three Months Ended
March 31,
Nine Months Ended
March 31, Unrealized Gains 2011 2010 2011 2010 Condensed Statement
of Income location Fair value adjustment
on non-trading portfolios, net $5 $7 $10 $13
The table below presents the fair value of all IBRD’s loans along with their respective carrying amounts as of March 31, 2011 and June 30, 2010:
In millions of U.S. dollars March 31, 2011 June 30, 2010
Carrying Value
Fair Value
Carrying Value
Fair Value
Net Loans Outstanding $132,639 $131,603 $118,104 $117,936
Valuation Methods and Assumptions
All of IBRD’s loans are made to or guaranteed by countries that are members of IBRD, except for those loans made to IFC. IBRD does not currently sell its loans.
As of March 31, 2011 and June 30, 2010, carrying value includes one loan with an embedded derivative, which is fair valued on a matrix basis against the related bond. All other loans are carried at amortized cost. The fair value of these loans is calculated using a discounted cash flow method. This method
incorporates Credit Default Swap spreads for each borrower. Basis adjustments are applied to market recovery levels to reflect IBRD’s recovery experience.
NOTE E—BORROWINGS The following table summarizes IBRD’s borrowings portfolio after derivatives as of March 31, 2011 and June 30, 2010.
In millions of U.S. dollars
March 31,
2011 June 30,
2010
Borrowings $133,591 $128,577 Currency swaps, net (8,407) (6,238) Interest rate swaps, net (2,573) (2,564) 122,611 $119,775
IBRD uses derivative contracts to manage the repricing risk between its loans and borrowings. For details regarding Currency swaps and Interest rate swaps, see Note F – Derivative Instruments.
Fair Value Disclosures
IBRD’s fair value hierarchy for borrowings measured at fair value on a recurring basis as of March 31, 2011 and June 30, 2010 is as follows:
In millions of U.S. dollars March 31, 2011 June 30, 2010
Level 1 $ — $ — Level 2 121,341 116,490 Level 3 12,250 12,087 $133,591 $128,577
A summary of changes in the fair value of IBRD’s Level 3 borrowings during the three and nine months ended March 31, 2011 and March 31, 2010 is presented in the following table:
In millions of U.S. dollars Three Months
Ended March 31,
Nine Months Ended
March 31, 2011 2010 2011 2010
Beginning of the period $12,300 $11,388 $12,087 $11,071
Total unrealized (gains) losses in:
Net income 63 353 (356) 382Other comprehensive income (124) (130) 834 273
Issuances 322 485 532 1,458Settlements (244) (279) (698) (690)Transfers in (out), net (67) 29 (149) (648)
End of the period $12,250 $11,846 $12,250 $11,846

24 IBRD CONDENSED QUARTERLY FINANCIAL STATEMENTS: MARCH 31, 2011 (UNAUDITED)
Information on the unrealized gains or losses included in income for the three and nine months ended March 31, 2011 and March 31, 2010, relating to IBRD’s Level 3 borrowings still held at the reporting dates, as well as where those amounts are included in the Condensed Statement of Income, is presented in the following table:
In millions of U.S. dollars
Three Months Ended
March 31,
Nine Months Ended
March 31, Unrealized Gains (Losses)
2011 2010 2011 2010
Condensed Statement of Income location
Fair value adjustment on non-trading portfolios, net $(33) $343 $393 $(344)
The following table provides information on the unrealized gains or losses included in income for the three and nine months ended March 31, 2011 and March 31, 2010, relating to IBRD’s total borrowings held at the reporting dates, as well as where those amounts are included in the Condensed Statement of Income:
In millions of U.S. dollars
Three Months Ended
March 31,
Nine Months Ended
March 31, Unrealized Gains (Losses) 2011 2010 2011 2010 Condensed Statement of Income location
Fair value adjustment on non-trading portfolios, net $996 $(1,230) $2,686 $(1,488)
The table below provides the details of all gross inter-level transfers for the three and nine months ended March 31, 2011 and three months ended March 31, 2010:
In millions of U.S. dollars
Three Months Ended
March 31, 2011 Nine Months Ended
March 31, 2011 Level 2 Level 3 Level 2 Level 3 Borrowings Transfers into (out of) $67 $(67) $149 $(149)
In millions of U.S. dollars
Three Months Ended
March 31, 2010 Level 2 Level 3 Borrowings Transfers (out of) into $ (86) $86 Transfers into (out of) 57 (57) $ (29) $29
The difference between the aggregate fair value and aggregate contractual principal balance of borrowings is as follows:
In millions of U.S. dollars
Fair Value
Principal Amount Due
Upon Maturity Difference
March 31, 2011 $133,591 $143,788 $(10,197)
June 30, 2010 $128,577 $138,074 $(9,497)
During the three months ended March 31, 2011, IBRD’s credit spreads remained largely unchanged.
During the three and nine months ended March 31, 2010, IBRD experienced improvements in its credit spreads resulting in a $161 million and $1,341 million increase, respectively, in the fair value of the debt issued and outstanding as at March 31, 2010. These amounts were determined using observable changes in IBRD's credit spreads.
Valuation Methods and Assumptions
Techniques applied in determining the fair values of debt instruments are summarized below:
Discount notes and vanilla bonds
Discount notes and vanilla bonds are valued using the standard discounted cash flow method which relies on market observable inputs such as yield curves, foreign exchange rates, basis spreads and funding spreads.
Structured bonds
Structured bonds issued by IBRD have coupon or repayment terms linked to the level or the performance of interest rates, foreign exchange rates, equity indices or commodities. The fair value of the structured bonds is derived using the discounted cash flow method based on estimated future pay-offs determined by applicable models and computation of embedded optionality such as caps, floors and calls. A wide range of industry standard models such as one factor Hull-White, Libor Market Model and Black-Scholes are used depending on the specific structure. These models incorporate market observable inputs, such as yield curves, foreign exchange rates, basis spreads, funding spreads, swaption volatilities, equity index volatilities and equity indices.
IBRD CONDENSED QUARTERLY FINANCIAL STATEMENTS: MARCH 31, 2011 (UNAUDITED) 25
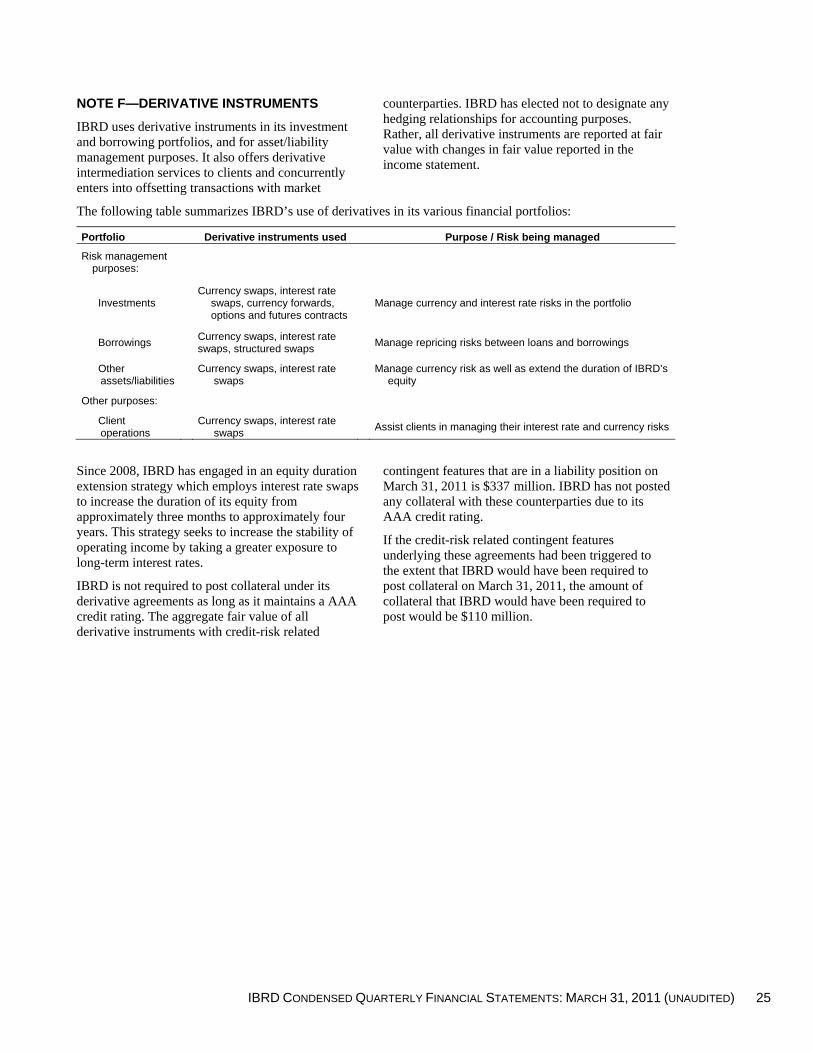
NOTE F—DERIVATIVE INSTRUMENTS
IBRD uses derivative instruments in its investment and borrowing portfolios, and for asset/liability management purposes. It also offers derivative intermediation services to clients and concurrently enters into offsetting transactions with market
counterparties. IBRD has elected not to designate any hedging relationships for accounting purposes. Rather, all derivative instruments are reported at fair value with changes in fair value reported in the income statement.
The following table summarizes IBRD’s use of derivatives in its various financial portfolios:
Portfolio Derivative instruments used Purpose / Risk being managed
Risk management purposes:
Investments Currency swaps, interest rate
swaps, currency forwards, options and futures contracts
Manage currency and interest rate risks in the portfolio
Borrowings Currency swaps, interest rate swaps, structured swaps
Manage repricing risks between loans and borrowings
Other assets/liabilities
Currency swaps, interest rate swaps
Manage currency risk as well as extend the duration of IBRD’s
equity
Other purposes:
Client operations
Currency swaps, interest rate swaps
Assist clients in managing their interest rate and currency risks
Since 2008, IBRD has engaged in an equity duration extension strategy which employs interest rate swaps to increase the duration of its equity from approximately three months to approximately four years. This strategy seeks to increase the stability of operating income by taking a greater exposure to long-term interest rates.
IBRD is not required to post collateral under its derivative agreements as long as it maintains a AAA credit rating. The aggregate fair value of all derivative instruments with credit-risk related
contingent features that are in a liability position on March 31, 2011 is $337 million. IBRD has not posted any collateral with these counterparties due to its AAA credit rating.
If the credit-risk related contingent features underlying these agreements had been triggered to the extent that IBRD would have been required to post collateral on March 31, 2011, the amount of collateral that IBRD would have been required to post would be $110 million.

26 IBRD CONDENSED QUARTERLY FINANCIAL STATEMENTS: MARCH 31, 2011 (UNAUDITED)
The following tables provide information on the fair value amounts and the location of the derivative instruments on the Condensed Balance Sheet, as well as notional amounts of those derivative instruments as of March 31, 2011 and June 30, 2010:
Fair value of derivative instruments on the Condensed Balance Sheet:
In millions of U.S. dollars
Derivative assets Derivative liabilities
Condensed Balance Sheet
location March 31,
2011 June 30,
2010
Condensed Balance Sheet
location March 31,
2011 June 30,
2010 Derivatives not
designated as hedging instruments Options and Futures
contracts– Investments Other assets $ * $ — Other liabilities $ — $ 1
Interest rate swaps Derivative
assets 6,399 7,894 Derivative
liabilities 2,257 3,080
Currency swaps (including currency forward contracts and structured swaps)
Derivative assets 124,602 113,929
Derivative liabilities 116,694 107,535
Total Derivatives $131,001 $121,823 $118,951 $110,616 * Indicates amount less than $0.5 million.
Notional amounts and credit risk exposure of the derivative instruments: In millions of U.S. dollars
March 31, 2011 June 30, 2010
Type of contract
Investments Interest rate swaps and swaptions
Notional principal $ 6,464 $ 6,641 Credit exposure 62 86
Currency swaps (including currency forward contracts) Credit exposure 57 427
Exchange traded Options and Futures contractsa Notional long position 817 1,686 Notional short position 136 35
Client operations Interest rate swaps
Notional principal 23,504 15,821 Credit exposure 291 467
Currency swaps Credit exposure 1,116 721
Borrowing portfolio Interest rate swaps
Notional principal 133,657 115,110 Credit exposure 4,418 4,857
Currency swaps Credit exposure 14,023 10,494
Other derivatives Interest rate swaps
Notional principal 37,968 36,296 Credit exposure 2,188 2,830
Currency swaps Credit exposure 191 142
a. Exchange traded instruments are generally subject to daily margin requirements and are deemed to have no material credit
risk. All outstanding options and future contracts as of March 31, 2011 and June 30, 2010 are interest rate contracts.

IBRD CONDENSED QUARTERLY FINANCIAL STATEMENTS: MARCH 31, 2011 (UNAUDITED) 27
The following table provides information on the location and amount of gains and losses on the non-trading derivatives during the three and nine months ended March 31, 2011 and March 31, 2010 and their location on the Condensed Statement of Income:
In millions of U.S. dollars
Three Months
Ended March 31, Nine Months
Ended March 31,
Condensed Statement
of Income location Gains (Losses)
Gains (Losses) 2011 2010 2011 2010 Derivatives not designated as hedging instruments, and not held in a trading portfolioa
Interest rate swaps
Fair value adjustment on non-trading portfolios, net $ (608) $472 $ (909) $305
Currency swaps
(including currency forward contracts and structured swaps)
Fair value adjustment on non-trading portfolios, net (410) 490 (1,362) 160
Total $(1,018) $962 $(2,271) $465
a. For alternative disclosures about trading derivatives, see the following table. All of the instruments in IBRD's investment portfolio are held for trading purposes. Within the investment portfolio, IBRD holds highly rated fixed income instruments, listed equity securities as well as derivatives.
The following table provides information on the amount of realized and unrealized gains and losses on the investments – trading portfolio (derivative and non-derivative instruments) and their location on the Condensed Statement of Income during the three and nine months ended March 31, 2011 and March 31, 2010:
In millions of U.S. dollars Three Months Ended March 31 Nine Months Ended March 31
Condensed Statement of Income location Investments-Trading, net Investments-Trading, net Gains (Losses) Gains (Losses)
2011 2010 2011 2010 Type of instrument
Fixed income $26 $(11) $ 14 $ 68 Equity 27 33 151 158
Total $53 $ 22 $165 $226

28 IBRD CONDENSED QUARTERLY FINANCIAL STATEMENTS: MARCH 31, 2011 (UNAUDITED)
Fair Value Disclosures
IBRD’s fair value hierarchy for derivative assets and liabilities measured at fair value on a recurring basis as of March 31, 2011 and June 30, 2010 is as follows:
In millions of U.S. dollars
Fair Value Measurements on a Recurring Basis
As of March 31, 2011 Level 1 Level 2 Level 3 Total
Derivative Assets: Investments
Currency forward contracts $— $ 7,939 $ — $ 7,939Currency swaps — 7,669 — 7,669Interest rate swaps — 62 — 62
— 15,670 — 15,670 Client operations
Currency swaps — 19,085 — 19,085Interest rate swaps — 192 — 192
— 19,277 — 19,277 Borrowings
Currency swaps — 75,293 13,871 89,164 Interest rate swaps — 4,260 43 4,303
— 79,553 13,914 93,467 Other assets/liabilities
Currency swaps — 745 — 745Interest rate swaps — 1,842 — 1,842
— 2,587 — 2,587 Total derivative assets $— $117,087 $13,914 $131,001
Derivative Liabilities: Investments
Currency forward contracts $— $ 8,030 $ — $ 8,030 Currency swaps — 8,273 — 8,273 Interest rate swaps — 160 — 160
— 16,463 — 16,463
Client operations Currency swaps — 19,080 — 19,080Interest rate swaps — 182 — 182
19,262 — 19,262 Borrowings
Currency swaps — 67,934 12,823 80,757 Interest rate swaps — 1,714 16 1,730
69,648 12,839 82,487 Other assets/liabilities
Currency swaps — 554 — 554Interest rate swaps — 185 — 185
— 739 — 739 Total derivative liabilities $— $106,112 $12,839 $118,951

IBRD CONDENSED QUARTERLY FINANCIAL STATEMENTS: MARCH 31, 2011 (UNAUDITED) 29
In millions of U.S. dollars
Fair Value Measurements on a Recurring Basis
As of June 30, 2010 Level 1 Level 2 Level 3 Total
Derivative Assets: Investments
Currency forward contracts $— $ 6,173 $ — $ 6,173 Currency swaps — 7,187 — 7,187 Interest rate swaps — 86 — 86
— 13,446 13,446 Client operations
Currency swaps — 17,205 — 17,205 Interest rate swaps — 428 — 428
17,633 17,633 Borrowings
Currency swaps — 69,347 13,320 82,667 Interest rate swaps — 4,781 9 4,790
74,128 13,329 87,457 Other assets/liabilities
Currency swaps — 697 — 697 Interest rate swaps — 2,590 — 2,590
— 3,287 — 3,287 Total derivative assets $— $108,494 $13,329 $121,823
Derivative Liabilities: Investments
Currency forward contracts $— $ 6,140 $ — $ 6,140 Currency swaps — 7,207 — 7,207 Interest rate swaps — 210 — 210
— 13,557 — 13,557 Client operations
Currency swaps — 17,203 — 17,203 Interest rate swaps — 420 — 420
— 17,623 — 17,623 Borrowings
Currency swaps — 63,823 12,606 76,429 Interest rate swaps — 2,208 18 2,226
— 66,031 12,624 78,655 Other assets/liabilities
Currency swaps — 556 — 556 Interest rate swaps — 224 — 224
— 780 — 780 Total derivative liabilities $— $97,991 $12,624 $110,615
The following tables provide a summary of changes in the fair value of IBRD’s Level 3 derivatives, net during the three and nine months ended March 31, 2011 and March 31, 2010:
In millions of U.S. dollars
Three Months Ended
March 31, 2011 Nine Months Ended
March 31, 2011
Currency Swaps
Interest Rate Swaps Total
Currency Swaps
Interest Rate Swaps Total
Beginning of the period $1,191 $22 $1,213 $ 714 $ (9) $ 705 Total realized/unrealized gains (losses) in:
Net income 44 5 49 (333) 36 (297) Other comprehensive income (136) — (136) 829 — 829
Issuances 6 — 6 4 — 4
Settlements (51) — (51) (146) — (146) Transfers in (out), net (6) * (6) (20) * (20) End of the period $1,048 $27 $1,075 $1,048 $27 $1,075
* Indicates amount less than $0.5 million.
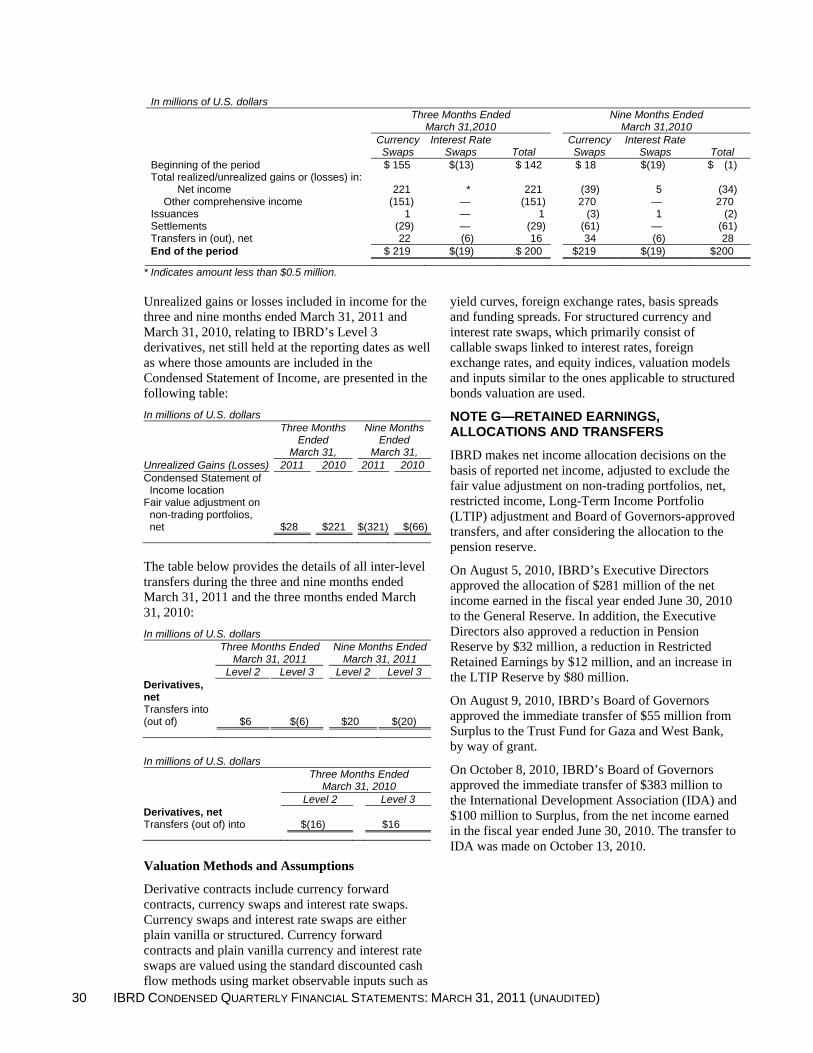
30 IBRD CONDENSED QUARTERLY FINANCIAL STATEMENTS: MARCH 31, 2011 (UNAUDITED)
In millions of U.S. dollars Three Months Ended
March 31,2010 Nine Months Ended
March 31,2010 Currency Swaps
Interest Rate Swaps Total
Currency Swaps
Interest Rate Swaps Total
Beginning of the period $ 155 $(13) $ 142 $ 18 $(19) $ (1) Total realized/unrealized gains or (losses) in: Net income 221 * 221 (39) 5 (34)
Other comprehensive income (151) — (151) 270 — 270 Issuances 1 — 1 (3) 1 (2) Settlements (29) — (29) (61) — (61) Transfers in (out), net 22 (6) 16 34 (6) 28 End of the period $ 219 $(19) $ 200 $219 $(19) $200
* Indicates amount less than $0.5 million. Unrealized gains or losses included in income for the three and nine months ended March 31, 2011 and March 31, 2010, relating to IBRD’s Level 3 derivatives, net still held at the reporting dates as well as where those amounts are included in the Condensed Statement of Income, are presented in the following table:
In millions of U.S. dollars
Three Months Ended
March 31,
Nine Months Ended
March 31, Unrealized Gains (Losses) 2011 2010 2011 2010 Condensed Statement of
Income location Fair value adjustment on
non-trading portfolios, net $28 $221 $(321) $(66)
The table below provides the details of all inter-level transfers during the three and nine months ended March 31, 2011 and the three months ended March 31, 2010:
In millions of U.S. dollars
Three Months Ended
March 31, 2011 Nine Months Ended
March 31, 2011 Level 2 Level 3 Level 2 Level 3 Derivatives, net Transfers into (out of) $6 $(6) $20 $(20)
In millions of U.S. dollars
Three Months Ended
March 31, 2010 Level 2 Level 3 Derivatives, net Transfers (out of) into $(16) $16
Valuation Methods and Assumptions
Derivative contracts include currency forward contracts, currency swaps and interest rate swaps. Currency swaps and interest rate swaps are either plain vanilla or structured. Currency forward contracts and plain vanilla currency and interest rate swaps are valued using the standard discounted cash flow methods using market observable inputs such as
yield curves, foreign exchange rates, basis spreads and funding spreads. For structured currency and interest rate swaps, which primarily consist of callable swaps linked to interest rates, foreign exchange rates, and equity indices, valuation models and inputs similar to the ones applicable to structured bonds valuation are used.
NOTE G—RETAINED EARNINGS, ALLOCATIONS AND TRANSFERS
IBRD makes net income allocation decisions on the basis of reported net income, adjusted to exclude the fair value adjustment on non-trading portfolios, net, restricted income, Long-Term Income Portfolio (LTIP) adjustment and Board of Governors-approved transfers, and after considering the allocation to the pension reserve.
On August 5, 2010, IBRD’s Executive Directors approved the allocation of $281 million of the net income earned in the fiscal year ended June 30, 2010 to the General Reserve. In addition, the Executive Directors also approved a reduction in Pension Reserve by $32 million, a reduction in Restricted Retained Earnings by $12 million, and an increase in the LTIP Reserve by $80 million.
On August 9, 2010, IBRD’s Board of Governors approved the immediate transfer of $55 million from Surplus to the Trust Fund for Gaza and West Bank, by way of grant.
On October 8, 2010, IBRD’s Board of Governors approved the immediate transfer of $383 million to the International Development Association (IDA) and $100 million to Surplus, from the net income earned in the fiscal year ended June 30, 2010. The transfer to IDA was made on October 13, 2010.

IBRD CONDENSED QUARTERLY FINANCIAL STATEMENTS: MARCH 31, 2011 (UNAUDITED) 31
Retained earnings comprise the following elements at March 31, 2011 and June 30, 2010:
In millions of U.S. dollars
March 31,
2011 June 30,
2010 Special Reserve $ 293 $ 293 General Reserve 25,951 25,670 Pension Reserve 1,248 1,280 Surplus 302 257 LTIP Reserve 116 36 Cumulative fair value adjustmentsa 436 1,475 Unallocated Net Income (Loss) 1,350 (239)Restricted Retained Earnings 9 21 Total $29,705 $28,793
a. Applicable to non-trading portfolios reported at fair value.
NOTE H—PENSION AND OTHER POST RETIREMENT BENEFITS
IBRD, IFC and the Multilateral Investment Guarantee Agency (MIGA) participate in a defined benefit Staff Retirement Plan (SRP), a Retired Staff Benefits Plan (RSBP) and a Post-Employment Benefits Plan (PEBP) that cover substantially all of their staff members.
All costs, assets and liabilities associated with these pension plans are allocated between IBRD, IFC and MIGA based upon their employees’ respective participation in the plans. Costs allocated to IBRD are then shared between IBRD and IDA based on an agreed cost sharing ratio. The net periodic pension cost (credit) for the SRP, RSBP and PEPB is included in Administrative Expenses.
The following tables summarize the benefit costs associated with the SRP, RSBP, and PEBP for IBRD and IDA for the three and nine months ended March 31, 2011 and March 31, 2010:
In millions of U.S. dollars
Three Months Ended
March 31, 2011 Nine Months Ended
March 31, 2011 SRP RSBP PEBP SRP RSBP PEBP Benefit Costs
Service cost $ 69 $ 14 $ 5 $207 $41 $15 Interest cost 158 26 6 473 77 19 Expected return on plan assets (182) (24) — (546) (71) — Amortization of prior service cost (credit) 2 (*) * 5 (*) 1 Amortization of unrecognized net loss 29 9 3 87 28 9 Net periodic pension cost $ 76 $ 25 $14 $226 $75 $44 of which:
IBRD’s Share $35 $12 $7 $107 $35 $21 IDA’s Share $41 $13 $7 $119 $40 $23
In millions of U.S. dollars
Three Months Ended
March 31, 2010 Nine Months Ended
March 31, 2010 SRP RSBP PEBP SRP RSBP PEBP Benefit Costs
Service cost $ 55 $ 11 $ 4 $ 167 $ 32 $12 Interest cost 164 25 6 491 74 20 Expected return on plan assets (190) (23) — (569) (68) — Amortization of prior service cost (credit) 2 (*) * 5 (1) * Amortization of unrecognized net loss 17 7 3 51 22 8 Net periodic pension cost $ 48 $ 20 $13 $ 145 $ 59 $40 of which:
IBRD’s Share $ 23 $ 10 $ 6 $ 71 $ 29 $20 IDA’s Share $ 25 $ 10 $ 7 $ 74 $ 30 $20
* Indicates amount less than $0.5 million.

32 IBRD CONDENSED QUARTERLY FINANCIAL STATEMENTS: MARCH 31, 2011 (UNAUDITED)
NOTE I—TRANSACTIONS WITH AFFILIATED ORGANIZATIONS
IBRD transacts with affiliated organizations by providing loans, administrative and derivative intermediation services, as well as through its pension and other postretirement benefit plans.
At March 31, 2011 and June 30, 2010, IBRD had the following receivables from (payables to) its affiliated organizations.
In millions of U.S. dollars March 31, 2011
Loans Administrative
Services
Derivative Transactionsa
Pension and Other Postretirement
Benefits TotalReceivable Payable IDA $— $312 $3,780 $(3,649) $(1,019) $ (576) IFC 50 32 — — (87) (5) MIGA — 3 — — (4) (1) $50 $347 $3,780 $(3,649) $(1,110) $ (582)
In millions of U.S. dollars June 30, 2010
Loans Administrative
Services
Derivative Transactionsa
Pension and Other Postretirement
Benefits Total Receivable Payable IDA $— $357 $4,144 $(4,087) $(1,088) $(674) IFC 50 25 — — (86) (11) MIGA — 3 — — (4) (1) $50 $385 $4,144 $(4,087) $(1,178) $(686)
a. For details on derivative transactions relating to the client operations, see Note F—Derivative Instruments. The (payables to) receivables from these affiliated organizations are reported in the Condensed Balance Sheet as follows:
Receivables / Payables related to: Reported as: Loans Loans outstanding Receivable for administrative services Other assets Receivables (payables) for derivative transactions Derivative assets/liabilities – Client operations Payable for pension and other postretirement benefits Other liabilities
Loans
IBRD has a Local Currency Loan Facility Agreement with IFC which is capped at $300 million. At March 31, 2011 and June 30, 2010, the loan balance under this facility amounted to $50 million at a fixed interest rate of 3.96%. This loan is not eligible for interest waivers.
Administrative expenses
For the three and nine months ended March 31, 2011, IBRD’s administrative expenses are net of the share of expenses allocated to IDA of $288 million and $873 million, respectively ($264 million and $785 million—three and nine months ended March 31, 2010). The allocation of expenses between IBRD and IDA is based on an agreed cost sharing ratio, and amounts are settled quarterly.
Other income
For the three and nine months ended March 31, 2011 and March 31, 2010, the amount of fee revenue
associated with services provided to affiliated organizations is included in Other Income on the Condensed Statement of Income, as follows: In millions of U.S. dollars
Three Months Ended
March 31, Nine Months Ended
March 31, 2011 2010 2011 2010 Fees charged to IFC $21 $19 $57 $49 Fees charged to MIGA 2 2 7 6
NOTE J—COMPREHENSIVE INCOME / LOSS
Comprehensive income comprises the effects of the transition adjustment on adoption of a new accounting standard on derivatives and hedging on July 1, 2000, currency translation adjustments, pension-related items and net income. These items are presented in the Condensed Statement of Comprehensive Income.

IBRD CONDENSED QUARTERLY FINANCIAL STATEMENTS: MARCH 31, 2011 (UNAUDITED) 33
The following tables present the changes in Accumulated Other Comprehensive Income balances for the nine months ended March 31, 2011 and March 31, 2010:
In millions of U.S. dollars Accumulated Other Comprehensive Income / Loss Nine months Ended March 31, 2011
Cumulative Translation Adjustment
Cumulative Effect of
Change in Accounting Principle,
Neta Reclassificationa
Unrecognized Net Actuarial (Loss) Gain on Benefit
Plans
Unrecognized Net Prior
Service (Cost) Credit on
Benefit Plans
Total Accumulated
Other Comprehensive
Loss Balance, beginning of the fiscal year $224 $500 $(511) $(3,219) $(37) $(3,043) Changes from period activity 698 — (9) 124 6 819 Balance, end of the period $922 $500 $(520) $(3,095) $(31) $(2,224)
In millions of U.S. dollars Accumulated Other Comprehensive Income / Loss Nine months Ended March 31, 2010
Cumulative Translation Adjustment
Cumulative Effect of
Change in Accounting Principle,
Neta Reclassificationa
Unrecognized Net Actuarial (Loss) Gain on Benefit
Plans
Unrecognized Net Prior
Service (Cost) Credit on
Benefit Plans
Total Accumulated
Other Comprehensive
Loss Balance, beginning of the fiscal year $860 $500 $(505) $(2,495) $(43) $(1,683) Changes from period activity (241) — 1 81 4 (155) Balance, end of the period $619 $500 $(504) $(2,414) $(39) $(1,838)
a. The cumulative effect of change in accounting principle and subsequent reclassification to net income relates to the adoption of FASB’s guidance on derivatives and hedging on July 1, 2000.
NOTE K—OTHER FAIR VALUE DISCLOSURES
The table below presents IBRD’s estimates of fair value of its financial assets and liabilities along with their respective carrying amounts as of March 31, 2011 and June 30, 2010.
In millions of U.S. dollars March 31, 2011 June 30, 2010
Carrying Value Fair Value Carrying Value Fair ValueDue from Banks $ 1,061 $ 1,061 $ 1,803 $ 1,803 Investments 29,481 29,481 36,301 36,301 Net Loans Outstanding 132,639 131,603 118,104 117,936 Derivative Assets
Investments 15,670 15,670 13,446 13,446 Client operations 19,277 19,277 17,633 17,633 Borrowings 93,467 93,467 87,457 87,457 Other assets/liabilities 2,587 2,587 3,287 3,287
Borrowings 133,591 133,572a 128,577 128,563a Derivative Liabilities
Investments 16,463 16,463 13,557 13,557 Client operations 19,262 19,262 17,623 17,623 Borrowings 82,487 82,487 78,655 78,655 Other assets/liabilities 739 739 780 780
a. Includes $19 million ($14 million — June 30, 2010) relating to transition adjustment on adoption of FASB’s guidance on derivatives and hedging on July 1, 2000.
Valuation Methods and Assumptions
As of March 31, 2011 and June 30, 2010, IBRD had no assets or liabilities measured at fair value on a non-recurring basis.
For valuation methods and assumptions of the following items refer to the respective notes as follows:
Investments: See Note C
Loans and other exposures: See Note D
Borrowings: See Note E
Derivative instruments: See Notes C and F
Due from Banks: The carrying amount of unrestricted and restricted currencies is considered a reasonable estimate of the fair value of these positions.

34 IBRD CONDENSED QUARTERLY FINANCIAL STATEMENTS: MARCH 31, 2011 (UNAUDITED)
Fair Value Adjustment on Non-Trading Portfolios, Net
The following table reflects the components of the fair value adjustment on non-trading portfolios, net, for the three and nine months ended March 31, 2011 and March 31, 2010. In millions of U.S. dollars Three months Ended March 31, Nine months Ended March 31, 2011 2010 2011 2010 Fair value adjustments, net— gains (losses):
Borrowings—Note E $ 996 $(1,230) $ 2,686 $(1,488) Derivatives—Note F
Borrowings derivatives (612) 683 (1,519) 296 Other assets/liabilities derivatives (408) 278 (753) 168 Client operations derivatives 2 1 1 1
Loan—Note D 5 7 10 13 Total $ (17) $ (261) $ 425 $(1,010)
35
REPORT OF INDEPENDENT ACCOUNTANTS