Chronology of pluton emplacement and regional deformation in the ...
St-Blanquat et al., B.G.S.A., 2001, vol. 113; Data Repository Document 2001078. Page 1 of 18
Internal structure and emplacement of the Papoose Flatpluton: an integrated structural, petrographic andmagnetic susceptibility study_____________________________________________________________________________
Michel de Saint-Blanquat* CNRS - UMR 5563 Mécanismes de Transfert en Géologie, Observatoire Midi-Pyrénées / Université Paul-Sabatier, 38 rue des 36-Ponts, F-31400 Toulouse, France.
Richard D. Law Department of Geological Sciences, Virginia Tech., Blacksburg, Virginia 24061-0420, U.S.A.
Jean-Luc Bouchez UMR 5563 Mécanismes de Transfert en Géologie, Observatoire Midi-Pyrénées / Université Paul-Sabatier, 38 rue des 36-Ponts, F-31400 Toulouse, France.
Sven S. Morgan Department of Geology, Central Michigan University,Mount Pleasant, Michigan 48859, U.S.A.
Corresponding author; [email protected]
DATA REPOSITORY MATERIAL
MICROSTRUCTURES WITHIN THE PLUTON
Shear sense indicators and strain-path partitioning
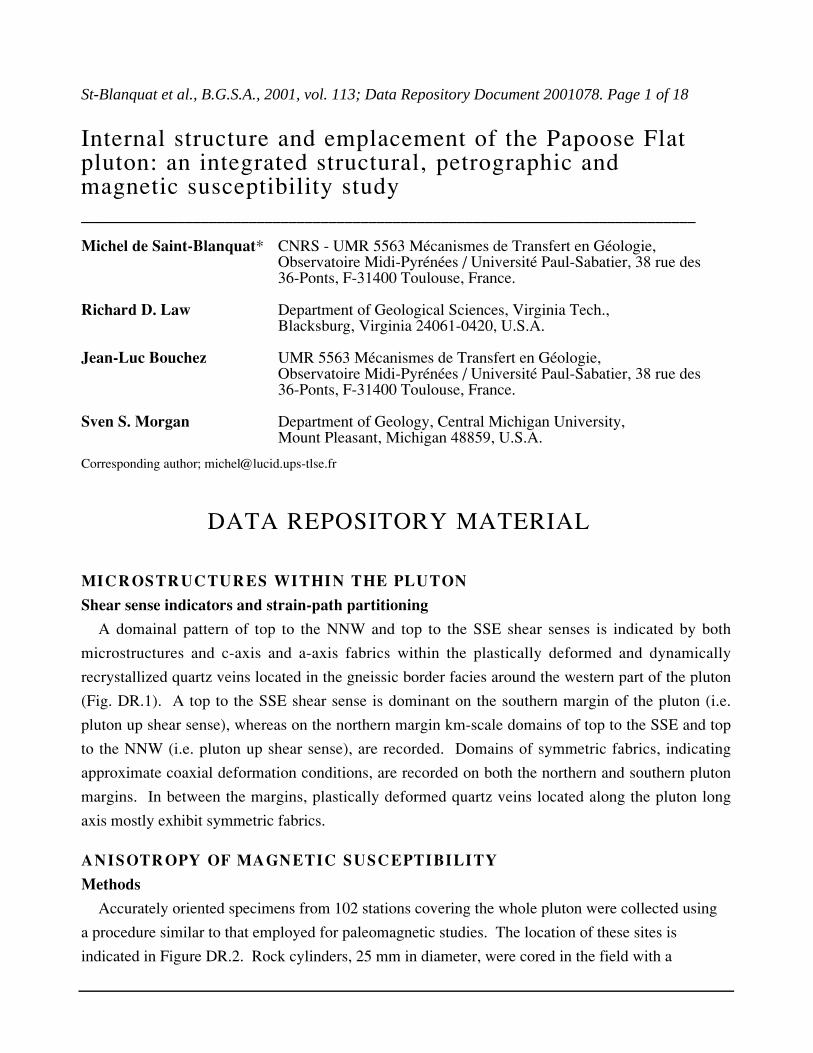
A domainal pattern of top to the NNW and top to the SSE shear senses is indicated by both
microstructures and c-axis and a-axis fabrics within the plastically deformed and dynamically
recrystallized quartz veins located in the gneissic border facies around the western part of the pluton
(Fig. DR.1). A top to the SSE shear sense is dominant on the southern margin of the pluton (i.e.
pluton up shear sense), whereas on the northern margin km-scale domains of top to the SSE and top
to the NNW (i.e. pluton up shear sense), are recorded. Domains of symmetric fabrics, indicating
approximate coaxial deformation conditions, are recorded on both the northern and southern pluton
margins. In between the margins, plastically deformed quartz veins located along the pluton long
axis mostly exhibit symmetric fabrics.
ANISOTROPY OF MAGNETIC SUSCEPTIBILITY
Methods
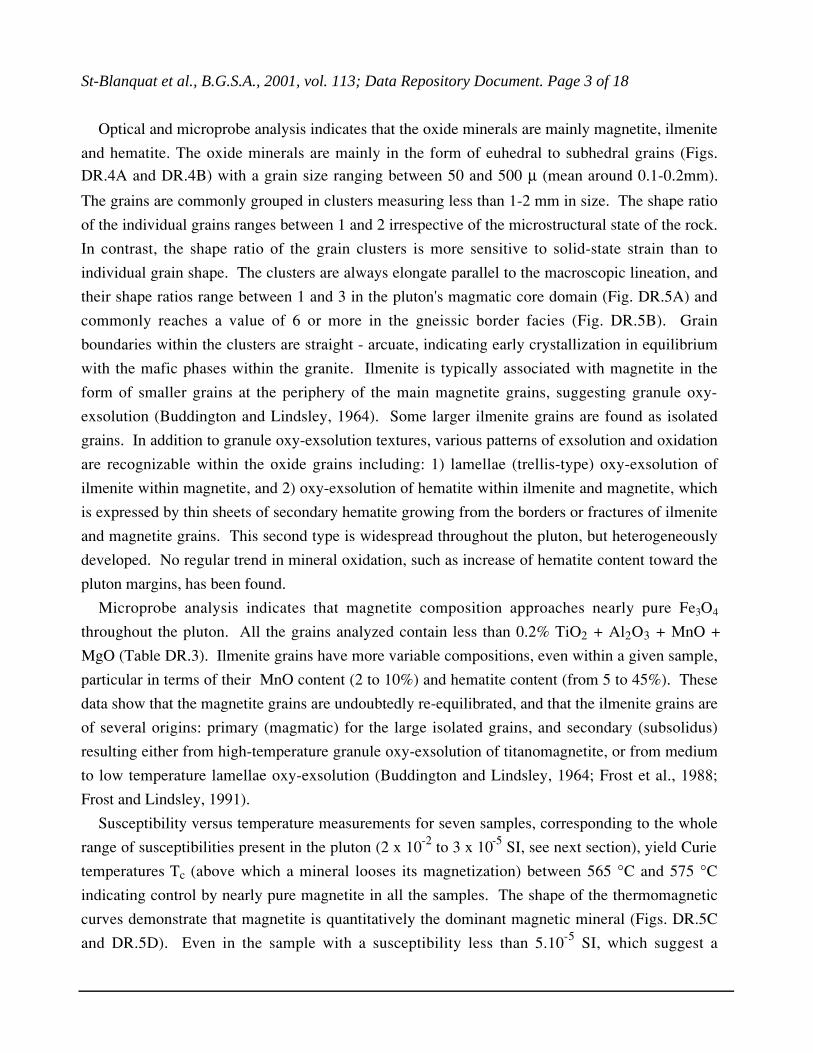
Accurately oriented specimens from 102 stations covering the whole pluton were collected using
a procedure similar to that employed for paleomagnetic studies. The location of these sites is
indicated in Figure DR.2. Rock cylinders, 25 mm in diameter, were cored in the field with a

St-Blanquat et al., B.G.S.A., 2001, vol. 113; Data Repository Document. Page 2 of 18
portable drill and oriented using a magnetic compass. Two or three cores were drilled per station
and were cut into 22 mm-long samples. 548 samples were measured (5 samples per site).
Magnetic measurements were performed using a Kappabridge KLY-2, manufactured by Agico
(Brno, Czech Republic). The orientation and magnitude of the three principal axes of the AMS
ellipsoid, k1 ≥ k2 ≥ k3 for each sample were calculated from the bulk susceptibility data and the
orientation of the sample using the ANISOFT package (Jelinek, 1977). The tensor means of the
sample data within each site were computed with the program EXAMS (Saint-Blanquat, 1993),
giving the bulk magnetic susceptibility magnitude of the site, the orientation and intensity of the
three main susceptibility axes K1 > K2 > K3, and the usual intensity (P%, F%, L%) and shape (T)
parameters (definitions given in caption to Table DR.1). For each site, the orientation variability
was computed as the standard deviation of the angular difference between individual samples and
the site mean orientation. Primary data from our AMS study of the Papoose Flat pluton are
presented in Table DR.1. Averaged values incorporating all data from the magmatic (M), high-
temperature solid-state (H), and medium temperature (ML) microstructural domains are given in
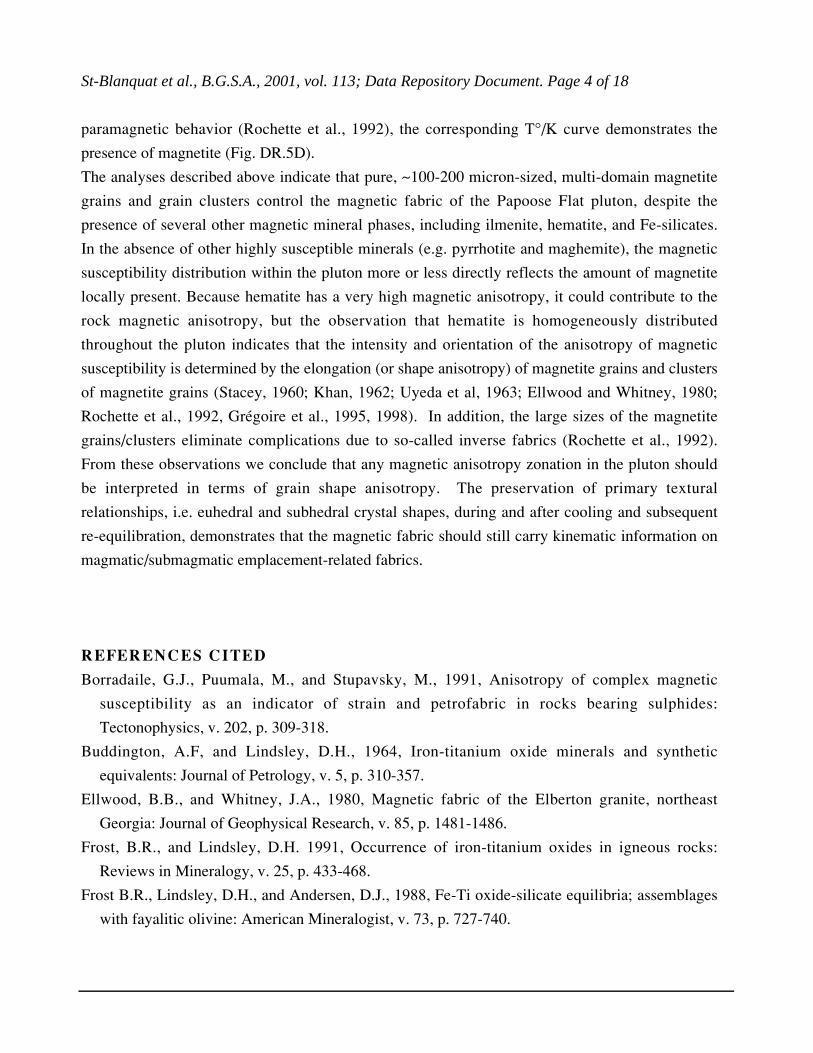
Table DR.2. The relationship between scalar AMS parameters is presented in Figure DR.3, and the
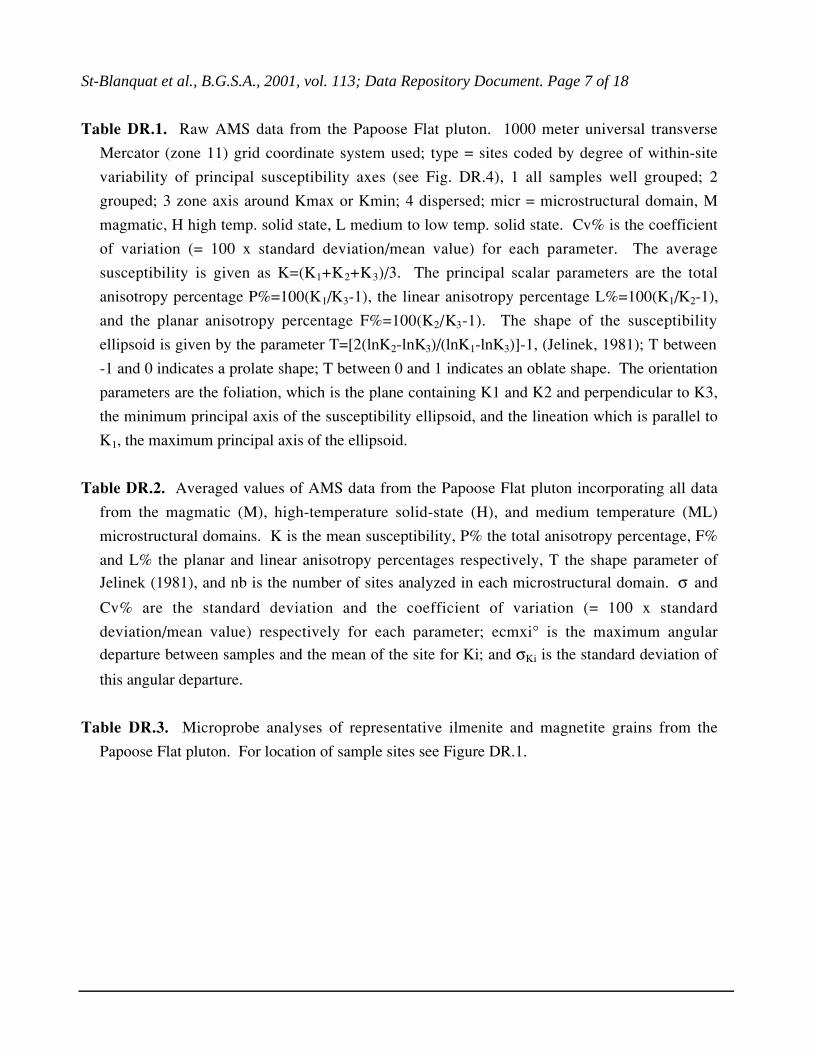
quality assessment of directional data on Figure DR.4.
Source of AMS signature
The relationship between the fabric of a rock sample and its magnetic fabric depends on the
nature of the magnetic (Fe bearing) minerals, and on the textural relationships among the mineral
grains (Rochette, 1987; Jover et al., 1989; Borradaile et al., 1991; Rochette et al., 1992). If a
sample contains more than one magnetic mineral, then the magnetic fabric becomes a composite of
two or more subfabrics. Therefore interpreting AMS data requires careful identification and
characterization of all the magnetic minerals contributing to the AMS signal. In magnetite-type
granites (Ishihara, 1977), like the Papoose Flat pluton, the paramagnetic contribution of Fe-Mg
silicates is negligible with respect to the ferromagnetic contribution, because of the high intrinsic
magnetic susceptibility of magnetite, so only the oxide minerals need to be carefully identified. It
is well know in plutonic rocks, however, that oxide minerals can suffer important sub-solidus re-
equilibration (Frost et al., 1988; Frost and Lindsley, 1991). Thus the status of these minerals,
mainly primary versus secondary, must be determined before any quantitative kinematic
interpretation of the AMS signature of a rock sample can be made. We have investigated the
magnetic mineralogy of the Papoose Flat pluton through examination of polished thin sections
using reflected light microscopy (15 samples), microprobe analysis (10 samples, 71 analyses), and
measurement of the relationship between susceptibility and temperature (relative to known Curie
temperatures for specific minerals) for seven samples spanning the whole range of magnetic
susceptibilities present in the pluton.
St-Blanquat et al., B.G.S.A., 2001, vol. 113; Data Repository Document. Page 3 of 18
Optical and microprobe analysis indicates that the oxide minerals are mainly magnetite, ilmenite
and hematite. The oxide minerals are mainly in the form of euhedral to subhedral grains (Figs.
DR.4A and DR.4B) with a grain size ranging between 50 and 500 µ (mean around 0.1-0.2mm).
The grains are commonly grouped in clusters measuring less than 1-2 mm in size. The shape ratio
of the individual grains ranges between 1 and 2 irrespective of the microstructural state of the rock.
In contrast, the shape ratio of the grain clusters is more sensitive to solid-state strain than to
individual grain shape. The clusters are always elongate parallel to the macroscopic lineation, and
their shape ratios range between 1 and 3 in the pluton's magmatic core domain (Fig. DR.5A) and
commonly reaches a value of 6 or more in the gneissic border facies (Fig. DR.5B). Grain
boundaries within the clusters are straight - arcuate, indicating early crystallization in equilibrium
with the mafic phases within the granite. Ilmenite is typically associated with magnetite in the
form of smaller grains at the periphery of the main magnetite grains, suggesting granule oxy-
exsolution (Buddington and Lindsley, 1964). Some larger ilmenite grains are found as isolated
grains. In addition to granule oxy-exsolution textures, various patterns of exsolution and oxidation
are recognizable within the oxide grains including: 1) lamellae (trellis-type) oxy-exsolution of
ilmenite within magnetite, and 2) oxy-exsolution of hematite within ilmenite and magnetite, which
is expressed by thin sheets of secondary hematite growing from the borders or fractures of ilmenite
and magnetite grains. This second type is widespread throughout the pluton, but heterogeneously
developed. No regular trend in mineral oxidation, such as increase of hematite content toward the
pluton margins, has been found.
Microprobe analysis indicates that magnetite composition approaches nearly pure Fe3O4
throughout the pluton. All the grains analyzed contain less than 0.2% TiO2 + Al2O3 + MnO +
MgO (Table DR.3). Ilmenite grains have more variable compositions, even within a given sample,
particular in terms of their MnO content (2 to 10%) and hematite content (from 5 to 45%). These
data show that the magnetite grains are undoubtedly re-equilibrated, and that the ilmenite grains are
of several origins: primary (magmatic) for the large isolated grains, and secondary (subsolidus)
resulting either from high-temperature granule oxy-exsolution of titanomagnetite, or from medium
to low temperature lamellae oxy-exsolution (Buddington and Lindsley, 1964; Frost et al., 1988;
Frost and Lindsley, 1991).
Susceptibility versus temperature measurements for seven samples, corresponding to the whole
range of susceptibilities present in the pluton (2 x 10⁻² to 3 x 10⁻⁵ SI, see next section), yield Curie
temperatures Tc (above which a mineral looses its magnetization) between 565 °C and 575 °C
indicating control by nearly pure magnetite in all the samples. The shape of the thermomagnetic
curves demonstrate that magnetite is quantitatively the dominant magnetic mineral (Figs. DR.5C
and DR.5D). Even in the sample with a susceptibility less than 5.10-5 SI, which suggest a
St-Blanquat et al., B.G.S.A., 2001, vol. 113; Data Repository Document. Page 4 of 18
paramagnetic behavior (Rochette et al., 1992), the corresponding T°/K curve demonstrates the
presence of magnetite (Fig. DR.5D).
The analyses described above indicate that pure, ~100-200 micron-sized, multi-domain magnetite
grains and grain clusters control the magnetic fabric of the Papoose Flat pluton, despite the
presence of several other magnetic mineral phases, including ilmenite, hematite, and Fe-silicates.
In the absence of other highly susceptible minerals (e.g. pyrrhotite and maghemite), the magnetic
susceptibility distribution within the pluton more or less directly reflects the amount of magnetite
locally present. Because hematite has a very high magnetic anisotropy, it could contribute to the
rock magnetic anisotropy, but the observation that hematite is homogeneously distributed
throughout the pluton indicates that the intensity and orientation of the anisotropy of magnetic
susceptibility is determined by the elongation (or shape anisotropy) of magnetite grains and clusters
of magnetite grains (Stacey, 1960; Khan, 1962; Uyeda et al, 1963; Ellwood and Whitney, 1980;
Rochette et al., 1992, Grégoire et al., 1995, 1998). In addition, the large sizes of the magnetite
grains/clusters eliminate complications due to so-called inverse fabrics (Rochette et al., 1992).
From these observations we conclude that any magnetic anisotropy zonation in the pluton should
be interpreted in terms of grain shape anisotropy. The preservation of primary textural
relationships, i.e. euhedral and subhedral crystal shapes, during and after cooling and subsequent
re-equilibration, demonstrates that the magnetic fabric should still carry kinematic information on
magmatic/submagmatic emplacement-related fabrics.
REFERENCES CITED
Borradaile, G.J., Puumala, M., and Stupavsky, M., 1991, Anisotropy of complex magnetic
susceptibility as an indicator of strain and petrofabric in rocks bearing sulphides:
Tectonophysics, v. 202, p. 309-318.
Buddington, A.F, and Lindsley, D.H., 1964, Iron-titanium oxide minerals and synthetic
equivalents: Journal of Petrology, v. 5, p. 310-357.
Ellwood, B.B., and Whitney, J.A., 1980, Magnetic fabric of the Elberton granite, northeast
Georgia: Journal of Geophysical Research, v. 85, p. 1481-1486.
Frost, B.R., and Lindsley, D.H. 1991, Occurrence of iron-titanium oxides in igneous rocks:
Reviews in Mineralogy, v. 25, p. 433-468.
Frost B.R., Lindsley, D.H., and Andersen, D.J., 1988, Fe-Ti oxide-silicate equilibria; assemblages
with fayalitic olivine: American Mineralogist, v. 73, p. 727-740.

St-Blanquat et al., B.G.S.A., 2001, vol. 113; Data Repository Document. Page 5 of 18
Grégoire, V., Darrozes, P., Gaillot, A., Nédélec, A., and Launeau, P., 1998, Magnetic grain shape
fabric and distribution anisotropy vs. rock magnetic fabric: a three dimensional case study:
Journal of Structural Geology, v. 20, p. 937-944.
Grégoire, V., Saint-Blanquat, M., Nédélec, A., and Bouchez, J.L., 1995, Shape anisotropy versus
magnetic interactions of magnetic grains: experiments and applications to AMS in granite rocks:
Geophysical Research Letters, v. 22, p. 2765-2768.
Ishihara, S., 1977, The magnetite-series and ilmenite series granitic rocks: Mining Geology, v. 27,
p. 293-305.
Jelinek, V., 1977, The statistical theory of measuring anisotropy of magnetic susceptibility of rocks
and its application, Geofyzika n.p. ed., Brno, Czech Republic, 88 pp.
Jover, O., Rochette, P., Lorand, J.P., Maeder, M., and Bouchez, J.L., 1989, Magnetic mineralogy of
some granites from the French Massif Central: origin of their low-field susceptibility: Physics of
the Earth and Planetary Interiors, v. 55, p. 79-92.
Khan, M.A., 1962, The anisotropy of magnetic susceptibility of some igneous and metamorphic
rocks: Journal of Geophysical Research, v. 67, B7, p. 2873-2885.
Law, R.D., Morgan, S.S., Casey, M., Sylvester, A.G., and Nyman, M., 1992, The Papoose Flat
pluton of eastern California: a re-assessment of its emplacement history in the light of new
microstructural and crystallographic fabric observations: Transactions Royal Society Edinburgh:
Earth Sciences, v. 83, p. 361-375.
Law, R.D., Sylvester, A.G., Nelson, C.A., Morgan, S.S., and Nyman, M.W., 1993, Deformation
associated with emplacement of the Papoose Flat pluton, Inyo Mountains, eastern California:
Geologic Overview and Field Guide, in Lahren, M.M., Trexler, J.H., Jr. and Spinosa, C., eds.,
Crustal evolution of the Great Basin and Sierra Nevada: Cordilleran/Rocky Mountain Section,
Geological Society of America Guidebook, Department of Geological Sciences, University of
Nevada, Reno, p. 231-261.
Peacock, S.M., 1989, Numerical constrains on rates of metamorphism, fluid production, and fluid
flux during regional metamorphism: Geological Society of America Bulletin, v. 101, p. 476-485.
Rochette, P., 1987, Magnetic susceptibility of the rock matrix related to magnetic fabrics: Journal
of Structural Geology, v. 9, p. 1015-1020.
Rochette, P., Jackson, M., and Aubourg, C., 1992, Rock magnetism and the interpretation of
anisotropy of magnetic susceptibility: Reviews of Geophysics, v. 30, p. 209-226.
Saint-Blanquat, M., 1993, EXAMS, an Excel macro for automatic computing of AMS data.
Unpublished program, Université Paul-Sabatier, Toulouse, France.
Stacey, F.D., 1960, Magnetic anisotropy of igneous rocks: Journal of Geophysical Research, v. 65,
p. 2429-2442.

St-Blanquat et al., B.G.S.A., 2001, vol. 113; Data Repository Document. Page 6 of 18
Uyeda, S., Fuller, M..D., Belshe, J.C., and Girdler, R.W., 1963, Anisotropy of magnetic
susceptibility of rocks and minerals: Journal of Geophysical Research, v. 68, p. 279-291.
FIGURE AND TABLE CAPTIONS
Figure DR.1. Domainal variation in shear-sense within the gneissic border facies around the
western part of the Papoose Flat pluton. Upward translation of the pluton (relative to wall rocks)
is indicated by top to north-northwest and top to south-southeast shear senses on the north and
south margins of the pluton respectively. Shear senses indicated by field criteria (S-C
structures), and by microstructures and crystallographic fabrics in plastically deformed quartz
veins (Law et al., 1992, 1993). For field criteria: right hand arrow pointing down indicates a top
to south-southeast shear sense; right hand arrow pointing up indicates a top to north-northwest
shear sense. In aureole rocks on northwest margin of pluton, folded foliation (F) in pelitic layers
at 6-10 m above pluton roof displays top to the north-northwest vergence. See text for
discussion.
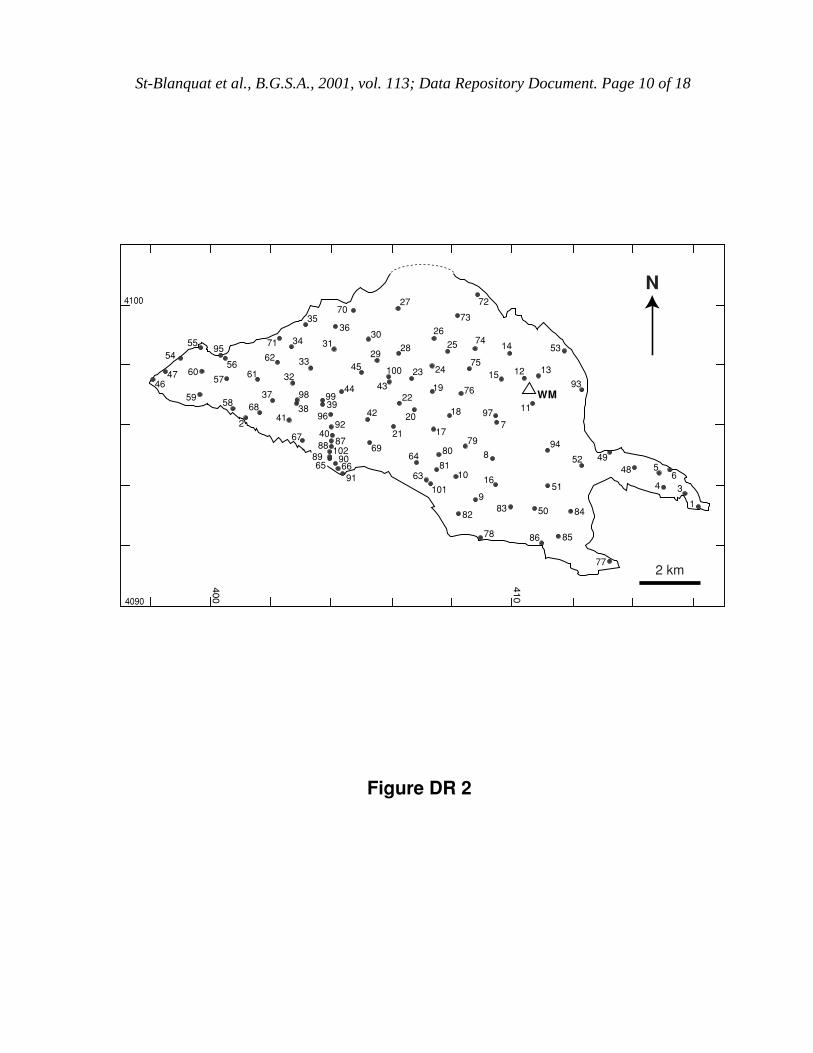
Figure DR.2. AMS sample locations with site numbers. Details of AMS parameters at each site
are given in Table DR.1. Summit of Waucoba Mountain (WM) indicated by triangle.
Figure DR.3. Relationships between scalar AMS parameters. (A) Anisotropy (P%) vs.
susceptibility (K). (B) Shape parameter (T) vs. susceptibility. (C) Shape parameter vs.
anisotropy. See text for discussion.
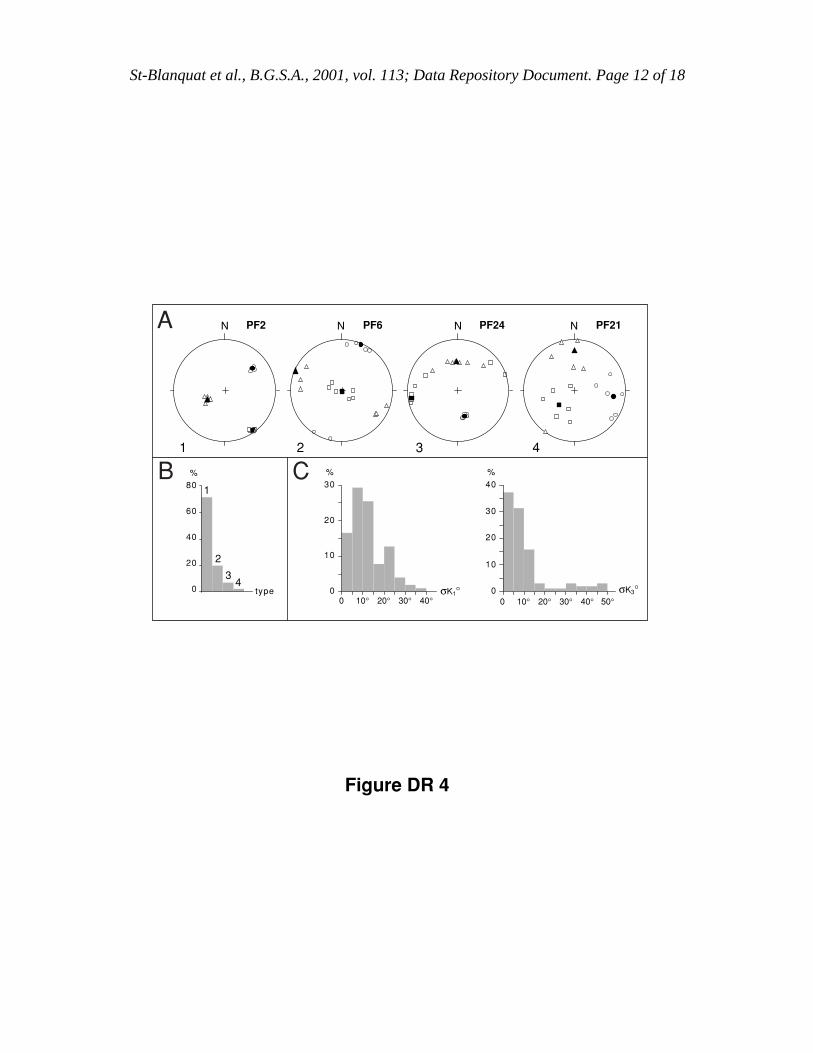
Figure DR.4. Quality assessment of directional AMS data. (A) Stereograms illustrating degree of
within-site variability in degree of alignment of principal magnetic susceptibility axes. Four
classes (Types 1-4) of within-site variability are distinguished. k1 - open squares, k2 - open
triangles, k3 – open circles. Solid symbols: site tensor averages; K1, K2 and K3. (B) Frequency
of Type 1–4 classes of within-site variability for the 102 stations measured. (C) Frequency of
within-site angular standard deviation for k1 (left) and k3 (right).
Figure DR.5. Details of magnetic minerals contributing to the AMS signal. (A) Shape and
distribution of single oxide mineral grains and clusters of grains in the magmatic domain (black
grains). (B) Shape and distribution of single oxide mineral grains and clusters of grains in the
gneissic border facies (black grains). (C, D) Susceptibility versus temperature plots for samples
PF5 and PF20.
St-Blanquat et al., B.G.S.A., 2001, vol. 113; Data Repository Document. Page 7 of 18
Table DR.1. Raw AMS data from the Papoose Flat pluton. 1000 meter universal transverse
Mercator (zone 11) grid coordinate system used; type = sites coded by degree of within-site
variability of principal susceptibility axes (see Fig. DR.4), 1 all samples well grouped; 2
grouped; 3 zone axis around Kmax or Kmin; 4 dispersed; micr = microstructural domain, M
magmatic, H high temp. solid state, L medium to low temp. solid state. Cv% is the coefficient
of variation (= 100 x standard deviation/mean value) for each parameter. The average
susceptibility is given as K=(K1+K2+K3)/3. The principal scalar parameters are the total
anisotropy percentage P%=100(K1/K3-1), the linear anisotropy percentage L%=100(K1/K2-1),
and the planar anisotropy percentage F%=100(K2/K3-1). The shape of the susceptibility
ellipsoid is given by the parameter T=[2(lnK2-lnK3)/(lnK1-lnK3)]-1, (Jelinek, 1981); T between
-1 and 0 indicates a prolate shape; T between 0 and 1 indicates an oblate shape. The orientation
parameters are the foliation, which is the plane containing K1 and K2 and perpendicular to K3,
the minimum principal axis of the susceptibility ellipsoid, and the lineation which is parallel to
K1, the maximum principal axis of the ellipsoid.
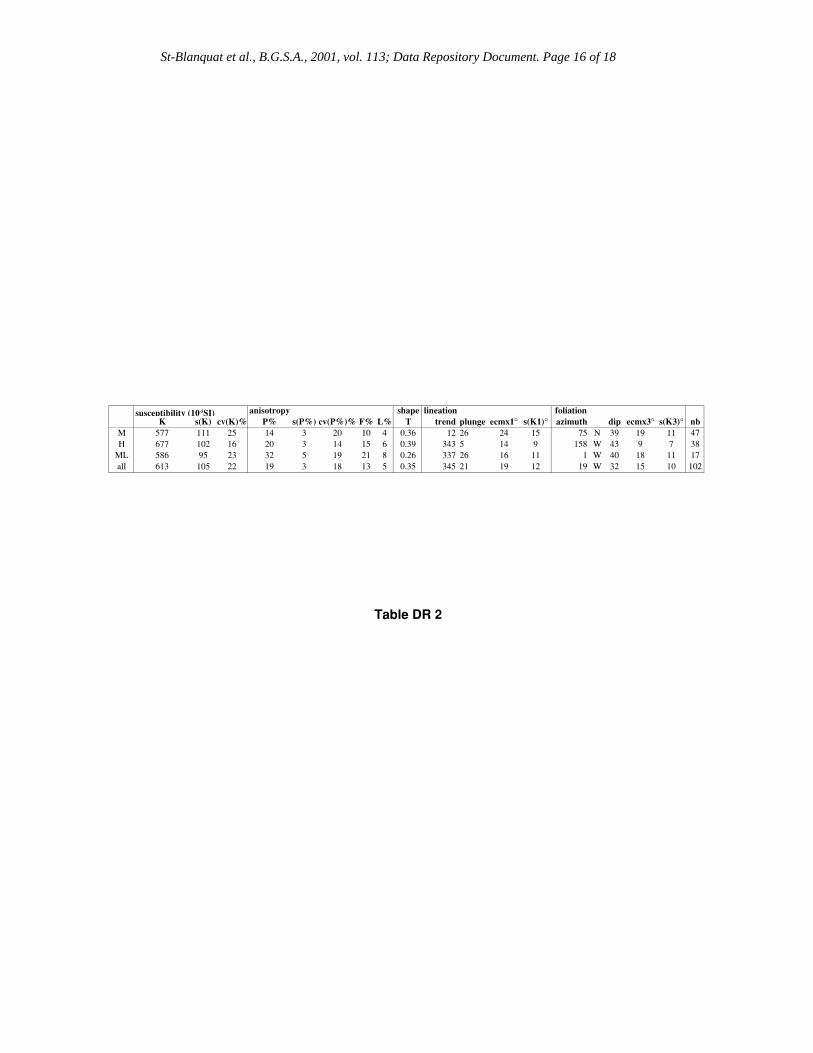
Table DR.2. Averaged values of AMS data from the Papoose Flat pluton incorporating all data
from the magmatic (M), high-temperature solid-state (H), and medium temperature (ML)
microstructural domains. K is the mean susceptibility, P% the total anisotropy percentage, F%
and L% the planar and linear anisotropy percentages respectively, T the shape parameter of
Jelinek (1981), and nb is the number of sites analyzed in each microstructural domain. σ and
Cv% are the standard deviation and the coefficient of variation (= 100 x standard
deviation/mean value) respectively for each parameter; ecmxi° is the maximum angular
departure between samples and the mean of the site for Ki; and σKi is the standard deviation of
this angular departure.
Table DR.3. Microprobe analyses of representative ilmenite and magnetite grains from the
Papoose Flat pluton. For location of sample sites see Figure DR.1.
St-Blanquat et al., B.G.S.A., 2001, vol. 113; Data Repository Document. Page 8 of 18
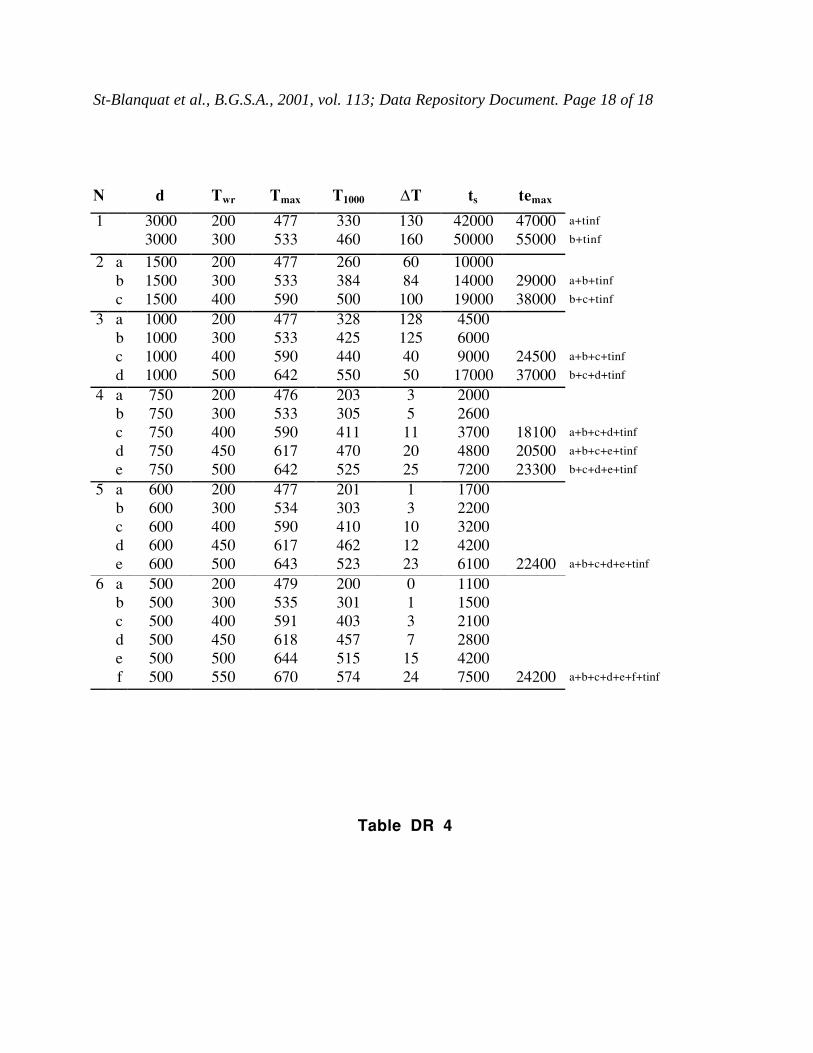
Table DR.4. Results of the thermal modeling. Each row correspond to one simulation computed
with the 1D finite difference program of Peacock (1989). Parameters are : T intrusion : 800°C, T
solidus : 650°C, latent heat of crystallization : 100000 J kg-1, conductivity : 2.65 W m-1 K-1,
specific heat : 1000 J kg-1 K-1, density : 2600 kg m-3. N is the number of pulses, d the thickness
of each pulse in meter, Twr the initial wallrock temperature, ts the complete solidification time,
Tmax the maximum temperature in the aureole near the contact, T1000 the temperature 1000 m
from the contact at ts, ∆T the difference between Twr and T1000, and temax is the sum of the ts +
tinf (duration of infilling, taken at 5000 years) for the N associated pulses, and corresponds to the
maximum duration time of emplacement.

F
top to SSE - 34 veins
top to NNW - 11 veins
symmetric - 11 veins
1 km
N
field criteria
Figure DR 1
St-Blanquat et al., B.G.S.A., 2001, vol. 113; Data Repository Document. Page 9 of 18
72
53
1
34
56
484952
94
93
51
50
9
8283 84
8586
77
16
8
10
7980
8163
6466
69
4092
878889 90
91
217
11
131215
1474
73
26
25
24
19
20
23
4322
67
39
44
4529
28
2770
3635
71 34 3130
56
5554
4746
60
59
57
58 6841
37
61
62 33
32
38 18
76
75
422
65
17
78
96
95
97
98 99
100
101
102
400
4100
4090
410
WM
2 km
N
Figure DR 2
St-Blanquat et al., B.G.S.A., 2001, vol. 113; Data Repository Document. Page 10 of 18

0
0.2
-0.2
-0.4
-0.6
-0.8
-1.0
0.4
0.6
0.8
1.0
10 20 30 40 50 60 70
P %
T
0
0.2
-0.2
-0.4
-0.6
-0.8
-1.0
0.4
0.6
0.8
1.0
2000 4000 6000 8000 10000 12000 14000 16000
T
K(10-3 SI)
0
10
20
30
40
50
60
70
0 2000 4000 6000 8000 10000 12000 14000 16000
P %
K(10-3 SI)
magmatic
high-temp. solid state deformation
medium-temp. solid-state deformation
A
B
C
Figure DR 3
St-Blanquat et al., B.G.S.A., 2001, vol. 113; Data Repository Document. Page 11 of 18
00 10° 20° 30° 40°
σK1° σK3°0 10° 20° 30° 40° 50°
10
20
3080
60
40
20
0 type
PF2 PF6 PF24 PF21
%
0
10
20
30
40%%
1
1
2
34
2 3 4
N N N NA
B C
Figure DR 4
St-Blanquat et al., B.G.S.A., 2001, vol. 113; Data Repository Document. Page 12 of 18

PF20
300200100
2
0
4
6
8
10
12
10-6 SI
0 400 500 600 700
T (°C)
10-5 SI
0
5
10
15
20
25
30
35
T (°C)
1000 200 300 400 500 600 700
PF5
1 mm
B
AD C
C D
A B
Figure DR 5
St-Blanquat et al., B.G.S.A., 2001, vol. 113; Data Repository Document. Page 13 of 18

St-Blanquat et al., B.G.S.A., 2001, vol. 113; Data Repository Document. Page 14 of 18
coordinate susceptibility lineation (Kmax) foliation (plane perp. Kmin) intensive parameters
site long lat type micr. nb (10-5 SI) σ Cv% trend plunge σ K1(10-5SI) Az. Inc. σ K3(10-5SI) P% σ Cv% L% F% T
PF1 416.17 4093.30 1 M 5 1203 285 24 182 57 9 1244 34 E 69 49 1167 7 2 25 4 3 -0.22
PF2 401.15 4096.19 1 L 5 127 63 49 145 6 4 146 141 W 59 4 103 42 12 30 11 27 0.38
PF3 415.79 4093.72 1 H 5 948 89 9 271 30 11 992 91 S 90 2 895 11 4 33 4 7 0.27
PF4 415.05 4093.96 1 M 5 218 85 39 61 4 14 229 61 N 88 5 202 14 2 18 3 10 0.54
PF5 414.85 4094.44 1 M 6 155 129 84 338 40 21 160 153 E 85 5 148 8 4 42 3 5 0.26
PF6 415.24 4094.56 2 M 6 210 28 13 151 88 18 224 113 S 87 12 193 16 1 5 5 10 0.35
PF7 409.51 4096.05 3 M 3 129 42 32 87 24 9 132 85 S 88 22 126 5 1 17 2 3 0.10
PF8 409.37 4094.90 1 M 5 737 62 8 244 10 6 790 70 S 54 6 676 17 2 13 6 10 0.22
PF9 408.79 4093.52 1 H 5 1100 217 20 249 53 8 1172 143 W 54 4 995 18 1 7 3 14 0.58
PF10 408.16 4094.29 2 H 4 882 54 6 292 25 17 928 144 W 43 9 810 15 4 24 2 12 0.67
PF11 410.74 4096.70 1 L 5 1381 133 10 341 38 6 1547 161 E 89 3 1136 36 4 10 6 28 0.62
PF12 410.44 4097.57 1 L 1 1114 275 73 1206 167 W 74 937 29 1 28 0.94
PF13 410.86 4097.64 2 L 6 974 217 22 4 52 24 1074 17 W 49 45 838 28 8 29 6 20 0.51
PF14 409.96 4098.40 1 L 4 823 79 10 311 27 9 910 125 N 80 2 677 34 2 5 3 30 0.79
PF15 409.68 4097.53 1 H 5 1187 167 14 166 75 14 1321 136 W 83 5 980 35 3 10 5 29 0.69
PF16 409.46 4094.01 1 M 6 499 105 21 215 12 13 518 96 S 14 5 471 10 1 11 2 8 0.56
PF17 407.41 4095.89 4 M 5 5 2 42 356 19 31 5 139 E 23 36 5 2 2 86 1 1 0.20
PF18 407.97 4096.33 1 M 7 693 69 10 12 29 12 737 96 N 30 5 633 16 2 12 4 12 0.47
PF19 407.38 4097.11 3 M 7 818 89 11 66 25 22 865 109 N 35 31 747 16 1 8 3 13 0.65
PF20 406.77 4096.54 3 M 7 12 3 28 273 3 27 12 93 N 78 14 12 4 2 41 2 2 0.07
PF21 406.09 4095.95 4 M 6 43 20 48 244 56 38 43 8 W 67 26 42 3 2 50 1 2 0.29
PF22 406.29 4096.73 1 M 6 265 156 59 34 14 13 271 48 N 47 8 259 5 1 22 2 3 0.29
PF23 406.69 4097.56 1 M 6 775 209 27 88 26 9 812 123 N 41 5 718 13 2 16 2 11 0.65
PF24 407.34 4097.96 3 M 7 571 165 29 261 7 23 603 75 N 43 4 514 17 3 20 1 16 0.85
PF25 407.87 4098.47 1 M 6 296 118 40 29 43 7 310 92 N 47 4 276 12 2 15 2 10 0.63
PF26 407.42 4098.88 1 M 7 627 163 26 281 14 25 679 87 N 46 4 535 27 9 32 2 24 0.82
PF27 406.26 4099.88 1 H 7 398 100 25 332 47 5 425 88 N 50 6 362 17 3 19 5 12 0.45
PF28 406.25 4098.39 2 M 8 67 25 37 284 4 17 69 103 N 46 11 64 7 1 13 1 6 0.63
PF29 405.57 4098.16 1 M 5 509 201 40 301 9 10 537 109 N 40 5 461 16 5 32 2 15 0.80
PF30 405.26 4098.85 1 H 5 262 138 53 347 28 10 275 127 N 40 2 244 13 3 26 3 9 0.53
PF31 404.11 4098.54 1 M 6 576 151 26 26 32 4 612 93 N 35 5 521 18 4 24 3 14 0.63
PF32 402.71 4097.42 2 M 6 913 268 29 347 46 24 1005 72 N 37 49 795 26 11 40 7 18 0.41
PF33 403.33 4097.92 1 M 6 507 39 8 0 11 11 548 20 W 32 5 461 19 2 12 7 11 0.22
PF34 402.70 4098.59 1 M 7 424 53 12 342 41 8 449 81 N 41 5 401 12 2 13 7 5 -0.16
PF35 403.15 4099.36 1 H 8 688 163 24 356 36 12 745 95 N 36 8 622 20 3 17 7 12 0.25
PF36 404.17 4099.28 1 H 6 563 104 19 351 31 9 616 93 N 32 10 496 24 4 18 7 16 0.41
PF37 402.06 4096.82 2 H 6 536 106 20 203 9 20 580 7 W 41 14 497 17 3 19 9 7 -0.15
PF38 402.88 4096.72 1 M 6 369 36 10 359 12 6 391 12 W 41 4 346 13 1 5 6 7 0.04
PF39 403.76 4096.70 1 M 6 199 185 93 354 4 9 210 1 W 25 9 186 13 5 42 4 9 0.37
PF40 404.07 4095.70 1 M 9 651 452 69 161 14 15 717 146 W 49 30 583 23 10 43 10 12 0.12
PF41 402.61 4096.16 1 H 8 432 42 10 166 10 6 459 159 W 60 5 403 14 1 9 6 8 0.18
PF42 405.24 4096.20 1 M 7 785 143 18 161 13 13 849 136 W 31 10 706 20 4 18 6 13 0.34
PF43 405.97 4097.46 3 M 5 433 51 12 341 28 28 446 116 N 35 12 415 7 2 22 2 5 0.50
PF44 404.37 4097.12 2 M 4 265 114 43 203 20 19 275 16 W 68 13 256 8 1 16 4 3 -0.18
PF45 405.01 4097.75 2 M 4 493 61 12 15 28 21 504 108 N 29 12 477 6 1 24 1 5 0.66
PF46 398.07 4097.50 1 H 16 152 82 54 349 6 11 164 177 W 32 11 144 14 7 49 10 4 -0.42
PF47 398.55 4097.76 1 L 5 959 184 19 354 12 6 1018 7 W 44 11 917 11 2 16 8 3 -0.45
PF48 414.05 4094.59 1 M 5 876 128 15 316 12 7 915 16 W 14 4 842 9 1 13 5 3 -0.21
PF49 413.29 4095.13 1 M 6 1263 123 10 12 18 5 1415 13 W 88 3 1103 28 3 10 11 15 0.14
PF50 410.78 4093.24 1 M 6 1339 122 9 320 48 10 1420 75 N 50 3 1198 19 2 11 1 17 0.83
PF51 411.18 4094.01 1 M 6 1059 128 12 5 62 10 1151 37 W 75 9 913 26 2 9 3 22 0.72
PF52 412.32 4094.64 1 M 6 633 108 17 14 15 15 675 19 W 76 8 572 18 1 8 3 14 0.59
PF53 411.79 4098.42 1 H 4 1112 81 7 271 64 16 1225 150 W 68 6 934 31 7 23 4 26 0.71
PF54 398.98 4098.25 1 L 5 153 50 32 345 11 9 174 12 W 23 13 130 34 9 25 13 19 0.19
PF55 399.74 4098.59 2 L 6 69 29 42 321 13 22 74 26 W 13 7 63 18 10 54 8 9 0.08
PF56 400.58 4098.26 1 L 3 718 20 3 352 27 2 844 75 N 27 1 565 49 3 6 13 32 0.37
PF57 400.59 4097.53 2 L 6 47 20 42 353 9 13 48 8 W 49 49 46 5 1 15 4 1 -0.64
PF58 400.76 4096.56 1 L 4 556 156 28 157 0 4 631 156 W 47 7 493 28 2 8 16 10 -0.19
PF59 399.67 4097.01 2 L 6 238 115 48 347 11 6 263 21 W 21 44 221 19 5 27 15 4 -0.59
PF60 399.72 4097.83 1 L 4 326 69 21 357 41 9 380 47 N 48 11 259 46 2 3 12 30 0.40
PF61 401.62 4097.54 1 H 4 714 44 6 4 25 4 765 97 N 26 5 662 16 1 5 7 8 0.08
PF62 402.23 4098.10 1 M 5 509 111 22 354 18 9 532 26 W 29 10 483 10 2 20 4 6 0.21
PF63 407.31 4094.05 1 H 5 863 96 11 267 55 7 946 173 W 55 10 768 23 2 9 8 14 0.26
PF64 406.86 4094.75 1 H 5 494 78 16 221 49 13 525 154 W 53 11 443 18 2 9 2 16 0.79
PF65 404.01 4094.93 1 H 8 276 69 25 150 6 14 287 144 W 48 8 262 10 2 17 3 7 0.41
PF66 404.25 4094.57 1 L 6 616 209 34 159 7 12 671 148 W 36 7 524 28 8 29 3 24 0.77
PF67 403.08 4095.51 1 H 6 1248 129 10 345 2 5 1438 166 W 53 5 1014 42 4 10 11 27 0.39
PF68 401.63 4096.41 1 H 5 785 185 24 155 13 4 873 145 W 55 5 710 23 5 20 13 9 -0.19
PF69 405.31 4095.44 1 H 6 392 71 18 146 16 12 409 123 S 37 7 373 10 1 10 4 6 0.15
PF70 404.78 4099.82 1 H 6 828 206 25 336 33 7 912 93 N 36 5 711 28 5 16 6 21 0.52

St-Blanquat et al., B.G.S.A., 2001, vol. 113; Data Repository Document. Page 15 of 18
coordinate susceptibility lineation (Kmax) foliation (plane perp. Kmin) intensive parameters
site long lat type micr. nb (10-5 SI) σ Cv% trend plunge σ K1(10-5SI) Az. Inc. σ K3(10-5SI) P% σ Cv% L% F% T
PF71 402.29 4098.89 1 L 9 499 60 12 341 30 5 548 70 N 30 10 451 22 3 15 10 10 0.00
PF72 408.86 4100.30 1 H 4 854 72 8 21 12 16 917 28 W 62 3 752 22 1 5 3 18 0.71
PF73 408.19 4099.64 1 H 6 635 21 3 322 28 12 669 113 N 47 6 578 16 1 9 2 14 0.78
PF74 408.80 4098.52 1 H 6 468 90 19 230 1 14 491 50 N 51 3 430 14 1 8 2 12 0.70
PF75 408.59 4097.86 1 M 6 478 194 41 231 7 13 509 46 N 48 5 432 18 4 24 4 14 0.57
PF76 408.35 4097.05 2 M 6 1146 151 13 74 5 15 1217 80 N 35 5 1044 16 3 20 3 13 0.58
PF77 413.24 4091.52 1 H 3 421 50 12 241 45 6 469 152 W 45 4 371 26 3 10 11 14 0.10
PF78 408.96 4092.29 1 H 4 1097 190 17 245 18 5 1243 119 S 23 15 990 25 3 10 18 7 -0.43
PF79 408.48 4095.34 2 M 6 1171 107 9 257 49 23 1211 81 S 79 35 1124 8 1 10 3 5 0.27
PF80 407.60 4095.06 2 M 8 842 72 9 122 23 15 894 107 S 62 9 770 16 2 12 4 12 0.49
PF81 407.52 4094.50 1 H 2 1543 563 36 180 11 13 1743 176 W 74 11 1202 45 13 28 3 40 0.82
PF82 408.22 4093.08 1 H 7 1243 59 5 257 41 8 1328 127 S 49 7 1140 16 3 17 5 10 0.30
PF83 409.95 4093.31 3 H 3 1441 77 5 331 79 29 1508 74 N 80 1 1317 14 1 5 1 14 0.90
PF84 411.96 4093.16 2 M 7 606 173 29 328 55 15 654 77 N 57 5 529 23 4 15 3 20 0.73
PF85 411.55 4092.33 2 H 5 1185 189 16 268 29 22 1244 76 N 63 17 1104 13 2 16 3 9 0.51
PF86 411.04 4092.07 1 H 3 33 4 13 246 51 6 34 123 S 56 6 31 7 0 6 3 4 0.07
PF87 404.01 4095.51 1 H 3 852 8 1 157 10 3 937 147 W 47 2 739 27 2 7 7 19 0.47
PF88 403.98 4095.36 1 H 2 720 140 19 166 22 2 809 148 W 53 2 584 39 2 5 6 31 0.66
PF89 403.98 4095.14 1 H 2 466 23 5 155 27 3 518 119 S 41 3 407 27 1 3 9 16 0.26
PF90 404.17 4094.75 1 H 2 1117 6 1 147 2 7 1223 145 W 43 2 964 27 1 2 5 21 0.60
PF91 404.40 4094.41 2 L 2 336 1 0 306 38 24 390 1 W 43 4 233 67 2 4 1 64 0.94
PF92 404.02 4095.95 1 M 3 453 48 11 173 27 4 488 149 W 52 5 418 17 2 12 8 8 0.05
PF93 412.36 4097.15 2 H 8 790 188 24 330 51 21 919 3 W 68 31 614 49 7 14 10 36 0.53
PF94 411.19 4095.19 2 M 9 637 106 17 117 54 32 665 137 E 75 11 598 11 1 10 3 8 0.50
PF95 400.51 4098.34 1 L 3 299 41 14 338 30 10 333 84 N 30 5 257 29 8 26 9 19 0.33
PF96 403.84 4096.20 1 H 7 35 5 14 177 9 8 36 166 W 47 8 34 6 1 20 2 3 0.16
PF97 409.50 4096.06 1 M 4 718 67 9 48 28 3 809 162 E 30 3 638 27 2 6 14 11 -0.14
PF98 402.87 4096.73 1 M 4 738 51 7 21 11 5 796 61 N 18 2 670 19 2 10 6 12 0.29
PF99 403.75 4096.71 2 M 2 6 0 2 339 32 5 6 148 E 71 17 6 1 0 5 1 0 -0.33
PF100 405.96 4097.47 3 M 2 359 71 20 34 39 23 368 125 N 39 1 347 6 1 12 1 5 0.57
PF101 407.30 4094.06 1 H 4 144 13 9 233 62 7 154 176 W 67 2 131 17 1 7 4 13 0.54
PF102 404.00 4094.94 1 H 3 144 10 7 142 2 2 154 139 W 42 2 130 19 3 14 5 13 0.44
Table DR 1
St-Blanquat et al., B.G.S.A., 2001, vol. 113; Data Repository Document. Page 16 of 18
susceptibility (10-5SI) anisotropy shape lineation foliationK s(K) cv(K)% P% s(P%) cv(P%)% F% L% T trend plunge ecmx1° s(K1)° azimuth dip ecmx3° s(K3)° nb
M 577 111 25 14 3 20 10 4 0.36 12 26 24 15 75 N 39 19 11 47H 677 102 16 20 3 14 15 6 0.39 343 5 14 9 158 W 43 9 7 38
ML 586 95 23 32 5 19 21 8 0.26 337 26 16 11 1 W 40 18 11 17all 613 105 22 19 3 18 13 5 0.35 345 21 19 12 19 W 32 15 10 102
Table DR 2

St-Blanquat et al., B.G.S.A., 2001, vol. 113; Data Repository Document. Page 17 of 18
site 2 51 96 2 51 96
min Ilm Ilm Ilm Mag Mag Mag
SiO2 0.03 0.05 0.01 0.03 0.07 0.2
TiO2 50.04 29.53 48.93 0.03 0.03 0.01
Al2O3 0 0 0 0.04 0.01 0.02
Cr2O3 0 0 0.03 0.04 0 0.04
Fe2O3(c) 4.88 44.67 6.94 69.16 68.76 68.16
FeO(c) 42.55 24.23 32.75 31.22 31.15 30.99
MnO 2.44 2.31 10.45 0.05 0 0.07
MgO 0 0.03 0 0.01 0 0
CaO 0 0 0.02
ZnO 0.67 0.14
NiO 0.06 0
Sum Ox% 99.95 100.84 99.86 100.6 100.02 99.64
Si 0.001 0.001 0 0.001 0.003 0.008
Ti 0.953 0.568 0.933 0.001 0.001 0
Al/Al IV 0 0 0 0 0 0
Al VI 0 0 0 0.002 0 0.001
Cr 0 0 0.001 0.001 0 0.001
Fe3+ 0.093 0.86 0.132 1.993 1.993 1.982
Fe2+ 0.901 0.519 0.695 1 1.003 1.001
Mn2+ 0.052 0.05 0.224 0.002 0 0.002
Mg 0 0.001 0 0.001 0 0
Ca 0 0 0.001
Zn 0.012 0.004
Ni 0.001 0
Sum Cat# 2 2 2 3 3 3
Ilmenite 90.11 51.87 70.49
Geikielite 0.01 0.1 0.01
Pyrophanite 5.22 5.01 22.77
Hematite 4.65 43.02 6.72
Table DR 3
St-Blanquat et al., B.G.S.A., 2001, vol. 113; Data Repository Document. Page 18 of 18
N d Twr Tmax T1000 ∆T ts temax
1 3000 200 477 330 130 42000 47000 a+tinf
3000 300 533 460 160 50000 55000 b+tinf
2 a 1500 200 477 260 60 10000b 1500 300 533 384 84 14000 29000 a+b+tinf
c 1500 400 590 500 100 19000 38000 b+c+tinf
3 a 1000 200 477 328 128 4500b 1000 300 533 425 125 6000c 1000 400 590 440 40 9000 24500 a+b+c+tinf
d 1000 500 642 550 50 17000 37000 b+c+d+tinf
4 a 750 200 476 203 3 2000b 750 300 533 305 5 2600c 750 400 590 411 11 3700 18100 a+b+c+d+tinf
d 750 450 617 470 20 4800 20500 a+b+c+e+tinf
e 750 500 642 525 25 7200 23300 b+c+d+e+tinf
5 a 600 200 477 201 1 1700b 600 300 534 303 3 2200c 600 400 590 410 10 3200d 600 450 617 462 12 4200e 600 500 643 523 23 6100 22400 a+b+c+d+e+tinf
6 a 500 200 479 200 0 1100b 500 300 535 301 1 1500c 500 400 591 403 3 2100d 500 450 618 457 7 2800e 500 500 644 515 15 4200f 500 550 670 574 24 7500 24200 a+b+c+d+e+f+tinf
Table DR 4