Internal migration and socio- demographic changes in...
42
Internal migration and socio- demographic changes in Malaysia Tey Nai Peng International Conference on Migration, Urbanization and Development organized by National Population and Family Development Board, and Population Studies Unit (University of Malaya) 8 July 2013 at Faculty of Economics and Administration University of Malaya
Transcript of Internal migration and socio- demographic changes in...
Internal migration and socio-
demographic changes in Malaysia
Tey Nai Peng
International Conference on Migration, Urbanization and Development organized by National Population and Family Development Board, and Population Studies Unit
(University of Malaya) 8 July 2013
at Faculty of Economics and Administration
University of Malaya
Scope and objectives of the paper
• Re-examines levels, trends and patterns of internal migration for 1991 and 2000.
• State and regional level analysis
• Reasons for the concentration in the Klang Valley
• Migration selectivity
• Effects of migration on
- Demographic changes
- Socio-economic changes

Theories and Hypotheses • Ravenstein’s law of migration - Most migrants only proceed a short
distance, and toward centers of absorption
• Lee’s push and pull factors- migration directed to areas with more jobs and higher incomes
• Neoclassical economic theory- the main reason for labor migration is wage difference between two geographic locations
• Chain migration – migrants from a certain city of region tend to migrate to the same area as others from their city or region. It can also refer to the process where relatives who have previously migrated to a new country can sponsor family to migrate to the same city by sponsoring them.
• Migration is selective, especially by age and education
• Inter-regional predominates intra-regional migration (except KL Selangor), because for a small country distance is not a deterrent
• Govt policies affect migration, which in turn is instrumental to achieve the objectives of restructuring society
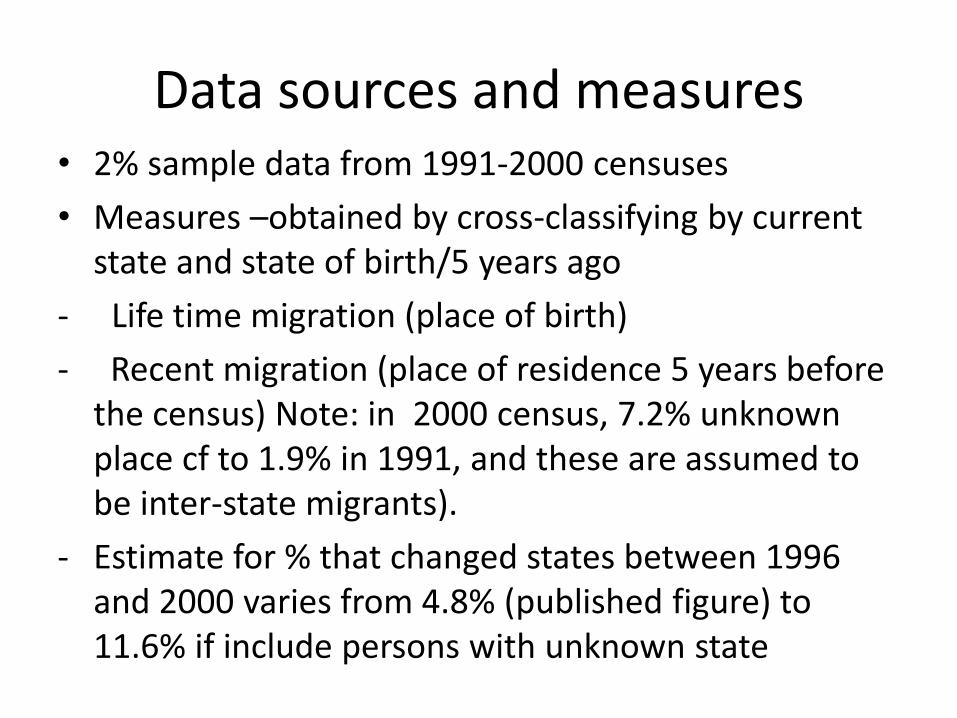
Data sources and measures • 2% sample data from 1991-2000 censuses
• Measures –obtained by cross-classifying by current state and state of birth/5 years ago
- Life time migration (place of birth)
- Recent migration (place of residence 5 years before the census) Note: in 2000 census, 7.2% unknown place cf to 1.9% in 1991, and these are assumed to be inter-state migrants).
- Estimate for % that changed states between 1996 and 2000 varies from 4.8% (published figure) to 11.6% if include persons with unknown state
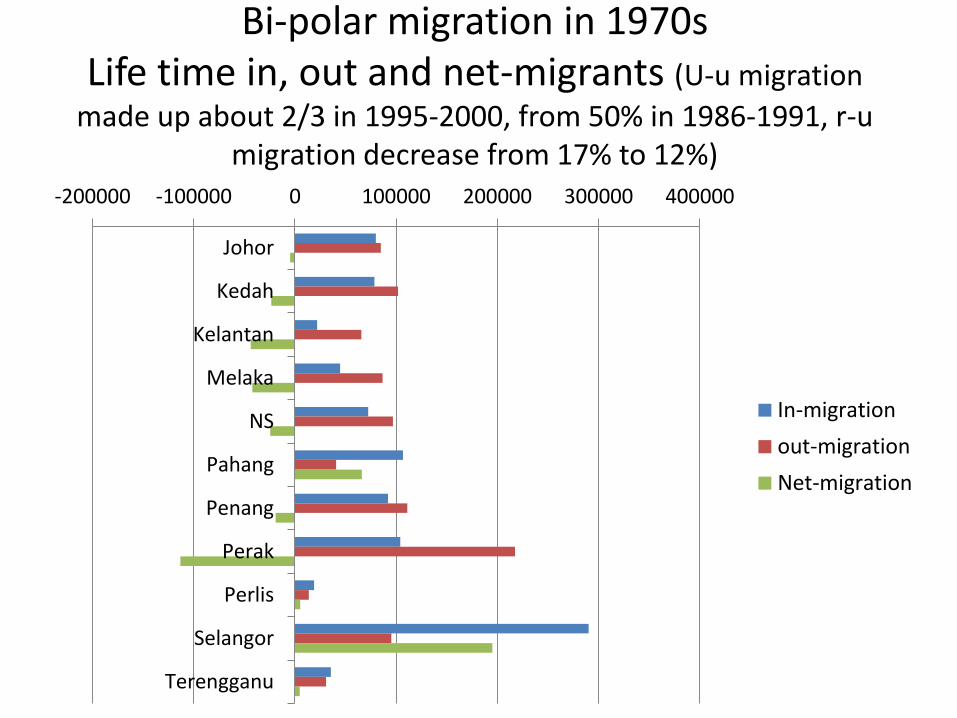
Bi-polar migration in 1970s Life time in, out and net-migrants (U-u migration
made up about 2/3 in 1995-2000, from 50% in 1986-1991, r-u migration decrease from 17% to 12%)
-200000 -100000 0 100000 200000 300000 400000
Johor
Kedah
Kelantan
Melaka
NS
Pahang
Penang
Perak
Perlis
Selangor
Terengganu
In-migration
out-migration
Net-migration
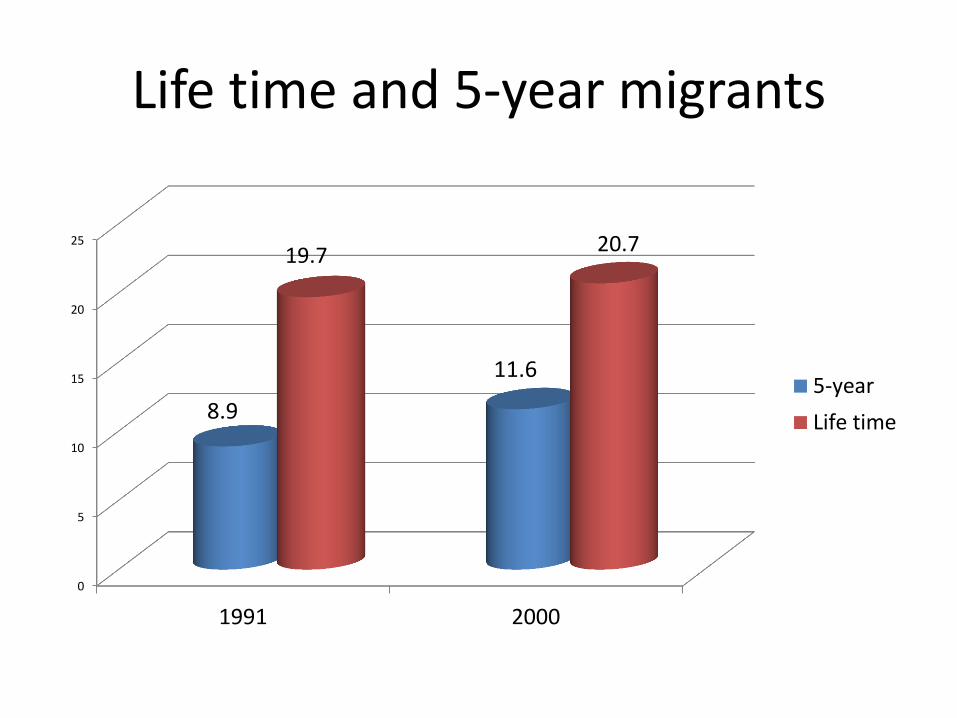
Life time and 5-year migrants
0
5
10
15
20
25
1991 2000
8.9
11.6
19.7 20.7
5-year
Life time

% living in other states 5 years ago (Data for 2000 include 7.3% of unknown state of origin, and this is as high as
13-14% in KL/Selangor, 10% in Sarawak and 7% in Sabah)
0.0 5.0 10.0 15.0 20.0 25.0
JohorKedah
KelantanMelaka
NSPahangPenang
PerakPerlis
SelangorTerengganu
SabahSarawak
KLLabuan
1991
2000
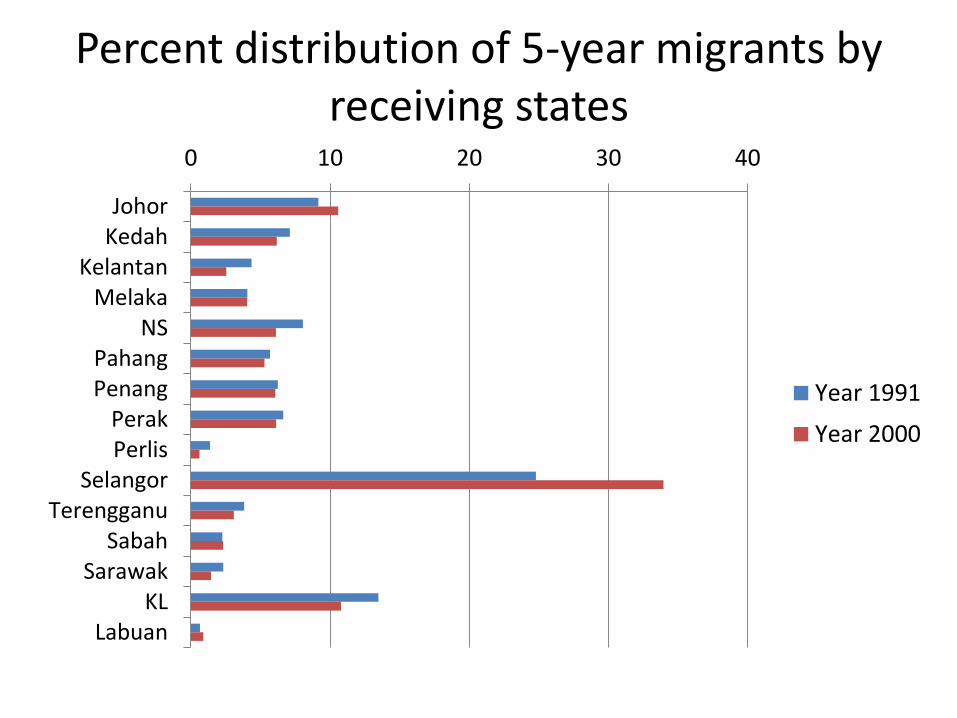
Percent distribution of 5-year migrants by receiving states
0 10 20 30 40
JohorKedah
KelantanMelaka
NSPahangPenang
PerakPerlis
SelangorTerengganu
SabahSarawak
KLLabuan
Year 1991
Year 2000
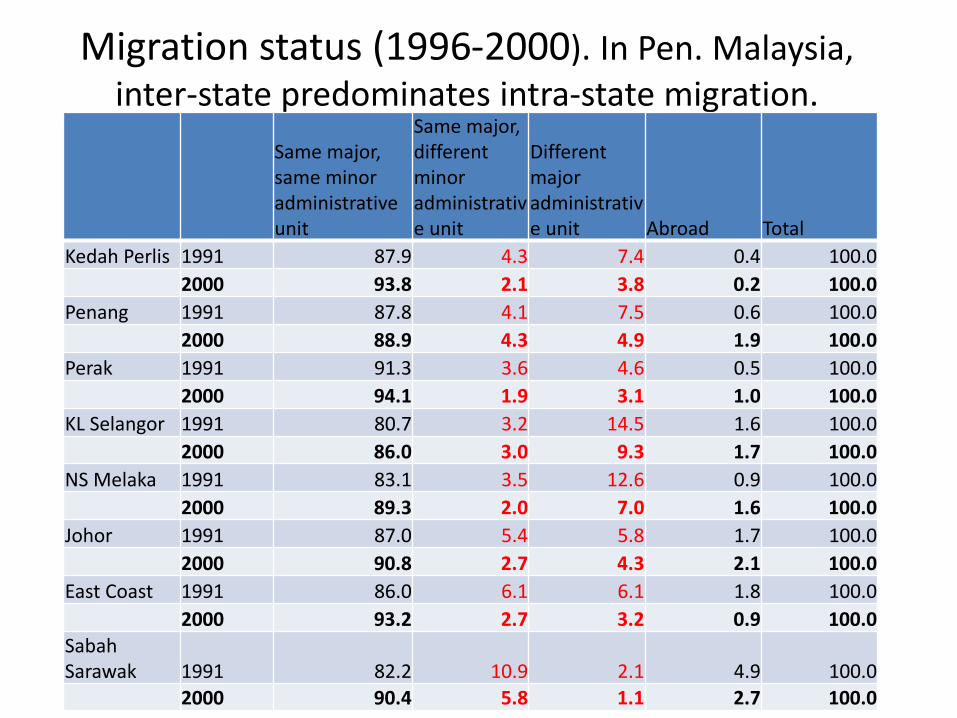
Migration status (1996-2000). In Pen. Malaysia, inter-state predominates intra-state migration.
Same major, same minor administrative unit
Same major, different minor administrative unit
Different major administrative unit Abroad Total
Kedah Perlis 1991 87.9 4.3 7.4 0.4 100.0
2000 93.8 2.1 3.8 0.2 100.0
Penang 1991 87.8 4.1 7.5 0.6 100.0
2000 88.9 4.3 4.9 1.9 100.0
Perak 1991 91.3 3.6 4.6 0.5 100.0
2000 94.1 1.9 3.1 1.0 100.0
KL Selangor 1991 80.7 3.2 14.5 1.6 100.0
2000 86.0 3.0 9.3 1.7 100.0
NS Melaka 1991 83.1 3.5 12.6 0.9 100.0
2000 89.3 2.0 7.0 1.6 100.0
Johor 1991 87.0 5.4 5.8 1.7 100.0
2000 90.8 2.7 4.3 2.1 100.0
East Coast 1991 86.0 6.1 6.1 1.8 100.0
2000 93.2 2.7 3.2 0.9 100.0
Sabah Sarawak 1991 82.2 10.9 2.1 4.9 100.0 2000 90.4 5.8 1.1 2.7 100.0
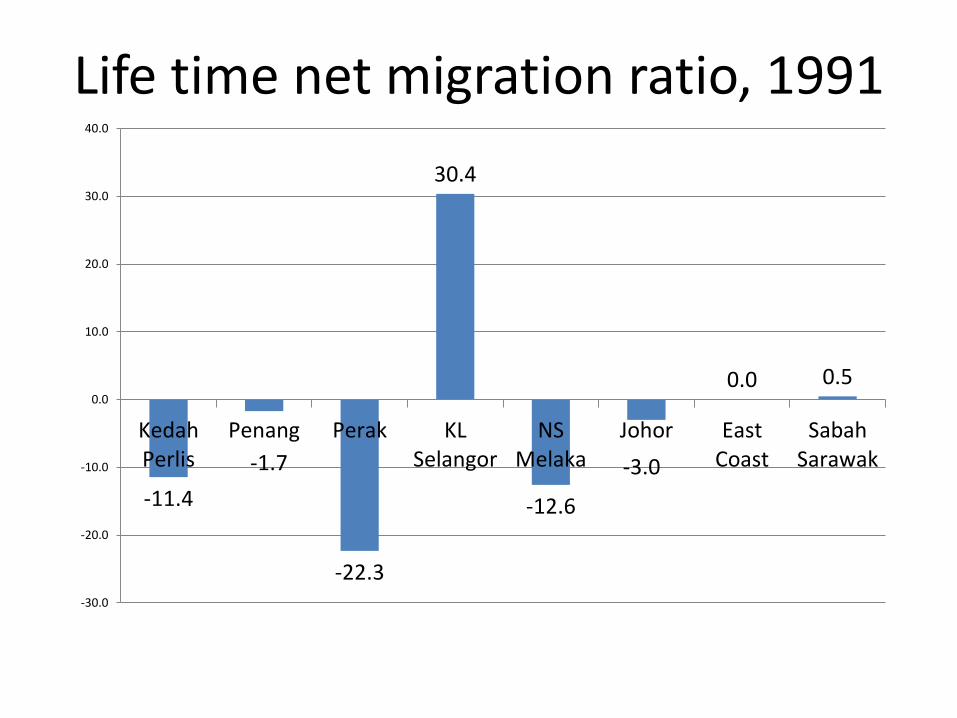
Life time net migration ratio, 1991
-11.4
-1.7
-22.3
30.4
-12.6
-3.0
0.0 0.5
-30.0
-20.0
-10.0
0.0
10.0
20.0
30.0
40.0
KedahPerlis
Penang Perak KLSelangor
NSMelaka
Johor EastCoast
SabahSarawak

Life time net migration ratio 2000
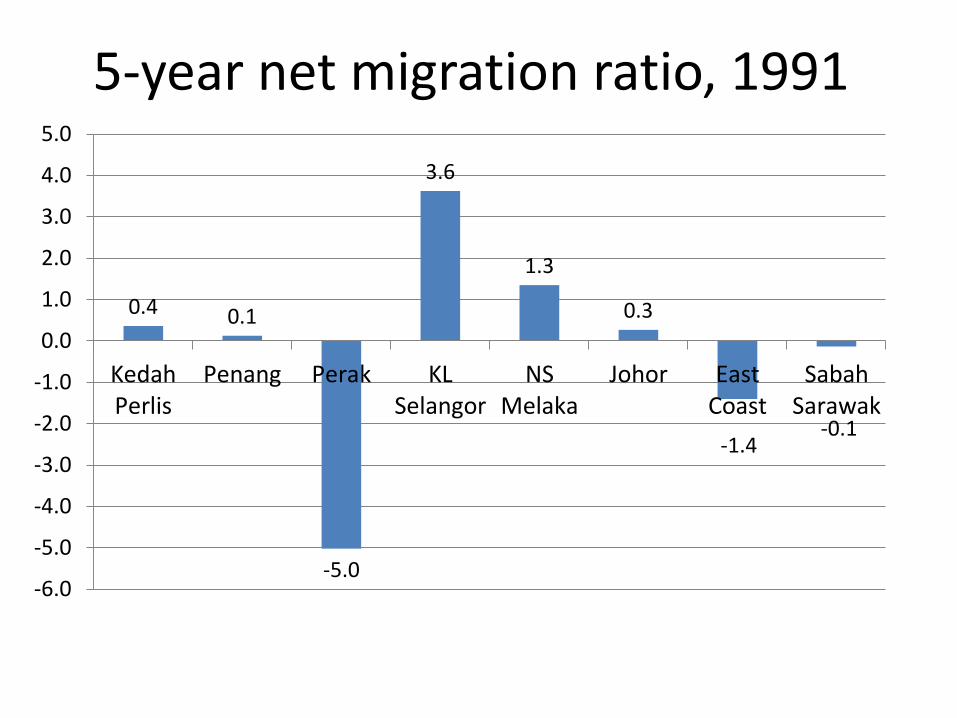
5-year net migration ratio, 1991
0.4 0.1
-5.0
3.6
1.3
0.3
-1.4 -0.1
-6.0
-5.0
-4.0
-3.0
-2.0
-1.0
0.0
1.0
2.0
3.0
4.0
5.0
KedahPerlis
Penang Perak KLSelangor
NSMelaka
Johor EastCoast
SabahSarawak

5-year net migration ratio, 2000
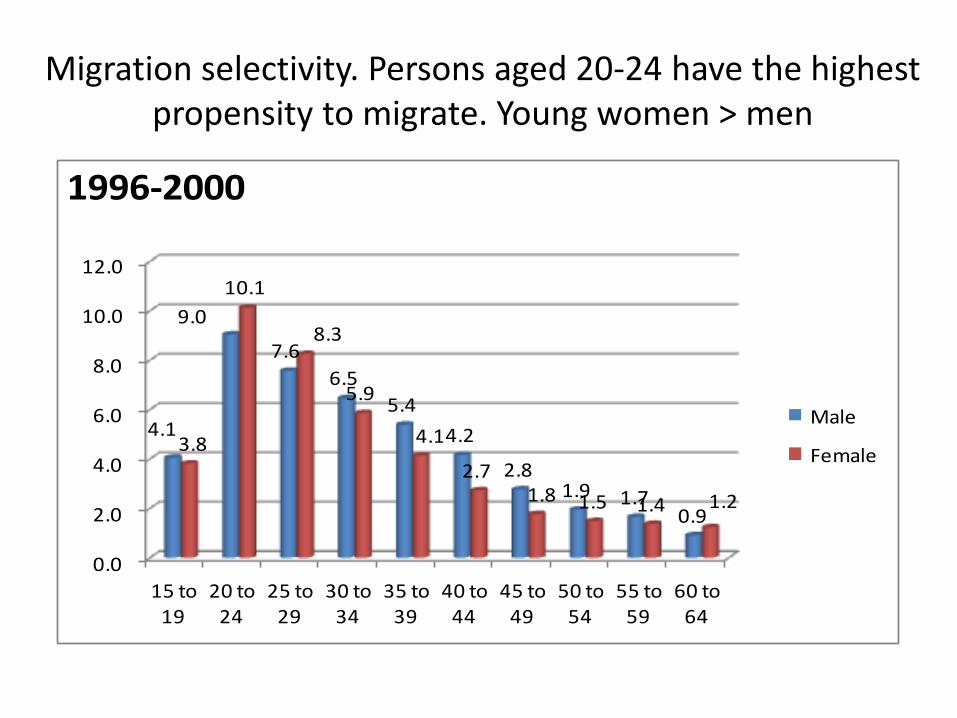
Migration selectivity. Persons aged 20-24 have the highest propensity to migrate. Young women > men
0.0
2.0
4.0
6.0
8.0
10.0
12.0
15 to 19
20 to 24
25 to 29
30 to 34
35 to 39
40 to 44
45 to 49
50 to 54
55 to 59
60 to 64
4.1
9.0
7.6
6.5
5.4
4.2
2.81.9 1.7
0.9
3.8
10.1
8.3
5.9
4.1
2.71.8 1.5 1.4 1.2
1996-2000
Male
Female
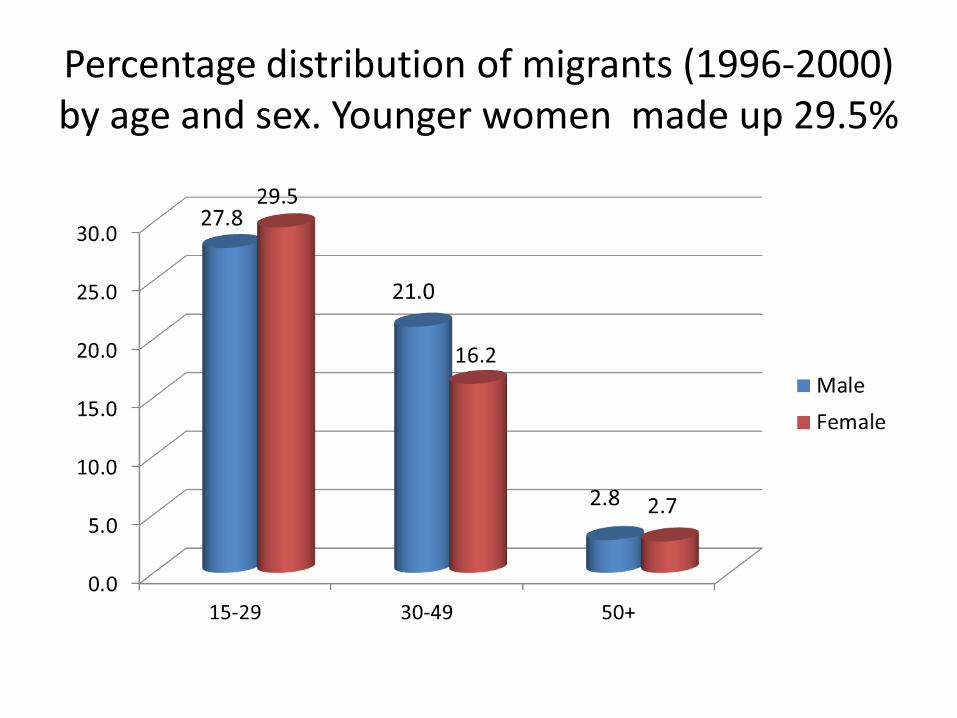
Percentage distribution of migrants (1996-2000) by age and sex. Younger women made up 29.5%
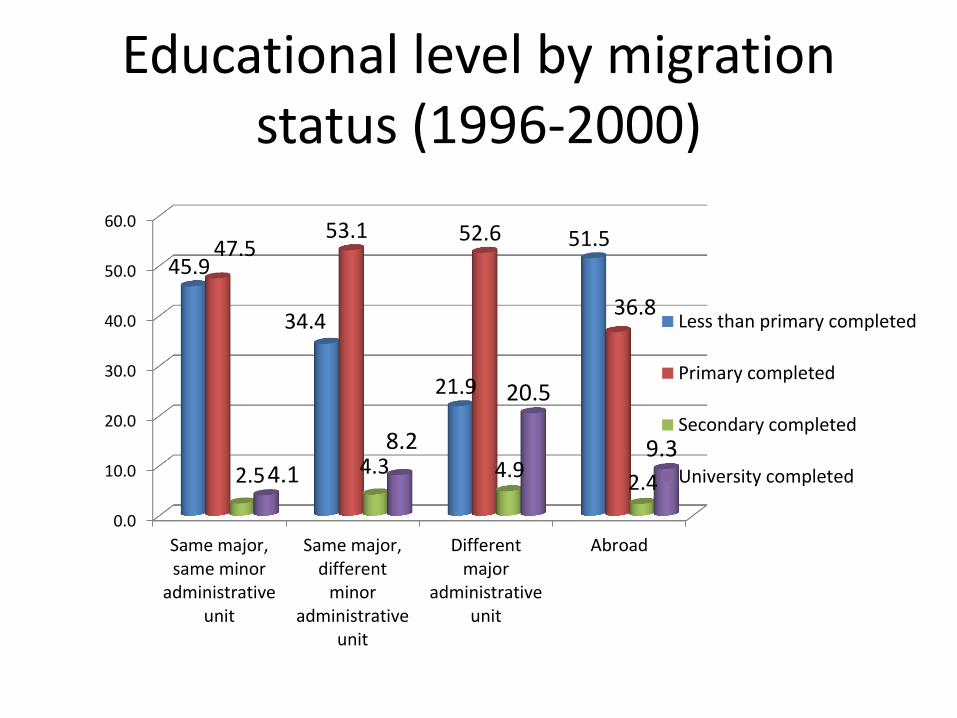
Educational level by migration status (1996-2000)
0.0
10.0
20.0
30.0
40.0
50.0
60.0
Same major,same minor
administrativeunit
Same major,different
minoradministrative
unit
Differentmajor
administrativeunit
Abroad
45.9
34.4
21.9
51.5 47.5 53.1 52.6
36.8
2.5 4.3 4.9 2.4 4.1
8.2
20.5
9.3
Less than primary completed
Primary completed
Secondary completed
University completed
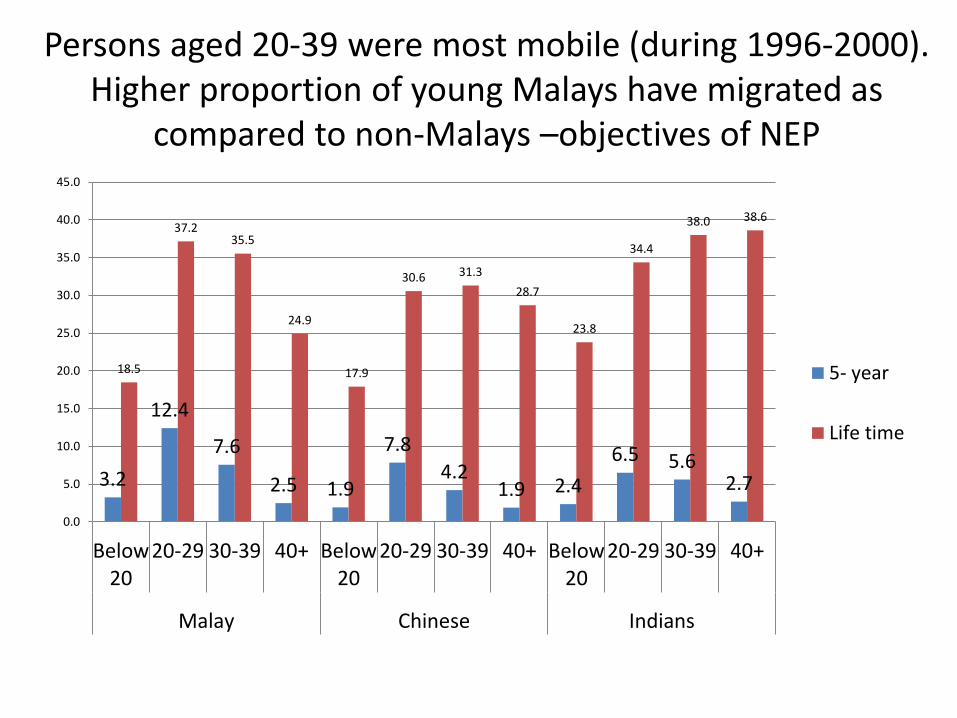
Persons aged 20-39 were most mobile (during 1996-2000). Higher proportion of young Malays have migrated as
compared to non-Malays –objectives of NEP
3.2
12.4
7.6
2.5 1.9
7.8
4.2 1.9 2.4
6.5 5.6 2.7
18.5
37.2 35.5
24.9
17.9
30.6 31.3
28.7
23.8
34.4
38.0 38.6
0.0
5.0
10.0
15.0
20.0
25.0
30.0
35.0
40.0
45.0
Below20
20-29 30-39 40+ Below20
20-29 30-39 40+ Below20
20-29 30-39 40+
Malay Chinese Indians
5- year
Life time
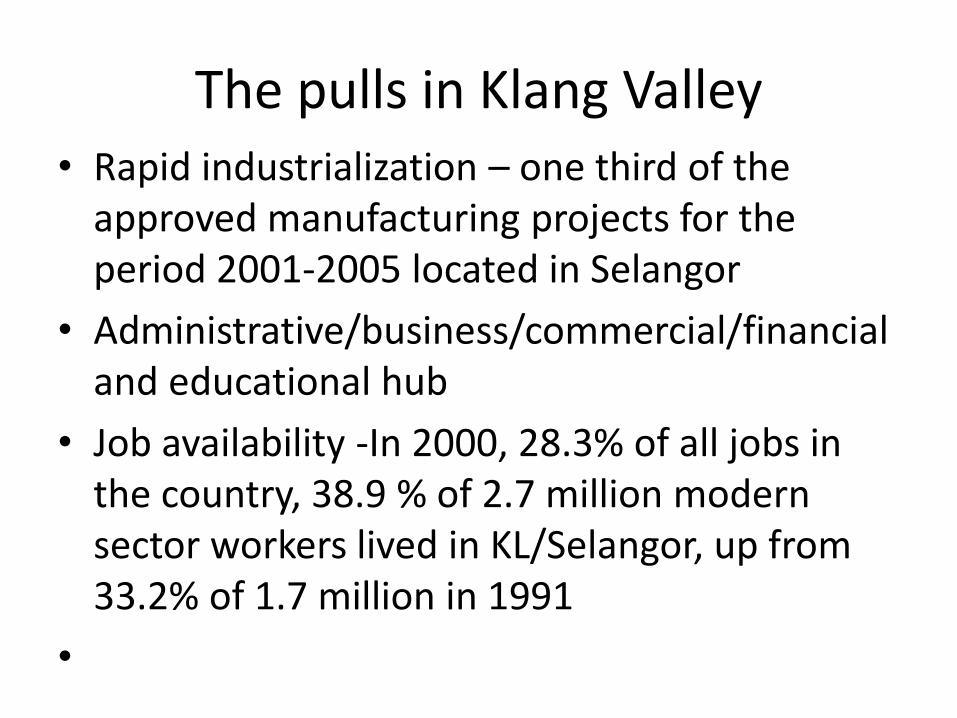
The pulls in Klang Valley • Rapid industrialization – one third of the
approved manufacturing projects for the period 2001-2005 located in Selangor
• Administrative/business/commercial/financial and educational hub
• Job availability -In 2000, 28.3% of all jobs in the country, 38.9 % of 2.7 million modern sector workers lived in KL/Selangor, up from 33.2% of 1.7 million in 1991
•
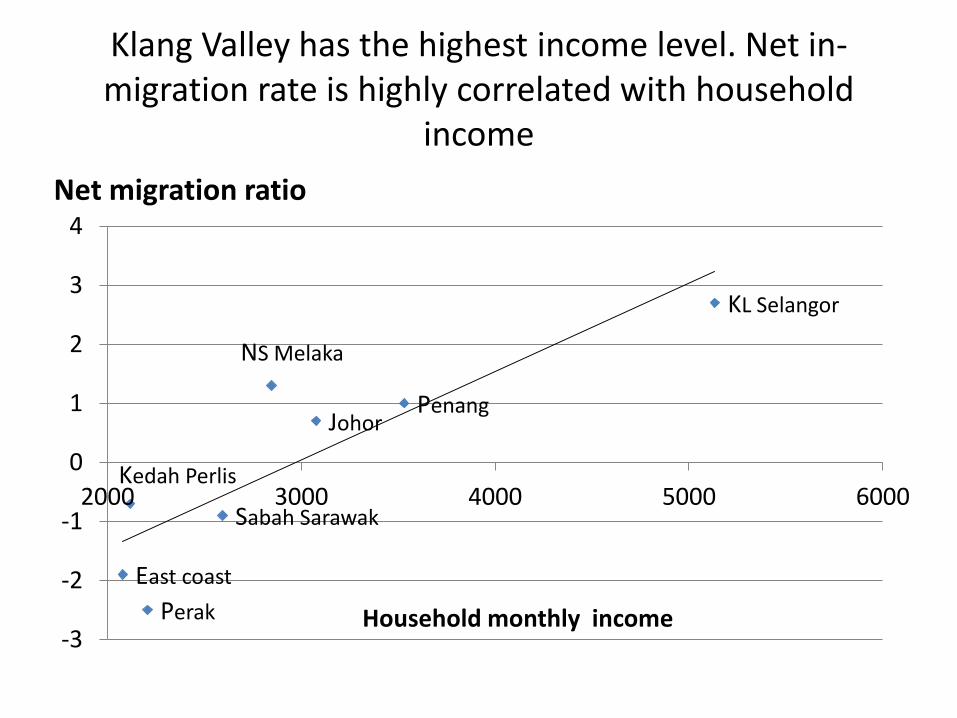
Klang Valley has the highest income level. Net in-migration rate is highly correlated with household
income
Kedah Perlis
Penang
Perak
KL Selangor
NS Melaka
Johor
East coast
Sabah Sarawak
-3
-2
-1
0
1
2
3
4
2000 3000 4000 5000 6000
Household monthly income
Net migration ratio

Correlation between net migration ratio and urbanization level
Kedah Perlis
Penang
Perak
KL Selangor
NS Melaka Johor
East Coast Sabah Sarawak
0
10
20
30
40
50
60
70
80
90
100
-3 -2 -1 0 1 2 3
% urban
Other reasons for the attraction to Klang Valley
• Concentration of institutions of higher learning in the region
• Housing development
• Better facilities – health care, entertainment etc
• Preference for the bright lights of the city
• Chain migration and existing network – presence of relatives and friends in KV facilitates migration
• Central location and easy accessibility
• Port and airport
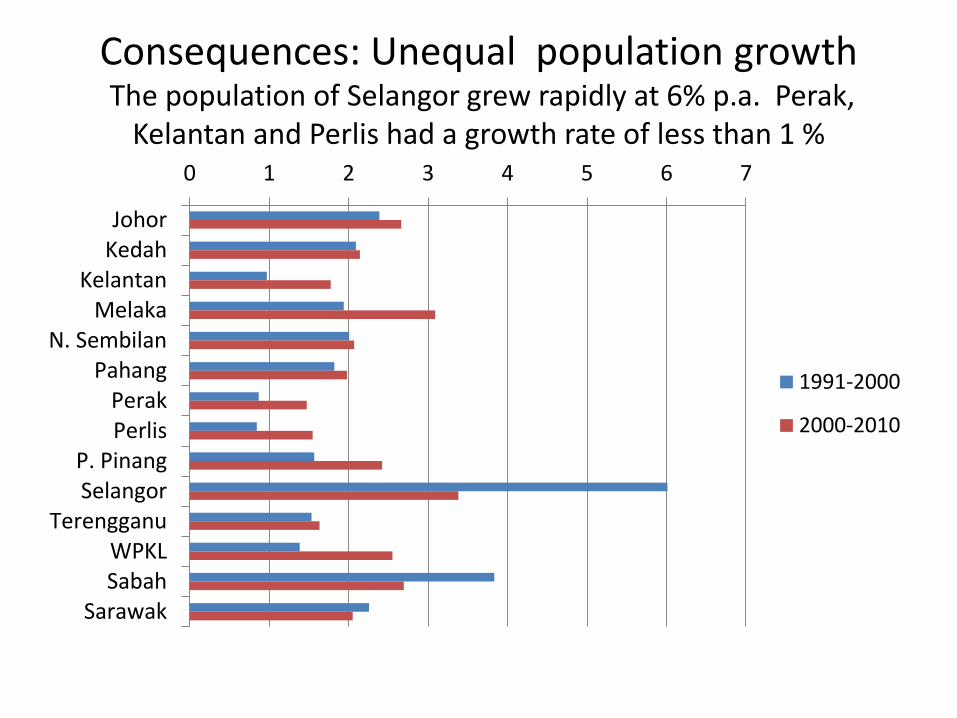
Consequences: Unequal population growth The population of Selangor grew rapidly at 6% p.a. Perak,
Kelantan and Perlis had a growth rate of less than 1 % 0 1 2 3 4 5 6 7
JohorKedah
KelantanMelaka
N. SembilanPahang
PerakPerlis
P. PinangSelangor
TerengganuWPKLSabah
Sarawak
1991-2000
2000-2010

Selangor increased its share of total population to 19 percent in 2010, from 12% in 1980. Perak registered
the sharpest decline 0.0 5.0 10.0 15.0 20.0 25.0
Johor
Kedah
Kelantan
Melaka
NS
Pahang
Perak
Perlis
P. Pinang
Selangor
Terengganu
KL
Sabah
Sararak
Labuan
1980
1991
2000
2010
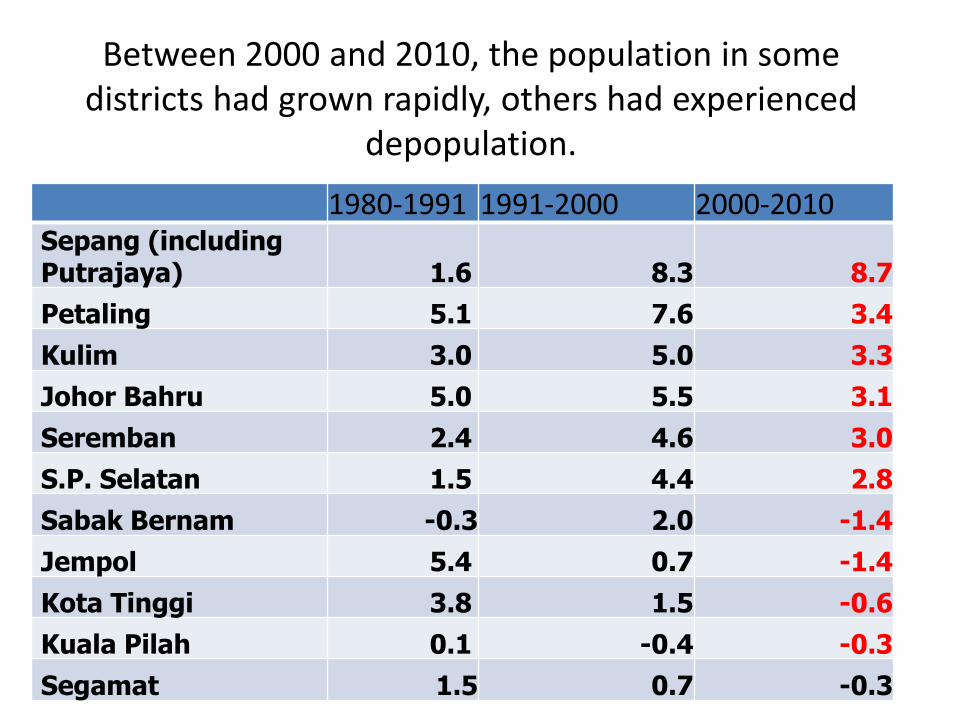
Between 2000 and 2010, the population in some
districts had grown rapidly, others had experienced depopulation.
1980-1991 1991-2000 2000-2010 Sepang (including Putrajaya) 1.6 8.3 8.7
Petaling 5.1 7.6 3.4
Kulim 3.0 5.0 3.3
Johor Bahru 5.0 5.5 3.1
Seremban 2.4 4.6 3.0
S.P. Selatan 1.5 4.4 2.8
Sabak Bernam -0.3 2.0 -1.4
Jempol 5.4 0.7 -1.4
Kota Tinggi 3.8 1.5 -0.6
Kuala Pilah 0.1 -0.4 -0.3
Segamat 1.5 0.7 -0.3
Effects on age-sex composition
Internal migration has affected the age sex composition of the population of each state. This is borne out by the sharp contrast of changes depicted by the population pyramids in 1970 and 2010 for Selangor (with rapid increase and concentration in the prime working age) and Perak (showing a decrease in the young age population and an ageing population).

Population pyramid: Selangor
300000 200000 100000 0 100000 200000 300000
0 - 4
5 - 9
10 - 14
15 - 19
20 - 24
25 - 29
30 - 34
35 - 39
40 - 44
45 - 49
50 - 54
55 - 59
60 - 64
65 - 69
70 - 74
75 - 79
80+
Population ('000)
Selangor 1970 & 2000
2000 Female
2000 Male
1970 Female
1970 Male

Population pyramid: Perak
150000 100000 50000 0 50000 100000 150000
0-45-9
10-1415-1920-2425-2930-3435-3940-4445-4950-5455-5960-6465-6970-7475-79
80+
Population ('000)
Perak 1970 & 2000
2000 Female
2000 Male
1970 Female
1970 Male
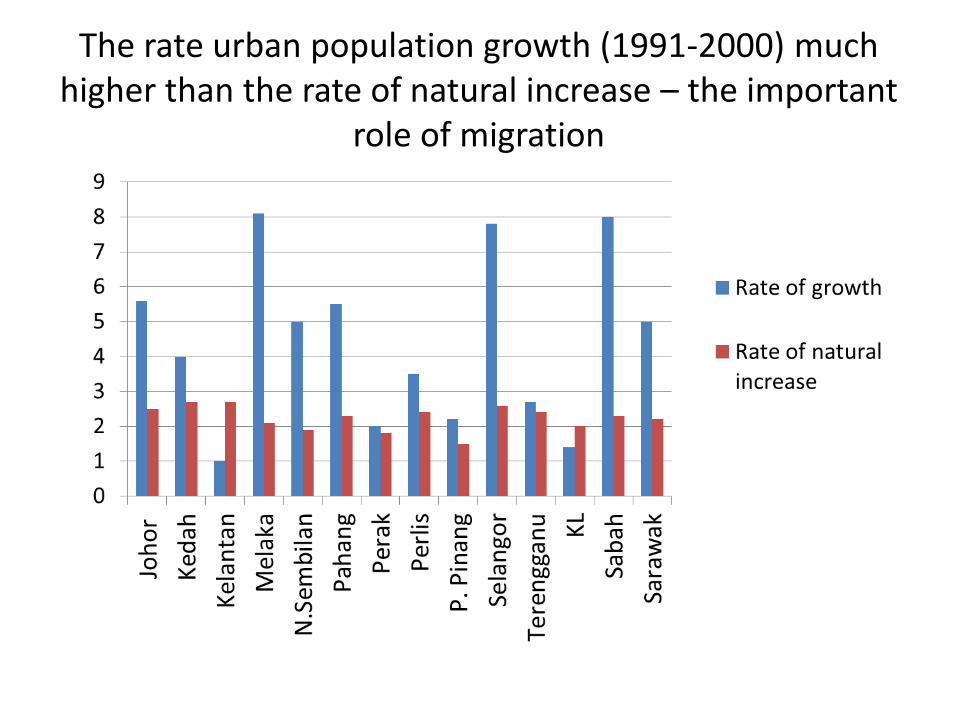
The rate urban population growth (1991-2000) much higher than the rate of natural increase – the important
role of migration
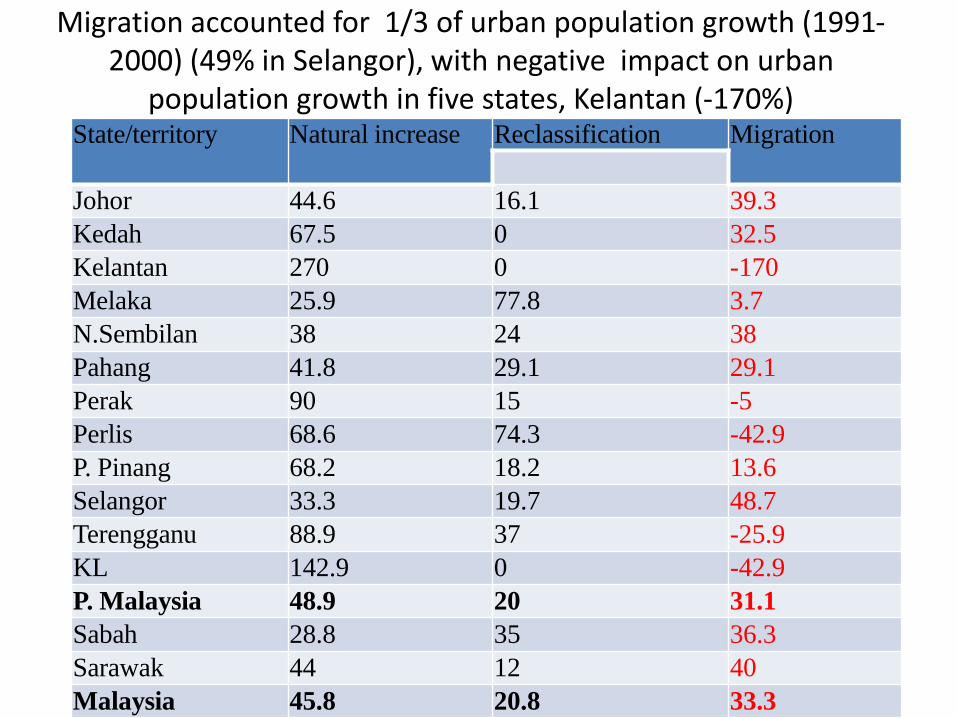
Migration accounted for 1/3 of urban population growth (1991-2000) (49% in Selangor), with negative impact on urban
population growth in five states, Kelantan (-170%) State/territory Natural increase Reclassification Migration
Johor 44.6 16.1 39.3
Kedah 67.5 0 32.5
Kelantan 270 0 -170
Melaka 25.9 77.8 3.7
N.Sembilan 38 24 38
Pahang 41.8 29.1 29.1
Perak 90 15 -5
Perlis 68.6 74.3 -42.9
P. Pinang 68.2 18.2 13.6
Selangor 33.3 19.7 48.7
Terengganu 88.9 37 -25.9
KL 142.9 0 -42.9
P. Malaysia 48.9 20 31.1
Sabah 28.8 35 36.3
Sarawak 44 12 40
Malaysia 45.8 20.8 33.3
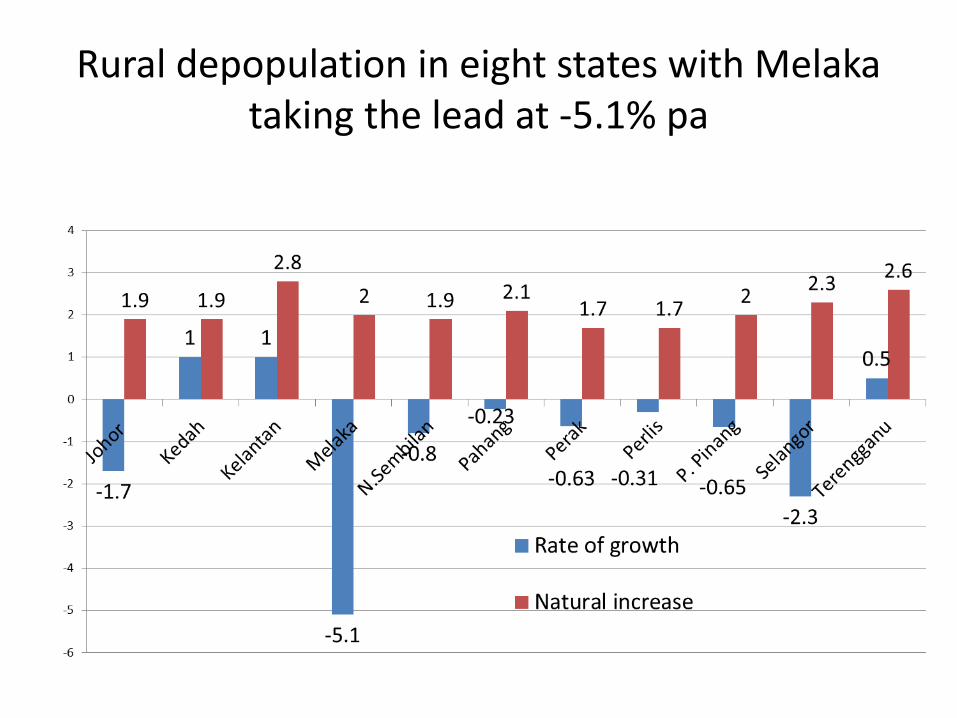
Rural depopulation in eight states with Melaka taking the lead at -5.1% pa

Migration resulted in rapid urbanization of all the ethnic groups
0
10
20
30
40
50
60
70
80
90
100
1970 1980 1991 2000 2010
Malays
Chinese
Indians
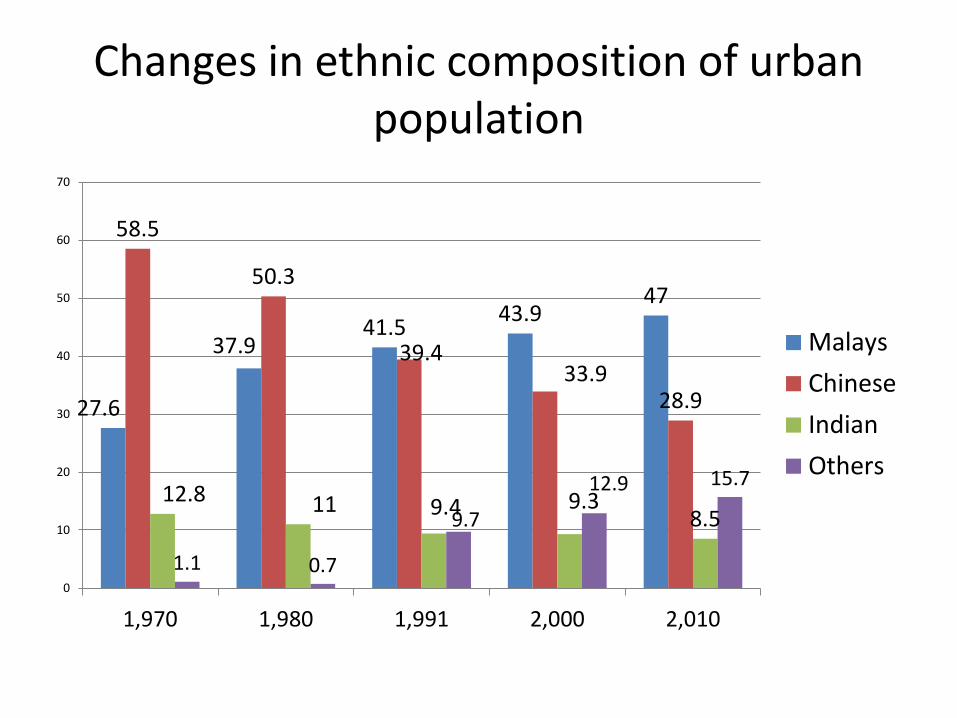
Changes in ethnic composition of urban population
27.6
37.9 41.5
43.9 47
58.5
50.3
39.4 33.9
28.9
12.8 11 9.4 9.3 8.5
1.1 0.7
9.7
12.9 15.7
0
10
20
30
40
50
60
70
1,970 1,980 1,991 2,000 2,010
Malays
Chinese
Indian
Others

33
Economic transformation since 1970
1970 1975 1985 1990 2000 2005
Agriculture 52.6 47.6 31.3 26.0 15.7 12.9
Mining 2.6 2.2 0.8 0.6 0.4 0.4
Manufacturing 9.6 11.1 15.2 19.9 27.7 29.7
Construction 2.7 4.0 7.6 6.3 8.1 7.0
Utilities 0.7 0.6 0.8 0.7 0.8 0.8
Transport/
communication 3.9 4.5 4.3 4.5 5.0 5.8
Sales 9.3 12 16.3 18.2 17.1 17.7
Government 8.5 12.9 14.6 *19.8 10.6 9.7
Finance * 1.0 3.5 3.9 5.4 6.7
Other services *9.6 4.1 5.6 * 9.6 10.3
Other consequences of migration
• agglomeration and economy of scale
• regional disparity and land abandonment in the rural areas (but remittances benefited rural areas)
• Escalating prices of houses
• Urban poverty.
• Pollution, traffic congestion, environmental degradation
• Rising crimes
Polices, programmes and strategies
• No direct policy on internal migration, but economic policies affect migration
• National Urbanization Policy and National Physical Policy
• Strategies for managing urban growth while enhancing productivity and efficiency of small towns and rural areas
• The Greater KL initiative under the ETP is to create an urban agglomeration to spur the country’s economic growth, and this will attract more migrants to the region
• Corridor development – expected employment by around 2025 – Iskandar Malaysia (1.4 million), NCER (3.1 million), ECER (1.9 million), SDC (2.1 million), SCORE (3.0 million)
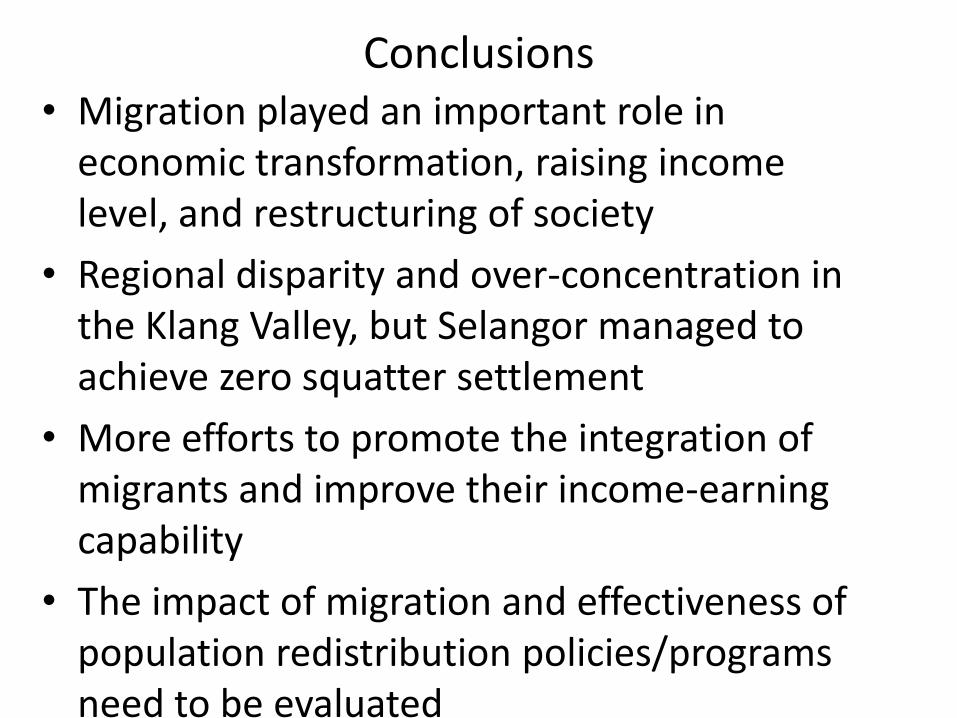
Conclusions • Migration played an important role in
economic transformation, raising income level, and restructuring of society
• Regional disparity and over-concentration in the Klang Valley, but Selangor managed to achieve zero squatter settlement
• More efforts to promote the integration of migrants and improve their income-earning capability
• The impact of migration and effectiveness of population redistribution policies/programs need to be evaluated

Thank you!
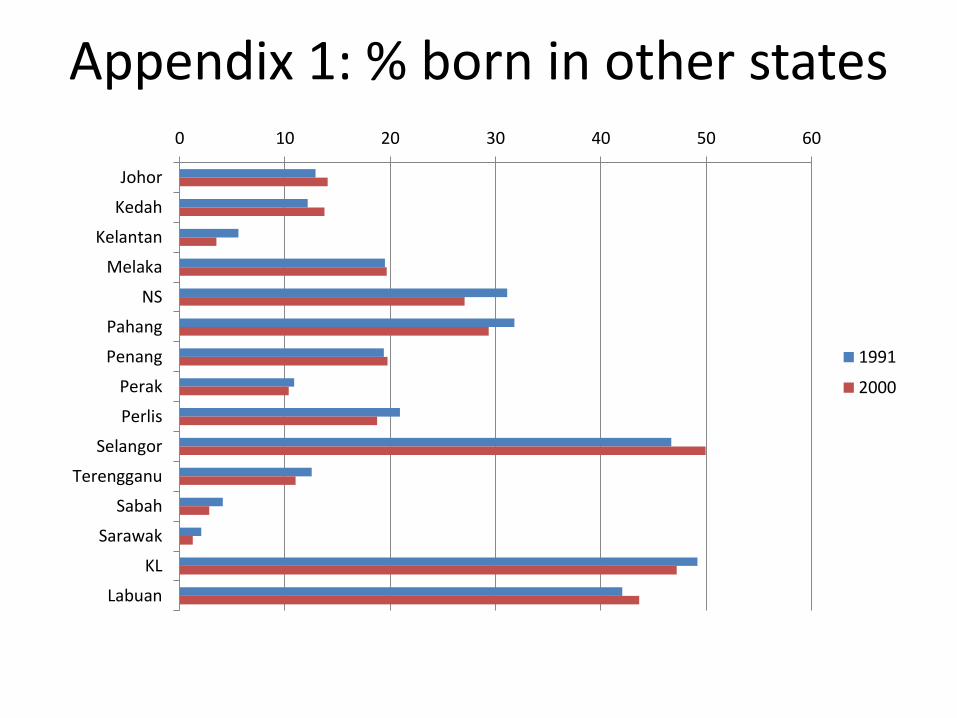
Appendix 1: % born in other states 0 10 20 30 40 50 60
Johor
Kedah
Kelantan
Melaka
NS
Pahang
Penang
Perak
Perlis
Selangor
Terengganu
Sabah
Sarawak
KL
Labuan
1991
2000
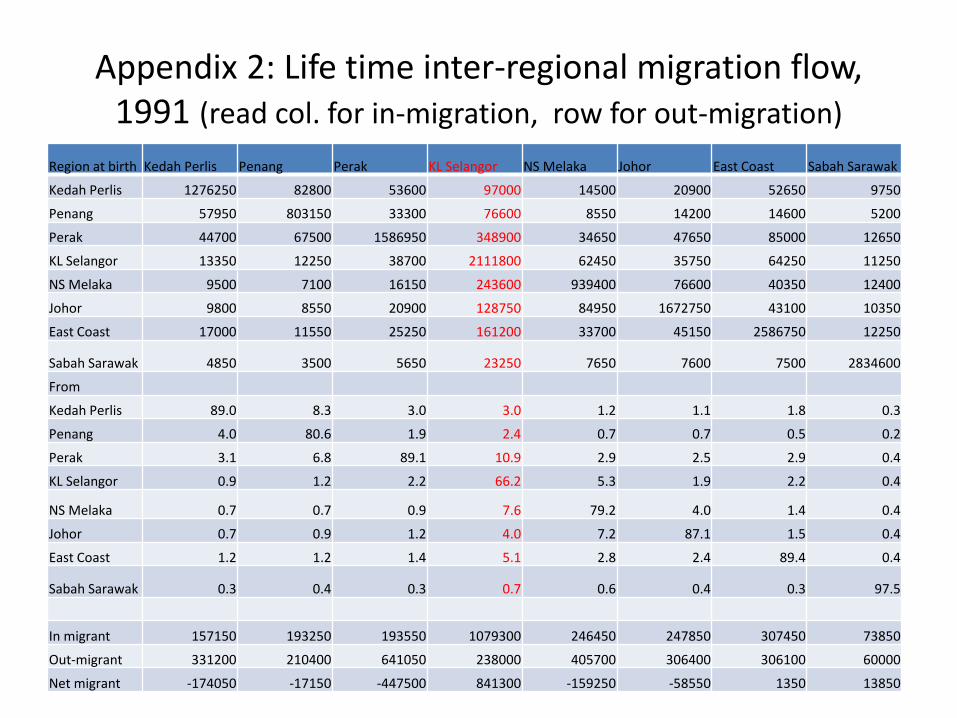
Appendix 2: Life time inter-regional migration flow, 1991 (read col. for in-migration, row for out-migration)
Region at birth Kedah Perlis Penang Perak KL Selangor NS Melaka Johor East Coast Sabah Sarawak
Kedah Perlis 1276250 82800 53600 97000 14500 20900 52650 9750
Penang 57950 803150 33300 76600 8550 14200 14600 5200
Perak 44700 67500 1586950 348900 34650 47650 85000 12650
KL Selangor 13350 12250 38700 2111800 62450 35750 64250 11250
NS Melaka 9500 7100 16150 243600 939400 76600 40350 12400
Johor 9800 8550 20900 128750 84950 1672750 43100 10350
East Coast 17000 11550 25250 161200 33700 45150 2586750 12250
Sabah Sarawak 4850 3500 5650 23250 7650 7600 7500 2834600
From
Kedah Perlis 89.0 8.3 3.0 3.0 1.2 1.1 1.8 0.3
Penang 4.0 80.6 1.9 2.4 0.7 0.7 0.5 0.2
Perak 3.1 6.8 89.1 10.9 2.9 2.5 2.9 0.4
KL Selangor 0.9 1.2 2.2 66.2 5.3 1.9 2.2 0.4
NS Melaka 0.7 0.7 0.9 7.6 79.2 4.0 1.4 0.4
Johor 0.7 0.9 1.2 4.0 7.2 87.1 1.5 0.4
East Coast 1.2 1.2 1.4 5.1 2.8 2.4 89.4 0.4
Sabah Sarawak 0.3 0.4 0.3 0.7 0.6 0.4 0.3 97.5
In migrant 157150 193250 193550 1079300 246450 247850 307450 73850
Out-migrant 331200 210400 641050 238000 405700 306400 306100 60000
Net migrant -174050 -17150 -447500 841300 -159250 -58550 1350 13850
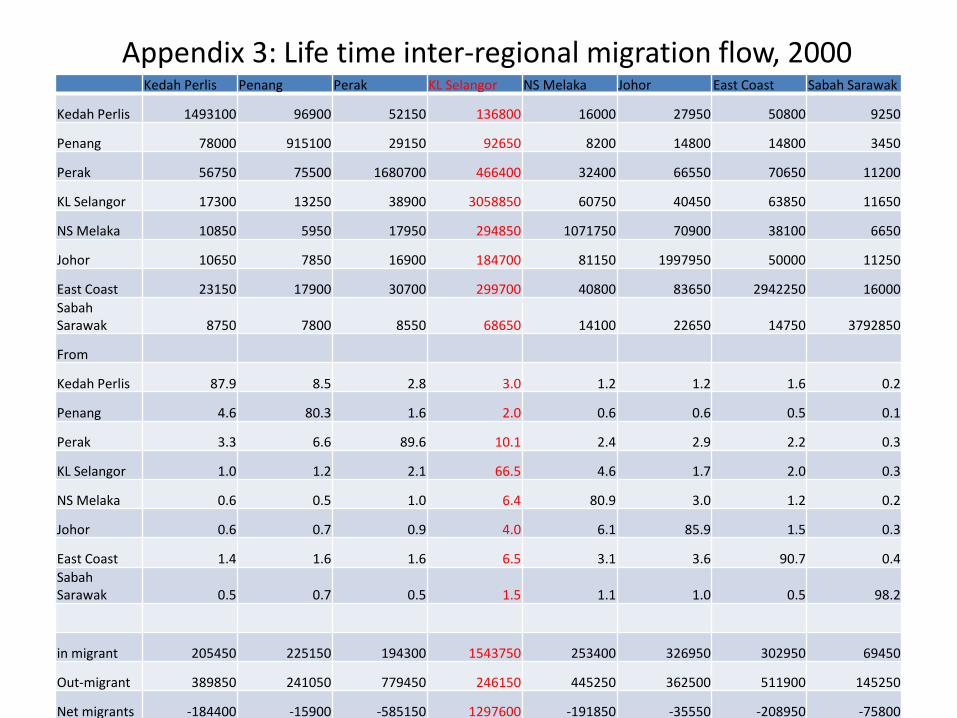
Appendix 3: Life time inter-regional migration flow, 2000 Kedah Perlis Penang Perak KL Selangor NS Melaka Johor East Coast Sabah Sarawak
Kedah Perlis 1493100 96900 52150 136800 16000 27950 50800 9250
Penang 78000 915100 29150 92650 8200 14800 14800 3450
Perak 56750 75500 1680700 466400 32400 66550 70650 11200
KL Selangor 17300 13250 38900 3058850 60750 40450 63850 11650
NS Melaka 10850 5950 17950 294850 1071750 70900 38100 6650
Johor 10650 7850 16900 184700 81150 1997950 50000 11250
East Coast 23150 17900 30700 299700 40800 83650 2942250 16000
Sabah Sarawak 8750 7800 8550 68650 14100 22650 14750 3792850
From
Kedah Perlis 87.9 8.5 2.8 3.0 1.2 1.2 1.6 0.2
Penang 4.6 80.3 1.6 2.0 0.6 0.6 0.5 0.1
Perak 3.3 6.6 89.6 10.1 2.4 2.9 2.2 0.3
KL Selangor 1.0 1.2 2.1 66.5 4.6 1.7 2.0 0.3
NS Melaka 0.6 0.5 1.0 6.4 80.9 3.0 1.2 0.2
Johor 0.6 0.7 0.9 4.0 6.1 85.9 1.5 0.3
East Coast 1.4 1.6 1.6 6.5 3.1 3.6 90.7 0.4
Sabah Sarawak 0.5 0.7 0.5 1.5 1.1 1.0 0.5 98.2
in migrant 205450 225150 194300 1543750 253400 326950 302950 69450
Out-migrant 389850 241050 779450 246150 445250 362500 511900 145250
Net migrants -184400 -15900 -585150 1297600 -191850 -35550 -208950 -75800
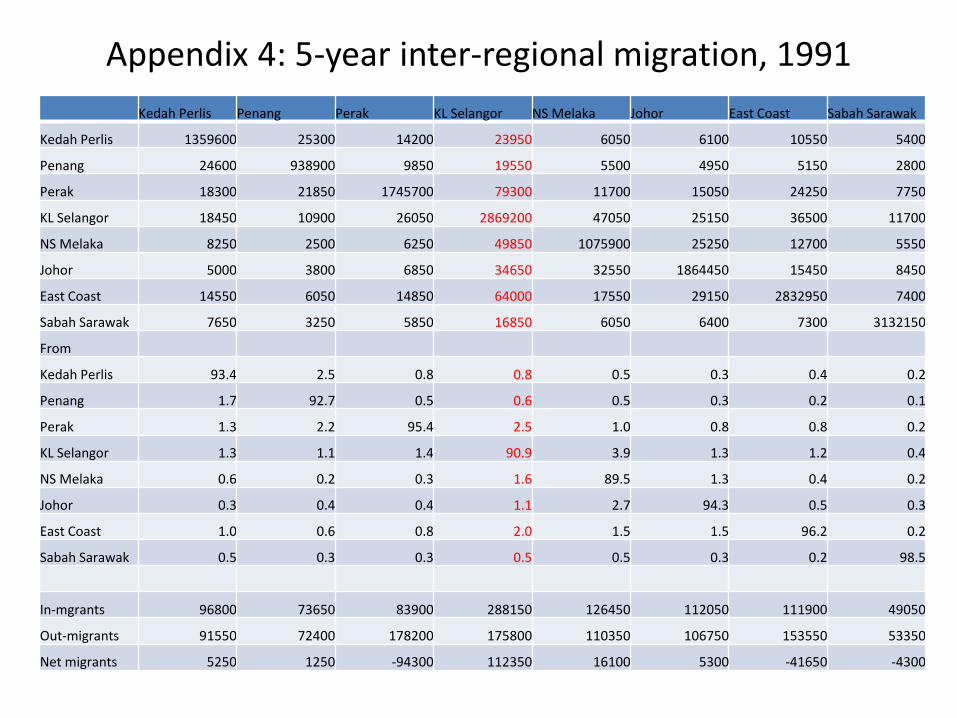
Appendix 4: 5-year inter-regional migration, 1991
Kedah Perlis Penang Perak KL Selangor NS Melaka Johor East Coast Sabah Sarawak
Kedah Perlis 1359600 25300 14200 23950 6050 6100 10550 5400
Penang 24600 938900 9850 19550 5500 4950 5150 2800
Perak 18300 21850 1745700 79300 11700 15050 24250 7750
KL Selangor 18450 10900 26050 2869200 47050 25150 36500 11700
NS Melaka 8250 2500 6250 49850 1075900 25250 12700 5550
Johor 5000 3800 6850 34650 32550 1864450 15450 8450
East Coast 14550 6050 14850 64000 17550 29150 2832950 7400
Sabah Sarawak 7650 3250 5850 16850 6050 6400 7300 3132150
From
Kedah Perlis 93.4 2.5 0.8 0.8 0.5 0.3 0.4 0.2
Penang 1.7 92.7 0.5 0.6 0.5 0.3 0.2 0.1
Perak 1.3 2.2 95.4 2.5 1.0 0.8 0.8 0.2
KL Selangor 1.3 1.1 1.4 90.9 3.9 1.3 1.2 0.4
NS Melaka 0.6 0.2 0.3 1.6 89.5 1.3 0.4 0.2
Johor 0.3 0.4 0.4 1.1 2.7 94.3 0.5 0.3
East Coast 1.0 0.6 0.8 2.0 1.5 1.5 96.2 0.2
Sabah Sarawak 0.5 0.3 0.3 0.5 0.5 0.3 0.2 98.5
In-mgrants 96800 73650 83900 288150 126450 112050 111900 49050
Out-migrants 91550 72400 178200 175800 110350 106750 153550 53350
Net migrants 5250 1250 -94300 112350 16100 5300 -41650 -4300

Appendix 5: 5-year inter-regional migration, 2000
Kedah Perlis Penang Perak KL Selangor NS Melaka Johor East Coast Sabah Sarawak
Kedah Perlis 1603700 20850 8400 21600 4050 6000 5900 4150
Penang 16350 1069250 6400 12250 2000 4250 2900 1500
Perak 11850 13550 1806550 51350 5050 12250 7900 4350
KL Selangor 13800 9100 21100 4164600 35600 20600 23200 9850
NS Melaka 2850 1650 3650 33000 1252050 16150 9700 2100
Johor 3400 2600 6450 34550 17800 2163850 12950 3500
East Coast 7650 5800 9500 65150 14250 26450 3155650 7700
Sabah Sarawak 4000 3500 3150 31700 7100 11250 10550 3966300
From
Kedah Perlis 96.4 1.9 0.5 0.5 0.3 0.3 0.2 0.1
Penang 1.0 94.9 0.3 0.3 0.1 0.2 0.1 0.0
Perak 0.7 1.2 96.9 1.2 0.4 0.5 0.2 0.1
KL Selangor 0.8 0.8 1.1 94.3 2.7 0.9 0.7 0.2
NS Melaka 0.2 0.1 0.2 0.7 93.6 0.7 0.3 0.1
Johor 0.2 0.2 0.3 0.8 1.3 95.7 0.4 0.1
East Coast 0.5 0.5 0.5 1.5 1.1 1.2 97.7 0.2
Sabah Sarawak 0.2 0.3 0.2 0.7 0.5 0.5 0.3 99.2
in-migrants 59900 57050 58650 249600 85850 96950 73100 33150
Out-migrants 70950 45650 106300 133250 69100 81250 136500 71250
Net-migrants -11050 11400 -47650 116350 16750 15700 -63400 -38100