Internal Medicine Evaluation of ruminal motility using an ...
7
1750 *Correspondence to: Kim, D.: [email protected] ©2020 The Japanese Society of Veterinary Science This is an open-access article distributed under the terms of the Creative Commons Attribution Non-Commercial No Derivatives (by-nc-nd) License. (CC-BY-NC-ND 4.0: https://creativecommons.org/licenses/by-nc-nd/4.0/) FULL PAPER Internal Medicine Evaluation of ruminal motility using an indwelling 3-axis accelerometer in the reticulum in cattle Woojae CHOI 1) , Younghye RO 1) , Leegon HONG 1) , Sunmin AHN 1) , Heejin KIM 3) , Changhyuk CHOI 3) , Hakseung KIM 3) and Danil KIM 1,2) * 1) Department of Farm Animal Medicine, College of Veterinary Medicine, Seoul National University, Seoul 08826, Republic of Korea 2) Farm Animal Clinical Training and Research Center, Institutes of Green-Bio Science and Technology, Seoul National University, Pyeongchang 25354, Republic of Korea 3) uLikeKorea Co., Inc., Seoul 05836, Republic of Korea ABSTRACT. Attempts to increase production and improve farm environments have been made for several years. Rumen motility (RM) is one of the biological parameters that provides essential information of individuals in ruminants, and it is usually evaluated by auscultation. The study was aimed to examine RM using the 3-axis accelerometer (3XA) in cattle. The manufactured 3XA were placed in the reticulum (3XA-R) and implanted in the subcutaneous layer of the brisket (3XA-SC), respectively, and the accelerations were compared following intramuscular injection of xylazine (0.05 mg/kg) or saline in experiment 1 and of xylazine (0.05 mg/kg) or atropine (0.04 mg/kg) in experiment 2. In experiment 3, the dose-dependent decrease of RM was evaluated following xylazine administration (0, 0.05, 0.1 mg/kg) in the 3XA-R equipped cows via a 3 × 3 Latin square method. In experiment 1, saline-treated animals showed a continuous fluctuation while the frequency and amplitude of 3XA-R in xylazine-injected cows were reduced after administration. The acceleration of 3XA-SC was changed after administration, but not abruptly. Among the motion parameters, V2 was calculated only using X- and Z-axis acceleration in consideration of the cylindrical shape, and it showed the apparent difference between pre- and post-xylazine administration. In experiment 2, the V2 of 3XA-R was decreased after atropine administration while that of 3XA-SC was maintained. In experiment 3, a dose-dependent V2 decrement of 3XA-R after xylazine administration was observed and lasted for 40 and 80 min in doses of 0.05 mg/kg and 0.1 mg/kg, respectively. In conclusion, The 3XA detected the decrease in RM efficiently and processed the data wirelessly without interference from body movement. This technology will help detect problems early and prevent a decline in cattle productivity. KEY WORDS: 3-axis accelerometer, biocapsule, cattle, reticular contraction, rumen motility With the development of information and communication technology (ICT), the cattle industrial field has been changing. A variety of products have been developed and used, from products that predict estrus and inform the time of fertilization to products that inform the onset of delivery based on changes in activity and/or body temperature [9, 15]. These products are mainly made and used in a form attached to the body or neck collar [12, 21, 24], but products installed within the body are also being developed [1, 2]. An externally attached device has advantages in easy mounting and wireless transmission compared to an internally implanted device. However, these types of equipment have a high risk of loss of the product, whether it is attached to the neck collar or in the form of an ear tag, and it is necessary to set the logic through the collection and analysis of a relatively large amount of data until productization due to the influence of the external environment [24]. On the other hand, an internally installed device can accurately reflect the environment where the device is located within the cattle without the influence of the external environment, but another problem is that the data should be transmitted from the inside of the body to the outside wirelessly [1, 2, 20]. Moreover, because there are various regulations related to animal healthcare or food control by country, this issue should be considered before developing the device [15, 20]. Rumen motility (RM) is an example of biological information that is basically collected in clinical physical examinations and is very important for evaluating the health status of individuals in ruminants. In normal healthy individuals, RM is clinically evaluated Received: 2 August 2020 Accepted: 23 October 2020 Advanced Epub: 9 November 2020 J. Vet. Med. Sci. 82(12): 1750–1756, 2020 doi: 10.1292/jvms.20-0459
Transcript of Internal Medicine Evaluation of ruminal motility using an ...

1750
*Correspondence to: Kim, D.: [email protected]©2020 The Japanese Society of Veterinary Science
This is an open-access article distributed under the terms of the Creative Commons Attribution Non-Commercial No Derivatives (by-nc-nd) License. (CC-BY-NC-ND 4.0: https://creativecommons.org/licenses/by-nc-nd/4.0/)
FULL PAPERInternal Medicine
Evaluation of ruminal motility using an indwelling 3-axis accelerometer in the reticulum in cattleWoojae CHOI1), Younghye RO1), Leegon HONG1), Sunmin AHN1), Heejin KIM3), Changhyuk CHOI3), Hakseung KIM3) and Danil KIM1,2)*
1)Department of Farm Animal Medicine, College of Veterinary Medicine, Seoul National University, Seoul 08826, Republic of Korea
2)Farm Animal Clinical Training and Research Center, Institutes of Green-Bio Science and Technology, Seoul National University, Pyeongchang 25354, Republic of Korea
3)uLikeKorea Co., Inc., Seoul 05836, Republic of Korea
ABSTRACT. Attempts to increase production and improve farm environments have been made for several years. Rumen motility (RM) is one of the biological parameters that provides essential information of individuals in ruminants, and it is usually evaluated by auscultation. The study was aimed to examine RM using the 3-axis accelerometer (3XA) in cattle. The manufactured 3XA were placed in the reticulum (3XA-R) and implanted in the subcutaneous layer of the brisket (3XA-SC), respectively, and the accelerations were compared following intramuscular injection of xylazine (0.05 mg/kg) or saline in experiment 1 and of xylazine (0.05 mg/kg) or atropine (0.04 mg/kg) in experiment 2. In experiment 3, the dose-dependent decrease of RM was evaluated following xylazine administration (0, 0.05, 0.1 mg/kg) in the 3XA-R equipped cows via a 3 × 3 Latin square method. In experiment 1, saline-treated animals showed a continuous fluctuation while the frequency and amplitude of 3XA-R in xylazine-injected cows were reduced after administration. The acceleration of 3XA-SC was changed after administration, but not abruptly. Among the motion parameters, V2 was calculated only using X- and Z-axis acceleration in consideration of the cylindrical shape, and it showed the apparent difference between pre- and post-xylazine administration. In experiment 2, the V2 of 3XA-R was decreased after atropine administration while that of 3XA-SC was maintained. In experiment 3, a dose-dependent V2 decrement of 3XA-R after xylazine administration was observed and lasted for 40 and 80 min in doses of 0.05 mg/kg and 0.1 mg/kg, respectively. In conclusion, The 3XA detected the decrease in RM efficiently and processed the data wirelessly without interference from body movement. This technology will help detect problems early and prevent a decline in cattle productivity.
KEY WORDS: 3-axis accelerometer, biocapsule, cattle, reticular contraction, rumen motility
With the development of information and communication technology (ICT), the cattle industrial field has been changing. A variety of products have been developed and used, from products that predict estrus and inform the time of fertilization to products that inform the onset of delivery based on changes in activity and/or body temperature [9, 15]. These products are mainly made and used in a form attached to the body or neck collar [12, 21, 24], but products installed within the body are also being developed [1, 2].
An externally attached device has advantages in easy mounting and wireless transmission compared to an internally implanted device. However, these types of equipment have a high risk of loss of the product, whether it is attached to the neck collar or in the form of an ear tag, and it is necessary to set the logic through the collection and analysis of a relatively large amount of data until productization due to the influence of the external environment [24]. On the other hand, an internally installed device can accurately reflect the environment where the device is located within the cattle without the influence of the external environment, but another problem is that the data should be transmitted from the inside of the body to the outside wirelessly [1, 2, 20]. Moreover, because there are various regulations related to animal healthcare or food control by country, this issue should be considered before developing the device [15, 20].
Rumen motility (RM) is an example of biological information that is basically collected in clinical physical examinations and is very important for evaluating the health status of individuals in ruminants. In normal healthy individuals, RM is clinically evaluated
Received: 2 August 2020Accepted: 23 October 2020Advanced Epub: 9 November 2020
J. Vet. Med. Sci. 82(12): 1750–1756, 2020doi: 10.1292/jvms.20-0459
3-AXIS ACCELEROMETER FOR RUMINAL MOTILITY
J. Vet. Med. Sci. 82(12): 17511750–1756, 2020
by auscultation in the left paralumbar fossa, and attempts have been made to evaluate RM by detecting the movement of the muscle around the left paralumbar fossa using the strain gauge force transducer [3, 11]. In addition, attempts were also made to use a minimized bolus-type wireless sensor node with a built-in three-axis accelerometer [17]. The three-axis acceleration sensor (3XA) has been variously used in cattle for the purpose of acquiring the biological information of an individual [4, 6, 19, 23]. It has been used in various ways, such as to measure the amount of exercise by attaching it to the ear or ankle [24], to detect lameness [18], and so on.
In this study, we evaluated whether the RM of a cow can be measured by using a 3XA indwelled in the body. When fed to the cow, 3XA embedded in the capsule-type device usually sinks to the floor of the reticulum due to its weight [16]. It is assumed that when the reticulum contracts prior to rumen contraction, the device will rise with the contractile wave of the reticular wall and subside accompanied by the liquid contents. By reading this movement of the device with a 3XA, RM can be evaluated indirectly. Therefore, the purpose of this study is to confirm whether RM can be evaluated by using the information obtained from a 3XA embedded in the ICT equipment indwelled in the reticulum.
MATERIALS AND METHODS
AnimalsA total of nine non-pregnant, non-lactating Holstein cows were used in three experiments. They were reared together in a free-
stall barn. Concentrate and hay were fed twice a day, and water was freely accessible. All experimental protocols were validated by the Institutional Animal Care Use Committee of Seoul National University (SNU-190922-3).
DeviceThe 3XA used in this experiment was built into a Biocapsule (uLikeKorea Co., Inc., Seoul, Republic of Korea). The Biocapsule
weighing 180 to 200 g has a cylindrical shape of 36 mm in diameter and 125 mm in length and includes a temperature sensor along with a 3XA (Fig. 1). The X-axis is in the long axis direction of the device. The horizontal and vertical directions of the long axis are the Y- and Z-axis, respectively. Before the first experiment, the capsule was fed and settled in the reticulum. The data transmission was performed using a LoRa network wirelessly, and the fluctuation, which means movement, and the baseline, which means posture, were recorded.
Acceleration data conversion for comparisonFor the comparison of acceleration, the 3-axis acceleration value was converted as follows:
V � � �X Y Z2 2 2
V1 X� �� � � �� � � �� �� � �t t t t t tX Y Y Z Z1
2
1
2
1
2
V2 X� �� � � �� �� �t t t tX Z Z1
2
1
2
The V value signifies the magnitude of the data of the 3XA, and V1 represents the amount of change in the V value. Here, the V2 value is calculated by removing the Y-axis value in consideration of the shape of the capsule and its expected movement.
Experimental designThree experiments were conducted for this study. In experiment 1, it was confirmed whether the acceleration data generated by the
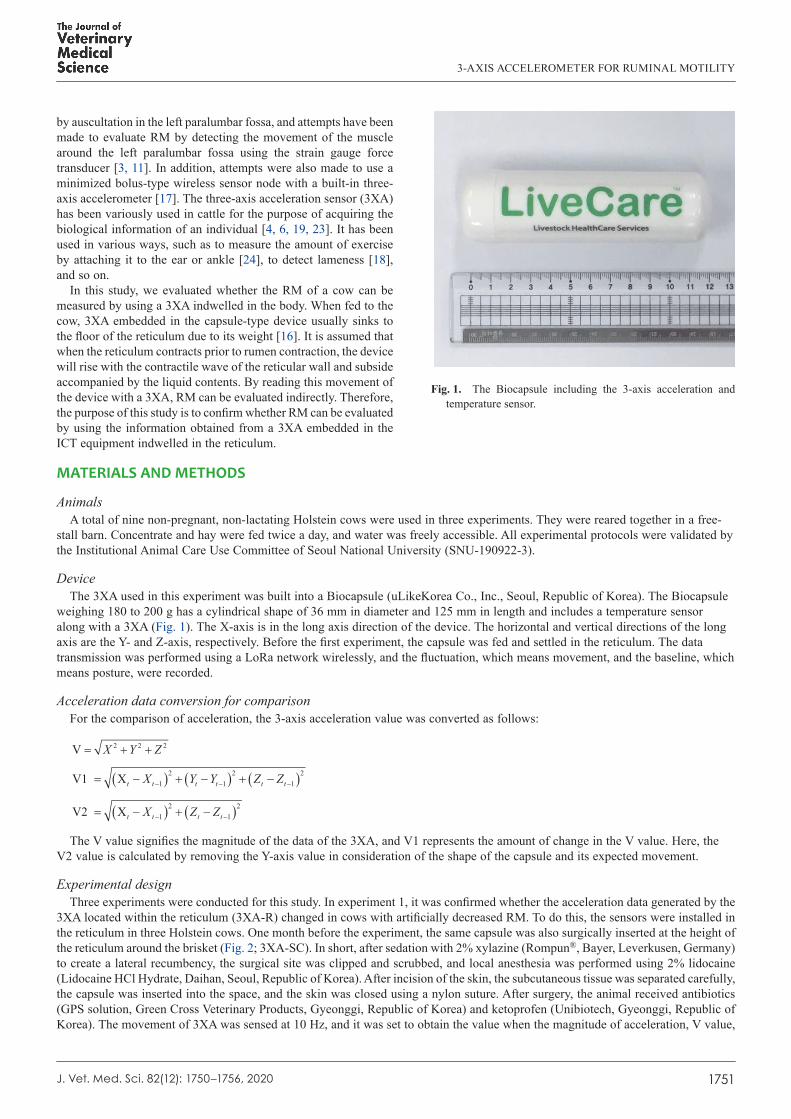
3XA located within the reticulum (3XA-R) changed in cows with artificially decreased RM. To do this, the sensors were installed in the reticulum in three Holstein cows. One month before the experiment, the same capsule was also surgically inserted at the height of the reticulum around the brisket (Fig. 2; 3XA-SC). In short, after sedation with 2% xylazine (Rompun®, Bayer, Leverkusen, Germany) to create a lateral recumbency, the surgical site was clipped and scrubbed, and local anesthesia was performed using 2% lidocaine (Lidocaine HCl Hydrate, Daihan, Seoul, Republic of Korea). After incision of the skin, the subcutaneous tissue was separated carefully, the capsule was inserted into the space, and the skin was closed using a nylon suture. After surgery, the animal received antibiotics (GPS solution, Green Cross Veterinary Products, Gyeonggi, Republic of Korea) and ketoprofen (Unibiotech, Gyeonggi, Republic of Korea). The movement of 3XA was sensed at 10 Hz, and it was set to obtain the value when the magnitude of acceleration, V value,
Fig. 1. The Biocapsule including the 3-axis acceleration and temperature sensor.

W. CHOI ET AL.
1752J. Vet. Med. Sci. 82(12): 1750–1756, 2020
was the largest among the acceleration values of each axis generated during 24 sec. The collected values were transmitted and recorded every two min for 4 hr.
In order to induce changes in RM, xylazine (0.05 mg/kg) was administered intramuscularly, and acceleration data collected from the 3XA-R and the 3XA-SC were compared. Three days later, physiological saline was administered and data were obtained in the same manner.
Since xylazine reduces the movement of the whole body by inducing sedation as well as RM [5], experiment 2 was conducted to evaluate whether the data obtained from the 3XA-R reflects mainly the movement of the rumen or reflects the movement both of the rumen and the whole body. To do this, three cows with 3XA-R used in experiment 1 were used as experimental animals. Xylazine was administered intramuscularly (0.1 mg/kg) to cows, and a week later, atropine (Atropine sulfate, Daihan, Seoul, Republic of Korea; 0.04 mg/kg), which reduces RM without sedative effect [5], was administered subcutaneously. As with experiment 1, acceleration data was obtained at 24-sec intervals.
Experiment 3 was conducted to confirm whether the 3XA-R could grasp the decrease in RM, which was dose-dependently decreased due to the administration of xylazine. For this experiment, nine non-pregnant, non-lactating Holstein cows with 3XA-R were used. The experiment was conducted using the 3 × 3 Latin square method, and in each trial, 0.05 mg/kg xylazine (T1), 0.1 mg/kg xylazine (T2), and normal saline (CON) were administered intramuscularly. The data of the 3XA-R was acquired in 2-min intervals for 4 hr, 2 hr before and after the administration. With obtained data, an average value for 10 min was calculated and used as data to determine the decrease in RM. Simultaneously, RM was also clinically evaluated by auscultation on the left paralumbar fossa before, 0.5, 1, and 2 hr after administration.
Statistical analysisThe data obtained in experiment 3 were statistically analyzed for differences between groups over time using two-way repeated
measures ANOVA, and Dunnett’s Method was used for the differences between groups and between time points. All data were analyzed using SigmaPlot 12.5 (Systat Software Inc., San Jose, CA, USA), and the significance was set at P<0.05 for all analyses.
RESULTS
Experiment 1Figure 3 shows raw data obtained from an individual administered xylazine (A) and an individual administered physiological
saline (B) and its converted data (C, D, E) obtained from 3XA-R and 3XA-SC. In Fig. 3A, the acceleration value of the 3XA-R fluctuated at a constant level for each axis until xylazine administration. After the induction of sedation, the frequency and amplitude of the accelerations were reduced from about 10 min after the xylazine administration, and the pattern was maintained for about 60 min. Thereafter, the fluctuation of acceleration value appeared again similar to how it was before administration. Although the change in the acceleration value obtained from the 3XA-SC was smaller after administration than before administration, there was no remarkable change. Figure 3B shows the acceleration values obtained from an individual administered physiological saline, and there was no difference in the pattern of fluctuation before or after administration.
Figure 3C represents a V value calculated with the acceleration value from the 3XA-R and the 3XA-SC shown in Fig. 3A. As a result, before the administration of xylazine, the V value oscillated between 1,000 and 1,600, but the width of the vibration decreased to a range of between 1,200 to 1,290 after the administration of xylazine. In order to maximize the difference between pre- and post-administration, the V1 and V2 are drawn in Fig. 3D and 3E, respectively. The difference between before and after xylazine administration was expressed more clearly in V2 than in V1.
Experiment 2The V2 value from the 3XA-R of the cow administered xylazine (No. 46, Fig. 4A) was kept low from about 10 to 80 min after
administration. The cow administered atropine sulfate (No. 168, Fig. 4B) remained low for approximately 15 to 60 min after administration. On the other hand, the xylazine-administered cow sat down and did not move for a while after administration due to the sedative effect, but the data obtained from the 3XA-SC did not show any difference before and after administration. The atropine-administered cow (No. 168, Fig. 4B) continued to move, and data obtained from the 3XA-SC appeared at a high peak
Fig. 2. Subcutaneously implanted 3-axis accelerometer embedded in the capsule.

3-AXIS ACCELEROMETER FOR RUMINAL MOTILITY
J. Vet. Med. Sci. 82(12): 17531750–1756, 2020
Fig. 3. Results of the first experiment. 3-axis acceleration data from a 3-axis accelerometer installed in the reticulum (3XA-R) and implanted in the subcutaneous tissue (3XA-SC) in a cow administered xylazine (A) and normal saline (B). Converted acceleration data of the xylazine-administered cow (No. 46) was calculated as V (C), V1 (D), and V2 (E). The vertical dot line at 0 min represents the injection time.

W. CHOI ET AL.
1754J. Vet. Med. Sci. 82(12): 1750–1756, 2020
immediately after administration. Here, V2 value from the 3XA-SC which was expected to reflect the whole body movement was altered independently to that from the 3XA-R. Therefore, the data obtained from the 3XA-R seems to be affected mainly by the capsule movement caused by reticular contraction than by body movement.
Experiment 3Figure 5 shows the V2 values obtained from T1, T2, and CON. Cows in T1 and T2 maintained a V2 value of 200 or less for
30 min (25 to 55 min after administration) and 60 min (15 to 75 min after administration), respectively. Compared to the average V2 value of pre-administration in each group, the average value of 20–30 min in T1 and 20–30, 30–40, and 70–80 min in T2 were significantly different (P<0.05). Between groups, the V2 value of T2 was significantly decreased in 30–40 min after xylazine administration, and the values both of T1 and T2 were decreased in 50–60 min (P<0.05). Table 1 shows the results of clinically measured RM. Within T1 and T2 groups, RM was significantly decreased at 30 min and from 30 to 60 min after administration, respectively. Compared to CON, the RM of T1 and T2 was significantly lowered until 30 min and 60 min, respectively (P<0.05).
DISCUSSION
As one of the most important vital signs in ruminants, RM can be clinically evaluated through auscultation on the left paralumbar fossa. Ruminal contraction occurs three to four times every 2 min in healthy individuals under the control of the vagus nerve [8]. RM decreases in cattle with disease, which includes gastrointestinal disorders as well as diseases associated with other organs [13]. In particular, metabolic diseases that usually occur after parturition in dairy cows also induce a decline in RM [7, 10, 14]. Therefore, detecting decreases in RM wirelessly without directly evaluating the health state of the cow can provide enormous advantages for the early diagnosis of disease and the improvement of productivity; this study, moreover, suggests that it may be possible with the use of ICT devices.
In this study, RM was evaluated using a 3XA embedded in a capsule located in the reticulum. The value of the 3XA is basically affected by gravity. Therefore, if the sensor does not move, the V value represents the gravity that the sensor is receiving. Changes in the V value mean that a force is being applied to the 3XA such that the position or stationary direction has changed. In experiments 1 and 2, the value of the 3XA-R was expected to reflect not only the change in the position and direction of the sensor according to the reticular contraction but also the change in the position according to the movement of the entire body. Because the 3XA-SC was fixed to the subcutaneous tissue, it was thought that there would be no change in direction but only a change in position due to the movement of the whole body. The values of each axis produced by the 3XA-SC vibrated within a certain range, and the V value remained constant for most of the measurement time except for the occasional peak. However, the values of each axis generated by the 3XA-R were not located within a certain range and vibrated greatly. This was the result of various forces being applied to the sensor, which include reticular contraction leading to rumen contraction.
Fig. 4. Changes in V2 value calculated with 3-axis acceleration data from a 3-axis accelerometer installed in the reticulum (3XA-R) and implanted in the subcutaneous tissue (3XA-SC) in cows administered xylazine (A) and atropine (B). The vertical dot line at 0 min represents the injection time.

3-AXIS ACCELEROMETER FOR RUMINAL MOTILITY
J. Vet. Med. Sci. 82(12): 17551750–1756, 2020
The V value represents the magnitude of the force received by the 3XA. The reason for the peak of the V value from the 3XA-SC may be due to a large movement at that time, while the V value obtained from the 3XA-R did not show a peak at these times (Fig. 3C). We paid considerable attention to changes in the V value. When only gravity exists, the device was lying on the floor because the center of mass is in the middle. In the reticulum, however, it was tilted according to the shape of the reticular wall even there was no movement. The diversity of the bolus state was sometimes expressed as the difference in the V value pattern depending on the individual. As shown in Fig. 3A, the fluctuating acceleration value before xylazine administration indicates that the force applied to the sensor was constantly altered. When the V1 value was calculated in order to show fluctuations of the V values well, changes in the V1 value before and after xylazine administration were observed (Fig. 3D). However, the acceleration value of the Y-axis which changes when the capsule rotated around the X-axis, the long axis of the capsule, was expected to be more affected by other forces such as liquid flow or rotational inertia rather than reticular contraction. When comparing the results of removing the X-axis, Y-axis, and Z-axis data from the V1 value, respectively, it was confirmed that the V2 value, excluding the acceleration values of the Y-axis, most effectively distinguished between before and after xylazine administration. As shown in Figs. 3E and 4, V2 values oscillated between 0 to 1,000 before administration but only between 0 to 200 after administration.
The administration of xylazine, an alpha2-adrenergic agonist, causes a reduction in RM dose-dependently [5, 22]. In this study, we confirmed whether the 3XA-R embedded in the capsule could detect this dose-dependent decrease. In experiment 3, the V2 value after the administration of xylazine decreased more rapidly in T2 than in T1, and the decreased state lasted longer. It is not yet possible to specify a cut-off point that can diagnose reduced RM. But if it is assumed that a consistent V2 value below 200 represents decreased RM, since it has not been observed that V2 persists below 200 in CON, then it can be confirmed that the reduction in RM is extended according to the dose of xylazine. This reduction can also be confirmed by comparing the clinical evaluation of RM by auscultation. Therefore, it can be seen that a reduction in RM was assessed by the method used in this study. However, this criterion is not universal because it is specific to the device used in this study.
Efforts to increase cattle productivity by using ICT technology are growing rapidly in recent years, and RM is one of the critical evaluation targets. In the present study, we showed that the calculated parameter, V2, from 3XA reflected the own motility of reticulorumen, not of the whole body, and it was possible to detect the dose-dependent decrease in RM induced by different
Table 1. Least square means of clinically measured rumen motility in experiment 3
GroupLeast square means for treatment × time (min) Two-way repeated measure ANOVA
0 30 60 120 Treatment TimeCON 3.286 a* 3.000 a* 3.000 a* 3.571 a* F=4.563
P=0.034F=37.953P<0.001
T1 2.857 a* 1.143 b† 2.286 a* 3.143 a*T2 3.857 a* 0.714 b† 1.000 b† 3.000 a*
T1 and T2 were administered xylazine at a dose of 0.05 mg/kg and 0.1 mg/kg of body weight, respectively. Control group (CON) received the same volume of normal saline with T2. Different alphabet letters represent a significant difference compared to 0 min within group (P<0.05). A different symbol represents a significant difference compared to CON within each time point (P<0.05).
Fig. 5. Dose-dependent decrease in V2 value in cows administered xylazine. T1 and T2 were administered xylazine at a dose of 0.05 mg/kg and 0.1 mg/kg of body weight, respectively. Control group (CON) received the same volume of normal saline with T2. The vertical dot line at 0 min represents the injection time. Significant differences were found when compared to the average of pre-administration in each group (*P<0.05) and when compared to CON in each time point (†P<0.05).

W. CHOI ET AL.
1756J. Vet. Med. Sci. 82(12): 1750–1756, 2020
doses of xylazine administration. For wireless detection, we used a 3XA incorporated in the intra-reticular capsule, commercially available, meaning that wireless monitoring of the rumen motility in a herd may be possible without any additional types of equipment. This technology is expected to make a significant contribution to improving productivity and animal welfare within the cattle industry. Further studies are needed to identify cut-off points of reduced RM and perform a field test in large-scale herds.
POTENTIAL CONFLICTS OF INTEREST. The authors have nothing to disclose.
ACKNOWLEDGMENTS. This work was supported by IPET through the Advanced Production Technology Development Program, funded by MAFRA (318103-2). We also thank uLikeKorea Co., Inc. for their technical assistance.
REFERENCES
1. Alzahal, O., Alzahal, H., Steele, M. A., Van Schaik, M., Kyriazakis, I., Duffield, T. F. and McBride, B. W. 2011. The use of a radiotelemetric ruminal bolus to detect body temperature changes in lactating dairy cattle. J. Dairy Sci. 94: 3568–3574. [Medline] [CrossRef]
2. Andersson, L. M., Okada, H., Miura, R., Zhang, Y., Yoshioka, K., Aso, H. and Itoh, T. 2016. Wearable wireless estrus detection sensor for cows. Comput. Electron. Agric. 127: 101–108. [CrossRef]
3. Arai, S., Okada, H., Sawada, H., Takahashi, Y., Kimura, K. and Itoh, T. 2019. Evaluation of ruminal motility in cattle by a bolus-type wireless sensor. J. Vet. Med. Sci. 81: 1835–1841. [Medline] [CrossRef]
4. Barker, Z. E., Vázquez Diosdado, J. A., Codling, E. A., Bell, N. J., Hodges, H. R., Croft, D. P. and Amory, J. R. 2018. Use of novel sensors combining local positioning and acceleration to measure feeding behavior differences associated with lameness in dairy cattle. J. Dairy Sci. 101: 6310–6321. [Medline] [CrossRef]
5. Braun, U., Gansohr, B. and Haessig, M. 2002. Ultrasonographic evaluation of reticular motility in cows after administration of atropine, scopolamine and xylazine. J. Vet. Med. A Physiol. Pathol. Clin. Med. 49: 299–302. [Medline] [CrossRef]
6. Carpinelli, N. A., Rosa, F., Grazziotin, R. C. B. and Osorio, J. S. 2019. Technical note: A novel approach to estimate dry matter intake of lactating dairy cows through multiple on-cow accelerometers. J. Dairy Sci. 102: 11483–11490. [Medline] [CrossRef]
7. Daniel, R. C. 1983. Motility of the rumen and abomasum during hypocalcaemia. Can. J. Comp. Med. 47: 276–280. [Medline] 8. Foster, D. 2017. Disorders of rumen distension and dysmotility. Vet. Clin. North Am. Food Anim. Pract. 33: 499–512. [Medline] [CrossRef] 9. Fricke, P. M., Carvalho, P. D., Giordano, J. O., Valenza, A., Lopes, G. Jr. and Amundson, M. C. 2014. Expression and detection of estrus in dairy
cows: the role of new technologies. Animal 8 Suppl 1: 134–143. [Medline] [CrossRef] 10. Goff, J. P. 2004. Macromineral disorders of the transition cow. Vet. Clin. North Am. Food Anim. Pract. 20: 471–494, v. [Medline] [CrossRef] 11. Hamilton, A. W., Davison, C., Tachtatzis, C., Andonovic, I., Michie, C., Ferguson, H. J., Somerville, L. and Jonsson, N. N. 2019. Identification of
the rumination in cattle using support vector machines with motion-sensitive bolus sensors. Sensors (Basel) 19: 1165. [Medline] [CrossRef] 12. Homer, E. M., Gao, Y., Meng, X., Dodson, A., Webb, R. and Garnsworthy, P. C. 2013. Technical note: a novel approach to the detection of estrus in
dairy cows using ultra-wideband technology. J. Dairy Sci. 96: 6529–6534. [Medline] [CrossRef] 13. Jyotsana, M., Gupta, M., Rose, M. K., Sindhu, S. and Kar, D. 2013. Metabolic alterations in buffaloes suffering from digestive disorders. Haryana
Vet. 52: 71–72. 14. Leek, B. F. 1983. Clinical diseases of the rumen: a physiologist’s view. Vet. Rec. 113: 10–14. [Medline] [CrossRef] 15. Neethirajan, S. 2017. Recent advances in wearable sensors for animal health management. Sens. Biosensing Res. 12: 15–29. [CrossRef] 16. Neubauer, V., Humer, E., Kröger, I., Braid, T., Wagner, M. and Zebeli, Q. 2018. Differences between pH of indwelling sensors and the pH of
fluid and solid phase in the rumen of dairy cows fed varying concentrate levels. J. Anim. Physiol. Anim. Nutr. (Berl.) 102: 343–349. [Medline] [CrossRef]
17. Nogami, H., Arai, S., Okada, H., Zhan, L. and Itoh, T. 2017. Minimized bolus-Type wireless sensor node with a built-In three-axis acceleration meter for monitoring a cow’s rumen conditions. Sensors (Basel) 17: 687. [Medline] [CrossRef]
18. Okada, K., Kobayashi, H., Hanada, N., Hiranuma, H., Hayashi, N., Arashi, Y., Chida, H., Deguchi, Y. and Sato, S. 2011. Detection of hoof diseases in cattle using a triaxial accelerometer. Jpn. J. Large Anim. Clin. 2: 183–188. [CrossRef]
19. Rahman, A., Smith, D. V., Little, B., Ingham, A. B., Greenwood, P. L. and Bishop-Hurley, G. J. 2018. Cattle behaviour classification from collar, halter, and ear tag sensors. Inf. Process. Agric. 5: 124–133.
20. Sato, S., Kimura, A., Anan, T., Yamagishi, N., Okada, K., Mizuguchi, H. and Ito, K. 2012. A radio transmission pH measurement system for continuous evaluation of fluid pH in the rumen of cows. Vet. Res. Commun. 36: 85–89. [Medline] [CrossRef]
21. Stevenson, J. S., Hill, S. L., Nebel, R. L. and DeJarnette, J. M. 2014. Ovulation timing and conception risk after automated activity monitoring in lactating dairy cows. J. Dairy Sci. 97: 4296–4308. [Medline] [CrossRef]
22. Thompson, J. R., Kersting, K. W. and Hsu, W. H. 1991. Antagonistic effect of atipamezole on xylazine-induced sedation, bradycardia, and ruminal atony in calves. Am. J. Vet. Res. 52: 1265–1268. [Medline]
23. Vázquez Diosdado, J. A., Barker, Z. E., Hodges, H. R., Amory, J. R., Croft, D. P., Bell, N. J. and Codling, E. A. 2015. Classification of behaviour in housed dairy cows using an accelerometer-based activity monitoring system. Anim. Biotelem. 3: 15. [CrossRef]
24. Wolfger, B., Timsit, E., Pajor, E. A., Cook, N., Barkema, H. W. and Orsel, K. 2015. Technical note: Accuracy of an ear tag-attached accelerometer to monitor rumination and feeding behavior in feedlot cattle. J. Anim. Sci. 93: 3164–3168. [Medline] [CrossRef]