INTERNAL C URING OF HIGH PERFORMANCE CON CRET …internally cured concrete, using the recommended...
129
IN PERF LIGH Applied NTERN FORM HTWEI OTH R d Research NAL C MANCE IGHT A HER T Wesl Mitc W. Ja Report No Febr h and Inno URING E CON AGGR TECHN ley A. Jone h W. Hous ason Weis o. CDOT‐2 ruary 201 vation Bra G OF NCRET REGAT NIQUE es se ss 2014‐3 14 anch HIGH E USIN TES AN ES NG ND
Transcript of INTERNAL C URING OF HIGH PERFORMANCE CON CRET …internally cured concrete, using the recommended...

INPERFLIGH
Applied
NTERNFORMHTWEI
OTH
R
d Research
NAL CMANCEIGHT AHER T
WeslMitcW. Ja
Report NoFebr
h and Inno
URINGE CONAGGRTECHN
ley A. Joneh W. Housason Weis
o. CDOT‐2ruary 201
vation Bra
G OF NCRETREGATNIQUE
es se ss
2014‐3 14
anch
HIGH E USINTES ANES
NG ND

DISCLAIMER
The contents of this report reflect the views of the
authors, who is responsible for the facts and
accuracy of the data presented herein. The contents
do not necessarily reflect the official views of the
Colorado Department of Transportation or the
Federal Highway Administration. This report does
not constitute a standard, specification, or regulation.
Certain commercial equipment, instruments, or
materials are identified in this report in order to
foster understanding. Such identification is not
intended to imply that the materials or equipment
identified are necessarily the best available for the
purpose.

Technical Report Documentation Page 1. Report No.
CDOT-2014-3 2. Government Accession No.
3. Recipient's Catalog No.
4. Title and Subtitle
INTERNAL CURING OF HIGH PERFORMANCE CONCRETE USING LIGHTWEIGHT AGGREGATES AND OTHER TECHNIQUES
5. Report Date
February 2014
6. Performing Organization Code
7. Author(s)
Wesley A. Jones, Mitch W. House, W. Jason Weiss 8. Performing Organization Report No.
CDOT-2014-3
9. Performing Organization Name and Address
Purdue University – School of Civil Engineering 550 Stadium Mall Drive West Lafayette, IN 47907
10. Work Unit No. (TRAIS)
11. Contract or Grant No.
12. Sponsoring Agency Name and Address
Colorado Department of Transportation - Research 4201 E. Arkansas Ave. Denver, CO 80222
13. Type of Report and Period Covered
Final
14. Sponsoring Agency Code
22.60
15. Supplementary Notes
Prepared in cooperation with the US Department of Transportation, Federal Highway Administration
16. Abstract
Internally cured concrete has been rapidly emerging over the last decade as an effective way to improve the performance of concrete. Internal curing (IC) holds promise for producing concrete with an increased resistance to early-age cracking and enhanced durability (Bentz and Weiss, 2011). IC is a simple and effective way to cure concrete. Proper internal curing supplies water that is necessary to relieve stress buildup due to self-desiccation. Typically this is done using pre-wetted lightweight aggregates (LWAs), as this is the most commercially available application at the present time. IC has shown reduced autogenous and drying shrinkage cracking, improved fluid absorption resistance, improved compressive strength, and reduced ion diffusion. It is becoming increasingly clear that internal curing has great potential for the concrete industry to create a longer lasting, more sustainable product. This report specifically examines the freeze-thaw resistance of internally cured concrete. It is shown that internally cured concrete, using the recommended mixture proportions (i.e., pre-wetted fine LWAs to replace only the water lost due to chemical shrinkage) is freeze-thaw resistant. Implementation
Internal curing has shown, as outlined in this report, to be a simple and cost-effective way to create longer lasting, more durable concrete. The initial cost of a bridge deck concrete can increase in price anywhere from 3 to 10 $/yd3. However, this percentage when compared with the cost of bridge is typically negligible, especially when considering an increased service live and reduced maintenance cost. CDOT can benefit from this research by applying what has been presented in this study to create longer lasting, more durable bridge decks. 17. Keywords
IC, LWAs, HPC, chemical shrinkage, autogenous shrinkage, drying shrinkage, porous inclusions, transport properties, absorption, desorption, spatial distribution, coarse aggregates, fine aggregates
18. Distribution Statement
This document is available on CDOT’s Research Report website http://www.coloradodot.info/programs/research/pdfs
19. Security Classif. (of this report)
Unclassified 20. Security Classif. (of this page)
Unclassified 21. No. of Pages
129 22. Price
Form DOT F 1700.7 (8-72) Reproduction of completed page authorized

ii
INTERNAL CURING OF HIGH PERFORMANCE CONCRETE USING LIGHTWEIGHT AGGREGATES
AND OTHER TECHNIQUES
Report No. CDOT 2014-3
Submitted to the Colorado Department of Transportation
by
Wesley A. Jones Graduate Research Assistant
Mitch W. House Graduate Research Assistant
W. Jason Weiss Jack and Kay Hockema Professor of Civil Engineering and
Director of Pankow Materials Laboratory
School of Civil Engineering Purdue University
West Lafayette, IN 47907
February 2014

iii
ACKNOWLEDGEMENTS
The authors would like to acknowledge the financial support provided by the Colorado
Department of Transportation (CDOT) for this study. The authors thank the CDOT study
advisory counsel for the assistance they provided throughout the project. The authors
would also like to thank Holcim, TXI/ Trinity Expanded Shale & Clay, Utelite
Corporation, Builex, Inc., and Headwaters Resources for the materials provided for this
study. Also, as work was conducted in the Charles Pankow Concrete Materials
Laboratory at Purdue University the authors are grateful for the support that has made
this laboratory and its operation possible.

iv
EXECUTIVE SUMMARY AND IMPLEMENTATION
Internally cured concrete has been rapidly emerging over the last decade as an effective way to improve the performance of concrete. Internal curing (IC) holds promise for producing concrete with an increased resistance to early-age cracking and enhanced durability (Bentz and Weiss, 2011). It is a simple and effective way to cure concrete. Proper internal curing supplies water that is necessary to relieve stress buildup due to self-desiccation. Typically this is done using pre-wetted lightweight aggregates (LWAs), as this is the most commercially available application at the present time. IC has shown reduced autogenous and drying shrinkage cracking, increased fluid absorption, improved compressive strength, and reduced ion diffusion. It is becoming increasingly clear that internal curing has great potential for the concrete industry to create a longer lasting, more sustainable product. The goal of this study was to reproduce Colorado DOT bridge deck mixtures and to alter these mixtures by replacing portions of normal-weight aggregate (NWA) with various amounts, sizes, and suppliers of pre-wetted LWA. To produce similar mixtures, materials common to, and available in, the Colorado area were obtained and used in this study. Material suppliers for this project are as follows: Aggregate Industries (NWA); Holcim US, Inc. (cement); Headwaters Resources (fly ash); TXI/ Trinity Expanded Shale and Clay (coarse and fine LWA); Utelite Corp. (fine LWA); Buildex, Inc. (fine LWA). The research focused on comparing the fresh, mechanical, freeze-thaw, shrinkage, and transport properties, with an emphasis on cyclic freezing and thawing durability. While many internally cured mixtures were investigated in this study, the report presented recommends a mixture design that supplies the amount of water lost due chemical shrinkage by replacing a portion of the normal-weight fine aggregate with fine LWA. This allows for proper spatial distribution of the porous inclusions used in hydration the cement. Obtaining the correct absorption and moisture contents in the LWA particles are an essential part of creating quality IC mixtures. Two methods were discussed, however it is the opinion of the authors that the centrifuge method (Miller et al., 2013) is the most consistent method for obtaining the moisture content and surface moisture. Internally cured mixtures do not have a significant impact on the slump, although some have noticed improved workability. The pressure method is generally the preferred method for testing air content of fresh concrete since it is easier to perform in the field, although about a 10% variance from the volumetric method is noticed. Note that one would use the volumetric method for testing air content due to porous aggregates, however the pressure method works and is significantly faster. For the recommended IC mixtures the unit weight is not significantly altered, he largest difference being mixture 6 with a decrease by 8%, with the other recommended mixture only decreasing around 2%. In compression the IC mixtures performed similarly, and in some cases showed an improvement up to about 10%, when compared to the standard mixture. The compressive strength of all mixtures was above the values specified by Colorado DOT

v
specifications. This can be attributed to the increased hydration created through internal curing. All IC mixtures showed a reduction in the modulus of elasticity (about 10 – 20%), which will actually benefit mixtures in reducing shrinkage cracking. These results of freeze-thaw testing show that properly air entrained, internally cured concrete with a reasonable w/c have no issues in resisting cyclic freeze-thaw action. However, “excessively” internally cured mixtures, i.e., mixtures that have more pre-wetted LWA than is required to replace water lost due to chemical shrinkage, show up to a potential reduction in durability when compared with the standard Class H mixture. Scaling results showed that internally cured mixtures do not perform any worse than the standard mixtures. Internally cured mixtures minimize autogenous shrinkage and cause expansion (or swelling) in a sealed system. This expansion will eventually relax out over time. Restrained shrinkage showed that IC concrete reduced the residual stress buildup in the material, however this was not as apparent in these “higher” w/c mixtures as it would be when comparing a lower w/c with the IC counterpart. Internally cured mixtures show improved drying shrinkage performance, since water is present in the matrix to continue hydration as the surface dries. Internally cured concrete reduces the chloride diffusion coefficient and pore tortuosity up to 67% compared to standard mixtures, which is attributed to increased hydration and reduced interfacial transition zone (ITZ) percolation. Permeability is also decreased when the recommended IC mixture is used. Sorption properties are comparable from recommended IC mixtures. This report, along with presenting the benefits of internal curing, provides mixture guidelines for internally cured concrete for commercial use in Colorado. Internal curing has shown, as outlined in this report, to be a simple and cost-effective way to create longer lasting, more durable concrete. The initial cost of a bridge deck concrete can increase in price anywhere from 3 to 10 $/yd3. However, this percentage when compared with the cost of bridge is typically quite low, especially when considering the benefits of an increased service live and reduced maintenance cost. The Colorado DOT can benefit from this research by applying what has been presented in this study to create longer lasting, more durable bridge decks.

vi
TABLE OF CONTENTS
CHAPTER 1. INTRODUCTION TO INTERNAL CURING ........................................ 1
1.1 Background ......................................................................................................... 1
1.1.1 A Brief History ................................................................................................1
1.1.2 How Internal Curing Works ............................................................................2
1.2 Motivation for Its Use ......................................................................................... 4
1.3 Research Objectives ............................................................................................ 6
CHAPTER 2. CHARACTERIZATION OF MIXTURES USING INTERNAL CURING FOR COLORADO ............................................................................................. 8
2.1 Evaluated Mixtures ............................................................................................. 8
2.1.1 Phase I Mixtures ..............................................................................................8
2.1.2 Phase II Mixtures ...........................................................................................10
2.2 Materials and Suppliers..................................................................................... 10
2.3 Proportioning for Internal Curing with LWA ................................................... 12
2.4 Spatial Distribution for Internal Curing with LWA .......................................... 14
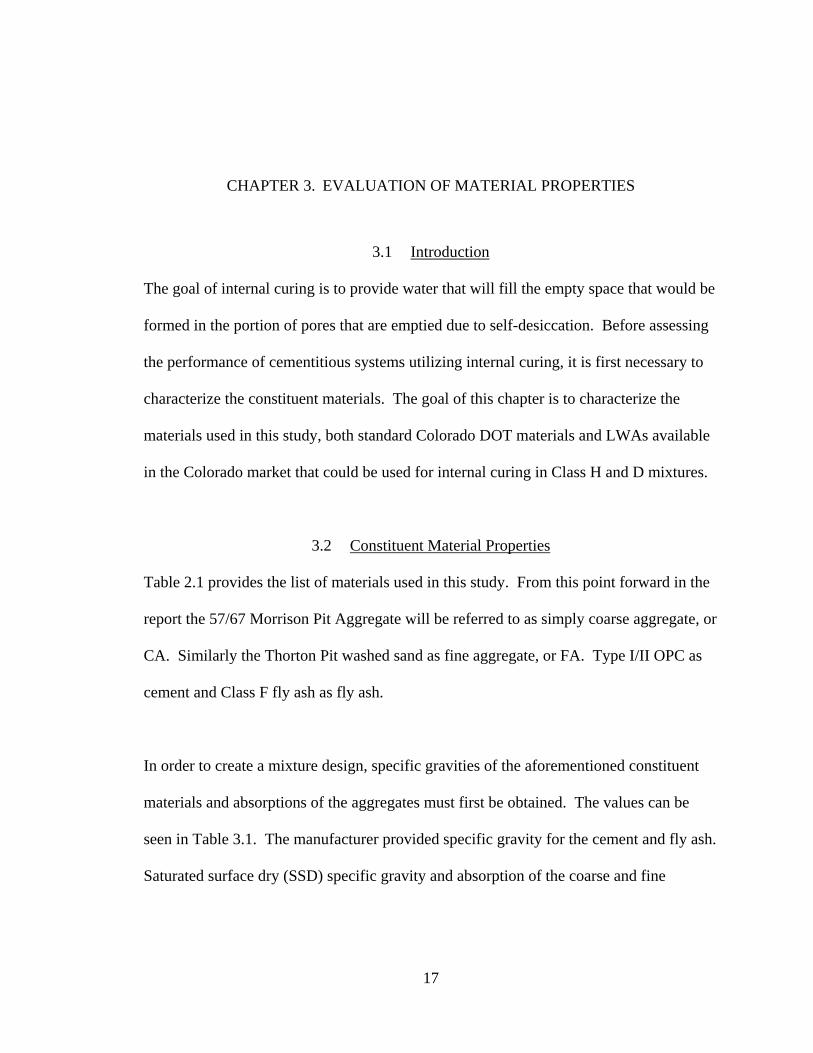
CHAPTER 3. EVALUATION OF MATERIAL PROPERTIES .................................. 17
3.1 Introduction ....................................................................................................... 17
3.2 Constituent Material Properties ........................................................................ 17
3.3 LWA Properties ................................................................................................ 18
3.3.1 A Discussion of Testing Procedures for LWA ..............................................18
3.3.2 Absorption and Specific Gravity ...................................................................19
3.3.3 Desorption .....................................................................................................20
3.4 Coarse Aggregate Gradations ........................................................................... 22
3.5 Cementitious Material ....................................................................................... 22
CHAPTER 4. METHODS AND MATERIALS ........................................................... 25
4.1 Mixtures Evaluated ........................................................................................... 25
4.2 Mixture Proportioning ...................................................................................... 25
4.3 Mixing Procedure.............................................................................................. 27

vii
CHAPTER 5. EVALUATION OF FRESH AND MECHANICAL PROPERTIES ..... 29
5.1 Introduction ....................................................................................................... 29
5.2 Mixing, Placing, and Curing Procedures .......................................................... 30
5.2.1 Fresh Properties .............................................................................................30
5.2.1.1 Slump ..................................................................................................... 30 5.2.1.2 Air Content............................................................................................. 31 5.2.1.3 Unit Weight ............................................................................................ 33
5.2.2 Mechanical Properties ...................................................................................33
5.2.2.1 Compressive Strength ............................................................................ 33 5.2.2.2 Modulus of Elasticity ............................................................................. 34
5.3 Results and Discussions .................................................................................... 35
5.3.1 Fresh Properties .............................................................................................35
5.3.1.1 Preliminary Mixtures ............................................................................. 35 5.3.1.2 Optimized Mixtures ............................................................................... 37
5.3.2 Mechanical Properties ...................................................................................38
5.3.2.1 Preliminary Mixtures ............................................................................. 38 5.3.2.2 Optimized Mixtures ............................................................................... 42
5.4 Summary and Conclusions ............................................................................... 46
CHAPTER 6. EVALUATION OF CYCLIC FREEZING AND THAWING BEHAVIOR ............................................................................................................. 48
6.1 Introduction ....................................................................................................... 48
6.2 Mixing, Placing, and Curing Procedures .......................................................... 48
6.2.1 Rapid Freezing and Thawing .........................................................................49
6.2.2 Scaling Resistance to Deicing Chemicals ......................................................50
6.3 Results and Discussions .................................................................................... 52
6.3.1 Rapid Freezing and Thawing .........................................................................52
6.3.1.1 Preliminary Mixtures ............................................................................. 52 6.3.1.2 Optimized Mixtures ............................................................................... 56
6.3.2 Scaling Resistance to Deicing Chemicals ......................................................59
6.3.2.1 Preliminary Mixtures ............................................................................. 59 6.3.2.2 Optimized Mixtures ............................................................................... 61
6.4 Summary and Conclusions ............................................................................... 63
CHAPTER 7. EVALUATION OF SHRINKAGE PROPERTIES................................ 64
7.1 Introduction ....................................................................................................... 64

viii
7.2 Mixing, Placing, and Curing Procedures .......................................................... 64
7.2.1 Chemical Shrinkage .......................................................................................65
7.2.2 Autogenous Shrinkage ...................................................................................66
7.2.3 Restrained Shrinkage .....................................................................................68
7.2.4 Drying Shrinkage ...........................................................................................70
7.3 Results and Discussions .................................................................................... 70
7.3.1 Chemical Shrinkage .......................................................................................70
7.3.2 Autogenous Shrinkage ...................................................................................72
7.3.2.1 Preliminary Mixtures ............................................................................. 72 7.3.2.2 Optimized Mixtures ............................................................................... 73
7.3.3 Restrained Shrinkage .....................................................................................76
7.3.3.1 Preliminary Mixtures ............................................................................. 77 7.3.3.2 Optimized Mixtures ............................................................................... 78
7.3.4 Drying Shrinkage ...........................................................................................82
7.3.4.1 Preliminary Mixtures ............................................................................. 83 7.3.4.2 Optimized Mixtures ............................................................................... 84
7.4 Summary and Conclusions ............................................................................... 85
CHAPTER 8. EVALUATION OF FLUID TRANSPORT PROPERTIES................... 86
8.1 Introduction ....................................................................................................... 86
8.2 Mixing, Placing, and Curing Procedures .......................................................... 86
8.2.1 Ionic Transport...............................................................................................87
8.2.2 Water Absorption ..........................................................................................89
8.3 Results and Discussion ..................................................................................... 91
8.3.1 Ionic Transport...............................................................................................91
8.3.1.1 Preliminary Mixtures ............................................................................. 91 8.3.1.2 Optimized Mixtures ............................................................................... 92
8.3.2 Water Absorption ..........................................................................................93
8.3.2.1 Preliminary Mixtures ............................................................................. 94 8.3.2.2 Optimized Mixtures ............................................................................... 98
8.4 Summary and Conclusions ............................................................................. 101
CHAPTER 9. SUMMARY AND RECOMMENDATIONS ...................................... 102
9.1 Introduction ..................................................................................................... 102
9.2 Summary of Experimental Results ................................................................. 103

ix
REFERENCES ........................................................................................................... 107
x
LIST OF TABLES
...................................................................................................................................
Table 2.1: Material used in this study, including the supplier and location. .................... 11
Table 2.2: Protected paste volume as a function of distance from the LWA surface, corresponding to Figure 2.1, where (a) coarse LWA is used to replace the water lost by chemical shrinkage, (b) 100% coarse LWA is used to replace normal coarse aggregate, (c) fine LWA is used to replace the water lost to chemical shrinkage, and (d) fine LWA is used to replace twice the water lost to chemical shrinkage. .................................................................................... 16
Table 3.1: SSD specific gravity and absorption, by mass, of constituent materials used in mixture designs ......................................................................................... 18
Table 3.2: Specific gravity and absorption, by mass, of LWA materials used in mixture designs ..................................................................................................... 20
Table 3.3: Desorption of LWA used in this study ............................................................ 21
Table 3.4: Coarse aggregate gradation for normal CA (left) and LWCA (right) ............. 22
Table 3.5:Chemical analysis results of the cement and fly ash used in this study. .......... 23
Table 4.1: Description of mixtures used in this study and ID’s in which they will be referred for the remainder of this report ........................................................... 26
Table 4.2: Batching quantities for Class H standard mixture (left) and Class D standard mixture (right) ........................................................................................ 27
Table 5.1: Values of water reducer, slump, and unit weight (γc) for preliminary mixtures................................................................................................................. 36
Table 5.2:Values of air entraining admixture dosage and air content via volumetric method and pressure method for preliminary mixtures. ..................... 36
Table 5.3: Values of water reducer, slump, and unit weight (γc) for optimized mixtures................................................................................................................. 37
Table 5.4: Values of air entraining admixture dosage and air content via volumetric method and pressure method for optimized mixture. ......................... 38
Table 5.5: Values of compressive strength (f'c) and standard deviation (STDEV) preliminary mixtures at 28 and 56 days. ............................................................... 42
Table 5.6: Values of Young’s elastic modulus (Ec) and standard deviation (STDEV) preliminary mixtures at 28 and 56 days. .............................................. 42
Table 5.7: Values of compressive strength (f'c) and standard deviation (STDEV) optimized mixtures at 28 and 56 days. .................................................................. 45

xi
Table 5.8: Values of Young’s elastic modulus (Ec) and standard deviation (STDEV) optimized mixtures at 28 and 56 days. ................................................. 45
Table 6.1: Summary of ASTM C666 (2003, reapproved 2008) rapid freezing and thawing data for preliminary mixture designs. .................................................... 54
Table 6.2: Summary of ASTM C666 (2003, reapproved 2008) rapid freezing and thawing data for optimized mixture designs. ........................................................ 58
Table 6.3: Summary of ASTM C672 (2003) and MTO LS-412 scaling resistance to deicing chemicals data for preliminary mixture designs. ................................. 60
Table 6.4: Summary of ASTM C672 (2003) and MTO LS-412 scaling resistance to deicing chemicals data for optimized mixture designs. .................................... 62
Table 8.1: Preliminary mixture results for volume of porosity, chloride diffusion coefficients, tortuosity, and permeability determined through ASTM C624 (2006) and STADIUM Lab testing. ...................................................................... 92
Table 8.2: Optimized mixture results for volume of porosity, chloride diffusion coefficients, tortuosity, and permeability determined through ASTM C624 (2006) and STADIUM Lab testing. ...................................................................... 93
Table 8.3: Tabulated values for the initial and secondary absorption rates, 8-day depth of water penetration (I, mm), and the initial and 8-day DOS of the preliminary mixtures ............................................................................................. 97
Table 8.4: Tabulated values for the initial and secondary absorption rates, 8-day depth of water penetration (I, mm), and the initial and 8-day DOS of the optimized mixtures .............................................................................................. 100

xii
LIST OF FIGURES
...................................................................................................................................
Figure 1.1: Conceptual illustration to show the difference of external and internal curing (Castro et al., 2011) ..................................................................................... 3
Figure 1.2: Illustration demonstrating how water is emptied from largest pores to smallest. (a) Shows a standard cementitious system and (b) shows a cementitious system using internal curing, where the pore on the left side of the image is that of the lightweight aggregate. ................................................... 5
Figure 2.1: NIST IC simulation, which illustrates paste hydration when (a) coarse LWA is used to replace the water lost by chemical shrinkage, (b) 100% coarse LWA is used to replace normal coarse aggregate, (c) fine LWA is used to replace the water lost to chemical shrinkage, and (d) fine LWA is used to replace twice the water lost to chemical shrinkage. ................................. 16
Figure 3.1: Desorption isotherm for LWAs used in this study. ........................................ 21
Figure 3.2: Differential pore size distribution determined by laser diffraction for the Type I-II cement used for this study. .............................................................. 23
Figure 3.3: Differential pore size distribution determined by laser diffraction for Class F fly ash used for this study ........................................................................ 24
Figure 5.1: Preliminary mixtures compressive strength, normalized to standard mixture. ................................................................................................................. 41
Figure 5.2: Preliminary mixtures modulus of elasticity, normalized to standard mixture. ................................................................................................................. 41
Figure 5.3: Optimized mixtures compressive strength, normalized to standard mixture. ................................................................................................................. 44
Figure 5.4: Preliminary mixtures modulus of elasticity, normalized to standard mixture. ................................................................................................................. 44
Figure 6.1: Plot of Mixtures 1-5 average relative dynamic modulus by ASTM C666 (2003, reapproved 2008) rapid freezing and thawing. ................................ 53
Figure 6.2: Plot of Mixtures 1-5 average mass change by ASTM C666 (2003, reapproved 2008) rapid freezing and thawing. ..................................................... 54
Figure 6.3: Plot of Mixtures 6-9 average relative dynamic modulus by ASTM C666 (2003, reapproved 2008) rapid freezing and thawing. ................................ 57
Figure 6.4: Plot of Mixtures 6-9 average mass change by ASTM C666 (2003, reapproved 2008) rapid freezing and thawing. Mixture 1 is plotted again for reference. ......................................................................................................... 58

xiii
Figure 6.5: Plot of Mixtures 1-5 average cumulative scaling by ASTM C672 (2003) and MTO LS-412 scaling resistance to deicing chemicals. ...................... 59
Figure 6.6: Plot of Mixtures 6-9 average cumulative scaling by ASTM C672 (2003) and MTO LS-412 scaling resistance to deicing chemicals. Mixture 1 is plotted again for reference. ............................................................................. 62
Figure 7.1: Illustration of the difference between chemical and autogenous shrinkag ................................................................................................................. 67
Figure 7.2: Modified version of ASTM 1698 (2009) to measure the autogenous shrinkage of a concrete specimen. ........................................................................ 68
Figure 7.3: Dual ring test used to monitor stresses while creating restrained boundary conditions for the concrete .................................................................... 69
Figure 7.4: Plot of average chemical shrinkage, in mL per gram of cementitious binder. ................................................................................................................... 71
Figure 7.5: Results for the autogenous strain developed in the preliminary mixtures, mixtures 1 – 5, are shown in figures (a) – (e), respectively. ................. 74
Figure 7.6: Results for the autogenous strain developed in the optimized mixtures, mixtures 6 – 9, are shown in Figures (a) – (d), respectively. ................................ 76
Figure 7.7: Results for the residual tensile stress developed in the preliminary mixtures, mixtures 1 – 5, are shown in figures (a) – (e), respectively. ................. 80
Figure 7.8: Results for the residual tensile stress developed in the optimized mixtures, mixtures 6 – 9, are shown in figures (a) – (d), respectively. ................. 81
Figure 7.9: Preliminary mixture drying shrinkage results at 50% RH after 28 day sealed curing period, normalized to gauge length. ............................................... 83
Figure 7.10: Optimized mixture drying shrinkage results at 50% RH after 28 day sealed curing period, normalized to gauge length. ............................................... 84
Figure 8.1: (a) Water absorption and (b) change in DOS for Mixture 1 – Standard Class H .................................................................................................................. 95
Figure 8.2: (a) Water absorption and (b) change in DOS for Mixture 2 – LWFA 1 X CS ...................................................................................................................... 95
Figure 8.3: (a) Water absorption and (b) change in DOS for Mixture 3 – LWFA 2 X CS ...................................................................................................................... 96
Figure 8.4: (a) Water absorption and (b) change in DOS for Mixture 4 – LWCA 1 X CS ...................................................................................................................... 96
Figure 8.5: (a) Water absorption and (b) change in DOS for Mixture 5 – 100% LWCA Replacement ............................................................................................. 97
Figure 8.6: (a) Water absorption and (b) change in DOS for Mixture 6 – IC Buildex .................................................................................................................. 98

xiv
Figure 8.7: (a) Water absorption and (b) change in DOS for Mixture 7 – IC Utelite ....... 99
Figure 8.8: (a) Water absorption and (b) change in DOS for Mixture 8 – Standard Class D .................................................................................................................. 99
Figure 8.9: (a) Water absorption and (b) change in DOS for Mixture 9 – IC Class D .......................................................................................................................... 100

1
CHAPTER 1. INTRODUCTION TO INTERNAL CURING
1.1 Background
Internally cured concrete has been rapidly emerging over the last decade as an effective
way to improve the performance of concrete. Internal curing (IC) holds promise for
producing concrete with an increased resistance to early-age cracking and enhanced
durability (Bentz and Weiss, 2011). The technique of IC has recently been studied and
used in several field applications (Schindler, Grygar, and Weiss, 2012). As of 2010,
hundreds of thousands of cubic meters of concrete containing pre-wetted lightweight
aggregates (LWAs) for the use of internal curing have been placed throughout the United
States (Bentz and Weiss, 2011).
1.1.1 A Brief History
Before discussing the theory of IC, one should first know a little about how IC developed.
The use of LWAs in concrete has existed since the early Roman times, where natural
lightweight concrete had been used in structures such as the Pantheon (Bremner and Ries,
2009). These lightweight concretes may have, unknowingly, benefitted from what is now
known as internal curing and provides some explanation to the outstanding durability of a
few of these ancient structures.

2
It is believed that the first published notion that LWA can provide additional moisture to
the cementitious system was in 1957 by Paul Klieger. He stated “Lightweight aggregates
absorb considerable water during mixing which apparently can transfer to the paste
during hydration” (Klieger, 1957). However, research on internal curing did not really
progress until 1991 when Robert Philleo stated, “Either the basic nature of portland
cement must be changed so that self-desiccation is reduced, or a way must be found to
get curing water into the interior of high-strength structural members...”. The idea of
placing water inside of concrete is “…possible through the use of prewetted LWA.”
However, it is not intuitive to introduce LWA, a highly porous material, into concretes
that are to achieve higher strengths. Therefore, those striving for higher strength
concretes are generally not receptive to the idea of introducing LWA into the
cementitious system. However, Philleo suggested, “A partial replacement of fine
aggregate with saturated lightweight fines might offer a promising solution” (Philleo,
1991). Since then, pre-wetted LWA has been studied and applied in the field to improve the
curing process of concrete (Weber and Reinhardt, 1996; Bentz and Snyder, 1999; Bentur et
al., 2001; Jensen and Hansen, 2001; RILEM, 2007; Radlinska, 2008; Schlitter et al., 2010;
Bentz and Weiss, 2011).
1.1.2 How Internal Curing Works
While the concept on internal curing is very simple, the science behind it is quite
interesting. The American Concrete Institute (ACI) has defined internal curing as “[the]
process by which the hydration of cement continues because of the availability of internal
water that is not part of the mixing water” (America Concrete Institute, 2013). Internal

cu
p
n
A
p
2
w
re
d
F
uring essenti
orosity of th
eeded for hy
As demonstra
enetrate a fe
002). Intern
water, can cre
emains at a h
ifference bet
Figure 1.1: C
ially consist
he paste. Thi
ydration, afte
ated in Figur
ew millimete
nal curing, w
eate a three d
high relative
tween intern
Conceptual i
s of hiding w
is hidden an
er the time o
re 1.1, extern
ers into high
with proper sp
dimensional
e humidity (B
nal and exter
llustration to(C
3
water inside
d dispersed
of set.
nal curing w
performanc
patial distrib
microstruct
Bentz and W
rnal curing c
o show the dCastro et al.,
the concrete
water is ava
water (surface
e concretes
bution and an
ture in which
Weiss, 2011).
an be seen in
difference of2011)
e without alt
ailable to the
e-applied wa
(Weiss et al
n appropriat
h the hydrati
A basic illu
n Figure 1.1
f external and
tering the
system as
ater) may on
., 1999; Ben
te amount of
ing cement p
ustration of t
.
d internal cu
nly
ntz,
f
paste
the
uring

4
In order for internal curing to be effective, the water filled inclusions should be
distributed throughout the concrete and spaced close enough to provide coverage for the
entire paste system (Henkensiefken et al., 2008; Castro et al., 2010). The water provided
to the cementitious matrix is done via the use of water filled inclusions. The key to
internal curing is that the water being released is time delayed. This effect is dependent
on the size of the pores in the LWA. The pores need to be a size such that water is taken
in and held during the mixing process (absorption), but can be released from the pores
back into the paste after setting, when needed for curing (desorption).
Figure 1.2 illustrates how the pores of a cementitious system are emptied during chemical
shrinkage. Figure 1.2 (a) indicates a standard mixture without internal curing. Here the
pores of the system are emptied from largest to smallest. Figure 1.2 (b) shows that when
a porous material (such as LWA) with larger pores than those found in the microstructure
of the paste is added into the system, water is drawn from these larger pores in the LWA
due the negative pressure buildup from self-desiccation in the paste. This water from the
porous material replaces what is lost in chemical shrinkage and will in theory fully
hydrate the cement matrix. When a sufficient volume of LWA is used, with adequate
desorption properties and spatial distributions within the matrix, enough water can be
provided throughout the cementitious matric to prevent early age cracking in the concrete
system.
1.2 Motivation for Its Use
Internal curing was originally promoted to reduce autogenous shrinkage and autogenous
shrinkage cracking (Bentz and Snyder, 1999; Jensen and Hansen, 2001; Kovler and

Je
sh
H
R
dr
im
cu
H
et
b
in
F
ensen, 2005;
hrinkage is a
However, the
Recent work
rying shrink
mproved pla
uring can als
Henkensiefke
t al., 2012) a
ecoming inc
ndustry to cr
igure 1.2: Ill(a) Shows ainternal cu
; Radlinska e
a phenomeno
e benefits go
has demonst
kage cracking
stic shrinkag
so increase t
en et al. 2009
and reduce io
creasingly cl
reate a longe
lustration dea standard ce
uring, where
(a)
et al., 2007;
on caused by
well beyond
trated benefi
g (Henkensie
ge cracking r
the resistance
9, Peled et a
on diffusion
ear that inter
er lasting, mo
emonstratingementitious the pore on
5
RILEM, 200
y chemical s
d the reducti
fits of interna
efken et al.,
resistance (H
e to fluid ab
l. 2010), imp
(Bentz, 200
rnal curing h
ore sustainab
g how water system and the left side
aggregate
07; Lopez et
shrinkage, in
ion of autoge
al curing for
2008; Henk
Henkensiefk
sorption (Be
prove the co
09; DiBella e
has great pot
ble product.
is emptied f(b) shows a of the image.
(b)
t al., 2008).
ndependent o
enous shrink
r reducing dr
kensiefken et
ken et al., 20
entz and Sny
ompressive s
et al., 2012)
tential for th
from largest cementitiou
ge is that of t
Autogenous
of external d
kage.
rying shrinka
t al., 2009), a
10). Interna
yder 1999,
strength (Gol
in concrete.
he concrete
pores to smus system usithe lightweig
s
drying.
age,
and
al
lias
It is
mallest. ing ght

6
1.3 Research Objectives
The use of internal curing in high performance concrete can increase the resistance to
early-age cracking and enhance its durability (Bentz and Weiss, 2011). However,
questions have been raised about the freeze-thaw durability of these concretes. The
objective of this study is to investigate the freeze-thaw performance of internally cured,
high performance concrete for use by the Colorado Department of Transportation
(CDOT). In particular, this study evaluates a series of internally cured, high performance
concrete mixtures that meet the specifications of Colorado DOT Class H and Class D
bridge deck concretes.
This study investigates the use of LWA for internal curing and quantitatively shows the
impact of LWA on the freeze-thaw performance for these mixtures. Specifically, this
study has been divided into two phases. The first phase of the work investigates the
freeze-thaw response of a typical Class H concrete mixture and a typical Class H mixture
where varying portions of the normal aggregate is replaced with LWA. The second
phase of the work investigates the freeze-thaw behavior of a typical Class H concrete
mixture using two additional LWAs that are available in the Colorado market. The
second phase of the research will also develop and evaluate an internally cured concrete
that meets the Colorado DOT Class D specification.
Aside from evaluating the freeze-thaw related performance of these mixtures, this report
encompasses and discusses all areas that make internal curing beneficial. The fresh,
mechanical, shrinkage, and transport properties of these mixtures have been investigated

7
and are presented in this report. In addition to simply performing and reporting
experimental evaluations, this report describes the principles that make internally cured
concrete beneficial and resistant to freezing and thawing behavior, so that specifications
can be developed by the Colorado DOT for producing durable, long lasting, concrete
using internal curing.

8
CHAPTER 2. CHARACTERIZATION OF MIXTURES USING INTERNAL CURING FOR COLORADO
2.1 Evaluated Mixtures
As previously noted, this study is split into two phases. Phase I evaluates preliminary
mixtures comparing the Colorado DOTs typical Class H concrete mixtures to Class H
mixtures that are internally cured, using a variety of approaches. Phase II evaluates
optimized IC mixtures, being the Colorado DOTs Class H mixtures using alternative
LWA sources as well as typical and IC Class D mixtures.
2.1.1 Phase I Mixtures
Phase I evaluates five mixtures to compare the performance of a Class H Colorado bridge
deck mixture with Class H mixtures that are designed to utilize internal curing concepts.
The IC mixtures for this phase will use LWA from a single supplier. These mixtures are
as follows:
1. A mixture consistent with the standard Class H Colorado DOT bridge deck
mixture,
2. A mixture similar to the standard Class H Colorado DOT bridge deck mixture
where a portion of the fine aggregate is replaced by fine LWA (where enough
LWA is used to replace the water lost by chemical shrinkage, i.e., the typical

9
value used for IC),*
3. A mixture similar to the standard Class H Colorado DOT bridge deck mixture
where a portion of the fine aggregate is replaced by fine LWA (where enough
LWA is used to replace twice the water lost by chemical shrinkage),
4. A mixture similar to the standard Class H Colorado DOT bridge deck mixture
where a portion of the coarse aggregate is replaced by coarse LWA (where
enough LWA is used to replace the water lost by chemical shrinkage), and
5. A mixture similar to the standard Class H Colorado DOT bridge deck mixture
where a portion of the coarse aggregate is replaced by coarse LWA (where
enough LWA is used to replace the water lost by chemical shrinkage and the
aggregate spacing provides that all of the paste is within 2 mm of the surface
of a LWA).†
Phase I testing provides information on the fresh, mechanical, shrinkage and cracking,
and fluid transport properties of the internally cured concrete as it compares with the
standard Colorado DOT Class H Mixture. This work specifically offers information on
the aggregate absorption and desorption properties as well as the freeze-thaw behavior of
these mixtures. The desorption behavior of the aggregates are used with relative
humidity (RH) measures in the mixture to describe the water that is given back to the
system by the LWA. Additionally, the water absorption measurements of the system are
* This is the typical way internal curing has been performed following the procedure
outlined by Bentz and Snyder (Bentz and Snyder, 1999) † Only 92% of the paste was protected within a 2mm distribution around the aggregate
even when all of the coarse NWA was replaced with coarse LWA. This will be further explained in Section 2.4.

10
used to compute the degree of saturation for the purpose of describing the susceptibility
that these mixtures may have to freeze-thaw damage (Li et al., 2011).
2.1.2 Phase II Mixtures
Phase II consists of using the two alternative LWA sources in mixtures similar to the
standard Class H Colorado DOT mixture used in Phase I where a portion of the fine
aggregate is replaced by fine LWA (where enough LWA is used to replace the water lost
by chemical shrinkage); similar to mixture 2. This is done because of differences in
absorption and gradation that can be expected between these sources (Castro et al. 2010).
In addition, a conventional Colorado DOT Class D mixture was be prepared along with
an internally cured Class D mixture (where enough LWA is used to replace the water lost
by chemical shrinkage). All of the testing procedures described for Phase I are used in
evaluating Phase II mixtures.
2.2 Materials and Suppliers
Internal curing is generally performed in the United States using expanded LWAs (shale,
clay, slate, and slag). Other materials have been proposed that could function as internal
water reservoirs such as super absorbent polymers (SAPs), cellulose and plant fiber, and
recycled concrete. Work has specifically been done on superabsorbent polymers (SAPs)
(Jensen and Hansen, 2001; Jensen and Hansen, 2002; Schlitter and Barrett, 2010) and
pre-wetted wood fibers (Mohr et al., 2005). It is the opinion of the investigation team

11
that the most commercially ready products for DOT applications are expanded fine LWA;
however other material may be ready for use in the near future.
It is the goal of this study to provide the Colorado DOT with mixture proportions for a
high performance, internally cured concrete that is ready for use in a field application. In
order to do so, it is crucial to perform the described testing on mixtures that would be
typical to a Colorado bridge deck. This means utilizing constituent materials standard to
the area, as well as LWA from a source(s) that would be practical for use in Colorado.
Table 2.1 shows a list of the materials used in this study, including the suppliers and their
location.
Table 2.1: Material used in this study, including the supplier and location.
Supplier Material Used* Location
Aggregate Industries Morrison Pit Size 57/67 Golden, CO
Aggregate Industries Thorton Pit Washed Concrete Sand Golden, CO
Holcim US, Inc. Type I/II OPC Golden, CO
Headwaters Resources Class F Fly Ash South Jordan, UT
TXI/ Trinity ESC 3/8” Structure Coarse (LWA) Boulder, CO
TXI/ Trinity ESC Structural Fines (LWA) Boulder, CO
Utelite Corp. Structural Fines (LWA) Coalville, UT
Builidex, Inc. Structural Fines (LWA) Marquette, KS
* Certain commercial equipment, instruments, or materials are identified in this report in order to foster understanding. Such identification is not intended to imply that the materials or equipment identified are necessarily the best available for the purpose.

12
TXI LWAs (now Trinity Expanded Shale and Clay, but will be referred to as TXI
throughout this report as this was the company name when the study began) were used as
the primary LWA supplier. Utelite and Buildex LWAs were also used in this study to
show that internally cured concrete can be equally as effective with multiple LWA
suppliers and to point out variations that can arise between them.
2.3 Proportioning for Internal Curing with LWA
Previous studies have shown that there are three key considerations for determining the
mixture proportions of an internally cured concrete (Bentz et al., 2005; Henkensiefken et
al. 2008):
1. How much internal curing water is necessary (the amount is related to the
volume of chemical shrinkage exhibited by the matrix),
2. How far into the surrounding cement paste the needed water can readily
travel, and
3. How the LWA reservoirs are spatially distributed within the concrete.
A procedure has been developed (discussion to follow) that uses these three concepts in
determining the mixture proportions of concrete mixtures using LWA to provide water
for internal curing. The investigative team utilized this procedure in creating the mixture
designs for the concretes under evaluation. Research by Castro et al. (Castro et al., 2010)
and Pour Ghaz et al. (Pour Ghaz et al., 2012) investigated the properties of LWAs from
various material suppliers across the US, using several techniques that can be applied to
internal curing. This work will utilize newly developed standard procedures, ASTM

13
C1761 (2012), to measure the absorption and desorption properties of the LWA so that
these properties can be correctly included in the mixture design.
The most basic way to explain proportioning of internal curing is the classic economics
principle of supply and demand; the water lost in the system to chemical shrinkage (or
self desiccation) creates a demand in the system, which is to be supplied by internal
curing. An equation for evaluating the demand (left side) and supply (right side) has
been developed by Bentz et al. (Bentz et al., 1999; Bentz et al., 2005) and is shown in
Equation (2.1a) below. By rearranging Equation (2.1a), a solution for the mass of oven
dry LWA required for internal curing is produced, seen in Equation (2.1b).
∗ ∗ ∗ ∗
∗ ∗∗
(2.1a)
(2.1b)
In Equation (2.1a) and (2.1b), is the cement (or binder) factor of the concrete mixture,
CS is the chemical shrinkage of the binder at 100 % reaction, is the expected
maximum degree of reaction for the binder (ranging from 0 to 100 %), is the mass
of oven dry LWA, which is based on their saturation level relative to a quantified ‘pre-
wetted’ condition, S, and the measured sorption capacity of the internal reservoirs when
in a pre-wetted condition, . This equation represents the amount of internal curing
water to be required by the system based on these inputs.

14
2.4 Spatial Distribution for Internal Curing with LWA
In order to optimize the design of internal curing mixtures, an understanding of the
distance traveled by water from the internal reservoirs (LWA) to the unhydrated cement
paste must be obtained (Bentz and Weiss, 2011). An estimated water travel distance can
be determined using a web-based modeling program on the NIST internal curing website.
The model is based on an analysis first developed by Weber and Reinhardt (Weber and
Reinhardt, 1999). This model estimates the expected water travel distance, obtained by
equating the projected water flow rate to a value needed to maintain saturation in the
surrounding cement paste at its current rate of hydration.
The obtained travel distance is then used on a hard core/soft shell computer code (Bentz,
Garboczi, and Snyder, 1999), available on the NIST internal curing website, to estimate
the amount of ‘protected paste’ in the matrix. Protected paste refers to the percentage of
hydrating cement paste that can be reached from the traveling water by internal reservoirs.
In this model, a water travel distance of 2mm from the face of the LWA material is
assumed, which is a reasonable estimate for late age (3 - 7 days) hydrating paste (Bentz et
al., 2007).
Figure 2.1 shows generalized (aggregate absorption/ desorption properties are constant)
modeling outputs for each of the LWA replacements for this projects mixture designs.
The program receives an input based on aggregate gradations and the percentage of LWA
to be replaced for a specific gradation. The program then randomly assigns aggregates to
a location in a 3cm by 3cm space, which are the images shown in the Figure 2.1 (a) – (d).

15
Table 2.2 (a) – (d) are the corresponding output values of protected paste fractions to the
models in Figure 2.1, at specified distances from the LWA particles. A value of 1.0
indicates that all of the cement paste within that specified distance of a LWA surface can
obtain full hydration.
Figure 2.1 (a) shows that when coarse LWA is used to replace the water lost by chemical
shrinkage no lightweight particles are present in the output image. This is due to the
scarcity of coarse lightweight that would be used in replacing chemical shrinkage water.
This is where particle spacing becomes very important for internally cured mixtures, as
curing water must be properly distributed throughout the matrix for proper cement
hydration. Figure 2.1 (b) illustrates a 100% coarse aggregate replacement of pre-wetted
LWA. Table 2.1 (b) shows that a 2mm moisture distribution (protected paste value of
1.0 at 2mm) cannot be obtained with coarse LWA. A 0.92 (or 92%) protected paste
value is achieved with 100% replacement of coarse LWA. Figure 2.1 (c) illustrates a
mixture in which pre-wetted fine LWA is used to replace the water lost to chemical
shrinkage. Figure 2.1 (d) illustrates a mixture in which pre-wetted fine LWA is used to
replace twice the water lost to chemical shrinkage.

Fi
c
ch
Figure 2.1: Nis used to rep
replace nchemical shr
Table 2.2:correspondihemical shrifine LWA i
NIST IC simplace the waormal coarse
rinkage, and
: Protected png to Figureinkage, (b) 1is used to rep
used to re
mulation, whiater lost by che aggregate, (d) fine LW
paste volumee 2.1, where 100% coarseplace the waeplace twice
16
ich illustratehemical shri(c) fine LW
WA is used toshrinkage
e as a functio(a) coarse L LWA is use
ater lost to chthe water lo
es paste hydrinkage, (b) 1
WA is used too replace twie.
on of distancLWA is used ed to replacehemical shrinost to chemic
ration when 100% coarseo replace theice the water
ce from the Ld to replace the normal coankage, and (cal shrinkage
(a) coarse Le LWA is usee water lost tr lost to chem
LWA surfache water losarse aggrega(d) fine LWAe.
LWA ed to o
mical
ce, t by
ate, (c) A is
17
CHAPTER 3. EVALUATION OF MATERIAL PROPERTIES
3.1 Introduction
The goal of internal curing is to provide water that will fill the empty space that would be
formed in the portion of pores that are emptied due to self-desiccation. Before assessing
the performance of cementitious systems utilizing internal curing, it is first necessary to
characterize the constituent materials. The goal of this chapter is to characterize the
materials used in this study, both standard Colorado DOT materials and LWAs available
in the Colorado market that could be used for internal curing in Class H and D mixtures.
3.2 Constituent Material Properties
Table 2.1 provides the list of materials used in this study. From this point forward in the
report the 57/67 Morrison Pit Aggregate will be referred to as simply coarse aggregate, or
CA. Similarly the Thorton Pit washed sand as fine aggregate, or FA. Type I/II OPC as
cement and Class F fly ash as fly ash.
In order to create a mixture design, specific gravities of the aforementioned constituent
materials and absorptions of the aggregates must first be obtained. The values can be
seen in Table 3.1. The manufacturer provided specific gravity for the cement and fly ash.
Saturated surface dry (SSD) specific gravity and absorption of the coarse and fine

18
aggregates were determined in accordance with ASTM C127 (2012) and ASTM C128
(2012), respectively.
Table 3.1: SSD specific gravity and absorption, by mass, of constituent materials used in mixture designs
Material S.G. Abs., %
Cement 3.15 -
Fly Ash 2.37 -
Coarse Aggregate 2.65 0.80%
Fine Aggregate 2.62 1.10%
3.3 LWA Properties
3.3.1 A Discussion of Testing Procedures for LWA
Determining the properties of LWAs can become problematic since an SSD condition
really does not exist. It is more appropriate to determine the properties for a pre-wetted
surface dry condition. ASTM C1761 (2012) provides a method for determining
absorption, specific gravity/ relative density, and desorption based on obtaining pre-
wetted conditions, after a 72-hours soaking time, similar to ASTM C127 (2012) for fines
and ASTM C128 (2012) for coarse. These methods both rely heavily on the users
interpretation of the ‘SSD’ state of the aggregates and consequently create large
variations in materials with high absorptions.
Work by Miller et al. (Miller et al., 2013) provides a simple and repeatable method for
obtaining pre-wetted surface dry conditions in aggregates via the use of a centrifuge.

19
LWAs were tested for 72-hour absorption using both the paper towel method provided by
ASTM C1761 (2012) as well as the centrifuge method. The centrifuge method consists
of spinning approximately 500 grams of soaked LWA for 3 minutes at a speed of 2000
revolutions per minute (rpm). Absorption, specific gravity, and desorption are then tested
in same manner prescribed by ASTM C1761 (2012) to provide properties for a pre-
wetted surface dry condition after 72-hours of soaking.
3.3.2 Absorption and Specific Gravity
Accurate absorption values are a key component in creating a quality internally cured
mixture design. If absorption values of the LWA are underestimated, an overabundance
of water is being provided to the matrix, which can increase the water-cement ratio
during the mixing phase. This will results in a high water-cement ratio. If absorption
values of the LWA are overestimated, not enough water will be present in the LWA to
replace that lost to chemical shrinkage, therefore not providing sufficient water for
internal curing. Values for absorption and specific gravity used in the mixture designs
for this study can be found in Table 3.2. While a 72-hour soaking time has been
prescribed by the standard for consistency purposes, the authors prefer a 24-hour soaking
time for certain laboratory tests. Both values are reported in Table 3.2. It should be
noted that values for specific gravity are linked to the moisture state of the aggregates and
would theoretically change from a 24 hours soaking period to a 72 hour soaking period.
However, the slight change in specific gravity has not been accounted for in this study.

20
Table 3.2: Specific gravity and absorption, by mass, of LWA materials used in mixture designs
Material SG* 24hr, % 72hr, %
TXI, CA 1.74 15.0% 17.5%
TXI, FA 1.85 16.5% 18.5%
Buildex, FA 1.65 16.5% 18.7%
Utelite, FA 1.87 18.8% 19.9%
*Specific gravity (SG) measured from aggregates that have undergone a 72 hour soaking period.
3.3.3 Desorption
Desorption is the loss of water from the LWA pores to the concrete matrix. This process
(i.e., the release of water from the LWA pores into the matrix) is what makes internal
curing possible. A desorption isotherm, a plot of mass loss as a function of time keeping
temperature and RH constant (23 ± 1 °C [73.5 ± 1.5 °F] and 94 ± 0.5%, respectively) is
shown in Figure 3.1 to show how this process works. The desorption curve was created
in accordance with ASTM C1761 (2012), where aggregate started in a pre-wetted
condition, after a 72-hour soaking period, using both the “paper towel method” described
in ASTM C1761 (2012) as well as the centrifuge method described in Section 3.3.1.
Values presented in this section are averages of both methods. Once in an SSD condition
samples of approximately 5g and 20g for LWFA and LWCA, respectively, were weighed
into a dish and placed in the constant RH chamber at 94 ± 0.5%. The masses were
monitored daily until no more than a 0.01g change in mass occurred. The samples were
then placed in an oven to obtain the oven dry mass from which desorption can be
calculated. A value of 0 in Figure 3.1 indicates an aggregate that has desorbed all of its

w
d
d
se
sp
tw
water, i.e., an
esorbs the m
esorption va
een in Table
pecimens fro
wo the centri
n aggregate in
majority of th
alues (percen
3.3. The va
om the same
ifuge method
Tabl
Figure 3.1:
n an oven dr
he water it ab
nt desorbed)
alues present
e aggregate, t
d.
e 3.3: Desor
Desorption
21
ry state. An
bsorbs, appr
and standard
ted in the plo
two specime
rption of LW
isotherm for
efficient LW
roximately 8
d deviation i
ot represent
ens utilizing
WA used in th
r LWAs use
WA describe
5%. The av
in for each a
an average o
the paper to
his study
ed in this stu
es one that
verage final
aggregate ca
of four
owel method
dy.
n be
d and

22
3.4 Coarse Aggregate Gradations
Gradations for the coarse aggregates, both standard and lightweight, were obtained and
used in the mixture designs. This was done in order to create consistent coarse aggregate
volumes within mixtures. All coarse aggregate used in this study was sieved and
recombined with the gradations shown in Table 3.3. Gradations were done in accordance
with ASTM C136 (2006).
Table 3.4: Coarse aggregate gradation for normal CA (left) and LWCA (right)
57/67 CA Structural 3/8" LWCA
Sieve % Passing % Passing
1” 100% 100%
3/4” 88% 100%
1/2” 41% 100%
3/8” 23% 72%
#4 2% 1%
#8 0% 0%
3.5 Cementitious Material
The goal of internal curing is to provide his is equivalent to the volume of that lost to
chemical shrinkage. In order to create mixture design and begin casting, the investigative
team assumed a chemical shrinkage value of 0.064 mL/g. The chemical compositions for
the cement and fly ash used in this study can be found in Table 3.4. Chemical shrinkage
and the obtained values will be further discussed later in the report. The particle sizes
were measured using a Coulter LS32 particle size analyzer with high reproducibility (<

1
d
an
F
%), with me
istributions f
nd 3.3, respe
Table 3.
Chemica
Silicon D
Aluminum
Iron Oxid
Calcium
Magnesiu
Sulfur Tr
Loss of Ig
Equivalen
Figure 3.2: D
ethanol as a d
for both the
ectively.
5:Chemical
al
Dioxide
m Oxide
de
Oxide
um Oxide
rioxide
gnition
nt Alkalis
Differential p
dispenser. T
cement and
analysis resuA
Sym
S
A
FE
C
M
S
L
pore size distI-II cem
23
The results fo
fly ash used
ults of the ceAnalysis Res
mbol Ty
SiO2
L2O3
E2O3
CaO
MgO
SO3
LOI
-
tribution detement used for
or three trial
d in this stud
ement and flsults
ype I-II Cem
20.0%
4.7%
3.2%
64.0%
1.4%
3.3%
2.1%
0.6%
ermined by r this study.
ls of the part
dy are shown
ly ash used i
ment Clas
laser diffrac
ticle size
n in Figure 3
in this study.
ss F Fly Ash
62.8%
18.5%
4.4%
5.2%
0.0%
0.6%
0.7%
0.0%
ction for the
.2
.
h
Type

FFigure 3.3: DDifferential ppore size disfly as
24
stribution detsh used for th
termined byhis study
y laser diffracction for Cla
ass F

25
CHAPTER 4. METHODS AND MATERIALS
4.1 Mixtures Evaluated
The intent of this study is to evaluate the properties of internally cured Colorado Class H
and D bridge deck mixtures in comparison to the standard mixtures. This study will also
demonstrate the appropriate use of internal curing through porous inclusions and how
inappropriately proportioning internal curing can become problematic. The investigative
team has created nine mixtures for testing in which the only variable is the amount of
LWA used for internal curing and the type/ supplier of LWA used for internal curing. A
description of the mixtures can be seen in Table 4.1. From this point forward in the
report, the ID given in the table will be used to refer to each mixture. It had been
previously mentioned that two phases of testing were performed. The first phase will be
referred to as preliminary mixtures and the second phase optimized mixtures. The
preliminary mixtures consist of the mixtures labeled ‘Mix 1 – Mix 5’ in Table 4.1 and the
optimized mixtures labeled ‘Mix 6 – Mix9'.
4.2 Mixture Proportioning
This aim of this study is to determine the perks of internally cured concrete by closely
replicating the aforementioned Colorado DOT concrete mixtures. In order to achieve
replicate mixtures, the Colorado DOT Construction Specification Section 601 for
Structural Concrete (Colorado Department of Transportation, 2011a) and the 2011

26
revision of Section 601 for Class H and HT bridge deck concrete (Colorado Department
of Transportation, 2011b) were used to obtain the mixture proportions presented in this
section.
Table 4.1: Description of mixtures used in this study and ID’s in which they will be referred for the remainder of this report
ID Mixture Description
Mix 1 Standard Class H Colorado Department of Transportation bridge deck mixture
Mix 2 Standard Class H Colorado Department of Transportation bridge deck mixture where a portion of the fine aggregate is replaced by TXI fine lightweight aggregate (enough lightweight aggregate is used to replace the water lost by chemical shrinkage)
Mix 3 Standard Class H Colorado Department of Transportation bridge deck mixture where a portion of the fine aggregate is replaced by TXI fine lightweight aggregate (enough lightweight aggregate is used to replace twice the water lost by chemical shrinkage)
Mix 4 Standard Class H Colorado Department of Transportation bridge deck mixture where a portion of the coarse aggregate is replaced by TXI coarse lightweight aggregate (enough lightweight aggregate is used to replace the water lost by chemical shrinkage)
Mix 5 Standard Class H Colorado Department of Transportation bridge deck mixture where all of the coarse aggregate is replaced by TXI coarse lightweight aggregate (aggregate spacing for a 2 mm moisture distribution is obtained was initially desired)*
Mix 6 Standard Class H Colorado Department of Transportation bridge deck mixture where a portion of the fine aggregate is replaced by Utelite fine lightweight aggregate (where enough lightweight aggregate is used to replace the water lost by chemical shrinkage)
Mix 7 Standard Class H Colorado Department of Transportation bridge deck mixture where a portion of the fine aggregate is replaced by Buildex fine lightweight aggregate (where enough lightweight aggregate is used to replace the water lost by chemical shrinkage)
Mix 8 Standard Class D Colorado Department of Transportation bridge deck mixture
Mix 9 Standard Class D Colorado Department of Transportation bridge deck mixture where a portion of the fine aggregate is replaced by TXI fine lightweight aggregate (where enough lightweight aggregate is used to replace the water lost by chemical shrinkage)
*See Section 2.4 for a further explanation

Conc
The C
ceme
mass
aggre
admix
have
mixtu
Tab
Unles
prese
(2007
mater
crete mixture
Class H conc
entitious mat
. The mixtu
egate. In add
xture, MB-A
a w/c of 0.4
ure. The bat
ble 4.2: Batch
ss otherwise
ented in this
7). The conc
rials were ba
es were prep
cretes have a
terial content
ures consist o
dition, a wat
AE 90, were
45. All other
tching quant
hing quantiti
e noted, each
section. The
crete was ma
atched in an
ared for Cla
a water/ cem
t of 570 lb/y
of 55 percent
ter reducing
used. The C
r proportions
tities for both
ies for Classmix
4.3 M
h mixture wa
e mixing wa
ade using a d
environmen
27
ass H mixture
mentitious ma
yd3 and 20 pe
t No. 57/67
admixture, G
Class D mixt
s used are co
h mixtures c
s H standard xture (right)
Mixing Proced
as produced c
as carried ou
dual action,
nt with a tem
es, standard
aterial ratio (
ercent replac
coarse aggre
Glenium 303
tures, standa
onsistent wit
can be seen in
d mixture (lef
dure
conforming
ut in accordan
3.0 ft3 capac
mperature of 2
and internal
(w/c) of 0.42
cement of fly
egate by volu
30, and an ai
ard and inter
th that of the
n Table 4.2.
ft) and Class
to the proce
nce with AS
city pan mix
23 ± 2 °C. T
lly cured.
2 with a fixe
y ash, by
ume of total
ir entraining
rnally cured,
e Class H
s D standard
edure
STM C192
xer. The
The normal
ed
l
g
d
28
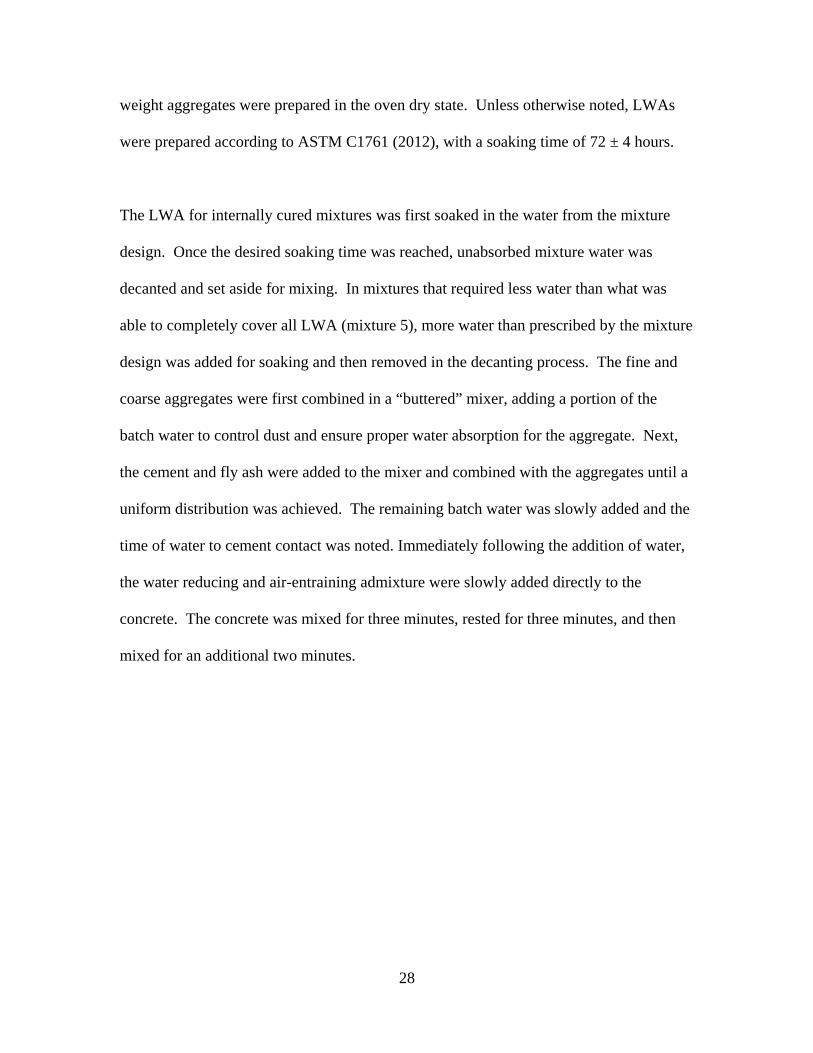
weight aggregates were prepared in the oven dry state. Unless otherwise noted, LWAs
were prepared according to ASTM C1761 (2012), with a soaking time of 72 ± 4 hours.
The LWA for internally cured mixtures was first soaked in the water from the mixture
design. Once the desired soaking time was reached, unabsorbed mixture water was
decanted and set aside for mixing. In mixtures that required less water than what was
able to completely cover all LWA (mixture 5), more water than prescribed by the mixture
design was added for soaking and then removed in the decanting process. The fine and
coarse aggregates were first combined in a “buttered” mixer, adding a portion of the
batch water to control dust and ensure proper water absorption for the aggregate. Next,
the cement and fly ash were added to the mixer and combined with the aggregates until a
uniform distribution was achieved. The remaining batch water was slowly added and the
time of water to cement contact was noted. Immediately following the addition of water,
the water reducing and air-entraining admixture were slowly added directly to the
concrete. The concrete was mixed for three minutes, rested for three minutes, and then
mixed for an additional two minutes.

29
CHAPTER 5. EVALUATION OF FRESH AND MECHANICAL PROPERTIES
5.1 Introduction
The objective of this study is to investigate the performance of internally cured, high
performance concrete for potential use by the Colorado DOT. In particular, this study
evaluates a series of internally cured high performance concrete mixtures, as noted in
Table 4.1, for the Colorado DOT that meet the specifications of a Class H and Class D
concrete. The use of internal curing in high performance concrete can increase the
resistance to early-age cracking and enhance durability (Bentz and Weiss, 2011).
This chapter presents the fresh and mechanical properties of the nine mixtures. The fresh
properties presented consist of slump, air content from both the volumetric and pressure
methods, and density for each mixture. These tests were performed by a certified ACI
Grade I concrete field-testing technician. The mechanical properties consist of
compressive strength and elastic modulus values at both 28 and 56 days, tested in
accordance with ASTM C39 (2012a) and ASTM C469 (2010), respectively. All values
of the fresh and mechanical properties presented in this chapter were of the ‘large’ cast in
which freeze thaw and scaling specimens were made. Values of slump and air were
taken in other casts to ensure consistency of the mixtures, however only values from the
large (freeze-thaw) cast are presented. The test methods and casting procedures will be
discussed first, followed by the results and discussions presented in a systematic order, in

30
which the preliminary mixtures will be presented followed by the optimized mixtures for
each test being discussed.
5.2 Mixing, Placing, and Curing Procedures
Materials were batched and mixed in accordance to the procedure presented in Section
4.3. For internal curing mixtures, the LWA soaked in the required mixing water
(including the water required to replace chemical shrinkage) for a 72 ± 4 hour period
prior to mixing. The curing methods used for each experiment will be discussed
separately, where applicable, for each individual test.
5.2.1 Fresh Properties
5.2.1.1 Slump
The hydraulic-cement concrete slump in the laboratory was determined in accordance
with ASTM C143 (2004). After proper mixing of constituent materials, the mixture of
interest filled the dampened standard slump cone apparatus in three lifts, being rodded 25
times per lift. The cone was then removed carefully in the vertical direction in 5 ± 2 s,
with caution against lateral and torsional motion. The vertical difference between the top
of the mold and the displaced original center of the top surface of the specimen was
measured and recorded to the nearest ¼ in.
31
5.2.1.2 Air Content
Since the freeze-thaw durability of internally cured mixtures is a main focus of this study,
air content of the mixtures is very important. Colorado DOT Specification Section 601
(Colorado Department of Transportation, 2011a) requires an air content within the range
of 5-8% for Class H and D mixtures. An air entraining admixture was used to obtain the
desired air content range. An average of the volumetric air content and the pressure
method air content was required to be within this range before placement of the concrete.
5.2.1.2.1 Volumetric Method
The air content determined via the volumetric method was tested in accordance with
ASTM C173 (2010b). After proper mixing of constituent materials, the mixture filled the
dampened, 2.0 L [0.075 ft3] standard measuring bowl of the air meter in two lifts, being
rodded 25 times per lift. After each layer the sides of the bowl were tapped
approximately 10 times with a rubber mallet to close any voids left by the tamping rod
and to release any large bubbles of entrapped air. The concrete was then made flush with
top of the bowl using a strike off bar and the top portion of the air meter apparatus was
secured. Approximately 0.5 L [1pt] of water was added followed by 1 L [2 pt] of
isopropyl alcohol. Additional water was then added until the liquid level appeared at the
zero marking. The liquid tight cap was then attached.
The air meter was inverted and shook in a repetitious manner for 45 s to insure the
concrete has broken free and the aggregate was heard moving in the meter. It was then

32
placed on the ground and titled at approximately 45° from the vertical position and
vigorously rolled back and forth for 1 min. The apparatus was then set in an upright
position for until the liquid level stabilized and the initial air content was record to the
nearest 0.25%. When the initial meter reading is obtained, the rolling procedure is
repeated to obtain an final meter reading. When the reading has not changed more than
0.25% of the initial reading, than this value is recorded as the final air content. All
mixture followed this procedure, as no “additional requirements” per ASTM C173
(2010b) were necessary.
5.2.1.2.2 Pressure Method
The air content via the pressure method was determined in accordance with ASTM C231
(2010). After proper mixing of constituent materials, the mixture filled the dampened, 7
L [0.25 ft3] Type B measuring bowl of the air meter in two lifts, being rodded 25 times
per lift. After each layer the sides of the bowl were tapped approximately 10 times with a
rubber mallet to close any voids left by the tamping rod and to release any large bubbles
of entrapped air. The concrete was then made flush with top of the bowl using a strike
off bar and the top portion of the air meter apparatus was secured. Once the top portion
was secured, water was injected into one of the two petcocks, until it emerged from the
other. The gauge was stabilized at the initial pressure line and the main pressure valve
was released. Once the gauge hand stabilized, that value was recorded as the apparent air
content of the sample tested. The total air content was then calculated by subtracting the

33
aggregate correction factor, determined by ASTM C231 (2010), from the apparent air
content.
5.2.1.3 Unit Weight
The unit weight of freshly mixed concrete was determined in accordance with ASTM
C138/C138M (2013). The steel bowl used in the pressure test method was used in
determining unit weight (see Section 5.2.1.2.2 for dimensions). The mass of the empty
bowl was obtained to the nearest 0.05 kg. A freshly mixed concrete sample was placed in
the dampened steel bowl in two lifts, being rodded 25 times per lift. After consolidation,
the top surface was made flush with the bowl by a strike off bar. The mass of the bowl
and specimen were then obtained to the nearest 0.05 kg and the unit weight calculated.
5.2.2 Mechanical Properties
5.2.2.1 Compressive Strength
The compressive strength of cylindrical concrete specimens was determined in
accordance with ASTM C39 (2012a). Sets of three, 4 in diameter by 8 in tall [100 mm
by 200mm], cylinders were cast to study the compressive strength of each mixture. A set
was made for testing at ages of both 28 and 56 days. The cylinders were cast in two lifts,
being vibrated and rodded 25 times after each lift. After one day of curing, the cylinders
were demolded, sealed, and stored in a moist chamber at a temperature of 23 ± 1 °C until
testing. For each day of testing, three cylinders were tested to determine the compressive
strength of the mixtures. The cylinders were loaded at a rate of 35 ± 2 psi/s [0.25 ± 0.05

34
MPa/s] in a 700 kip [3100 kN] hydraulic compression machine, utilizing neoprene end
caps when tested.
5.2.2.2 Modulus of Elasticity
The static modulus of elasticity (Young’s modulus of elasticity) was determined using a
procedure similar to that in ASTM C469 (2010). Sets of two, 4 in diameter by 8 in tall
[100 mm by 200mm], cylinders were cast to study the compressive strength of each
mixture. A set was made for testing at ages of both 28 and 56 days. The cylinders were
cast in two lifts, being vibrated and rodded 25 times after each lift. After one day of
curing in their molds, the cylinders were demolded, sealed, and stored in a moist chamber
at a temperature of 23 ± 1 °C until tested. Upon testing, the cylinders were fitted with a
compressometer equipped with a linear variable differential transformer (LVDT)
displacement transducer. The cylinders were then loaded to 40% of their ultimate
strength two separate times. The resulting slope of the stress-strain curve from the
second loading was taken as the static modulus of elasticity. For each day of testing, two
cylinders were tested for every mixture with no cylinder being tested at more than one
age.

35
5.3 Results and Discussions
5.3.1 Fresh Properties
This section presents the fresh properties for the mixtures evaluated in this study. The
results are presented in a tabular format, in which the slump, air content, and unit weight
are provided. These values are used to describe the mixtures that are to be evaluated in
the following sections and to provide each mixtures properties for future reference. Air
content was required to be within a range of 5-8% for Class H and D mixtures (Colorado
Department of Transportation, 2011). An air entraining admixture was used, MB-AE 90
by BASF (recommend dosage of ¼ - 4 fl oz/cwt [16 – 260 mL/100 kg]), to obtain this
desired air content range. The amount used will be presented in the following sections.
Since slump is not specified for Class H and D mixtures by Colorado DOT Specifications,
field workability was not of concern for these mixtures. A water reducing admixture,
Glenium 3030 by BASF (recommend dosage for mid-range use of 3 - 6 fl oz/cwt [195 –
390 mL/100 kg]), was added to the mixtures until desirable lab workability was achieved,
taking caution to avoid aggregate-paste segregation. The amount of water reducer used is
also reported.
5.3.1.1 Preliminary Mixtures
The fresh properties of the preliminary mixtures can be found in the following tables.
Table 5.1 presents the amount of water reducer used, slump, unit weight (γc), and unit
weight normalized to the standard mixture (γnorm). Table 5.2 presents the amount of air
entrainer used, air content via volumetric method, and air content via pressure method.
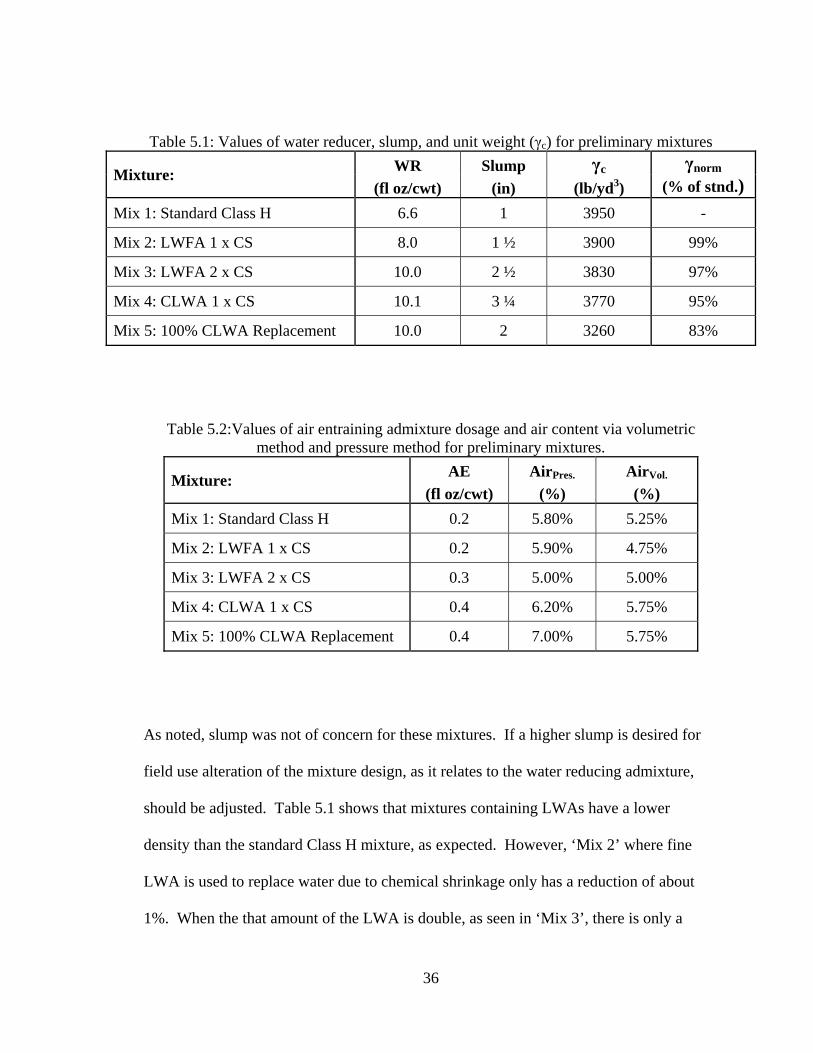
36
Table 5.1: Values of water reducer, slump, and unit weight (γc) for preliminary mixtures
Mixture: WR Slump γc γnorm
(fl oz/cwt) (in) (lb/yd3) (% of stnd.)
Mix 1: Standard Class H 6.6 1 3950 -
Mix 2: LWFA 1 x CS 8.0 1 ½ 3900 99%
Mix 3: LWFA 2 x CS 10.0 2 ½ 3830 97%
Mix 4: CLWA 1 x CS 10.1 3 ¼ 3770 95%
Mix 5: 100% CLWA Replacement 10.0 2 3260 83%
Table 5.2:Values of air entraining admixture dosage and air content via volumetric method and pressure method for preliminary mixtures.
Mixture: AE AirPres. AirVol.
(fl oz/cwt) (%) (%)
Mix 1: Standard Class H 0.2 5.80% 5.25%
Mix 2: LWFA 1 x CS 0.2 5.90% 4.75%
Mix 3: LWFA 2 x CS 0.3 5.00% 5.00%
Mix 4: CLWA 1 x CS 0.4 6.20% 5.75%
Mix 5: 100% CLWA Replacement 0.4 7.00% 5.75%
As noted, slump was not of concern for these mixtures. If a higher slump is desired for
field use alteration of the mixture design, as it relates to the water reducing admixture,
should be adjusted. Table 5.1 shows that mixtures containing LWAs have a lower
density than the standard Class H mixture, as expected. However, ‘Mix 2’ where fine
LWA is used to replace water due to chemical shrinkage only has a reduction of about
1%. When the that amount of the LWA is double, as seen in ‘Mix 3’, there is only a

37
reduction of about 3% from the standard mixture, ‘Mix 1’. The maximum reduction in
unit weight is 17% for a full replacement with coarse LWA.
Table 5.2 provides air contents for each mixture. Air content for ‘Mix 2 – LWFA 1 x CS’
was just outside of the 5-8% range for the volumetric method, however the pressure
method met the desired content. Therefore, this mixture was deemed usable, as this is the
approved method used most commonly in New York and Indiana IC field deck mixtures.
5.3.1.2 Optimized Mixtures
The fresh properties of the optimized mixtures can be found in the following tables.
Table 5.3 presents, for each mixture, the amount of water reducer used, the slump, unit
weight (γc), and unit weight normalized to the standard mixture (γnorm). Table 5.4
presents, for each mixture, the amount of air entrainer used, air content via volumetric
method, and air content via pressure method.
Table 5.3: Values of water reducer, slump, and unit weight (γc) for optimized mixtures
Mixture: WR Slump γc γnorm
(fl oz/cwt) (in) (lb/yd3) (% of stnd.)
Mix 6: IC Buildex 8.0 3 3650 92%
Mix 7: IC Utelite 8.0 5 ¼ 3800 96%
Mix 8: Standard Class D 2.7 6 ½ 3870 -
Mix 9: IC Class D 2.7 6 ½ 3750 97%

38
Table 5.4: Values of air entraining admixture dosage and air content via volumetric method and pressure method for optimized mixture.
Mixture: AE AirPres. AirVol.
(fl oz/cwt) (%) (%)
Mix 6: IC Buildex 0.3 7.9% 6.5%
Mix 7: IC Utelite 0.3 6.8% 6.8%
Mix 8: Standard Class D 0.3 6.0% 5.8%
Mix 9: IC Class D 0.2 6.1% 5.8%
5.3.2 Mechanical Properties
This section presents the mechanical properties of the mixtures evaluated in this study.
The compressive strength and modulus were taken at 28 and 56 days. The 28-day tests
were chosen because this is the typical age at which compressive strength is taken. The
56-day compressive strength testing is required by Colorado DOT Specification Section
600 to be 4500 psi for Class D concrete. The 56-day compressive strength testing is
required by Colorado DOT Specification Section 600 to be 4500 psi for Class H concrete.
The results are presented in a comparative graphical format, as well as a tabular format.
The graphical format presented for the mixtures is a bar graph of compressive strength/
elastic modulus, normalized to that of the standard mixture (Class H or D, whichever is
applicable). The tables provide numerical data for both tests.
5.3.2.1 Preliminary Mixtures
The normalized compressive strengths and elastic moduli of each preliminary mixture to
its standard counterpart (i.e., all preliminary mixtures are normalized to ‘Mix 1 –

39
Standard Class H’) at an age of 28 and 56 days are shown in Figure 5.1 and Figure 5.2,
respectively. Table 5.5 and 5.6 provides numerical data for compressive strength and
elastic modulus (and the corresponding standard deviations) rounded to the nearest
hundred psi and ksi, respectively, at 28 and 56 days. The reported values are an average
of three cylinders for compressive strength and two cylinders for elastic modulus (a dash
in the standard deviation column indicates that only one test for modulus returned valid
results).
All preliminary mixtures well exceeded the 4,500 psi compressive strength at 56 days,
required per Colorado DOT Specifications (in fact all five mixtures exceeded this at 28
days). The first trend that can be noticed is the relative performance of the IC systems.
The IC mixtures (with the exception of Mix 5) had a higher compressive strength than the
standard mixture. With ‘Mix 5’ being a 100% LWCA, it was expected that this mixture
would have a slight decrease in compressive strength. The increase in compressive
strength that was observed in many of the IC mixtures can be attributed to the increased
hydration caused through internal curing. These conclusions coincide with what Golias
et al. (Golias et al., 2012) have shown; that compressive strength of internally cured
mixtures shows an increase compared to plain mixtures when sealed (as is the case for
out mixtures), or drying type conditions are encountered in the curing process. This is
most common to what will take place in the field. These benefits of IC do not hold true
for standard samples, which are water cured, as hydration is able to continue in the plain
system.

40
Internally cured mixtures using LWA show a reduction in the modulus of elasticity.
Mixture 4 shows very similar properties to mixture 1 for elastic modulus, as only a small
portion of NWA was replaced with LWA. Mixture 5 has the greatest reduction in
modulus of 29% and 37% and 28 and 56 days, respectively. This reduction in modulus
can be attributed the addition of porous LWA material into the system, which reduced the
overall stiffness.
A decreased modulus in IC mixtures, while reducing the overall stiffness of the concrete,
can actually be beneficial in reducing shrinkage cracking. The interface between NWA
and paste can be an epicenter of crack formation. This is due to stress buildup from the
large differences in stiffness between the NWA and paste. The NWA acts in restraint to
movement of paste. When NWA particles are substituted by LWA particles, the change
in stiffness, or degree of restraint, at the interface of the paste is reduced, resulting in less
stress buildup and ultimately decreased cracking potential. This is consistent with work
done by Raoufi using finite element modeling to examine stress development (Raoufi et
al., 2011).

F
F
Figure 5.1: P
Figure 5.2: P
Preliminary m
Preliminary
mixtures com
mixtures mo
41
mpressive st
odulus of ela
trength, norm
asticity, norm
malized to st
malized to st
tandard mixt
tandard mixt
ture.
ture.

42
Table 5.5: Values of compressive strength (f'c) and standard deviation (STDEV) preliminary mixtures at 28 and 56 days.
Mixture: f'c - 28 day STDEV f'c - 56 day STDEV
(psi) (psi) (psi) (psi)
Mix 1: Standard Class H 5400 140 6100 482
Mix 2: LWFA 1 x CS 5800 20 6800 374
Mix 3: LWFA 2 x CS 6100 88 6600 382
Mix 4: CLWA 1 x CS 5700 316 6500 303
Mix 5: 100% CLWA Replacement 5200 128 6100 146
Table 5.6: Values of Young’s elastic modulus (Ec) and standard deviation (STDEV) preliminary mixtures at 28 and 56 days.
Mixture: Ec - 28 day STDEV Ec - 56 day STDEV
(ksi) (ksi) (ksi) (ksi)
Mix 1: Standard Class H 4500 164 5000 -
Mix 2: LWFA 1 x CS 4300 12 4600 65
Mix 3: LWFA 2 x CS 4300 64 4300 -
Mix 4: CLWA 1 x CS 4500 - 4800 -
Mix 5: 100% CLWA Replacement 3200 80 3100 33
5.3.2.2 Optimized Mixtures
The normalized compressive strengths and elastic moduli of each optimized mixture to its
standard counterpart (Mix 6 and Mix 7 are normalized to ‘Mix 1 – Standard Class H’ and
Mix 9 is normalized to ‘Mix 8 – Standard Class H’) at an age of 28 and 56 days are
shown in Figure 5.3 and Figure 5.4, respectively. Table 5.7 and 5.8 provides numerical
data for compressive strength and elastic modulus (and the corresponding standard
deviations) rounded to the nearest hundred psi and ksi, respectively, at 28 and 56 days.

43
Mix 1 – Standard Class H is shown on the plots as a reference. The reported values are
an average of three cylinders for compressive strength and two cylinders for elastic
modulus.
The internally cured Class H optimized mixtures, Mix 6 and Mix 7, well exceeded the
4,500 psi compressive strength requirement, at 56-days, required by Colorado DOT
specifications for Class H concrete. The Class D requirements specify that a 4,500 psi
compressive strength must be met at a 28-day time period. The standard Class D mixture,
Mix 8, did not meet the meet this strength requirement. It should be noted that this was
the standard Class D mixture and that the IC mixture, Mix 9, exceeded the 4,500 psi
requirement. Unlike the other IC Class H mixtures (excluding Mix 5), Mix 7’s
compressive strength was less than that of Standard Class H for both 28 and 56 days.
This could be due to LWFA being a more porous material. Mix 9, internally cured Class
D mixture, far exceeded the standard Class D mixture in compression for both 28 and 56
days. Similar to the preliminary mixtures, the internally cured optimized mixture show a
reduction in the modulus of elasticity.

F
Figure 5.3:
Figure 5.4: P
Optimized m
Preliminary
mixtures com
mixtures mo
44
mpressive str
odulus of ela
rength, norm
asticity, norm
malized to sta
malized to st
andard mixtu
tandard mixt
ure.
ture.

45
Table 5.7: Values of compressive strength (f'c) and standard deviation (STDEV) optimized mixtures at 28 and 56 days.
Mixture: f'c - 28 day STDEV f'c - 56 day STDEV
(psi) (psi) (psi) (psi)
Mix 6: IC Buildex 5900 22 6200 77
Mix 7: IC Utelite 5200 219 5700 243
Mix 8: Standard Class D 4400 131 4800 45
Mix 9: IC Class D 5200 222 5500 45
Table 5.8: Values of Young’s elastic modulus (Ec) and standard deviation (STDEV) optimized mixtures at 28 and 56 days.
Mixture: Ec - 28 day STDEV Ec - 56 day STDEV
(ksi) (ksi) (ksi) (ksi)
Mix 6: IC Buildex 4200 13 4000 20
Mix 7: IC Utelite 4100 76 4200 108
Mix 8: Standard Class D 4000 112 4400 -
Mix 9: IC Class D 4000 18 4200 68

46
5.4 Summary and Conclusions
This chapter investigated the fresh and mechanical properties of both standard and
internally cured Colorado DOT Class H and D mixtures. The fresh properties presented
consist of slump, air content from both the volumetric and pressure methods, and density
for each of the nine mixtures. These tests were performed by a certified ACI Grade I
concrete field-testing technician. The mechanical properties consist of compressive
strength and elastic modulus values at both 28 and 56 days. All values of fresh and
mechanical properties presented in this chapter were of the ‘large’ cast in which freeze
thaw and scaling specimens were made. Results from this chapter can be summarized as
follows:
Slump was not of concern for these mixtures. If a higher slump is desired for
field use the amount water reducing admixture should be adjusted.
Mixtures containing LWAs (i.e., IC mixtures) have a lower density than the
standard mixtures, as expected.
An air entraining admixture was used to obtain the desired air content per
Colorado DOT Specifications for both standard and IC mixtures. The pressure
method is the preferred method for obtaining air content since it is easier for field
use. However, the volumetric method provides a somewhat consistent and
comparable value.
In compression, the IC mixtures for most cases performed better than the standard
mixture. The increase in compressive strength is attributed to the increased
hydration caused through internal curing. These findings are consistent with work
done by Golias (Golias et al., 2012).

47
The IC mixtures were all above the values specified by Colorado DOT
specification for Class H and Class D mixtures of 4,500 psi at 28 and 56 days,
respectively.
All IC mixtures showed a reduction in the modulus of elasticity, which is
attributed to adding a material that has reduced stiffness, i.e., LWA.
The reduction in modulus will actually benefit mixtures in reducing shrinkage
cracking, as the modulus at the interface of the aggregate and paste are more
similar and do not create a large restraint, which would consequently generate
large stresses.

48
CHAPTER 6. EVALUATION OF CYCLIC FREEZING AND THAWING BEHAVIOR
6.1 Introduction
The objective of this study is to investigate the performance of internally cured, high
performance concrete for potential use by the Colorado DOT. In particular, this study
evaluates a series of internally cured high performance concrete mixtures, as noted in
Table 4.1, for the Colorado DOT that meet the specifications of a Class H and Class D
concrete. The use of internal curing in high performance concrete can increase the
resistance to early-age cracking and enhance durability (Bentz and Weiss, 2011).
This chapter presents the results of the nine mixtures with respect to their resistance to
scaling and rapid freeze-thaw durability. The test methods and casting procedures will be
discussed first, followed by the results and discussions presented in a systematic order, in
which the preliminary mixtures will be presented, followed by the optimized mixtures for
each test being discussed.
6.2 Mixing, Placing, and Curing Procedures
Materials were batched and mixed in accordance to the procedure presented in Section
4.3. For internal curing mixtures, the LWA was soaked in the required mixing water
(including the water required to replace chemical shrinkage) for a 72 ± 4 hour period
prior to mixing. The curing methods used for each experiment will be discussed

49
individually where applicable, as curing methods used for a particular test may not be a
desirable method for another. Fresh properties of the concrete were taken and can be
found in Tables 5.1-5.4. Special attention was taken to ensure that the air content of each
mixture was within the range of 5-8%, as prescribed by Colorado DOT Specification
Section 601 (Colorado Department of Transportation, 2011a).
6.2.1 Rapid Freezing and Thawing
The rapid freezing and thawing durability of each mixture was determined in accordance
with ASTM C666 (2003, reapproved 2008). Sets of three 4 in wide by 3 in tall by 16 in
long samples were cast for each mixture to study the resistance to rapid freezing and
thawing. The specimens were cast in two lifts, being vibrated and rodded 25 times after
each lift, and trowel finished on the top surface. After a 24 ± 2 hour period the specimens
were removed from the molds, bag sealed, and placed in a moist chamber at 23 ± 1°C
[73.5 ± 1.5 °F] for a 14-day curing period.
After the curing period, the specimens were removed from the bags and for consistency
in testing, were brought to the target internal thaw temperature, within -1°C and +2°C [-
2°F and 4°F]. At this point the concrete specimens masses were determined and they
were tested for transverse frequency. All transverse frequency testing was performed in
accordance with ASTM C215 (2008). After initial measurement were determined,
specimens were placed in a pan with water, such that all faces were completely
surrounded by not less than 1/32 in. [1 mm] nor more than 1⁄8 in. [3 mm] of water at all
times while it is being subjected to freezing-and-thawing cycles. The pans containing

50
water and the concrete specimens were then placed in a chamber that underwent freeze-
thaw cycling in which consist of alternately lowering the temperature of the specimens
from 40 to 0 °F [4 to -18 °C] and raising it from 0 to 40 °F [-18 to 4 °C] in 4 ½ ± ½ hour.
Specimens were removed at the desired thaw temperature and tested approximately every
36 cycles, until a total of 300 cycles or until its relative dynamic modulus of elasticity
reached 60% of the initial modulus, whichever occurred first.
6.2.2 Scaling Resistance to Deicing Chemicals
The scaling resistance of each mixtures horizontal concrete surface exposed to freezing
and thawing in the presence of deicing chemicals was determined in accordance with
ASTM C672 (2003) as well as Ontario Ministry of Transportation’s (MTO’s) scaling test
(MTO LS-412). The intent for using a combination of these standards was to evaluate
the surface resistance of the mixtures through both qualitative and quantitative
examination. Sets of three 7 ½ in wide by 3 in tall by 10 in samples were cast for each
mixture to study the resistance to rapid freezing and thawing. The specimens were cast in
two lifts, being vibrated and rodded 25 times after each lift. The samples were finished
using a steel trowel by the same person with the intent of maintaining consistency for the
finished surface. After a 24 ± 2 hour period the specimens were removed from the molds,
bag sealed, and placed in a moist chamber at 23 ± 1°C [73.5 ± 1.5 °F] for a 14-day “moist
storage” curing period. The specimens were then removed from the bags and placed in a
chamber at 50 ± 1 %RH and 23 ± 1°C for a 14-day “air storage” curing period.

51
After the curing period, a dike made of Styrofoam and secured by rubber silicone, is
placed along the perimeter of the top surface of each specimen. The dike is to hold
approximately 6 mm [1/4 in.] of a solution containing 4 g of anhydrous calcium chloride
to each 100 mL of water. The specimens are then placed in an environmental chamber in
which the temperature cycles from −18 ± 3°C [0 ± 5°F] within 17 hours to 23 ± 2.0°C
[73.5 ± 3.5°F] and 50 ± 1 %RH within 7 hours. This was repeated for a total of 50 cycles,
while qualitative and quantitative examination was performed after 5, 10, 15, 25, and 50
cycles. Qualitative examination consisted of a visual rating on a scale of 0 – 5, where 0
indicates no scaling and 5 indicates severe scaling. A plus/ minus rating was also used to
help further separate differences in scaling. For example a ‘2+’ indicates less scaling
than a ‘2’ while a ‘2-‘ indicates more scaling. Photographs were also taken each time the
samples were removed from the chamber for examination. Since the visual ratings
desired by ASTM C672 (2003) are not particularly descriptive and leave much room
operator variability and bias, an additional quantitative examination was performed to
better assess differences in mixture scaling. MTO LS-412 states that “After each 5 cycles,
remove the salt solution together with all the flaked off concrete from the surface and
place into a watertight contain…washing the surface of the specimen… strained through
a filter and the residue dried out in an oven at 105 °C to a constant mass condition.”
(MTO LS-412 R17). For each of the specimens, the top surface was flushed and scaled
materials was carefully removed and from the specimen. The scaled material was then
measured in terms of oven dry mass. At the conclusion of each examination fresh
solution was added to the top surface and the specimens were placed back in the chamber.

52
6.3 Results and Discussions
6.3.1 Rapid Freezing and Thawing
Before presenting the results, it should be again noted that this testing method is
performed using 14-day bag sealed curing method. The beam specimens go directly from
a sealed condition into the testing chamber, never experiencing a drying period. While it
is possible to replicate this condition in the field, it is unlikely and results should be
viewed as a “worst case scenario” situation. This is done to clearly identify which
mixtures perform poorly in freeze-thaw conditions.
6.3.1.1 Preliminary Mixtures
The results of the preliminary mixtures from rapid freezing and thawing can be seen in
the figures and table below. Figure 6.1 shows each mixtures relative dynamic modulus
(or durability) and Figure 6.2 the mass change as a function of the number of cycles. The
data shown in the plots is a summary of an average of three beam specimens. ‘Mix 5 –
100% LWCA Replacement’ is only shown to 195 cycles due to specimen failure at that
point. Although the line presented does not cross the failure limit at 195 cycles, a
specimen was unable to be tested past this point.
Table 6.1 summarizes the durability factors (calculated from relative dynamic modulus
and a ratio of the number of cycles reached to the specified number of cycles in which
exposure is to be terminated) of each beam specimen and shows an average durability
factor for each mixture as well as a summary of the mass change. The line at 60%

re
re
F
ca
p
T
R
F
elative dynam
eapproved 20
Figure 6.1
rom the pres
ase for ‘Mix
otential to n
Table 6.1 a be
Replacement
igure 6.1 sho
mic modulus
008).
: Plot of Mix(2003,
sented data,
x 3 – LWFA
ot perform w
eam failed fo
’, where a du
ows that ‘M
s indicates th
xtures 1-5 avreapproved
it is clear th
2 x CS’ and
well in freeze
for both ‘Mix
urability fact
ix 3 – LWFA
53
he failure lim
verage relati2008) rapid
at “excessiv
d ‘Mix 5 – 10
e-thaw envir
x 3 – LWFA
tor of less th
A 2 x CS’ ap
mit as specif
ive dynamic d freezing an
vely” interna
00% LWCA
ronments. It
A 2 x CS’ and
han 60% in c
pproaches fa
fied by ASTM
modulus bynd thawing.
al cured mixt
A Replaceme
t should be n
d ‘Mix 5 – 1
considered fa
ailure (and w
M C666 (20
y ASTM C66
tures, as is th
ent’, have the
noted that fro
00% LWCA
failure. Also
would have li
003,
66
he
e
om
A
o,
ikely

F
T
Figure 6.2: P
Table 6.1: Su
lot of Mixtu
ummary of Adata fo
ures 1-5 aver2008) rap
ASTM C666or preliminar
54
rage mass chpid freezing
(2003, reappry mixture d
hange by ASand thawing
proved 2008designs.
TM C666 (2g.
8) rapid freez
2003, reappr
zing and tha
roved
awing

55
failed if the test were extended past 300 cycles). It can also be seen in the figure that
‘Mix 5 – 100% LWCA Replacement’ fails with about 100 cycles remaining.
Failures in mixtures where more is provided water than what is necessary to replace the
water lost due to chemical shrinkage is likely due to excess, unused, water present in the
system. The concrete matrix will draw water the LWAs due to chemical shrinkage.
When excessive chemical shrinkage water is used, the additional water remains trapped
in the system, which can become very problematic when introduced to freezing and
thawing.
Concretes that perform well in freeze-thaw environments have enough empty air voids
present to accommodate the expansion from freezing water in the pores. Water can
expand by approximately 9% in volume (Powers, 1945) as freezing occurs. If a sufficient
amount of air voids are present, and connected, in the system to account for this
expansion in volume, damage become unlikely. If there is not enough empty pore space
in the system, or similarly an overabundance of water, the water starts to expand with
nowhere to go. This creates stress buildup inside the materials and will create internal
micro cracking, which build up and damage the integrity of the concrete. (Tanesi and
Meininger, 2007).
However, if the correct amount of water to replace that which is lost in chemical
shrinkage is supplied, as in the case for ‘Mix 2 – LWFA 1 x CS’ the results are very

56
similar to that of the standard mixture, ‘Mix 1 – Standard Class H’. The mixture labeled
‘Mix 4 – LWCA 1 x CS’ is not included in the previous statement because it has been
shown earlier in this report that the LWA particles are spaced too far apart to be the most
effective IC mixture. This mixture therefore performs very similarly to the reference
mixture, ‘Mix 1 – Standard Class H’ in freezing and thawing.
6.3.1.2 Optimized Mixtures
The results of the optimized mixtures from rapid freezing and thawing can be seen in the
figures and table below. Figure 6.3 shows each mixtures relative dynamic modulus (or
durability) and Figure 6.4 the mass change as a function of the number of cycles. The
data shown in the plots is a summary of an average of three beam specimens, except for
‘Mix 9 – IC Class D’ which is an average of two beam specimens due to a damaged beam
prior to testing. ‘Mix 1 – Standard Class H’ has also been plotted as a reference for ‘Mix
6 – IC Buildex’ and ‘Mix 7 – IC Utelite’, which are also Class H mixtures. Table 6.2
summarizes the durability factors (calculated from relative dynamic modulus and a ratio
of the number of cycles reached) of each beam specimen and shows an average durability
factor for each mixture as well as a summary of the mass change. The line at 60%
relative dynamic modulus indicates the failure limit as specified by ASTM C666 (2003,
reapproved 2008).
From the presented data it can be seen that all beam specimens performed well in the
rapid freeze thaw test. Both additional LWAs, ‘Mix 6 – IC Buildex’ and ‘Mix 7 – IC

U
st
IC
m
sl
is
Utelite’, have
tandard and
C Class D’.
mixtures of 0
lightly worse
s not of conc
Figure 6.3
e showed no
internally cu
Both mixtur
.42. It is no
e than the sta
cern.
: Plot of Mix(2003,
issues in a f
ured, are pre
res have a w
ticed that th
andard Class
xtures 6-9 avreapproved
57
freeze-thaw
esented as ‘M
w/c of 0.45, w
e internally
s D. Howev
verage relati2008) rapid
environmen
Mix 8 – Stand
which is high
cured Class
ver, with a du
ive dynamic d freezing an
nt. The Class
dard Class D
her than the
D mixture p
urability fac
modulus bynd thawing.
s D mixture,
D’ and ‘Mix
Class H
performed
tor of 96%,
y ASTM C66
,
9 –
this
66

F
T
Figure 6.4: P2008)
Table 6.2: Su
lot of Mixtu) rapid freezi
ummary of A
ures 6-9 avering and thaw
ASTM C666data for op
58
rage mass chwing. Mixtur
(2003, reappptimized mix
hange by ASre 1 is plotte
proved 2008xture design
TM C666 (2d again for r
8) rapid freezns.
2003, reapprreference.
zing and tha
roved
awing

T
fo
qu
ch
ex
6
av
F
The results of
ollowing figu
uantitative r
hemicals. T
xposure. Th
.3 summariz
verages of b
Figure 6.5: P
6.3.2
f the prelimi
ure and table
esults for sc
This plot is th
he results in t
zes the cumu
oth for each
Plot of MixtuMTO L
2 Scaling R
6.3.2.1
nary mixture
e. Figure 6.5
aling, norma
he cumulativ
this plot sho
ulative residu
h mixture at 5
ures 1-5 averLS-412 scalin
59
Resistance to
Preliminar
es from scal
5 shows a pl
alized to the
ve amount of
ow an averag
ue lost of eac
50 cycles.
rage cumulang resistance
o Deicing Ch
ry Mixtures
ling resistanc
lot of the pre
surface area
f residue lost
ge of the thre
ch specimen
ative scaling e to deicing
1
hemicals
ce can be see
eliminary mi
a exposed to
t during the
ee specimen
n, the visual r
by ASTM Cchemicals.
1 kg/m2 = 0.2 lb
en in the
ixtures
o deicing
50 cycles of
s tested. Tab
rating, and
C672 (2003)
b/ft2
f
ble
) and

T
sh
u
li
A
d
te
(B
is
in
w
la
Table 6.3:
The dashed li
hould be not
sing 3% NaC
imit for out m
ASTM C672
epend on ho
est concluded
Bleszynski e
s that the IC
nvestigative
well in the sc
arge replacem
1 kg/m2 = 0.2
Summary odeicing
ine shown at
ted that this l
Cl, not 4% C
mixture, it is
(2003) has b
ow the sampl
d inconsisten
et al., 2002).
mixtures do
team believe
aling test is
ments of LW
lb/ft2
of ASTM C6chemicals da
t 0.8 kg/m2 in
limit is the M
CaCl. This l
s simply ther
been shown
les were fini
ncies as high
With that b
o not perform
es the reason
due in part t
WA, which is
60
672 (2003) aata for prelim
ndicates the
MTO limit, w
imit does no
re to provide
to be incons
ished. It is in
h as 59% in
being said, th
m any worse
n ‘Mix 5 – 1
to altering th
s outside of t
and MTO LSminary mixt
limit of sca
which is set
ot intend to p
e a reference
sistent from
nteresting to
slag mixture
he main poin
than ‘Mix 1
00% CLWA
he thermal pr
the scope of
S-412 scalingture designs.
aling suggest
for a similar
provide a dis
e for scaling
test to test a
o note that th
es from dupl
nt to take fro
– Standard
A Replaceme
roperties of t
f this project
g resistance
ted by MTO
r scaling test
stinct failure
durable con
and to largely
he MTO scal
licate sample
om these resu
Class H’. T
ent’ perform
the concrete
.
to
. It
t
e
ncrete.
y
ling
es
ults
The
ms
e with

61
6.3.2.2 Optimized Mixtures
The results of the optimized mixtures from scaling resistance can be seen in the following
figure and table. Figure 6.6 shows a plot of each optimized mixtures quantitative results
for scaling, normalized to the surface area exposed to deicing chemicals. This plot is the
cumulative amount of residue lost during the 50 cycles of exposure. The results in this
plot show an average of the three specimens tested. Table 6.4 summarizes the cumulative
residue lost of each specimen, the visual rating, and averages of both for each mixture at
50 cycles.
The dashed line shown at 0.8 kg/m2 indicates the limit of scaling suggested by to MTO.
It should be noted that this limit is the MTO limit, which is set for a similar scaling test
using 3% NaCl, not 4% CaCl. This limit does not intend to provide a distinct failure
limit for out mixture, it is simply there to provide a reference for scaling durable concrete.
ASTM C672 (2003) has been shown to be inconsistent from test to test and to largely
depend on how the samples were finished. If finishing is not perfectly consistent from
sample to sample, the microstructure will considerably weaken, even if the concrete is
properly air entrained. It is interesting to note that the MTO scaling test concluded
perform any worse than ‘Mix 1 – Standard Class H’. However, the internally cured Class
D mixture, ‘Mix 9 – IC Class’, does perform worse than the standard Class D mixture,
‘Mix 8 – Standard Class D’. This could be due to finishing, or IC mixture could possibly
not work well in scaling with a higher w/c. More investigation may need to be performed
to determine if w/c has an effect on scaling with internally cured mixtures.

F
Figure 6.6: PMTO LS-4
Table 6.4:
1 kg/m2 = 0.2
Plot of Mixtu412 scaling
Summary odeicing
lb/ft2
1 k
ures 6-9 averresistance to
of ASTM C6g chemicals d
kg/m2 = 0.2 lb/f
62
rage cumulao deicing che
reference
672 (2003) adata for optim
ft2
ative scaling emicals. Mixe.
and MTO LSmized mixtu
by ASTM Cxture 1 is plo
S-412 scalingure designs.
C672 (2003)otted again f
g resistance
) and for
to
63
6.4 Summary and Conclusions
This chapter investigated the resistance to scaling and rapid freeze-thaw durability of
both standard and internally cured Colorado DOT Class H and D mixtures. Results from
this chapter can be summarized as follows:
Rapid freeze-thaw was conducted as a close to “worst case scenario” situation, i.e.,
specimens were directly placed into the testing chamber from a sealed condition.
This is done to clearly identify which mixtures perform poorly in freeze-thaw
conditions, not to replicate field conditions.
“Excessively” internally cured mixtures, i.e., mixtures that have more pre-wetted
LWA than is required to replace water lost due to chemical shrinkage, have the
potential to not perform well in freeze-thaw environments.
Excess, unused, water from LWA present in a concrete system is not favorable in
freeze-thaw conditions, as this excess water fills in pores, eliminating the aid that
empty pore space provides in room for expansion of freezing water.
Scaling is highly dependent on finishing. The main point to take from these
results is that the Class H IC mixtures do not perform any worse than the standard
Class H mixture. The Class D IC mixture does perform worse than the standard
Class D mixture in scaling, but not any worse than the standard Class H mixture.
Large replacements of LWA could results in alteration of thermal properties and
could potentially aid in scaling. However, if used for IC purposes the internal
integrity of the concrete will be lost, as previously discussed.

64
CHAPTER 7. EVALUATION OF SHRINKAGE PROPERTIES
7.1 Introduction
The objective of this study is to investigate the performance of internally cured, high
performance concrete for potential use by the Colorado DOT. In particular, this study
evaluates a series of internally cured high performance concrete mixtures, as noted in
Table 4.1, for the Colorado DOT that meet the specifications of a Class H and Class D
concrete. The use of internal curing in high performance concrete can increase the
resistance to early-age cracking and enhance durability (Bentz and Weiss, 2011).
This chapter presents the results of the nine mixtures with respect to their shrinkage
properties. Autogenous shrinkage, restrained shrinkage cracking, and free shrinkage in a
50% relative humidity (RH) drying condition were investigated. The test methods and
casting procedures will be discussed first, followed by the results and discussions
presented in a systematic order, in which the preliminary mixtures will be presented,
followed by the optimized mixtures for each test being discussed.
7.2 Mixing, Placing, and Curing Procedures
Materials were batched and mixed in accordance to the procedure presented in Section
4.3 for restrained shrinkage (dual rings) and free shrinkage in a 50% RH drying condition

65
(length change). Mixtures for early age autogenous shrinkage were cast separately using
a Hobart paddle, 0.25 ft3 capacity, mixing bowl.
In order to control aggregate pinching in the Hobart mixing bowl, a different mixing the
one discussed for the pan mixer was used. The fines, cementitious material, admixtures,
and mixing water were mixed first to create a fresh mortar. The time at which contact of
water and cementitious material occurred was noted followed by the addition of the
coarse aggregate. For internal curing mixtures, the LWA would soak in the required
mixing water (including the water required to replace chemical shrinkage) for a 24 ± 1
hour period prior to mixing. Values of LWA absorption for a 24-hour period were used
in the mixture designs for these tests. The curing methods used for each experiment will
be discussed individually where applicable.
7.2.1 Chemical Shrinkage
The goal of internal curing is to replace water that is consumed by the hydration reaction
(i.e., chemical shrinkage). Chemical shrinkage is defined as “the volume reduction
associated with the reaction between cement and water in hydrating cement paste” (Bentz,
1995). While a typical chemical shrinkage for portland cement is on the order of 0.07
mL/g cement, the values for fly ash and slag can be 2 and 3 times greater, respectively
(Bentz, 2007). As previously noted, this study used cement and fly ash from suppliers
available in the Colorado area. If other cements/ cementitious materials are used, it is
necessary that a chemical shrinkage test be performed on the cementitious materials
before creating a mixture design.

66
For any binder of interest, the chemical shrinkage of a paste specimen is measured using
the ASTM C1608 (2007) standard test method. The test was performed on a mixture
with a 20% replacement of portland cement with fly ash, by mass (as is the case with the
investigated concrete mixtures). The binder was mixed using a Twister Evolution 120V
high shear (vacuum) mixer. The dry materials mixed for 15 seconds at 350 rpm,
followed by the addition of water with mixing for 90 seconds at 350 rpm. The walls were
and blades were then scraped to and the mixing continued for 60 seconds at 450 rpm.
Three glass vials were filled with approximately 5mm of paste. Clean, de-aerated water
was then filled to the top of the vial, with caution to not disturb the paste. A stopped and
graduated capillary tube was inserted into the vial. The capillary tube was then filled
with water filled to the top. Measurements were then taken visually every 30-60 minutes
for the first 8 hours and at a 24-hour period. They were then monitored periodically over
the following month. A control tube to monitor evaporation was also considered and
corrections were made in the chemical shrinkage calculations.
7.2.2 Autogenous Shrinkage
Before discussing the testing methodologies, it may be beneficial to provide an
understanding of autogenous shrinkage. This form of shrinkage is defined as the volume
change occurring with no moisture being transferred to the surrounding environment.
Autogenous shrinkage is a result of chemical shrinkage. It is an external volume
reduction under isothermal, sealed conditions. An illustrative comparison of chemical
shrinkage and autogenous shrinkage can be seen in Figure 7.1 to better understand these
descriptions.

B
v
st
in
so
o
co
cl
fo
Figure 7.1:
Based on the
ersion of AS
train of ceme
n the system
ome mixture
f the modifie
orrugated tu
lose attentio
or expansion
: Illustration
protocol dev
STM C1698
ent paste and
. Concretes
es rely on the
ed autogeno
be, in which
n to be sure
n in the longi
of the differ
veloped for c
(2009), the
d mortar, wa
containing c
ese larger ag
us strain test
h concrete is
each rib of t
itudinal dire
67
rence betwee
cement paste
standard tes
as used to ac
coarse aggre
ggregates for
t can be seen
placed via r
the tube is fi
ction, while
en chemical
e (Jensen et
st method for
ccount for th
egates are of
r the source
n in Figure 7
rodding and
illed. A corr
providing s
and autogen
al., 1995), a
r measuring
e role of coa
f interest for
of internal c
7.2. The figu
vibration in
rugated tube
tiffness in th
nous shrinka
a modified
autogenous
arse aggrega
this study, a
curing. An im
ure shows a
3 lifts, payin
e is used to a
he radial
age
ates
as
mage
ng
allow

d
is
al
k
(L
m
F
T
th
te
co
an
irection. Im
s place in the
llow for unre
ept constant
LVDT) displ
measure chan
Figure 7.2: M
The dual ring
he desired m
est was built
onsists of tw
nd temperatu
mmediately a
e tube such t
estricted exp
at 50 ± 1%
lacement tra
nges in lengt
Modified vers
g test was use
mixtures. Sim
specifically
wo instrumen
ure controlle
Samp
fter casting,
that it is com
pansion and
RH and 23 ±
ansducer was
th over time.
sion of ASTof a
7.2.3
ed to quantif
milar to AST
y to monitor b
nted concentr
ed chamber (
ple
68
the tube is p
mpletely seale
contraction.
± 1°C. A lin
s placed at e
M 1698 (200concrete sp
Restrained
fy the stress
TM 1581 (20
both expans
ric invar res
(Radlinska e
LVDTs
Fr
placed in the
ed and place
The room i
near variable
ach end of th
09) to measuecimen.
Shrinkage
that is due t
009a), single
sion and cont
training ring
et al., 2007; S
rictionle
e testing app
ed on a “frict
in which the
e differential
he tubes to a
ure the autog
to deformatio
e ring, the co
traction in th
gs that opera
Schlitter et a
ss Supp
aratus. Con
tion free” ba
e test is run i
l transforme
automatically
genous shrin
ons of each o
oncrete dual r
he mixtures.
ate in an insu
al., 2010;
ports
ncrete
ase to
is
r
y
nkage
of
ring
It
ulated

S
ou
co
b
u
ar
hu
to
A
2
sh
B
(D
an
chlitter et al
uter rings in
oncrete spec
ath. See Fig
sed to maint
re then place
umidity for
o thermal an
After 7 days o
°C/hour to c
hown to con
Based on geo
DOR) of 70%
nd used to d
Figure 7.3:
l., 2011). Fo
n two lifts, be
cimen sit upo
gure 7.3 for a
tain a consta
ed inside an
a defined pe
d drying stre
of isotherma
create large s
ntrol tempera
ometry, the in
% and 40%,
determine the
Dual ring te
or this test, a
eing vibrated
on a base pla
an image on
ant temperatu
insulted cha
eriod of time
ess buildup.
al stress build
stresses in th
ature gradien
nner and out
respectively
e stress build
est used to mcondi
69
concrete sp
d after each l
ate, which is
the dual rin
ure. The ring
amber to mai
e. This elimi
dup the temp
he sample. T
nts in the con
ter rings hav
y. Strain me
dup and age
monitor stresitions for the
ecimen was
lift, then trow
s temperature
ng setup. Aft
gs, concrete
intain a cons
inates any ef
perature of t
This rate is v
ncrete specim
ve an approx
easurements
of cracking
sses while cre concrete
cast betwee
wel finished
e controlled
fter casting, t
specimen, a
stant temper
ffects that co
the plate dro
very importan
men (Schlitte
ximate degree
were autom
in the sampl
reating restra
en the inner a
d. The rings
through a w
the water bat
and base plat
ature and
ould be attrib
ps at a rate o
nt, as it has b
er et al., 201
e of restraint
matically reco
le.
ained bounda
and
and
water
th is
te
buted
of
been
11).
t
orded
ary

70
7.2.4 Drying Shrinkage
The drying shrinkage was measured in accordance with ASTM C157 (2008), the standard
test method for length change of hardened hydraulic concrete. It should be noted that this
test method measures the sum of drying and autogenous shrinkage, as the first
measurement is taken after a time of 24 hours after casting. Sets of three 3 in wide by 3
in tall by 11 ¼ in long [75 mm by 75 mm by 285mm] samples were cast for each mixture
to study the drying shrinkage. Gage studs were embedded into the ends of each sample.
The specimens were cast in two lifts, being rodded 25 times and vibrated after each lift,
and then trowel finished on the top surface. After a 24 ± 2 hour period the specimens
were removed from the molds and an initial comparator reading was obtained. They
were then bag sealed, and placed in a moist chamber at 23 ± 1°C [73.5 ± 1.5 °F] for a 28-
day curing period. After the curing period, the specimens were removed from the sealed
condition and a comparator reading was taken. The concrete specimens were then placed
in a 50 ± 1 %RH and 23 ± 1°C chamber for drying.
7.3 Results and Discussions
7.3.1 Chemical Shrinkage
A plot of chemical shrinkage over time can be seen in Figure 7.4. As noted earlier in this
report, to create mixture design and begin casting, the investigative team assumed a
chemical shrinkage value of 0.064 mL/g. From the data presented in Figure 7.4 an
ultimate chemical shrinkage value was estimated to be 0.075 mL/g, therefore the initial
assumption is valid. The ultimate chemical shrinkage value represents the total chemical
shrinkage at 100% degree of hydration. This was determined through linear

ex
es
hy
b
xtrapolation
stimating the
ydration, or
lend of ceme
Figure 7.4: P
by plotting
e intercept (i
ceasing of c
ent and fly a
Plot of avera
the chemica
i.e., chemica
chemical shr
ash.
age chemical
71
al shrinkage
al shrinkage
inkage, is es
l shrinkage,
1 mLwater/gbind
against the i
at an infinite
stimated to b
in mL per g
der = 1
inverse of a t
e time). A 1
be around 18
gram of ceme
time and
100% degree
85 days for th
entitious bin
e of
his
nder.

72
7.3.2 Autogenous Shrinkage
7.3.2.1 Preliminary Mixtures
The results of the preliminary mixtures from autogenous shrinkage can be seen in the
following figures. Figures 7.5 (a) – (e) present the strain due to sealed, isothermal
volumetric changes in the concrete. The data presented monitors autogenous
deformations and temperature for a period of 7 days. Negative values represent
shrinkage of the material, while positive values represent expansion. The results
presented are the deformations corrected to the time of set, which was assumed to be a
constant value for all presented mixture. A time of 6 ½ hours was chosen based on a
derivative analysis for the standard mixture (Sant et al., 2009).
Figure 7.5 (a) presents the results of the standard Class H mixture, in which autogenous
shrinkage was measure up to approximately 30 microstrain. IC mixtures, as seen in
Figures 7.5 (b), (c), (d), and (e) show swelling (or expansion) in the concrete, which is
caused from the water present in the LWA. As the cementitious material hydrates, the
water ‘pushes’ into the pores, causing expansion of the overall system. As time increases
the water will redistribute in the matrix and swelling will subside. The swelling starts to
reduce in ‘Mix 2 – LWFA 1 x CS’ as the age of the specimen approaches 7-days. If the
autogenous strain were to be measure over much longer period of time, the concrete will
relax and the measured strain would be nearly zero.
73
Figure 7.5 (c), where 2X the amount of chemical shrinkage is replaced with LWA fines,
shows larger initial swelling than the standard replacement, Figure 7.5 (b). Figure 7.5 (d)
displays a similar behavior to that of Figure 7.5 (b). It was earlier noted that proper
distribution of aggregates for IC purposed couldn’t be achieved with coarse LWA. While
this still holds true, the expansion seen here is likely occurring simply due to water
leaving the LWA pores, as it does in the other IC systems, pushing outwards and creating
expansive forces.
Note the y-axis in Figure 5.7 (e), as Mixture 5 has so much excess water that it continues
swelling over the 7-day period by trying to force water through the pore space. At some
point later in time the swelling would eventually subside, however it would take a much
longer time than the other mixtures presented here.
7.3.2.2 Optimized Mixtures
The results of the optimized mixtures from autogenous shrinkage can be seen in the
following figures. Figures 7.6 (a) – (d) present the strain due to sealed, isothermal
volumetric changes in the concrete. The data presented monitors autogenous
deformations and temperature for a period of 7 days. Negative values represent
shrinkage of the material, while positive values represent expansion. The results
presented are the deformations corrected to the time of set, which was assumed to be a
constant value for all presented mixture. A time of 6 ½ hours was chosen based on a
derivative analysis for the standard mixture (Sant et al., 2009).

Figure 7.5: Results formixtures
r the autogen1 – 5, are sh
74
nous strain dhown in figur
developed inres (a) – (e),
n the prelimin, respectively
nary mixturey.
es,

75
The ‘recommended dosage’ internally cured mixture from different suppliers, i.e.,
Figures 7.6 (a) and (b), display the same response as seen in the Figure 7.5 (b). These
mixtures demonstrate initial swelling with eventual relation after water has been pulled
from the LWA pores. Figures 7.6 (c) and (d) look relatively similar, in which there is
initial expansion from the mixture followed by relaxation. Figure 7.6 (c), Mix 8 -
Standard Class D, shows a little shrinkage towards the end of the testing life, where
Figure 7.6 (d) relaxes to a value of zero. This similarity is likely due to the nature of the
higher w/c.

It
o
p
th
co
h
fi
Figure 7.6
t will be noti
ccurring in t
lain mixture
hose mixture
oarse aggreg
igher degree
ix the cemen
6: Results fomixtures 6
iced that eac
the system.
es and relativ
es consisted
gate into the
e of restraint
ntitious mate
or the autoge6 – 9, are sho
7.3.3
ch of these m
Past dual rin
vely low stre
of mortar, h
cement mat
t to shrinkage
erial content
76
enous strain down in FigurRestrained
mixtures has r
ng experienc
ess in IC mix
aving much
trix removes
e in the syste
at an averag
developed inures (a) – (d),
Shrinkage
relatively lo
ce has shown
xtures (Schli
higher paste
a large amo
em. Since it
ge value of th
n the optimiz, respectivel
ow amounts o
n a high stre
itter et al., 20
e contents. I
ount of paste
t was decide
he range pro
zed mixturesly.
of shrinkage
ss buildup in
010). Howe
Introducing
e and adds a
ed in this stu
ovided in
s,
e
n
ver,
udy to

77
Colorado DOT Specification Section 601 (2001a; 2011b), a relatively high total
aggregate content of 74% was used (as noted in Section 4.2 of this report). A general
rule of thumb for controlling shrinkage in concretes is to replace the part of the system
that shrinks (i.e., paste) with more of what doesn’t shrink (i.e., coarse aggregate).
These mixtures also have a relatively high w/c, in which large capillary pores form.
Since stress buildup is related to the size of pores being emptied, a much larger difference
would be noticed between the plain and IC mixtures if a lower w/c were used. Therefore,
the reason for such low shrinkage in the standard mixture is due a high aggregate content
(which replaces paste content) and that the w/c is high, which accommodates shrinkage in
the system.
7.3.3.1 Preliminary Mixtures
The results of the preliminary mixtures from restrained shrinkage can be seen in the
following figures. Figures 7.7 (a) – (e) present the tensile stress buildup due to restrained
conditions in an isothermal environment. The data presented monitors the residual
tensile stress development for a period of 7 days, at which point the temperature is
dropped at a rate of 2°C/hour until a significant crack develops, or a temperature of -9°C
is reached (none of the mixtures evaluated reached a temperature of -9°C before
significant crack developed). Significant crack development refers to the peak in the data
in which stress rapidly changes to a highly negative value, attributed to crack propagation.
The increasing slope prior to cracking is often referred to as the reserve capacity of the

78
sample. The results presented are the tensile stress developments that have been
corrected to the time of set, assumed to be a constant value for all presented mixture. A
time of 6 ½ hours was chosen based on a derivative analysis from autogenous shrinkage
(Section 7.3.2).
Figure 7.7 (a) presents the results of the standard Class H mixture, in which stress
development occurred for the first 7 days, at which time the temperature dropped. The
“flatter” curves for the IC mixtures, as seen in Figures 7.7 (b), (c), (d), and (e), represent
less stress buildup/ shrinkage in the sample. A negative stress, or expansive force, is
noticed for approximately the first 4 days in Figure 7.6 (d) and up to the point of
temperature drop in Figure 7.7 (e). This is likely due to the phenomena of swelling, in
which water is pushing its way through the system, as was described in Section 7.3.2.
The take-away from these results is that a lower stress is developed for IC mixtures than
for mixtures not utilizing IC methods. This is more apparent in lower w/c mixtures
where smaller pore sizes are being emptied through chemical shrinkage and self-
desiccation, or in mixtures containing high paste contents.
7.3.3.2 Optimized Mixtures
The results of the optimized mixtures from restrained shrinkage can be seen in the
following figures. Figures 7.8 (a) – (d) present the tensile stress buildup due to restrained
conditions in an isothermal environment. The data presented monitors the residual

79
tensile stress development for a period of 7 days, at which point the temperature is
dropped at a rate of 2°C/hour until a significant crack develops, or a temperature of -9°C
is reached (none of the mixtures evaluated reached a temperature of -9°C before
significant crack developed). Significant crack development refers to the peak in the data
in which stress rapidly changes to a highly negative value, attributed to crack propagation.
The increasing slope prior to cracking is often referred to as the reserve capacity of the
sample. The results presented are the tensile stress developments that have been
corrected to the time of set, assumed to be a constant value for all presented mixture. A
time of 6 ½ hours was chosen based on a derivative analysis from autogenous shrinkage
(Section 7.3.2). Figures 7.8 (a) and 7.8 (b) represent the residual tensile stress buildup for
IC mixtures with additional LWA suppliers, Buildex and Utelite, respectively. Both
mixtures show similar results to that of Figure 5.6 (b), where the same mixture design is
used, however other LWA were substituted. Figures 7.8 (c) and (d) present the dual ring

F
Figure 7.7: RResults for thmixtures
he residual t1 – 5, are sh
80
tensile stresshown in figur
s developed res (a) – (e),
1 M
in the prelim, respectively
MPa = 145 psi
minary mixtuy.
ures,

re
h
n
p
ob
F
lo
esults for the
ave a signifi
otion that hi
ores are form
bserved from
urthermore,
ower residua
Figure 7.8:
e Class D mi
icant stress b
igh residual s
med, i.e., hig
m the standa
the Class D
al tensile stre
Results for mixtures 6
ixture. It can
buildup, as th
stresses are n
gh w/c mixtu
ard to IC Cla
D mixtures cr
ess, approxim
the residual 6 – 9, are sh
81
n be seen tha
he mixture h
not develope
ures. Conseq
ss D mixture
rack (or are r
mately 1-2 M
tensile streshown in figur
at the standa
has a 0.45 w/
ed in mixtur
quently, no n
e, as it relate
relieved of p
MPa lower.
ss developedres (a) – (d),
ard Class D m
/c. This agre
res where lar
notable diffe
es to restrain
positive stres
d in the optim, respectively
mixture does
ees with the
rge capillary
erences can b
ned shrinkag
ss formation)
mized mixtury.
s not
y
be
e.
) at a
res,

82
7.3.4 Drying Shrinkage
The results from ASTM C157 (2008), monitoring of length change in a drying condition,
are presented in this section. Once the initial measurements were recorded (24 hours
after water-cement contact), the samples were bag sealed and placed in a moist curing
chamber until an age of 28 days. After the curing period, and prior to exposure to drying,
length measurements were taken. This is what is referred to as the ‘zero time’ length
change in the following plots. The zero time length measurement captures the shrinkage
that has taken place without exposure to drying. With that being said, one should be
recognize that this test does not capture early age shrinkage (i.e., the first 24 hours). This
has been shown in the previous sections to be an important part in quantifying total
shrinkage of concrete.
The results shown are an average of three samples, where length change, ΔLx, is
calculated by Equation 7.1, in which CRD is the difference between the comparator
reading and reference bar at any age and G is the gage length (in this case G = 10in).
Δ (7.1)

T
cl
m
th
pr
tu
W
ex
sh
F
The drying sh
lear that all I
mixtures have
hroughout th
resent in the
urn, this will
While most m
xpansion thr
hrinkage and
Figure 7.9: P
hrinkage resu
IC mixtures
e less shrink
he exposure t
e matrix to ke
l help to min
mixtures show
roughout the
d restrained s
Preliminary cu
7.3.4.1
ults for the p
performed b
kage than the
to drying. T
eep the inter
nimize stress
w a shrinkag
e curing proc
shrinkage te
mixture dryiuring period
83
Preliminar
preliminary m
better that th
e standard m
This is due to
rnal RH leve
buildup wh
ge response t
cess. This is
est results.
ing shrinkagd, normalized
ry Mixtures
mixture can
he standard C
mixture after t
o the fact tha
el higher for
hen exposed
throughout c
s consistent w
ge results at 5d to gauge le
be seen in F
Class H mixt
the 28 day p
at additional
a longer per
to low RH e
curing, Mixt
with the auto
50% RH afteength.
Figure 7.9. I
ture. The IC
period as wel
moisture is
riod of time.
environment
ture 5 shows
ogenous
er 28 day se
It is
C
ll as
In
s.
s
aled

T
th
w
L
m
ut
F
The drying sh
he case with
when compar
LWA supplie
mixture. Add
tilized.
Figure 7.10:
hrinkage resu
the prelimin
red to the res
ers were used
ditionally, th
Optimized cu
7.3.4.2
ults for the o
nary mixture
spective stan
d, both show
he Class D m
mixture dryiuring period
84
2 Optimized
optimized mi
e, all IC mixt
ndard Mixtur
w a decrease
mixture is als
ing shrinkagd, normalized
d Mixtures
ixtures can b
tures show b
re. Mixtures
in shrinkage
so beneficial
ge results at 5d to gauge le
be seen in Fi
benefits in dr
s 6 and 7, wh
e from stand
l when IC pr
50% RH afteength.
igure 7.10. A
rying shrink
here alternat
dard Class H
ractices are
er 28 day se
As is
kage
tive
aled

85
7.4 Summary and Conclusions
This chapter investigated the shrinkage properties of both standard and internally cured
Colorado DOT Class H and D mixtures. The shrinkage properties presented consist of
the chemical, autogenous, restrained, and drying shrinkage for each of the nine mixtures.
Results from this chapter can be summarized as follows:
The chemical shrinkage was found to 0.07 g/mL of cementitious material for the
mixture composition used in this study. Should any different cementitious
material be used, another chemical shrinkage test should be performed.
Internally cured mixtures prevent autogenous shrinkage and cause expansion (or
swelling) in a sealed system. This expansion will eventually relax out over time
and hydration of the cement subsides.
Shrinkage of the 0.42 mixture was on the order of 30 micro-strain for the standard
Class H mixture and the swelling 20 micro strain for the “recommended IC” (i.e.,
LWA used to replace the water lost to chemical shrinkage) mixtures.
Restrained shrinkage showed that IC concrete reduced the residual stress buildup
in the material, however this was not as apparent in these “higher” w/c mixtures
as it would be when comparing a lower w/c with the IC counterpart. For example
little difference was noted for the Class D mixture, in which a 0.45 w/c was used.
Internally cured mixtures show improved drying shrinkage performance, since
water is present in the matrix to continue hydration as the surface dries. However,
one should realize the shortcomings of performing only the drying test, as the test
does not account early age shrinkage.

86
CHAPTER 8. EVALUATION OF FLUID TRANSPORT PROPERTIES
8.1 Introduction
The objective of this study is to investigate the performance of internally cured, high
performance concrete for potential use by the Colorado DOT. In particular, this study
evaluates a series of internally cured high performance concrete mixtures, as noted in
Table 4.1, for the Colorado DOT that meet the specifications of a Class H and Class D
concrete. The use of internal curing in high performance concrete can increase the
resistance to early-age cracking and enhance durability (Bentz and Weiss, 2011).
This chapter presents the fluid transport properties of the nine mixtures. The transport
properties presented consist of porosity determination, water absorption, and ionic
species transport for each mixture. The test methods and casting procedures will be
discussed first, followed by the results and discussions presented in a systematic order, in
which the preliminary mixtures will be presented, followed by the optimized mixtures for
each test being discussed.
8.2 Mixing, Placing, and Curing Procedures
Materials were batched and mixed in accordance with the procedure presented in Section
4.3. For internal curing mixtures, the LWA would soak in the required mixing water
(including the water required to replace chemical shrinkage) for a 72 ± 4 hour period

87
prior to mixing. For transport property testing, water absorption and ionic transport,
samples for testing were allotted at least a 91-day curing period in a sealed environment.
8.2.1 Ionic Transport
The diffusion coefficients, tortuosity, and permeability for ionic species were measured
using STADIUM Lab software and a migration cell (SIMCO Technologies Inc., 2011).
The test method is a modified version of ASTM C1202 (2012d), where electrical current
passed that passes through a 4 in diameter by 2 in thick [100 mm by 50 mm] specimen
was monitored over a 14-day period. The samples used for this test were cut from a set
of 4 in diameter by 8 in long concrete cylinders that were sealed and placed in a chamber
at moist and 23 ± 2 °C for a minimum of 91 days.
After the samples were cut in accordance with the STADIUM user manual (SIMCO
Technologies Inc., 2011), the sides of the samples were sealed with an epoxy. They were
then vacuum saturated with a 0.3 M NaOH solution in replacement of water. A vacuum
condition was held at a pressure of 20 mm Hg at 60 ± 1 °C for 3 hours. Solution was
then added to the samples, while remaining in a vacuum state to de-aerate the NaOH
solution for an additional 1 hour. The vacuum was then turned off and the samples
remained in the NaOH solution for a minimum time of 16 hours. Once saturated, the
samples were mounted between a cell filled with 0.3 M NaOH solution (downstream) and
a cell filled with 0.5 M NaCL + 0.3 M NaOH solution (upstream). A constant DC
potential of 20V was maintained across the specimen for 14 days while the voltage,
current, and temperature were measured and recorded. Refer to the STADIUM Lab user

88
guide (SIMCO Technologies Inc., 2011) for an illustration of the SIMCO migration cells
used for this portion of the study.
In conjunction with the migration cell testing, the volume of permeable voids of the
samples was determined in accordance with ASTM C642 (2006), with the exception that
the boiling water method of saturating the samples was replaced with vacuum saturation.
Vacuum saturation was performed in the same manner as previously discussed in this
section, with the exception of water being used in place of the NaOH solution.
Also in conjunction with the migration cell testing was the drying test, as prescribed by
the STADIUM user manual (SIMCO Technologies Inc., 2011), for moisture transport
properties. For this test sets of three 10 ± 1mm and three 50 ± 2 mm thick specimens,
also with a 91 days curing time, were cut and epoxies along the sides. Per STADIUM
user manual (SIMCO Technologies Inc., 2011), these samples were placed in limewater
at least two weeks, until a constant mass had been obtained. They were removed from
the limewater, which point the initial and buoyant masses were obtained. The samples
were then placed in a 50 ± 1 %RH and 23 ± 1°C chamber for drying. The masses were
monitored and recorded daily for the first week, every other day for the second week, and
twice per week until a total of 30 days was reached.
The results from the migration cell, volume of permeable voids, and drying test were
used in the STADIUM Lab software to evaluate the ion diffusion coefficients, tortuosity,

89
and permeability of the samples. The values and reported and discussed in the results
section.
8.2.2 Water Absorption
Water absorption was determined in accordance with a modified version of ASTM
C1585 (2011d). Sets of 4 in diameter by 8 in tall [100 mm by 200mm], cylinders were
cast to study the absorption rate of each mixture. The cylinders were cast in two lifts,
being vibrated and rodded 25 times after each lift. After one day of curing in their molds,
the cylinders were demolded, bag sealed, and stored in a moist chamber at a temperature
of 23 ± 1 °C until testing, which occurred after 91 days. Upon completion of the curing
period 4 in diameter by 2 in thick [100 mm by 50 mm] samples were cut from the middle
6 in section of these samples using a concrete wet saw. Once cut, the sides of the
samples were sealed with epoxy. Samples for absorption testing were taken from
different cylinders to eliminate bias.
Castro et al. (2011) have shown that the conditioning method prescribed by ASTM
C1585 (2011d) can show large inconsistencies in the standardized absorption test.
Therefore, a way to maintain consistency from mixture to mixture was necessary. To do
this, the porosity of each mixture (determined in the previous section per ASTM C642)
was used to determine a desired mass at which approximately 50% of the capillary voids
would be filled with water.

90
The samples were then vacuum saturated by placing the samples in a vacuum condition at
a pressure of 20 mm Hg at 60 ± 1 °C for 3 hours. Water was then added to the samples,
while remaining in a vacuum state to de-aerate the water, for an addition 1 hour. The
vacuum was then turned off and the samples remained in the water for a minimum time
of 16 hours. A saturated surface dry mass for each sample was then obtained and a
desired mass at was obtained. The samples were then placed in a vacuum oven with a
pressure of 685 mm Hg at 60 ± 1 °C (the temperature is the maximum permissible
temperature to avoid damaging of the microstructure), being monitored daily until the
desired mass was reached. Once each sample obtained the desired mass for an estimated
50% filled capillary porosity, the samples were double-bag sealed for the same amount of
time they were in the vacuum oven to allow for moisture redistribution.
Prior to testing, the tops of the samples were sealed with plastic and the initial mass was
recorded. The samples were then placed on supports inside containers, which were filled
with water such that the water level was approximately 1/8 in (3 mm) above the bottom
of the sample. The mass of each sample was then taken at the prescribed intervals set
forth in ASTM C1585 (2011d), with the test ending after 8 days of absorption.
Upon completion of the absorption testing, the degree of saturation of each of these
samples was determined by first oven drying the samples until a mass equilibrium of ±
0.01% was reached. The samples were then vacuum saturated with water as previously
described. Using the initial conditioned mass, the oven dry mass, and the saturated mass,
the degree of saturation was calculated for each sample.

91
8.3 Results and Discussion
8.3.1 Ionic Transport
The following section presents results obtained through migration cell testing, including
the volume of permeable voids (per ASTM C642 (2006) using vacuum saturation), the
chloride diffusion coefficient, tortuosity, and permeability. The latter values are
calculated using STADIUM Lab from the results of the migration cell and drying testing.
The presented results are based on a simulation done by analysis of testing results along
with the mixture design, cementitious material composition, volume of permeable voids,
and sample geometry. It should be noted that the simulation is designed for standard
mixture, i.e. not for mixture using LWAs. Therefore, using a weighted average for the
specific gravity and combining the lightweight and normal-weight mixture design values
for density, a manipulation to the inputs for IC mixtures was made.
8.3.1.1 Preliminary Mixtures
The results from the preliminary mixtures ionic transport testing can be seen in Table 8.1.
Comparing the results shows a slight increase in porosity (about 10%) for the LWFA
mixtures, which can be attributed to the addition of porous particles. This is
demonstrated even more for the mixtures that introduce LWCA, in which the increase is
up to about 80%. All preliminary IC mixtures show a decreased diffusion and tortuosity
(which are directly proportional, as calculated by the software) by about 40% and 50%,
respectively. This is due to an increased in hydration of the cementitious material,
resulting in discontinuity of the pore structure. The permeability of mixtures 2 and 4

92
decreases while an increased permeability is seen for the others mixtures. While the
permeability change for mixture 4 is negligible (compared to other changes) a decrease of
about 25% is seen in mixture 2. The increase in permeability for mixture 3 and the
drastic increase for mixture 5 can attributed to the large amounts of big pores that are
present in the matrix.
Table 8.1: Preliminary mixture results for volume of porosity, chloride diffusion coefficients, tortuosity, and permeability determined through ASTM C624 (2006) and
STADIUM Lab testing.
ID: Description Porosity D Cl-
Tortuosity Permeability
(%) (e-11 m2/s) (e-22 m2) Mix 1: Standard Class H 14.7 1.98 0.0097 2.65 Mix 2: LWFA 1 x CS 16.4 1.15 0.0057 1.94 Mix 3: LWFA 2 x CS 16.5 0.99 0.0049 3.47 Mix 4: CLWA 1 x CS 18.5 1.16 0.0057 2.35 Mix 5: 100% CLWA Replacement 26.7 0.92 0.0045 21.47
8.3.1.2 Optimized Mixtures
The results from the optimized mixtures ionic transport testing can be seen in Table 8.2.
Comparing the results shows a slight increase in permeable voids (about 10%) for the
LWFA mixtures where two other suppliers were used (i.e., mixtures 6 and 7), which can
be attributed to the addition of porous particles. The change in porosity from the standard
Class D mixture to the Class D IC mixture is negligible. Mixtures 6 and 7 show about a
60% and 30% decrease in the diffusion coefficients and tortuosity from the standard
Class H mixture, respectively. The diffusion and tortuosity for the IC Class D mixture
1 m2 = 10.7 ft2

93
decreases by about 65%. The permeability for mixtures 6 and 7 decrease from the
standard Class H, however the IC Class D mixture increases in permeability.
Table 8.2: Optimized mixture results for volume of porosity, chloride diffusion coefficients, tortuosity, and permeability determined through ASTM C624 (2006) and
STADIUM Lab testing.
ID: Description Porosity D Cl-
Tortuosity Permeability
(%) (e-11 m2/s) (e-22 m2) Mix 6: IC Buildex 16.2 0.83 0.0041 2.19 Mix 7: IC Utelite 16.9 1.33 0.0065 2.52 Mix 8: Standard Class D 17.2 2.76 0.0258 3.46 Mix 9: IC Class D 17.4 0.99 0.0049 4.06
8.3.2 Water Absorption
The results of the ASTM C1585 (2011d) water absorption test and the associated change
in degree of saturation (DOS) for each mixture can be seen in Figure 8.2 through Figure
8.10. Plot (a) shows the calculated absorption values (per ASTM C1585) with respect to
the square root of time, in seconds. It should be noted that the calculation set forth by
ASTM C1585 does not determine the maximum depth at which water has penetrated in
the sample. The calculation is a mass based representation of the depth water would
reach if the concrete volume was space was filled entirely with water, i.e., volume of
voids is not a consideration in the calculation. Plot (b) shows the change in DOS with
respect to time, in days. The DOS is calculated here as the ratio of the current amount of
absolute absorbed water to the total possible amount of absorbed water. The initial and
secondary sorption values, final water penetration depth, and initial and final DOS for
each mixture are listed in Table 8.3 and Table 8.4. Note that the values listed in these
1 m2 = 10.7 ft2

94
tables are averages of the two samples tested. The advantage of normalizing the results
by DOS is the ability to determine whether the specimens reach the suggested critical
DOS of about 86%, beyond which freeze-thaw damage can initiate (Fagerlund, 1977; Li
et al., 2011).
8.3.2.1 Preliminary Mixtures
Comparing the preliminary mixtures yields very similar results for absorption rates of
internally cured mixtures to the standard mixtures. A slightly higher rate of initial
absorption is likely due to the interface action from empty lightweight aggregate particles.
The slightly higher secondary rate of absorption is also likely attributed to the lightweight
aggregate particles, as the dry desorbed aggregate is taking in more water than the
standard mixture. However, no significant differences are present in when comparing the
standard and IC mixtures, with the exception of the mixtures that use coarse LWA.
When the water absorption results are normalized to the change in DOS it can be seen
that none of the mixtures reach the critical DOS, with the maximum DOS of any of these
mixture being about 60% after 8 days of absorption testing.

F
F
Figure 8.1: (a
Figure 8.2: (
1 m
1 mm =
a) Water abs
(a) Water ab
mm = 0.04 in
= 0.04 in
orption and
bsorption and
95
(b) change i
d (b) change
in DOS for M
in DOS for
Mixture 1 –
Mixture 2 –
Standard Cla
– LWFA 1 X
ass H
X CS
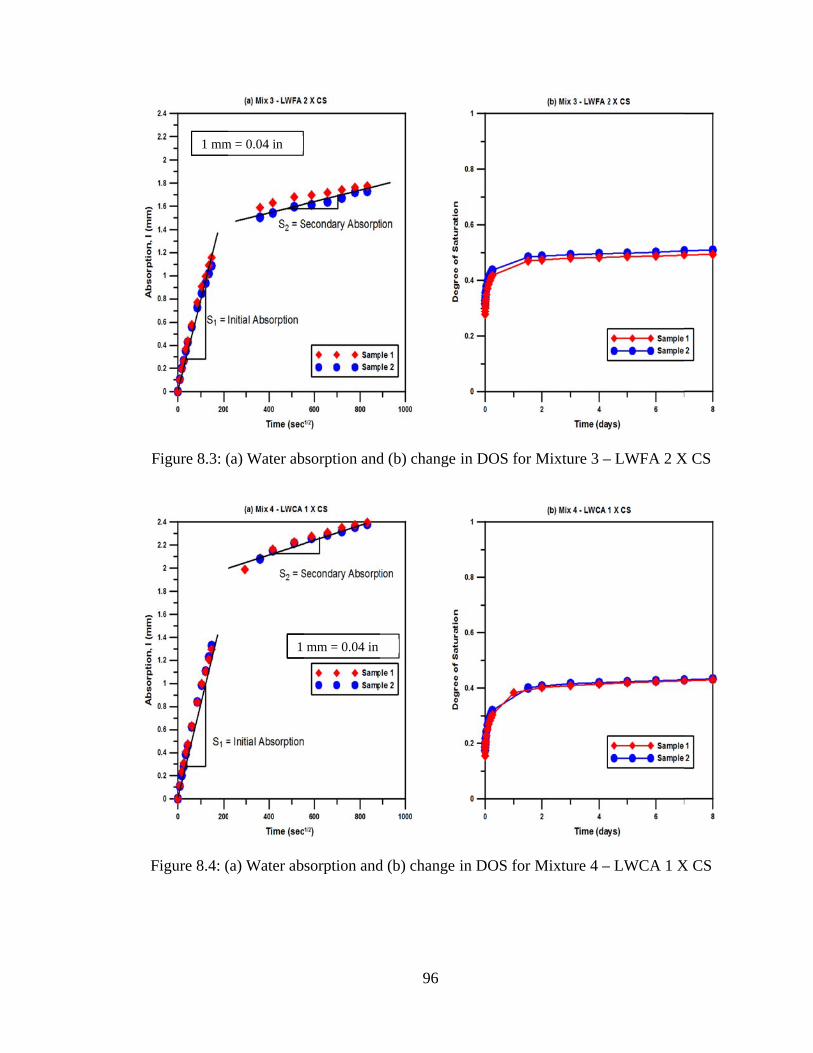
F
F
Figure 8.3: (
Figure 8.4: (
1 mm
(a) Water ab
(a) Water ab
m = 0.04 in
1
bsorption and
sorption and
mm = 0.04 in
96
d (b) change
d (b) change
in DOS for
in DOS for
Mixture 3 –
Mixture 4 –
– LWFA 2 X
– LWCA 1 X
X CS
X CS

Mix 1Mix 2Mix 3Mix 4Mix 5
T
Mixtu
1: Standard C2: LWFA 1 x3: LWFA 2 x4: CLWA 1 5: 100% CL
Figure 8.5:
Table 8.3: Tawater penet
ure ID
Class H x CS x CS x CS WA Replace
(a) Water ab
abulated valutration (I, mm
(m
6.6.7.8.
ement 8.
bsorption an
ues for the inm), and the i
S1 m/sec1/2)
.66E-03
.68E-03
.49E-03
.72E-03
.91E-03
97
d (b) changeReplaceme
nitial and seinitial and 8-
S2 (mm/sec1/2)
3.49E-044.02E-044.20E-046.57E-047.19E-04
e in DOS forent
condary abs-day DOSs o
) I8-da
(mm
1.41.521.752.392.13
r Mixture 5 –
sorption ratesof the prelim
ay m)
De
1 2 5 9 3
– 100% LW
s, 8-day depminary mixtu
egree of SatuInitial 36% 36% 30% 17% 36%
WCA
pth of ures
uration (%)8-day 53% 57% 50% 43% 59%
)

C
in
ab
T
ag
st
ab
la
sa
b
o
Comparing th
nternally cur
bsorption is
The slightly h
ggregate par
tandard mixt
bsorption ca
arge sorption
aturation. W
e seen that n
f these mixtu
Figure 8.6
he optimized
red mixtures
likely due to
higher secon
rticles, as the
ture. The hi
apacity of Ut
n rate than m
When the wat
none of the m
ure being 77
6: (a) Water a
1 mm
8.3.2.2
d mixtures yi
to the stand
o the interfa
ndary rate of
e dry desorb
gher sorptio
telite aggreg
mixture 8, wh
ter absorptio
mixtures each
7% after 8 da
absorption a
m = 0.04 in
98
2 Optimized
ields very sim
dard mixtures
ce action fro
f absorption i
ed aggregate
on rate for mi
ate (as show
hich may be
on results are
h the critical
ays of absorp
and (b) chang
d Mixtures
milar results
s. A slightly
om empty lig
is also likely
e is taking in
ixture 7 is li
wn in Section
due to the lo
e normalized
l DOS, with
ption testing
ge in DOS fo
s for absorpt
y higher rate
ghtweight ag
y attributed t
n more water
ikely due to t
n 3.3.2). Mix
ower initial d
d to the chan
the maximu
g.
for Mixture 6
tion rates of
e of initial
ggregate par
to the lightw
r than the
the larger
xture 9 has a
degree of
nge in DOS i
um DOS of a
6 – IC Builde
rticles.
weight
a
it can
any
ex

F
Figure 8.7
Figure 8.8: (a
1 mm =
1 m
7: (a) Water
a) Water abs
= 0.04 in
mm = 0.04 in
absorption a
orption and
99
and (b) chan
(b) change i
nge in DOS f
in DOS for M
for Mixture 7
Mixture 8 –
7 – IC Utelit
Standard Cla
te
ass D

Mix 6Mix 7Mix 8Mix 9
1 m
T
Mixtur
: IC Buildex: IC Utelite : Standard C: IC Class D
mm = 0.04 in
Figure 8.9
Table 8.4: Tawater pen
re ID
x
Class D D
1 mm
9: (a) Water a
abulated valuetration (I, m
S(mm/
6.447.945.908.74
m = 0.04 in
absorption a
ues for the inmm), and the
S1 /sec1/2) (m
4E-03 4E-03 0E-03 4E-03
100
and (b) chang
nitial and see initial and
S2 mm/sec1/2)
4.82E-04 4.32E-04 3.82E-04 4.33E-04
ge in DOS fo
condary abs8-day DOS
I8-day (m
1.691.821.281.93
for Mixture 9
sorption ratesof the optim
mm) DeI
9 2
9 – IC Class
s, 8-day depmized mixtur
egree of SatuInitial 27% 30% 58% 41%
D
pth of es
uration (%)8-day 47% 52% 77% 61%
)

101
8.4 Summary and Conclusions
This chapter investigated the transport properties of both standard and internally cured
Colorado DOT Class H and D mixtures. The transport properties presented consist of
ionic transport and water absorption for each of the nine mixtures. Results from this
chapter can be summarized as follows:
Internally cured concrete reduces the chloride diffusion coefficient and tortuosity
up to 67% compared to standard mixtures.
The reduced diffusion and tortuosity is attributed to increased hydration from
internal curing and is beneficial even though the volume of porosity is increases.
Permeability is decreased for Class H mixture for the “recommended IC” (i.e.,
LWA used to replace the water lost to chemical shrinkage).
Internally cured mixtures are comparable to standard mixtures as it relates to
water absorption. Higher values are attributed to exposed (and empty) LWA
particles that reabsorb water during this test.
All mixtures are below what is considered the ‘critical DOS’ after eight days of
absorption testing.

102
CHAPTER 9. SUMMARY AND RECOMMENDATIONS
9.1 Introduction
Internally cured concrete has been rapidly emerging over the last decade as an effective
way to improve the performance of concrete. IC holds promise for producing concrete
with an increased resistance to early-age cracking and enhanced durability (Bentz and
Weiss, 2011). The technique of IC has recently been studied and used in several field
applications. As of 2010, hundreds of thousands of cubic meters of concrete containing
pre-wetted lightweight aggregate (LWA) for the use of internal curing have been placed
throughout the United States (Bentz and Weiss, 2011).
Internal curing is a simple a way to effectively cure concrete. Proper internal curing
replaces water lost due to chemical shrinkage and supplies water that is necessary to
relieve stress buildup in self-desiccation; typically via pre-wetted LWAs.
The idea of internal curing was originally promoted to reduce autogenous shrinkage and
autogenous shrinkage cracking (Weber and Reinhardt, 1996; Bentz and Snyder, 1999;
Jensen and Hansen, 2001; Kovler and Jensen, 2005; Radlinska et al., 2007; RILEM, 2007;
Lopez et al., 2008). Autogenous shrinkage is a phenomenon caused by chemical
shrinkage, independent of drying. However, the benefits go well beyond the reduction of
autogenous shrinkage.

103
9.2 Summary of Experimental Results
Chapter 2 described the mixtures that were to be used in this study and introduced the
materials and material suppliers. Chapter 3 evaluated the material properties that were to
be used in the mixture designs. The absorption and desorption properties of LWAs were
presented, as well as methods for obtaining these. As a rule of thumb, an efficient LWA
is one that can desorb as least 85% of the absorbed water at a relative humidity of 94%,
per ASTM C1761 (2012). Obtaining the correct absorption and moisture contents in the
LWA particles are an essential part of creating quality IC mixtures. Two methods were
discussed, however it is the opinion of the authors that the centrifuge method (Miller et
al., 2013) is the most consistent method for obtaining moisture content. Chapter 4
presented the mixing techniques and mixture proportions that were used during this study.
Chapter 5 investigated the fresh and mechanical properties of mixtures used in this study.
Values for slump, air content via the pressure and volumetric method, and unit weight
were reported for the fresh properties. Internally cured mixtures do not have a significant
impact on the slump. While the volumetric and pressure method vary in results, this does
not prohibit the use of the pressure method. The pressure method is generally the
preferred method for field application and has been specified in states that use internal
curing. ASTM C231 (2010) specifies that this method “is not applicable to concrete
made with lightweight aggregates.” However, the recommended IC mixture (i.e., where
enough water is supplied by fine LWA to replace the water lost to chemical shrinkage)
only replaces a fraction of the normal-weight aggregate (about 20%), leaving the majority

104
of the volume is still occupied by normal-weight aggregate. For the recommended IC
mixtures the unit weight is not significantly altered, the most being mixture 6 with a
decrease by 8%. Mixture 2 and 7 only change by 1% and 3%, respectively.
Values for compressive strength and elastic modulus were reported at 28 and 56 days for
the mechanical properties. In compression, the IC mixtures performed just as well and in
some cases better (by about 10%) than the standard mixture and were all above the values
specified by Colorado DOT specification. The increase in compressive strength is
attributed to the increased hydration caused through internal curing. These findings are
consistent with work done by Golias (Golias et al., 2012). All IC mixtures showed a
reduction in the modulus of elasticity (about 10 – 20%), which is attributed to adding a
material that has reduced stiffness (i.e., LWA). This will actually benefit mixtures in
reducing shrinkage cracking, as the modulus at the interface of the aggregate and paste
are more similar and do not create a large restraint, which would consequently generate
large stresses.
Chapter 6 investigated the cyclic freezing and thawing behavior of the mixtures used in
this study. Specifically each mixtures resistance to scaling and rapid freeze-thaw action.
The findings provide an insight to the freezing and thawing durability of IC concretes.
These results of ASTM C666 (2003) show that properly air entrained, internally cured
concrete with a reasonable w/c (approximately 0.48 or less) have no issues in resisting
cyclic freeze-thaw action. However, “excessively” internally cured mixtures, i.e.,
mixtures that have more pre-wetted LWA than is required to replace water lost due to

105
chemical shrinkage for sealed concrete, perform poorly in freeze-thaw environments.
These mixtures, mixtures 3 and 5, show up to an 86% reduction in durability from the
standard Class H mixture with an average of a 37.5% reduction in durability between the
two mixtures. Scaling results showed that internally cured mixtures do not perform any
worse than the standard mixtures.
Chapter 7 investigated the shrinkage properties of the mixtures used in this study.
Specifically autogenous shrinkage, restrained shrinkage cracking, and free shrinkage in a
50% relative humidity (RH) drying condition. The chemical shrinkage should be
investigated if any different cementitious material composition is used. Internally cured
mixtures prevent autogenous shrinkage and cause expansion (or swelling) in a sealed
system. This expansion will eventually relax out over time and hydration of the cement
subsides. Restrained shrinkage showed that IC concrete reduced the residual stress
buildup in the material, however this was not as apparent in these “higher” w/c mixtures
as it would be when comparing a lower w/c with the IC counterpart. For example little
difference was noted for the Class D mixture, in which a 0.45 w/c was used. Internally
cured mixtures show improved drying shrinkage performance, since water is present in
the matrix to continue hydration as the surface dries. However, one should realize the
shortcomings of performing only the drying test, as the test does not account early age
shrinkage.
Chapter 8 investigated the fluid transport properties of the mixtures used in this study.
The transport properties presented consist of porosity determination, water absorption,

106
and ionic species transport for each mixture. Internally cured concrete reduces the
chloride diffusion coefficient and tortuosity up to 67% compared to standard mixtures,
which is attributed to increased hydration. Permeability is also decreased when the
recommended IC mixture is used. Sorption properties are comparable from
recommended IC mixtures (except for the case of the Class D mixture, which showed
improved sorption properties for IC mixture) and all mixtures were below the critical
degree of saturation for freezing and thawing after eight days of testing.
In summary, this study has demonstrated that benefits of properly internally cured
concrete include:
Similar or increased compressive strength
Decreased elastic modulus
Similar resistance to freeze-thaw action
Reduced early age stress formation
Reduced ion diffusion
Similar fluid absorption

107
REFERENCES
American Concrete Institute. (2013). ACI CT-13. ACI Concrete Terminology. ASTM Standard C39/C39M, 2012a, “Standard Test Method for Compressive Strength of
Cylindrical Concrete Specimens,” ASTM International, West Conshohocken, PA, 2012.
ASTM Standard C127, 2012, “Standard Test Method for Density, Relative Density
(Specific Gravity), and Absorption of Coarse Aggregate,” ASTM International, West Conshohocken, PA, 2012.
ASTM Standard C128, 2012, “Standard Test Method for Density, Relative Density
(Specific Gravity), and Absorption of Fine Aggregate,” ASTM International, West Conshohocken, PA, 2012.
ASTM Standard C136, 2006, “Standard Test Method for Sieve Analysis of Fine and
Coarse Aggregates,” ASTM International, West Conshohocken, PA, 2006. ASTM C143. 2004. “Standard Test Method for Slump of Hydraulic Cement Concrete.”
ASTM International, West Conshohocken, PA, 2004. ASTM Standard C138/C138M, 2013, “Standard Test Method for Density (Unit Weight),
Yield, and Air Content (Gravimetric) of Concrete,” ASTM International, West Conshohocken, PA, 2013.
ASTM Standard C157/C157M, 2008, “Standard Test Method for Length Change of
Hardened Hydraulic-Cement Mortar and Concrete,” ASTM International, West Conshohocken, PA, 2008.
ASTM Standard C173/C173M, 2010b, “Standard Test Method for Air Content of Freshly
Mixed Concrete by the Volumetric Method,” ASTM International, West Conshohocken, PA, 2010.
ASTM Standard C192/C192M, 2007, “Standard Practice for Making and Curing
Concrete Test Specimens in the Laboratory,” ASTM International, West Conshohocken, PA, 2007.

108
ASTM Standard C215, 2008, “Standard Test Method for Fundamental Transverse, Longitudinal, and Torsional Resonant Frequencies of Concrete Specimens,” ASTM International, West Conshohocken, PA, 2008.
ASTM Standard C231/C231M, 2010, “Standard Test Method for Air Content of Freshly
Mixed Concrete by the Pressure Method,” ASTM International, West Conshohocken, PA, 2010.
ASTM Standard C469, 2010, “Standard Test Method for Static Modulus of Elasticity and
Poisson's Ratio of Concrete in Compression,” ASTM International, West Conshohocken, PA, 2010.
ASTM Standard C642, 2006, “Standard Test Method for Density, Absorption, and Voids
in Hardened Concrete,” ASTM International, West Conshohocken, PA, 2006. ASTM Standard C666/C666M, 2003 (Reapproved 2008), “Standard Test Method for
Resistance of Concrete to Rapid Freezing and Thawing,” ASTM International, West Conshohocken, PA, 2008.
ASTM Standard C672/C672M, 2003, “Standard Test Method for Scaling Resistance of
Concrete Surfaces Exposed to Deicing Chemicals,” ASTM International, West Conshohocken, PA, 2003.
ASTM Standard C1202, 2012d, “Standard Test Method for Electrical Indication of
Concrete's Ability to Resist Chloride Ion Penetration,” ASTM International, West Conshohocken, PA, 2012.
ASTM Standard C1581/C1581M, 2009a, “Standard Test Method for Determining Age at
Cracking and Induced Tensile Stress Characteristics of Mortar and Concrete under Restrained Shrinkage,” ASTM International, West Conshohocken, PA, 2009.
ASTM Standard C1585, 2011d, “Standard Test Method for Measurement of Rate of
Absorption of Water by Hydraulic-Cement Concretes.” ASTM International, West Conshohocken, PA, 2011.
ASTM Standard C1608, 2012, “Standard Test Method for Chemical Shrinkage of
Hydraulic Cement Paste,” ASTM International, West Conshohocken, PA, 2012.

109
ASTM Standard C1698, 2009, “Standard Test Method for Autogenous Strain of Cement Paste and Mortar,” ASTM International, West Conshohocken, PA, 2009.
ASTM Standard C1761/C1761M, 2012, “Standard Specification for Lightweight
Aggregate for Internal Curing of Concrete,” ASTM International, West Conshohocken, PA, 2012.
Bentur, A., Igarashi, S. I., & Kovler, K. (2001). Prevention of autogenous shrinkage in
high-strength concrete by internal curing using wet lightweight aggregates. Cement and concrete research, 31(11), 1587-1591.
Bentz, D. (2002). Influence of Curing Conditions on Water Loss and Hydration in
Cement Pastes with and without Fly Ash Substitution, NISTIR 6886. U.S. Department of Commerce.
Bentz, D. (2009). Influence of internal curing using lightweight aggregates on interfacial
transition zone percolation and chloride ingress in mortars. Cement and concrete composites, 31(5), 285-289.
Bentz, D. (1995). A three-dimensional cement hydration and microstructure program: I.
Hydration rate, heat of hydration, and chemical shrinkage. Building and Fire Research Laboratory, National Institute of Technology.
Bentz, D., and Weiss, W. J., (2011) "Internal Curing: A 2010 State of the Art Review.”
NIST IR 7765 Bentz, D., and Snyder, K. (1999). Protected Paste Volume in Concrete: Extension to Internal
Curing using Saturated Lightweight Fine Aggregate. Cement and Concrete Research , 29 (11), 1863-1867.
Bentz, D., Koenders, E., Monnig, S., Reinhardt, H.-W., van Breugel, K., and Ye, G. (2007).
Materials Science-Based Models. In Internal Curing of Concrete (pp. 29-43). RILEM Publications S.A.R.L.
Bentz, D., Lura, P., and Roberts, J. (2005). Mixture Proportioning for Internal Curing.
Concrete International , 27 (2), 35-40. Bremner, T. W., and Ries, J. (2009). Stephen J. Hayde: Father of the Lightweight
Concrete Industry. Concrete international, 31(8), 35-38.

110
Bleszynski, R., Hooton, R. D., Thomas, M. D., & Rogers, C. A. (2002). Durability of ternary blend concrete with silica fume and blast-furnace slag: laboratory and outdoor exposure site studies. ACI Materials Journal, 99(5), 499-508.
Bloem, D. L. (1965). Concrete Strength Measurement—Cores vs. Cylinders. In ASTM
proceedings (Vol. 65). Castro, J., Bentz, D., & Weiss, J. (2011). Effect of sample conditioning on the water
absorption of concrete. Cement and Concrete Composites, 33(8), 805-813. Chicago
Castro, J., Spragg, R., and Weiss, W. J., (2011) "Internal Curing for W/C Systems
Between 0.30 and 0.45: Impact on Water Absorption and Electrical Conductivity," ASCE Journal of Civil Engineering Materials
Castro, J., Keiser, L., Golias, M., and Weiss, W. J., (2011) "Absorption and Desorption of
Fine Lightweight Aggregate for Applications to Internally Cured Concrete Mixtures" Cement and Concrete Composites, Vol. 33(10) 1001-1008.
Castro, J., De La Varga, I., and Weiss, W. J., (Accepted) "Using Isothermal Calorimetry
to Assess the Water Absorbed by LWA during Mixing", Journal of Materials in Civil Engineering
Colorado Department of Transportation, (2011a). “Structural Concrete” (Section 601) Colorado Department of Transportation, (2011b). “Revision of Section 601 Class H and
HT Bridge Deck Concrete” (Section 601) Di Bella, C., Villani, C., Hausheer, E., & Weiss, J. (2012). Chloride transport
measurements for a plain and internally cured concrete mixture. ACI Special Publication, 290.
Golias, M., Bentz, D. P., & Weiss, J. (2012). “Influence of exposure conditions on the
efficacy of internal curing.” Adv Civ Eng Mater (submitted). Fagerlund, G. (1977). The critical degree of saturation method of assessing the
freeze/thaw resistance of concrete. Materials and Structures, 10(4), 217-229. Chicago

111
Henkensiefken, R., Nantung, T., & Weiss, J. (2008, May). Reducing restrained shrinkage cracking in concrete: examining the behavior of self-curing concrete made using different volumes of saturated lightweight aggregate. In National concrete bridge conference, St. Louis, MO.
Henkensiefken, R., Bentz, D., Nantung, T., & Weiss, J. (2009). Volume change and
cracking in internally cured mixtures made with saturated lightweight aggregate under sealed and unsealed conditions. Cement and Concrete Composites, 31(7), 427-437.
Henkensiefken, R., Briatka, P., Bentz, D., Nantung, T., & Weiss, J. (2010). Plastic
shrinkage cracking in internally cured mixtures made with pre-wetted lightweight aggregate. Concrete international, 32(2), 49-54.
Jensen, O.M., Hansen, P.F. (1995). "Dilatometer for Measuring Autogenous Deformation
in Hardening Portland Cement Paste" Materials and structures, Vol. 28, pp 406-409.
Jensen, O., & Hansen, P. (2001). Water-Entrained Cement-Based Materials: I. Principle
and Theoretical Background. Cement and Concrete Research , 31 (4), 647-654. Jensen, O. M., & Hansen, P. F. (2002). Water-entrained cement-based materials: II.
Experimental observations. Cement and Concrete Research, 32(6), 973-978. Kovler, K., & Jensen, O. M. (2005). Novel techniques for concrete curing. Concrete
International, 27(9), 39-42. Klieger, P. (1957). Early High Strength Concrete for Prestressing, Proceedings World
Conference on Prestressed Concrete, San Francisco, CA, A5-1 to A5-14. Li, W., Pour-Ghaz, M., Castro, J., & Weiss, J. (2011). Water absorption and critical
degree of saturation relating to freeze-thaw damage in concrete pavement joints. Journal of Materials in Civil Engineering, 24(3), 299-307.
Lopez, M., Kahn, L., & Kurtis, K. (2008). Effect of Internally Stored Water on Creep of
High Performance Concrete. ACI Materials Journal , 105 (3), 265-273. Miller, A.E., Barrett, T. J, Zander, A., & Weiss, W.J. (2013). Using a Centrifuge to
Determine the Moisture Properties of Lightweight Aggregate for Use in Internal Curing. (submitted)

112
Ministry of Transportation of Ontario Standard LS-412. (2000). Method of Test for
Scaling Resistance of Concrete Surfaces Exposed to Deicing Chemicals. Mohr, B., Premenko, L., Nanko, H., & Kurtis, K. (2005). Examination of Wood-Derived
Powders and Fibers for Internal Curing of Cement-Based Materials. In B. Persson, D. Bentz, & L.-O. Nilsson (Ed.), Proceedings of the 4th International Seminar: Self-Desiccation and Its Importance in Concrete Technology, (pp. 229-244). Gaithersburg.
Peled, A., Castro, J., & Weiss, J. (2010). Atomic force microscopy examinations of
mortar made by using water-filled lightweight aggregate. Transportation Research Record: Journal of the Transportation Research Board, 2141(1), 92-101.
Philleo, R. E. (1991). Concrete science and reality. Materials science of concrete II, 1-8. Powers, T. C. (1945, January). A working hypothesis for further studies of frost
resistance of concrete. In ACI journal Proceedings (Vol. 41, No. 1). ACI. Radlinska, A., Pease, B., & Weiss, J. (2007). A preliminary numerical investigation on
the influence of material variability in the early-age cracking behavior of restrained concrete. Materials and structures, 40(4), 375-386.
Radlinska, A., Rajabipour, F., Bucher, B., Henkensiefken, R., Sant, G., & Weiss, W.
(2008). Shrinkage Mitigation Strategies in Cementitious Systems: A Closer Look at Sealed and Unsealed Behavior. Transportation Research Record , 2070, 59-67.
Raoufi, K., Schlitter, J., Bentz, D., & Weiss, J. (2011). Parametric assessment of stress
development and cracking in internally cured restrained mortars experiencing autogenous deformations and thermal loading. Advances in Civil Engineering, 2011.
RILEM. (2007). Internal Curing of Concrete. (K. Kovler, & O. Jensen, Eds.) Paris:
RILEM Publications S.A.R.L. Sant, G., Dehadrai, M., Bentz, D., Lura, P., Ferraris, C. F., Bullard, J. W., & Weiss, J.
(2009). Detecting the fluid-to-solid transition in cement pastes. Concr Int, 31(6), 53-58.

113
Schindler, Anton K., Grygar, Jiri G., and Weiss, W. Jason /Sponsored by ACI Committees 231, 213, & 130. (2012). SP-290: The Economics, Performance and Sustainability of Internally Cured Concrete CD-ROM. ACI Special Publication, 290.
Schlitter, J. L., Barrett, T., & Weiss, J. (2010). Restrained shrinkage behavior due to
combined autogenous and thermal effects in mortars containing super absorbent polymer (SAP). In O. M. Jensen, M. T. Hasholt, & S. Laustsen (Eds.), International RILEM Conference on Use of Superabsorbent Polymers and Other New Additives in Concrete (pp. 233-242). RILEM Publications SARL.e
Schlitter, J. L., Bentz, D. P., & Weiss, J. (2010). Quantifying the residual stress
development and reserve strength in restrained internally cured concrete. Submitted to ACI Materials Journal.
Schlitter, J., Henkensiefken, R., Castro, J., Raoufi, K., Weiss, J., & Nantung, T. (2010).
Development of internally cured concrete for increased service life. SIMCO Technologies Inc. (2011). STADIUM Lab User Guide V 3.0. Tanesi, J., and Meininger, R. (2007). Freeze-Thaw Resistance of Concrete with marginal
air content. Transportation Research Record: Journal of the Transportation Research Board, 2020(1), 61-66.
Weber, S., & Reinhardt, H. W. (1996). A blend of aggregates to support curing of
concrete. In Proceedings of International Symposium on Structural Lightweight Concrete, Edited by I. Holand, TA Hammer and F. Fluge, Sandefjord, Norway (pp. 662-671).
Weiss, W., Yang, W., & Shah, S. (1999). Factors Influencing Durability and Early-Age
Cracking in High Strength Concrete Structures. SP-189-22 High Performance Concrete: Research to Practice (pp. 387-409). Farmington Hills: American Concrete Institute.