
INTERNAL AND EXTERNAL fACTORS THAT … · DETERMINED THE CHANNELS Of INNOvATION DIffUSION IN...
16
90 ISSN 1392-1258. EKONOMIKA 2009 88 INTERNAL AND EXTERNAL FACTORS THAT DETERMINED THE CHANNELS OF INNOVATION DIFFUSION IN LITHUANIA Gintaras Binkauskas Doctoral Student Department of Management Faculty of Economics Vilnius University Universiteto 3, LT-01513, Vilnius, Lithuania Phone: +370 5 268 7020 E-mail: [email protected] Abstract. The prevailing opinion in Lithuania is that the country‘s economic growth was determi- ned by the inflow of foreign direct investments (FDI). Their influence on the Lithuanian economy remains unquestionable, however, there is a tendency to overestimate their impact, while other factors are under-estimated or ignored completely when conclusions on their influence on the country‘s economy are drawn. Based on the data of the Department of Statistics of Lithuania, Eu- rostat, other agencies and the analysis of the research of Lithuanian and foreign academics on FDI, and the impact of the innovations on the country‘s economy, the given study presents the analysis of the three main channels for the technological and innovation diffusion, which have exercised a decisive influence on the economic development in Lithuania over the last decade. They are fore- ign direct investments, international trade, and the country‘s knowledge capital. These diffusion channels were considerably important in the transition period, however, the creation of original knowledge and innovations, or the creative application of the technology created in other coun- tries and application of the knowledge gained abroad was utilised least. In Lithuania,, the creati- on and adoption of extended modifying innovations and technologies was dominant in terms of innovation modes, while the strategic innovations were created by only 1 percent of Lithuanian enterprises 1 . A comparative analysis of surveys, statistical data, and academic studies was conduc- ted and lead to the conclusion that the main technology and innovation diffusion channel, as well as the main driving force behind Lithuania‘s economy during the transitional period of 1996–2007 was neithert FDI nor the scientific potential of the country, but rather the international trade. In addition, the data suggests that the country‘s scientific potential was ill-prepared for the changes brought on by globalisation and had a very weak impact on the growth of the Lithuanian economy and the economy‘s technological and innovational reorientation, which led to the enterprises sear- ching for other possible sources of innovation. The model for the creation of innovation eacompas- sing state institutions, the science community and enterprises was not functional during the said period in Lithuania. Keywords: knowledge spillovers, innovation, R&D, FDI 1 Innovation Scoreboard 2005; http:/trendchart.cordis.lu/scoreboards/scoreboard2005/Lithuania .cfm
Transcript of INTERNAL AND EXTERNAL fACTORS THAT … · DETERMINED THE CHANNELS Of INNOvATION DIffUSION IN...

90
ISSN 1392-1258.EKONOMIKa 2009 88
INTERNAL AND EXTERNAL fACTORS THAT DETERMINED THE CHANNELS Of INNOvATION DIffUSION IN LITHUANIA
Gintaras Binkauskas Doctoral Student Department of Management Faculty of Economics Vilnius UniversityUniversiteto 3, LT-01513, Vilnius, LithuaniaPhone: +370 5 268 7020E-mail: [email protected]
Abstract. The prevailing opinion in Lithuania is that the country‘s economic growth was determi-ned by the inflow of foreign direct investments (FDI). Their influence on the Lithuanian economy remains unquestionable, however, there is a tendency to overestimate their impact, while other factors are under-estimated or ignored completely when conclusions on their influence on the country‘s economy are drawn. Based on the data of the Department of Statistics of Lithuania, Eu-rostat, other agencies and the analysis of the research of Lithuanian and foreign academics on FDI, and the impact of the innovations on the country‘s economy, the given study presents the analysis of the three main channels for the technological and innovation diffusion, which have exercised a decisive influence on the economic development in Lithuania over the last decade. They are fore-ign direct investments, international trade, and the country‘s knowledge capital. These diffusion channels were considerably important in the transition period, however, the creation of original knowledge and innovations, or the creative application of the technology created in other coun-tries and application of the knowledge gained abroad was utilised least. In Lithuania,, the creati-on and adoption of extended modifying innovations and technologies was dominant in terms of innovation modes, while the strategic innovations were created by only 1 percent of Lithuanian enterprises1. A comparative analysis of surveys, statistical data, and academic studies was conduc-ted and lead to the conclusion that the main technology and innovation diffusion channel, as well as the main driving force behind Lithuania‘s economy during the transitional period of 1996–2007 was neithert FDI nor the scientific potential of the country, but rather the international trade. In addition, the data suggests that the country‘s scientific potential was ill-prepared for the changes brought on by globalisation and had a very weak impact on the growth of the Lithuanian economy and the economy‘s technological and innovational reorientation, which led to the enterprises sear-ching for other possible sources of innovation. The model for the creation of innovation eacompas-sing state institutions, the science community and enterprises was not functional during the said period in Lithuania.
Keywords: knowledge spillovers, innovation, R&D, FDI
1InnovationScoreboard2005;http:/trendchart.cordis.lu/scoreboards/scoreboard2005/Lithuania.cfm

91
INTRODUCTION
Countries that aspire to secure a high po-sition on the global competitiveness scale cannotrelyonlyonthelargefinancialandlabour force resources. In the short andlong term development programs of vari-ous countries, as well as in the state eco-nomic cohesion strategies, the importance of scientific research and technology de-velopment (R&D) is attractingmore andmore attention. It should be noted thatknowledge creation and spillovers, as well as the institutional flexibility of marketregulation, will be the main condition that will determine the economic future of each country(EC,2006).Enterpriseinnovationstrategies change as globalisation deepens due to technological developments. Thegeographic distribution of the research has also changed. Research centres not onlydevelop innovations on the international scale, they also present their innovations to the global market by licensing their findingsorsellingtechnologiestoforeignbuyers.Aglobalmarketforthetechnologyandinnovationisbeingformed.Inthema-jority of countries, as much as 90 percent of their economic growth is brought about by the technology that has been sourced fromabroad(Keller,2004).
Lackofsubstantialfinancialresourcesandanoverlyexcessivelabourforcemeantthat lithuania‘s economy faced the chal-lenges of the globalisation somewhat un-prepared.Emigrationofthepresentlabourforce, and the reduction and withdrawal of foreign direct investments over the last two years has no benefited the competi-tivenessofLithuania‘seconomy.Howev-er, technology, innovation, and knowledge can help to turn the country‘s economy
around.Whatisimportant,istoascertainthecapabilityofLithuania‘sscientificpo-tential to satisfy the commercial demands, andfindoutwhetherbusinessispreparedto cooperatewith the country‘s scientificinstitutions, when it has the alternative of acquiring and adapting the already func-tional technology and innovation from abroad.
Should energy and resources be di-rected towards the technology adaptation, and at the same time urge the goverment to support and encourage the import of technology, while setting less ambitious goals for the state scientific institutionsand universities? Or should the creation of the new, strategically important innovation and technology aimed at the development of the country‘s economy be the focus, channelling the appropriate funding and attentiontothosefields,whiledirectingin-centive policies towards the strengthening ofLithuania‘sscietificpotential?Perhapsthe middle road should be taken – sup-porting strategic innovation in certain “ground-breaking”fields,atthesametimenot ignoring the merits of innovation that canbeadaptedandassimilated.Whateverpath is taken, a particular diffusion channel will be highlighted, to a lesser or greater degree – be it foreign direct investments, or international trade, or direct contact be-tween the country’s business and science sectors in gaining patents or knowledge, in addition to the possible discovery of new diffusion channels for the technology and innovation. Although it may appearthat the international economic integra-tion itself boosts the spread of technology, this spread is not necessarily inevitable or automatic.A countrymust contribute in-

92
vestments intothe innovation in any case (Keller,2004).
International trade
It is common knowledge that international tradehadamassiveinfluenceonthemanu-facture of commodities in the country and its level of technological development.Coe, Helpman and Hoffmaister (1997) conducted research where they analysed the productivity levels of the developing countries depending on the scale of for-eignR&Dcapitalreceived, the importofmachinery and equipment from economi-cally developed countries, and the level of education of the country‘s labour force.BasedondatafromOECDcountries,theyfound that for small countries, innova-tion and technology gained from abroad is more important than local technology at a ratioof3:2,comparedtolargercountries,wherethisratiowas1:4(Lithuaniacanbegrouped with the smaller countries, there-by showing the importance of innovation andtechnologyfromabroad).Intheirap-praisal of international trade, Coe, Help-manandHoffmaisteridentifieditsseveralmain benefits. Firstly, the acquisition ofcapital and intermediate goods improves and strengthens the productivity of local potential. Secondly – international tradeopens up the channels of communication, which stimulate education without borders in seeking to improve manufacturing meth-ods, product design, marketing conditions, and organisationmethods. Thirdly, inter-national contact empowers the countries to
copy technology from abroad, adapting it for theirownneeds.Fourth, internationaltrade can boost a country‘s productivity by contributing to the development of a new technology or the imitation of the foreign technology, while at the same time indi-rectly boosting the level of productivity throughoutthecountry.
International trade as a technology dif-fusion channel was viewed with consider-able reserve due to its geographical restric-tions, however over the last decades, with the such advantages as cheaper transporta-tion costs, mass-scale freightage, and well-organised logistics brought about by the globalisation, those geographical restric-tionshavebeenminimized.Withitsexcel-lent geographical location near the devel-oped North and West European countries, as well as being situated at the crossroads of the russian and Eu routes for interna-tional trade, having a sea port and a com-prehensive automobile and rail infrastruc-ture lithuania potentially had and still has verygoodopportunitiestoutilizetheben-efits of international trade, as illustratedby the analysis of cooperation partners of lithuanian innovative enterprises (table 1), which shows that suppliers, clients and consumers are the most important part-ners for innovative enterprises. It shouldbe noted, that cooperation partners from foreign countries in 2002–2004 accounted for42.9%ofthetotalnumberofpartners,whilein2004–2006,thisvaluehadrisento46.3%(LSD,2008).
93
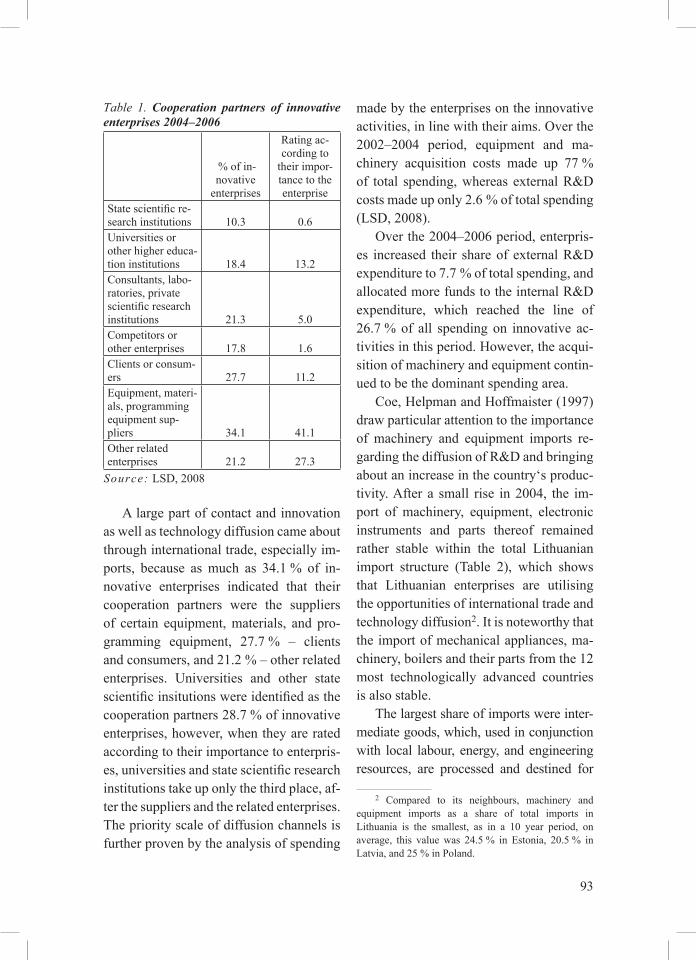
Table 1. Cooperation partners of innovative enterprises 2004–2006
%ofin-novative
enterprises
rating ac-cording to
their impor-tance to the enterprise
Statescientificre-search institutions 10.3 0.6universities or other higher educa-tion institutions 18.4 13.2Consultants, labo-ratories, private scientificresearchinstitutions 21.3 5.0Competitors or other enterprises 17.8 1.6Clients or consum-ers 27.7 11.2Equipment, materi-als, programming equipment sup-pliers 34.1 41.1Other related enterprises 21.2 27.3
Source: LSD,2008
a large part of contact and innovation as well as technology diffusion came about through international trade, especially im-ports, because asmuch as 34.1% of in-novative enterprises indicated that their cooperation partners were the suppliers of certain equipment, materials, and pro-gramming equipment, 27.7% – clientsandconsumers,and21.2%–otherrelatedenterprises. Universities and other statescientificinsitutionswereidentifiedasthecooperationpartners28.7%ofinnovativeenterprises, however, when they are rated according to their importance to enterpris-es,universitiesandstatescientificresearchinstitutions take up only the third place, af-terthesuppliersandtherelatedenterprises.the priority scale of diffusion channels is further proven by the analysis of spending
made by the enterprises on the innovative activities,inlinewiththeiraims.Overthe2002–2004 period, equipment and ma-chinery acquisition costs made up 77%of total spending,whereas externalR&Dcostsmadeuponly2.6%oftotalspending(LSD,2008).
Overthe2004–2006period,enterpris-es increased their shareof externalR&Dexpenditureto7.7%oftotalspending,andallocatedmorefundstotheinternalR&Dexpenditure, which reached the line of26.7%of all spendingon innovative ac-tivitiesinthisperiod.However,theacqui-sition of machinery and equipment contin-uedtobethedominantspendingarea.
Coe, Helpman and Hoffmaister (1997) draw particular attention to the importance of machinery and equipment imports re-gardingthediffusionofR&Dandbringingabout an increase in the country‘s produc-tivity.After a small rise in2004, the im-port of machinery, equipment, electronic instruments and parts thereof remained rather stable within the total lithuanian import structure (table 2), which shows that lithuanian enterprises are utilising the opportunities of international trade and technology diffusion2.Itisnoteworthythatthe import of mechanical appliances, ma-chinery, boilers and their parts from the 12 most technologically advanced countries isalsostable.
the largest share of imports were inter-mediate goods, which, used in conjunction with local labour, energy, and engineering resources, are processed and destined for
2 Compared to its neighbours, machinery and equipment imports as a share of total imports in lithuania is the smallest, as in a 10 year period, on average, this value was 24.5% in Estonia, 20.5% inLatvia,and25%inPoland.

94
furtherexport.Theexportfactorataninno-vation adoption level, and especially during the transition period in lithuania, also needs to be considered and is no less important, especiallywhen27.7%ofinnovativeenter-prisesidentifiedtheclientsandconsumersastheircooperationpartners(LSD,2008).
the trend of the importance of consum-ersandclientsisalsoconfirmedinresearchsurveys of lithuanian business enterprises byAdekolaetal.(2008),whichshowedthatthe greatest influence on the implementa-tion of innovation in businesses came from theclients(70%),followedbycompetitors(46%),andsuppliers(14%).
Sectors of the economy that have adapted imported technological equipment ormodifiedtheexistingone,andwhohaveused local labour, energy, and engineer-ing resources to process the intermediate goodsandsuccessfullyexportedthoseendproducts remain the export leaders. Thechemical materials and products industry exported 78.4% of its total production,
77%– the textilesmanufacturing sector,76.9% – the clothing production sector,and78.3%–theradioandTVequipmentsector(DnBNORDbank,2008).Howev-er, the indicator showing the level of the strategic innovation and technology diffu-sion,i.e.thetradeaccountbalanceofhighleveltechnology,wasminus595mln.EURamong lithuanian businesses in 2004 (Eu-rostat, 2006). Like its neighbours Latviaand Poland, in lithuania, the share of high leveltechnologyexportsin2004wasonly3% of total exports, and these were thelowestvaluesintheEuropeanUnion.
Foreign direct investments
as indicated by innovative enterprise survey data, knowledge and innovation gained from the related enterprises, most likely from foreign parent companies or corporations, was rated second in impor-tance.Therefore,we can assume that thesecond most important factor for technol-ogy and innovation diffusion are foreign
Table 2. Imports of machinery, mechanical appliances, electrical equipment and partsyear 1998 1999 2000 2001 2002 2003 2004 2005 2006 2007
Machinery, mechanical appliance, electrical equip-mentimports(mln.Lt*) 4,265 3,560 3,418 4,251 4,939 5,638 6,537 7,737 9,344 10,985Percentage of total imports (%) 18.4 18.4 15.7 16.7 17.3 18.6 19.0 17.9 17.6 17.9Mechanical appliance, machinery, boilers and parts imports (not including electrical equipment) from 12 developedcountries**(mln.Lt) 1,693 1,474 1,280 1,579 1,683 2,044 2,503 3,159 3,768 4,079Percentage of total imports (%) 7.9 7.9 6.1 6.5 6.1 6.9 7.3 7.3 7.1 6.6* fixed currency rate: 1998-2001: LTL/USD= 4.0;, 2002-2009: LTL/EUR= 3.4528** USA, Denmark, Germany, Sweden, Finland, the UK, Italy, Japan, Canada, Spain, the Netherlands, France Source: LSD,1998-2007.

95
direct investments (FDI). Over the lastdecade, changes to FDI streams acrossthewholeworldareareflectionofglobalfluctuations in economic activity. East-ern Europe, including the Baltic States,occupies a relatively high position in the investment confidence index calculations(A.T.Kearney Inc., 2006). Irrespectiveof the growing costs and greater regula-tion that came with the Eu membership, the new Eu member states became much more attractive to global companies due to theirgrowingproductivityandlowertaxes(A.T.KearneyInc.,2006).EasternEuropewas being seen as a promising region also forthefavourableR&Dinvestmentoppor-tunities it offered, due to lower costs and its strong human and academic resources and engineeringcapabilities.Acertainshareofinvestments (especially when the decision hinged on costs) were directed to the new Eu member states, and did not go to China or India only because the new Eu member
states already had an existing social andeconomic infrastructure and investors did notneedtospendextrafundsonitsestab-lishment(Kalotay,2006).TheWorldBank(2006) found that economicgrowth ratesof the country depended not so much on the investments, as on the growth in pro-ductivity, which was achieved with the inflow of investments. In Lithuania, FDIas a share of GDP grew from 4.3% in1996 to29.4%in2007,and theFDIan-nual growth percentage (table 3) did not affectthegrowthofthecountry‘sGDPtothesameorevensimilarextent.SincenotallFDIcanbeidentifiedasthosethatboosta country‘s labour productivity and bring innovation and technology into a country, this can be particularly true of at the en-terprises that received investments or were privatised by the foreign capital in order tomakeuseof theexistingtechnology,acheap labour force, and relatively cheap energy resources, or to oust a potential
Table 3. Dynamics of foreign direct investment in Lithuania in 1996–2007 1996 1997 1998 1999 2000 2001 2002 2003 2004 2005 2006 2007
FDImln.Lt* 1,406 2,801 4,163 6,501 8,252 9,337 10,662 13,184 13,699 16,193 23,896 28,925FDIpercapita, lt 390 784 1,173 1,845 2,358 2,682 3,073 3,817 3,987 4,727 7,022 8,545FDIcompared to the previous year,% 99.2 48.6 56.2 26.9 13.2 14.2 23.7 3.9 18.2 47.6 21.0FDIas%ofGDP 4.30 7.00 9.31 14.89 18.07 19.22 20.52 23.21 21.89 22.74 29.14 29.47GDP,mln.lt 32,740 39,998 44,699 43,667 45,674 48,585 51,971 56,804 62,587 71,200 81,991 98,138GDPcompared to the previous year,% 22.2 11.8 –2.3 4.6 6.4 7.0 9.3 10.2 13.8 15.2 19.7*atthestartoftheyear, Source: LSD,2007

96
competitor (in lithuania, this refers to the sugar,tobaccoandbrewingsectors).
K.Kalotay(2006)conductedananaly-sisofFDIinthenewEUmemberstates,which showed that the majority of the in-vestment into the new Eu member states that was made by the international compa-niesaimedattheexpansionoftheirmarketshare, increase of the sales in new markets, and making use of lower labour, energy, and public utility costs, allowing a larger andmorerapidprofit.Thepursuitofstra-tegic and long term goals in the new Eu member states is a new phenomenon that was largely focused on It investments and R&DonlyintheCzechRepublic,Hunga-ry,andPoland.
Proceeding from her own surveys of 50 Lithuanian companies, M.Runiewicz(2004)highlighted inparticular theR&Dknowledge gained from parent companies ofenterprisesrunbytheforeigncapital.Inher opinion, this helped those enterprises to stengthen their export potential by theincreasesintheirR&Dinvestment.
analysis of the investments into the in-dustry sectors shows that foreign investors select low and mid-level technology sec-tors of the economy, and this fails to cre-ate significantpositive structural changesin a country‘s economy. We may agreewith the claim, that in terms of increasing a country‘s competitiveness, it is not the same whether specific “know how” andtraditions are invested into one or another sector of the economy by investors that occupy a higher position in international markets, or accordingly, whether they are subjectsmerely seeking rapid profit gain(Jucevičius, 2006). In 2000, the distribu-tion of investments in lithuania according
tothesectorsoftheeconomy(LSD,2001)showed that the leader in attracting FDIwas the manufacturing sector – drawing 28.8%ofallFDI,closelyfollowedbythewholesale and retail trade (22.7%),withthe post and telecommunications sector in the thirdplace (16.9%),and the fourth–financial intermediation (16.2%).Withinthe manufacturing sector, the manufacture of food products, beverages and tobacco attracted most investments – as much as 40%, followed by the textile manufac-ture – drawing 13%. Investment intomachinery, equipment, furniture, medical, optical and other instruments amounted to 4.6%ofallFDI.Asomewhatdifferentsit-uation unfoldswhen the 2006–2007 datais examined since the investments intothe oil refinery produced a considerableimpactonthestatisticaldata.Manufactur-ing remained among the most attractive sectorsoftheeconomywith36.3%ofallFDI, followed by the financial interme-diationwith17.18%;wholesaletradewasthethirdwith11.45%,andpostandtele-communications – 10.87%.FDI in 2006increased significantly in already profit-able market sectors as well as those that promised a rapid return: in construction,FDI annual growth was 53.1%; in realestateandrentingthegrowthwas41.3%;and in timber and wood product manufac-ture – 46.5%.Growth rates in 2007 hadslowed down slightly due to the onset of the global economic stagnation, however the inertia of the construction (annual growth – 15.58%), financial intermedia-tion(29.15%),andrealestateandrenting(28.12%)sectorsmeantthattheirgrowthwasstrong.Thesesectorsoftheeconomydonotexhibitgreattechnologicalorinno-

97
vational prospects, which repeatedly leads totheconclusionthatalargeshareofFDIcameto“claimtheprofits”fromtheprom-ising and growing sectors. Investmentsinto the machinery and equipment manu-facture, and the manufacture of furniture, medical and other instruments at the end of 2007 made up only 4.7% of all FDIinvested intoLithuania‘seconomy(LSD,2008).
the main potential difference of lithu-anian enterprises that attracted foreign investment prior to 2006 was low costs(Kalotay, 2006; Urbonavičius, Brock,2008),while incoming FDI usuallywenttowards the low and mid-level technology sectors of the economy where adaptation and, to a certain degree, the creation of the extendedmodifyinginnovationprevailed.this means that technology created else-where is being transposed into lithuanian enterprises, and in this way lithuania can avoid the fate of being g completely left be-hindinthewidermarket.Investmentinthehigher level technology did increase (es-pecially the percentage of the manufacture of the medical and precision instruments, theannualgrowthwhereof reached22%in2006),however,duetotheunsuccessfulactivitiesof“Ekranas”(amanufacturerofcolour tV picture tubes) and its related en-terprises, the percentage of the higher level technologywithin the totalFDI structurefellto2.9%.
FDI have had an impact on the tech-nologydiffusion.Thediffusionhasmainlymanifested itself through the transfer of the technology from foreign parent com-panies to the enterprises acquired in lithu-ania, in addition to the payments to the staff to work with the new equipment and
implementation of the new management andorganisationmethods.Other technol-ogy and innovation reached lithuanian en-terprises that received intermediate goods tobemanufacturedintofinalgoods.Thisis evident in the research conducted by In-nobarometer into the innovative business enterprises3, which showed that in terms of new products and services presented to consumers, lithuanian enterprises are Eu leaders in selling products or services cre-atedbyotherenterprises(55%ofallenter-prises,wheretheEU-27averageis34%)andincarryingoutmodificationorcustom-izationofproductsorservicescreatedbyotherenterprises (47%ofallenterprises,wheretheEU-27averageis33%).Therewasafairlysignificant indirectbenefitofFDI that resulted in the local service orsupply enterprises, that previously had no access to the foreign markets, being forced to upgrade or improve their technologies once they entered the partnerships with foreigncompanies,adaptingtheirexistingtechnology and their entire manufacturing potential to meet the the requirements of foreigncompanies.Inthisway,theimpactofFDIonthetechnologydiffusionmani-fested itself not only in those industries where the foreign capital was invested, i.e.ontheverticalplane,butalsoinotherbranches related to the maintenance of the supply and service links. Unfortunately,the technology diffusion process based on thecosteconomicsandrapidprofitreturnsis quite unstable, short-lived, and fails to suit the strategic goals of the country where the investments are being made (Jucevi-
3 Innobarometer 2007, analytical report, Innovation transfer,FlashEBSeriesNo.215,p.31.

98
cius,2007).V.UrbonavičiusandG.Brock(2008)analysedtheattractionofFDIintothe individual districts in lithuania and concluded that, having lost its low costs appeal, lithuania could draw additional FDI by better implementation of the EUlaws,whereby FDIwould bemaintainedby the increased internal purchasing pow-er, along with the additional international financialservices.Thesaiddatarelatedtothe FDI into the “rapid profit return” ar-eas and the burst of the real estate bubble, as well as the drop in consumption due to the global crisis show that the conclusion of these authors concerning measures to maintainFDIinLithuaniaprovedtobeer-roneous and even had a negative impact on theexagerratedgrowthofconsumption.
Knowledge capital
after the restoration of lithuania‘s inde-pendence and especially after the acces-sion to the European union, new oppor-tunities for the participation in various conferences and training opened up to many of the country‘s academics and busi-ness people, both in the Eu and in other countries throughout the world. Interna-tional trade, foreign direct investments, and membership in the international or-ganisations stimulated and encouraged the establishment of new contacts with foreign partnerswhohad(i.e.managed)advancedtechnologiesandinnovativeknowledge.Inthegeneralcontextofthetechnologyandinnovation assimilation, it is very impor-tant to ascertain whether lithuania has suf-ficientpotential tounderstandandaccepttheglobalinnovativeachievements.
Data on the technology diffusion via
knowledge capital is estimated differently compared to the international trade and FDI, and is not calculated directly, how-ever, surveys conducted by the Depart-mentofStatisticsofLithuania (LSD) re-vealtheexternalfactorsthathavehadthegreatest impact on the innovation (table 4), and the research of business enterprises conducted by the Innobarometer (2007) present the sources of innovation from within an enterprise. Innobarometer‘sdata show that top t level leaders under-standtheimportanceofinnovation–80%of the surveyed enterprises identified toplevel leadership as the source of innova-tion (EU-27 average– 76%), however,in terms of the engineering and technical personnel, and especially professionals of marketing as a source of internal innova-tion, lithuania was found to be lagging farbehindtheEU-27average.Therewasa similar trend in the participation of the internalR&Ddepartmentoftheenterprisein the creation of innovation (engineering-technical personnel as a source of innova-tion– 35% of the surveyed enterprises;marketing departments – 25%; internalR&Ddepartment–9%;theEU-27aver-agesare40%,39%and25%respective-ly)4.Thedevelopmentofcreativethinkingand innovation implementation processes requires a solid foundation – culture of an organisation and a system of its val-ues and norms, where particular attention goes to the people that work for the enter-prise (Poškienė, 2006), and only organi-sations based on the culture of creativity and knowledge can encourage innovation to springup fromwithin. Inher analysis
4 Innobarometer 2007, analytical report, Innovation transfer,FlashEBSeriesNo.215,p.21-22

99
of the organisation culture and innovation, A.Poškienė (2006)presenteddatashow-ing that the staff that seeks innovation and change in business enterprises are mostly influenced by the motivation (in 5 casesoutof6).Generalenterprisepoliciesonin-novation and management came in the sec-ondplace.Unfortunately,theabilityofthelithuanian leaders to adopt and apply mo-tivational measures was found to be one of theirweakest skills.Themainmethodofmotivation used by the leaders of business enterprises was monetary encouragement, a method not even considered a stimulus by some people since it forces them to take upcomplicated tasks.The specificdesireof leaders to apply monetary remuneration as a motivator often becomes a measure of manipulation, thereby losing its stimulato-ryrole(Diskienė,etal.,2008).Otherfac-tors that are described as a foundation for a creative organisation, such as staff involve-ment, tolerance, trust, openess to change, etc.,areonlystartingtobeadoptedbytheLithuanianleaders.However,acentralisedmanagement style, decision-making and taking of the responsibility at the toplevel, andexcessivecontrolarestillthedominantcharacteristics on the general scale of the leaders‘ abilities (Diskienė, et al., 2008).the above data from Innobarometer show-ing that the internal enterprise resources are not used to create innovation are com-pletely understandable and explicable;in addition, these potential resources are neither supported by their leadership, nor are they encouraged by the organisation‘s internal culture or see any motivational benefitsastowhytheyshouldbecreative.It is no wonder then, that so much research byboththeLSD(2008)andAdekolaetal.
(2008) on the factors that inhibit innova-tive activities indicate a shortage of quali-fiedpersonnel,which,whencoupledwiththelimitedfinancialresourcesandtheex-pansion of the dominant market leaders, becomes the main inhibitor of innovative activities within an enterprise. However,when the internal resources are limited, there is always an opportunity to search for externalsources,andprimarilyamongthecountry‘sscientificpotential.
Data from the surveyed Lithuanianinnovative enterprises show that in 2002-2004,universitiesandotherstatescientificinstitutionswereidentifiedascooperationpartnersbyonly19.9%ofbusinessenter-prises(seeTable1).In2006thispercent-age grew to 28.7% due to the financingconditions of Eu structural funds and other European programs that encouraged coop-eration between the science and business communitiesandamoreflexibleapproachto the management of certain state scien-tificinstitutions,when,duetoinsufficientgovernment financing, institutes and uni-versities carried out more commissioned research for business enterprises, seeking toattractadditionalfunds.
Irrespective of the slightly increased cooperation between the innovative en-terprisesandthestatescientificinstitutes,theimportanceofscientificinstitutesintheinnovation diffusion weakened in terms of diffusion channels, which were determined by the trade relationships or information from the related enterprises (Table 4). In2002-2004, state scientific institutes anduniversitieswere identified as sources ofinnovationbyonly2.6%oftheinnovativeenterprises.Ashasbeenmentioned,thein-creaseintheuniversitiesin2004-2006was
100
more related to the appearance of exter-nal requirements.Manymore enterprisesgained information by way of participation intheconferences,tradefairs,andexhibi-tions.Itcanalsobenoted,thattherewasadefinite increase in the importanceof thescientificjournalsandtrade/technicalpub-licationsasasourceofinnovation.Asur-vey conducted in October 2008 in the 300 largest lithuanian enterprises revealed that 85% gained their information about
innovationsfromtheInternet(“Vilmorus”,2008).
the fact itself s does not mean that ev-ery country that has access to the Internet canassimilateeverythingthatexistsinthevirtual global technology market equally well.Norisittheinnovationdiscoverer‘saim that the innovation they worked hard to create and develop should make its way to other countries with no recompense.Every inventorprotectshis/herdiscovery
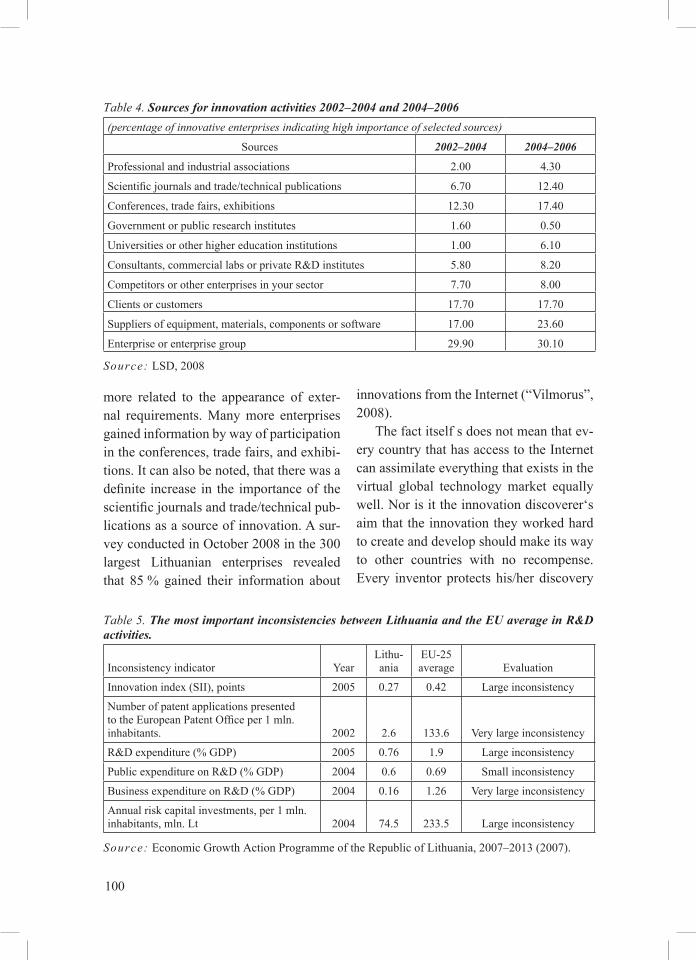
Table 4. Sources for innovation activities 2002–2004 and 2004–2006(percentage of innovative enterprises indicating high importance of selected sources)
Sources 2002–2004 2004–2006
Professional and industrial associations 2.00 4.30
Scientificjournalsandtrade/technicalpublications 6.70 12.40
Conferences,tradefairs,exhibitions 12.30 17.40
Government or public research institutes 1.60 0.50
universities or other higher education institutions 1.00 6.10
Consultants,commerciallabsorprivateR&Dinstitutes 5.80 8.20
Competitors or other enterprises in your sector 7.70 8.00
Clients or customers 17.70 17.70
Suppliers of equipment, materials, components or software 17.00 23.60
Enterprise or enterprise group 29.90 30.10
Source: LSD,2008
Table 5. The most important inconsistencies between Lithuania and the EU average in R&D activities.
Inconsistency indicator yearlithu-ania
Eu-25 average Evaluation
Innovationindex(SII),points 2005 0.27 0.42 large inconsistency
Number of patent applications presented totheEuropeanPatentOfficeper1mln.inhabitants. 2002 2.6 133.6 Very large inconsistency
R&Dexpenditure(%GDP) 2005 0.76 1.9 large inconsistency
PublicexpenditureonR&D(%GDP) 2004 0.6 0.69 Small inconsistency
BusinessexpenditureonR&D(%GDP) 2004 0.16 1.26 Very large inconsistency
Annualriskcapitalinvestments,per1mln.inhabitants,mln.Lt 2004 74.5 233.5 large inconsistency
Source: EconomicGrowthActionProgrammeoftheRepublicofLithuania,2007–2013(2007).

101
and is concerned about keeping his/hertechnologyasecretbytakingoutapatent.those who obtain a patent or a license are concerned about the technology protection to prevent the competitors from copying the technological achievement or discov-ery(Keller,2004).
The levelofLithuania‘s scientificpo-tential is illustrated quite well by the in-consistencies, compared to the Eu-25 average, concerning theR&D activity ofthosecountries(Table5).
this inconsistencies comparison table and the data presented earlier allow us to makethefollowingassumption:theweakpotential of patents, as an outcome of the entirescientificpotentialfield,wasinpartdetermined by the popularity of adaptation andmodification of innovation in Lithu-ania. That is to say that Lithuanian sci-entists did not have much to offer to the businesses, since they were adequately financed by the fundamental research al-locations covered by the budget spending, and business people were not inclined to invest in the scientific researchand tech-nological development themselves, as the opportunities that were made available throughtheinternationaltradeandtheFDIallowed to acquire innovative products and services from abroad. This conclu-sion is slightly different from those that were reached by the working group led by V. Daujotis (2006), who saw the di-vide between business and science lie in the business enterprises being unaware of thenecessityofscientificresearchfortheinnovativedevelopmentoftheenterprises.the above mentioned internal sources of innovation showed that top level manage-ment understood perfectly the importance
ofscientificresearchandwasan initiatorof innovation, yet, when there was an op-portunity to compete on cost rather than on innovation, or when a rapid result and not the results requiring years of research overshadow the strategic decisions of en-terprises, it is unlikely to hope that without the appearance of artificial, government-stimulated programs or university-iniated programs there would be any accord be-tween business and science in the transfer orthecreationofinnovation.
Louisetal.(1989)presentfivewaysinwhich the academic community and scien-tists can transfer innovative and more ad-vancedproductsandservicestobusiness:throughconsultancy,byfinancedresearch,via research companies, the issuance of patents and licenses and via spin-offs.
Innovation diffusion that was carried outbytheuniversitiesandscientificinsti-tutions by way of providing consultations held for business enterprises, or by car-rying out commissioned research, made uponly 4.7%of the total incomeof theuniversitiesandscientificinstitutionsfromscientific research (LSD, 2005). Analy-sis of the income gained from the scien-tific research and scientific consultancyfor lithuanian business enterprises of the three largest and most innovative universi-ties, and comparison of it to all their other sources of income, it becomes apparent that the former source of income is not a priority, and accordingly, this problem re-ceivesinsufficientattentionoftheuniver-sities. However, considerable differencesbetween the income of the universitiess-how that within some universities attention to the services for business and innovation diffusion is greater than at others, which

102
is determined by the different attitude to-wardsthemanagementoftheinnovation.yet this assumption should be tested in the further research, analysing the innovation management systems and commonalities inLithuanianuniversities.
an important parameter determining the knowledge potential and its use in in-novation diffusion is the number of patents registered by a country‘s inventorssince the majority of patents are registered “stand-ing on the shoulders of former inventors” (Keller, 2004), citing or using information thathasalreadybeenrevealed.Lithuania‘spotential in patent statistics among the new Eu member states is among the lowest (Eurostat,2006),eventhoughthepercent-age of growth in patent registration and applications for patent registration can be
viewedquitepositively.Itcanbeaccountefor by the particularly weak cooperation links between science and business that failed to encourage general commissioned research and the acquisition or citation of foreign patents for the creation of new in-novations.Thisisalsomostlikelyareflec-tion of a kind of inertia, which affected the statescientificresearch institutesanduni-versities.Anotherreasonthatinhibitedpat-ent registration, as indicated by the lithu-anian inventors, were the relatively high expensesincurredinpatentregistration.
the last method presented by louis et al.(1989)forinnovationtransferfromsci-ence to business via spin-offs of common enterprises has not existed in Lithuaniato this day, since neither the legislation concerning both the management of state
Table 7. Dynamics and the proportion of income for R&D of three universities received from the business sector (BS), (thousand Lt)Indicator \ year 2002 2003 2004 2005 2006 2007Ktu total income 121,503 130,918 153,408 171,247 178,521 200,005KTUincomeforR&Dfromcon-tractswiththeBS 4,599 5,167 5,027 3,656 3,939 5,343KTUincomefromtheBSas%oftotal income 3.79 3.95 3.28 2.13 2.21 2.67VGtu total income 61,936 65,111 80,486 91,291 100,434 118,237VGTUincomeforR&DfromcontractswiththeBS 1,901 3,203 2,161 3,567 5,286 3,925VGTUincomefromtheBSas%of total income 3.07 4.92 2.69 3.91 5.26 3.32Vu total income 112,098 123,493 140,052 151,093 180,191 219,277VUincomeforR&Dfromcon-tractswiththeBS 1,933 1,730 1,664 1,658 1,606 1,508VUincomefromtheBSas%oftotal income 1.72 1.40 1.19 1.10 0.89 0.69total income of all three universi-ties 295,537 319,522 373,946 413,631 459,146 537,519Income of all three universities for R&DfromtheBS 8,433 10,100 8,852 8,881 10,831 10,776%oftotalincome 2.85 3.16 2.37 2.15 2.36 2.00*KTU–KaunasUniversityofTechnology,VGTU–VilniusGediminasTechnicalUniversity,VU–Vilnius universitySource: Universityreportsdata,2002–2007.

103
scientific institutions‘ property and thedisposition of intellectual property encour-aged the creation of such enterprises. Inaddition, there were no risk capital enter-prises created to facilitate the appearance of such enterprises, while banks prefered tofinancethegrowingconstructionbubbleratherthaninvestinstart-upenterprises.
the innovation system, encompassing stateinstitutions,academicsciencefields,and business representatives (Etzkowitz,2000) in lithuania did not function, and tookonadifferentshape(Figure1).
Figure 1. The distorted Helix Concept in the lithuanian innovation system
Conclusions
Knowledge capital, both within enter-prises, and in the process of the evaluation olLithuania‘sscientificpotentialoverthelastdecade,was insufficient toguaranteethe creation of an innovation system in the country.Duetolimitedresources,suchasqualified personnel (primarily research-ers),inadequatefinancing,andthelackofstrategic partners, enterprises that wished to survive were forced to resort to the ad-aptation andmodificationof innovations,which they could embrace only by devel-oping the international trade from their in-
ternalresources,orbyattractingFDI.The vitality, flexibility and ability of
business to adapt to the changing condi-tions determined that lithuania‘s econo-my, in the absence of a stimulus from the government and failing to support the sci-ences over the last decade, managed to sur-viveinafiercelycompetitivebattlefieldbyadaptingtomarketconditions.Lithuanianenterprises and organisations use all pos-sible contacts to gain information about thenewtechnologiesandinnovations.Toplevel leaders are perfectly aware of the im-portanceofscientificresearchandaretheinitiators of innovation within their enter-prises, but bringing about innovation and change in an enterprise is still encumbered bytheexistingmanagementstyleandtheorganisation culture within lithuanian en-terprises, which discourages creativity and initiative.Itishopedthatduetotheinflu-ence of foreign partners, and the applica-tionofeffectiveandflexiblemanagementstyles, some of lithuanian business lead-ers will come to understand the importance of an internal organisation culture that en-courages creativity and people‘s initiative, and will prompt its appearance in lithu-anianenterprises.
the main potential of lithuanian enter-prises to attract foreign investments prior to2006waslowcosts,whiletheincomingFDIwasmostlydirectedatlowandmid-level technology sectors of the economy, where the creation of adaptation and to a degree, extended modifying innovationprevailed, which means that technology created elsewhere was transfered into the lithuanian enterprises only to prevent the country completely falling behind in the market.AlargepartofFDIin2005-2007

104
cameto“milkprofits”fromsectorsshow-ing promising growth. An unmanagedand non-government supported process to attract investments is rather unstable, short-lived, and fails to correspond to the strategic goals of the country receiving the investments, therefore the policies for at-tractingFDIshouldbereviewedatastatelevel, and be associated with something morethanjustamomentarygainoffunds.
the limited human resources of state scientific institutions and their inefficientinnovation management model revealed their disinterest and inability to participate in the general innovation diffusion process taking place in lithuania, alongside with businessandgovernmentinstitutions.Theeffortsofrecentyearstoencourageartifi-
cially, and with the assistance of Eu struc-tural funds, an allegiance between science, government, and business through the creation of science and technology parks, or valleys, is commendable, yet highly overdue.Inotherwords,aswasshownbythe material presented in the given article, business thatwill not be “admitted” intothose valleys yet will comprise a lion‘s share of the market will seek innovation independently, or will search for the ways to gain a technological advantage in the market.Thatiswhyitisimportantonthestate level, that the cooperation between the three elements of business, govern-ment, and science should not be concen-trated only on a few valleys, leaving other industrieswithnosupport.
REFERENCES
1. AdekolaA., Korsakienė R., TvaronavičienėM.(2008), approach to innovative activities by lithuanian companies in the current conditions of development.Technological and economic devel-opment of economy.Vol.14(4),p.595-611.
2. BeckerB.,GassmannO.(2006).CorporateIn-cubators:IndustrialR&DandWhatUniversitiescan Learn from Them. Journal of Technology Transfer,No.31,p.469-483.
3. BrockG.,UrbonavičiusS.(2008),RegionalFDIgrowthinLithuania,1996-2003.Transformation in business and economics, Vol. 7, No. 1 (13)p.80-88.
4. Coe D. T., Helpman E., Hoffmaister A. W.,(1997).North-SouthR&Dspillovers.The Eco-nomic Journal,No.107,p.134-149.
5. DaujotisV. et al., (2006),Report on the studyoffinancial incentives for technologydevelop-mentandscientificresearch;Vilnius–NationalBureauofEuropeanTechnologyPlatformsandIndustrialClusters.
6. DenisC.,McMarrowK.,RogerW.,(2006)Glo-balisation:Trends,IssuesandMacroImplicationsfortheEU.EC,Economic papers,No.254.
7. Department ofStatisticsLithuania (2008).De-velopment of innovation activities. Statisticalbulletin.
8. DepartmentofStatisticsLithuania(2008),For-eign direct investment in Lithuania. Statisticalbulletin.
9. DepartmentofStatisticsLithuania (2006),Sci-entificstaffandtheiractivities,2005.Statisticalbulletin.
10. DiskienėD.,GalinienėB.,MarčinskasA.(2008),Managerial attitudes in the context of globalchallenges:TheLithuaniansurvey.Transforma-tion in business and economics,Vol.7,No.3(15)p.21-38.
11. DnBNordBankas (2008),Vilnius.TheLithu-anianEconomicOutlook,2008.
12. Etzkowitz H.&Leyderdorff L. (2000). The dy-namicsofinnovation:fromnationalsystemand‘Mode 2’ to a Triple Helix of university- in-dustry- government relations.Research Policy, No.32,p.109-123.
13. Eurostat(2008)Science,technologyandinnova-tioninEurope.Pocketbooks,2008edition,EC.

105
14. FDIConfidenceindex©,(2005)GlobalBusinessPolicyCouncil,Volume8,A.T.KearneyInc.
15. FelixB.,(2007)Nationalpatentstatistics.Tradeinhigh-techproducts. Statistics in focus. Science and technology.No.7/2007,Eurostat.
16. FelixB.,(2007)High-techenterprises.Statistics in focus. Science and technology.No.37/2007,Eurostat.
17. Government of the Republic of Lithuania(2007), Economic Growth Action Programme 2007-2013.
18. GrundeyD.,TolubaB.,PilinkusB.(2008),Therole of institutional policy in developing inno-vative entrepreneurship inLithuania.Transfor-mation in business and economics,Vol.7,No.2(14),p.86-101.
19. Innobarometer (2007), Analytical Report, In-novation transfer,FlashEBSeriesNr.215-TheGallupOrganization.EC.
20. JucevičiusR.,etal., (2007),Complexstudyofsources (causes) of lithuania‘s economic growth andcompetitiveness.KTUInstituteofBusinessStrategy,KnowledgeSocietyInstitute.
21. Kalotay K., (2006) New Members in the Eu-ropean Union and Foreign Direct Investment.Thunderbird International Business Review,Vol.48(4),p.485-513.
22. Keller W., (2004), International TechnologyDiffusion.Journal of Economic Literature,Vol.XLII,(September2004),p.752-782.
23. Louis K.S., Blumenthal D., Gluck M., StotoM.(1987).Entrepreneursinacademie:Anexplo-rationofbehaviorsamonglifescientists.Admin-istrative Science Querterly, No. 34(1), p.111-131.
24. PoškienėA.(2006),OrganizationalCultureandInnovations. Engineering economics. 2006,No.1(46),p.45-50.
25. RuniewiczM.,(2004)TheBalticstates inneweconomy:FDI,TechnologyFlowsand Innova-tiveness. Tiger Working paper series, No. 71,Warsaw,December2004
26. The public opinion and market research insti-tution “Vilmorus”, a conference „Innovations:What will lithuanian business be like tomor-row?”, organised by the Ministry of Economy RepublicofLithuania,Vilnius07-11-2008.
27. ZedtwitzM.,GassmannO.,BoutellierR.,(2004)“OrganizingglobalR&D:challengesanddilem-mas”, Journal of International Management, Nr.10p.21–49.