
Interlaboratory Data Management Software · 2012-11-07 · Acusera 24•7 enables laboratories to...
24
Interlaboratory Data Management Software
Transcript of Interlaboratory Data Management Software · 2012-11-07 · Acusera 24•7 enables laboratories to...
Interlaboratory Data Management Software

The Randox Acusera range of quality controls is of themost accurate, stable and consistent on the market.As true third party controls, they are not designed oroptimised for use with a specific reagent or instrumentmanufacturer, providing a true, unbiased assessment oflaboratory performance.
The use of internal quality controls is only the first step inimproving analytical performance. The ability to interpretdata and effectively monitor performance is essentialin establishing and maintaining reliability, accuracy andprecision.
Randox’s Acusera 24•7 is an Internal Quality Control(IQC) and peer group reporting package, designedprimarily to complement and support the Acuserarange of quality control sera. However, it can be used tomonitor the performance of any internal quality control.
An effective IQC and peer group reporting schemelike Acusera 24•7 will help improve your laboratory’s analytical performance, help meet regulatory requirements and most importantly ensure the accuracy and reliability of patient test results.
Acusera 24•7 enables laboratories to monitor analyticalperformance, access peer group reports and compareresults with other laboratories using the same qualitycontrols, method and instrument.
Peer group data is updated every 24 hours giving youaccess to the most up-to-date information available. Thisis unique to the Randox Acusera 24•7 service.
Acusera 24•7 web eliminates the need for localinstallation, reduces the need for frequent back ups andthe amount of support necessary from on site IT staff,making it ideal for use in laboratory chains and groups.
AN EFFECTIVE TOOL FOR EVALUATING LABORATORY PERFORMANCE
2

Receive reliable information from a trustworthysourceAcusera 24•7 peer group statistics are generated every24 hours from up to 20,000 independent labs worldwide.This large number of participants ensures an extensivedatabase of results for many analytical methods, assuresvalidity and therefore increases confidence in your results.
Identify any trends, system errors or reagent issuesas soon as they ariseAcusera 24•7 will allow you to detect and identify errorsin your laboratory system thus minimising expensiverepeats and unnecessary troubleshooting.
By comparing your IQC results with peer group datayou can identify problems that otherwise may have goneunnoticed and assess if shifts in QC recovery are uniqueto your laboratory. Access to peer group data may evenalert you to future issues before they are encountered inyour laboratory.
QC multi-rules help minimise false rejections and maintain high error detection.
Improve EQA/PT performance by eliminating anyundetected biasRandox Acusera 24•7 is designed to support andcomplement your current EQA/PT scheme. Externalquality assessment is not performed on a daily basis butperiodically, either bi-weekly or monthly with RIQAS, orless frequently with other EQA/PT schemes.
Errors can occur at any time or at any point in the testingprocess and may go undetected until you receive yournext EQA report. You may identify a problem when youreceive your EQA report but when did the issue occur?1 day ago, 1 week ago or just after your last EQA samplewas tested?
A well maintained internal quality control programmesupplemented with a peer group reporting scheme likeAcusera 24•7, is necessary to establish and maintainreliability, precision and accuracy.
In addition to this, participation in a peer group reportingscheme may also improve EQA/PT performance asyour results are more likely to compare well to otherlaboratories participating in the same scheme.
Acusera 24•7 can even provide comparison data forparameters that are unavailable in your current EQAprogramme.
Have confidence in assigned target valuesTogether with data extracted from over 20,000participants on RIQAS (Randox International QualityAssessment Scheme), the Acusera 24•7 programmeprovides immediate confidence in assigned target values.
Help your laboratory gain accreditation and meetregulatory requirementsLaboratory managers are under increasing pressure toclosely monitor laboratory test results and assure theirquality due to growing demands from higher authoritiesfor national and international accreditation.
ISO 15189 states that laboratory management shouldmonitor EQA results and implement corrective actionsin situations were quality control criteria is not fulfilled.Good internal quality control procedures including peergroup reporting and interlaboratory participation canhelp meet such requirements.
Get an independent perspectiveOften manufacturers use the same raw materials in theirreagents, quality controls and calibrators. As such thereis an increased risk that a shift in patient results will gounnoticed as QC results appear fine.
The combination of Randox third party quality controls and Acusera 24•7 peer group reporting softwarecan reduce the potential for bias and provide a trueassessment of analytical performance.
Access peer group data 24 hours a day, seven daysa weekWith Randox Acusera 24•7 peer group data isuniquely updated every 24 hours giving you accessto the most up-to-date information available. This isextremely useful when troubleshooting performanceissues and resolving them as soon as they occur.
WHY PARTICIPATE IN A PEER GROUP REPORTING PROGRAMME LIKE ACUSERA 24•7?
3
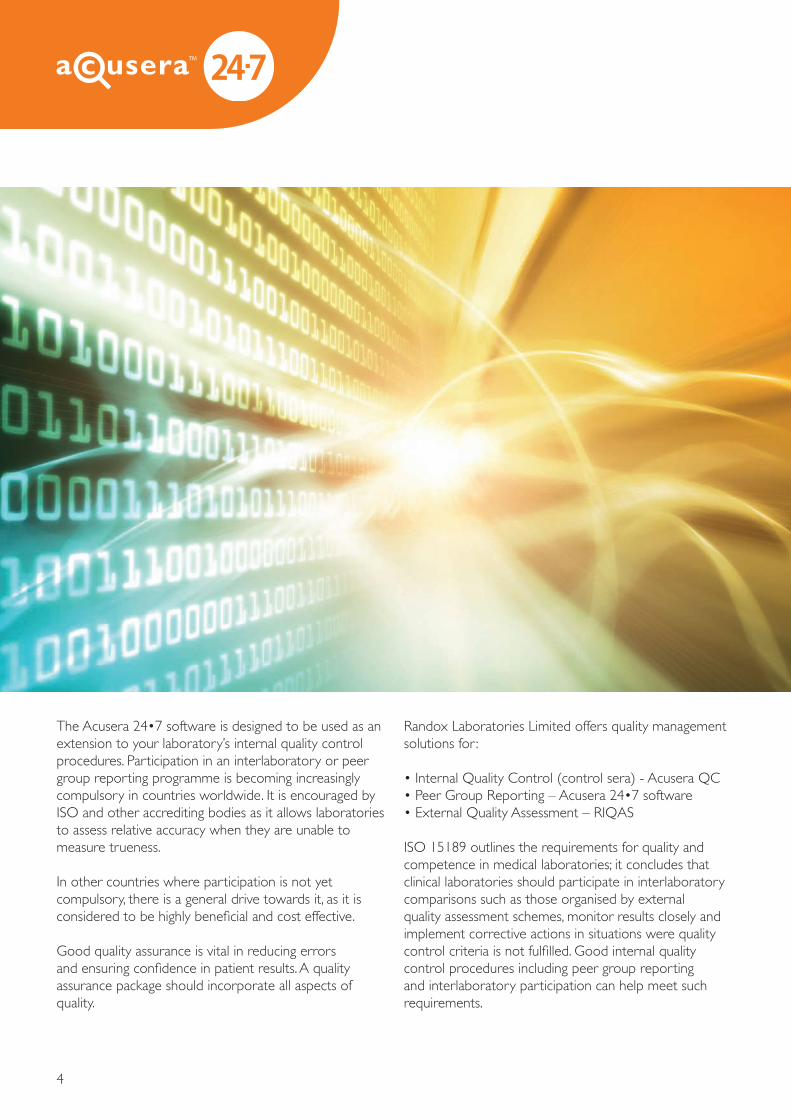
The Acusera 24•7 software is designed to be used as anextension to your laboratory’s internal quality controlprocedures. Participation in an interlaboratory or peergroup reporting programme is becoming increasinglycompulsory in countries worldwide. It is encouraged byISO and other accrediting bodies as it allows laboratoriesto assess relative accuracy when they are unable tomeasure trueness.
In other countries where participation is not yetcompulsory, there is a general drive towards it, as it isconsidered to be highly beneficial and cost effective.
Good quality assurance is vital in reducing errorsand ensuring confidence in patient results. A qualityassurance package should incorporate all aspects ofquality.
Randox Laboratories Limited offers quality management solutions for :
• Internal Quality Control (control sera) - Acusera QC• Peer Group Reporting – Acusera 24•7 software• External Quality Assessment – RIQAS
ISO 15189 outlines the requirements for quality andcompetence in medical laboratories; it concludes thatclinical laboratories should participate in interlaboratorycomparisons such as those organised by externalquality assessment schemes, monitor results closely andimplement corrective actions in situations were qualitycontrol criteria is not fulfilled. Good internal qualitycontrol procedures including peer group reportingand interlaboratory participation can help meet suchrequirements.
4
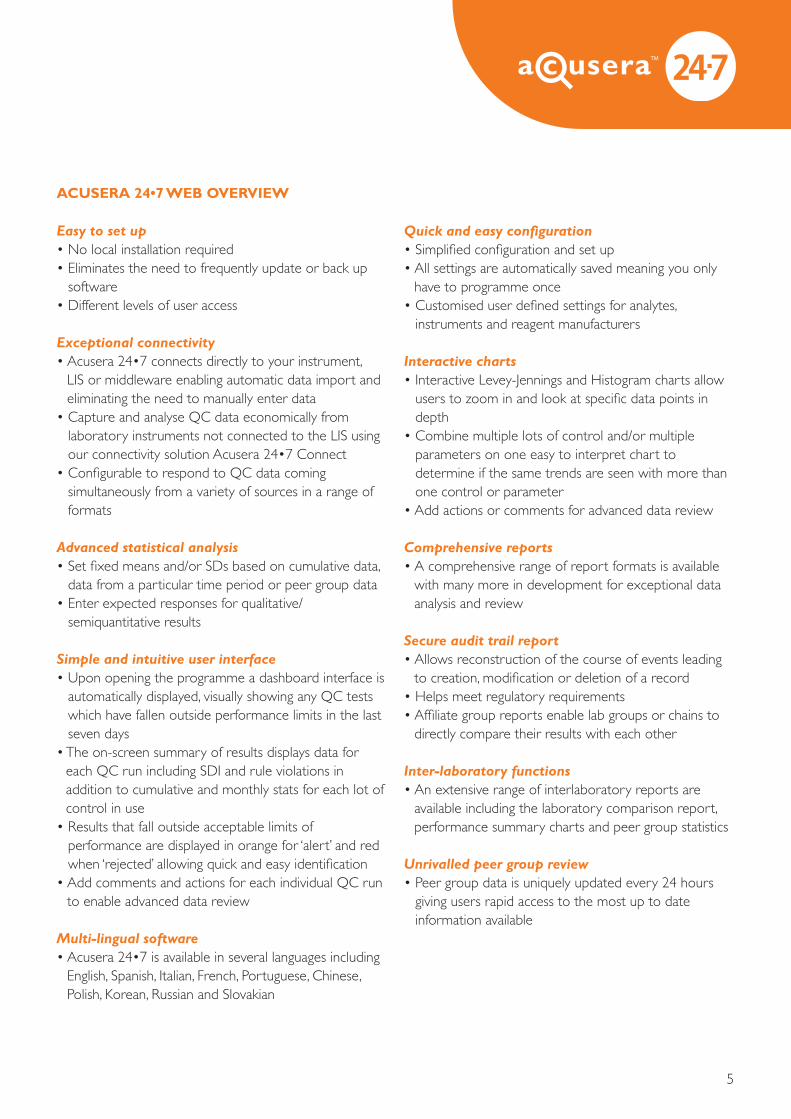
Easy to set up• No local installation required• Eliminates the need to frequently update or back up
software• Different levels of user access
Exceptional connectivity• Acusera 24•7 connects directly to your instrument,
LIS or middleware enabling automatic data import and eliminating the need to manually enter data
• Capture and analyse QC data economically from laboratory instruments not connected to the LIS using our connectivity solution Acusera 24•7 Connect
• Configurable to respond to QC data coming simultaneously from a variety of sources in a range of formats
Advanced statistical analysis• Set fixed means and/or SDs based on cumulative data,
data from a particular time period or peer group data• Enter expected responses for qualitative/
semiquantitative results
Simple and intuitive user interface• Upon opening the programme a dashboard interface is
automatically displayed, visually showing any QC tests which have fallen outside performance limits in the last seven days
• The on-screen summary of results displays data for each QC run including SDI and rule violations in addition to cumulative and monthly stats for each lot of control in use
• Results that fall outside acceptable limits of performance are displayed in orange for ‘alert’ and red when ‘rejected’ allowing quick and easy identification
• Add comments and actions for each individual QC run to enable advanced data review
Multi-lingual software• Acusera 24•7 is available in several languages including
English, Spanish, Italian, French, Portuguese, Chinese, Polish, Korean, Russian and Slovakian
Quick and easy configuration• Simplified configuration and set up• All settings are automatically saved meaning you only
have to programme once• Customised user defined settings for analytes,
instruments and reagent manufacturers
Interactive charts• Interactive Levey-Jennings and Histogram charts allow
users to zoom in and look at specific data points in depth
• Combine multiple lots of control and/or multiple parameters on one easy to interpret chart to determine if the same trends are seen with more than one control or parameter
• Add actions or comments for advanced data review
Comprehensive reports• A comprehensive range of report formats is available
with many more in development for exceptional data analysis and review
Secure audit trail report• Allows reconstruction of the course of events leading
to creation, modification or deletion of a record• Helps meet regulatory requirements• Affiliate group reports enable lab groups or chains to
directly compare their results with each other
Inter-laboratory functions• An extensive range of interlaboratory reports are
available including the laboratory comparison report, performance summary charts and peer group statistics
Unrivalled peer group review• Peer group data is uniquely updated every 24 hours
giving users rapid access to the most up to date information available
ACUSERA 24•7 WEB OVERVIEW
5

6
ACUSERA 24•7 REPORTS AND CHARTS
Participation in Acusera 24•7 provides you with access to the following detailed charts and reports:
Dashboard Page 7
On Screen Summary of Results Page 8
Interactive Levey-Jennings Charts Page 9
Interactive Multi Levey-Jennings Charts Page 10
Interactive Histogram Charts Pages 11-12
Laboratory Performance Overview Page 13
Peer Group Statistics Page 14
Audit Trail Report Page 15
Laboratory Comparison Report Page 17
Exception Report Page 18

The dashboard interface is a pre-defined homepage thatis automatically displayed each time a user logs onto thesoftware.
The dashboard instantly brings any QC testswhich have fallen outside the user-defined performancelimits in the last seven days to the user’s attention andprovides an indication of any poor performing tests thatrequire further investigation.
7
DASHBOARD INTERFACE
The unique dashboard interface provides a rapid indication of poor performance

Acusera 24•7 will automatically calculate statistical data, including the mean and standard deviation. Data is presented in an easy to read format allowing any sudden or gradual changes in performance to be identified immediately.
The summary provides both monthly and cumulative data and enables comparison to a user defined fixed mean and standard deviation. Each laboratory can set fixed values based on peer group statistics or other
values such as the target and range quoted for the particular lot of control material in use.
Results which are outside acceptable limits ofperformance are highlighted in orange for ‘alert’ and red when ‘rejected’ allowing for quick and easy identification.The system also provides users with a reason for thepoor performance and indicates which rule has beenviolated. Users may add comments or actions enablingadvanced data review.
8
ON SCREEN SUMMARY OF RESULTS
The on screen summary of results provides users with a visual overview of current analytical performance

Two types of Levey-Jennings charts are available, onebased on the standard deviation and the other based on percentage deviation. Each chart provides an instant visual indication of whether or not a test is performing well.
Using the unique overview bar, laboratory staff canscroll through past data to look at previous trendsor zoom in on a specific time period providing themwith a more in depth look at performance.
The interactive nature of the chart also allows users toadd actions or comments, for advanced data review.
The date and deviation from the mean is easily displayedby hovering over any of the data points, furtherinformation including the actual result obtained canbe accessed simply by clicking on each individual datapoint. Depending on their preference users may chooseto hide either the data points or the daily mean line.
9
INTERACTIVE LEVEY-JENNINGS CHARTS
Identify trends, bias and precision problems at a glance using the fully interactive Levey-Jennings charts

10
Multiple data sets can be generated by simply combiningresults from multiple parameters, instruments or lotnumbers on one easy to interpret chart.
The ability to combine data for multiple levels of qualitycontrol on a single Levey-Jennings chart enables users tosee if the same bias or the same trends are seenwith more than one level of control. Whilst the ability tocombine multiple parameters on the same chart enablesusers to check if the same level of bias or the sametrends are seen across different parameters.
Combine multiple levels of control and or multiple parameters on the same chart
INTERACTIVE LEVEY-JENNINGS CHARTS
11
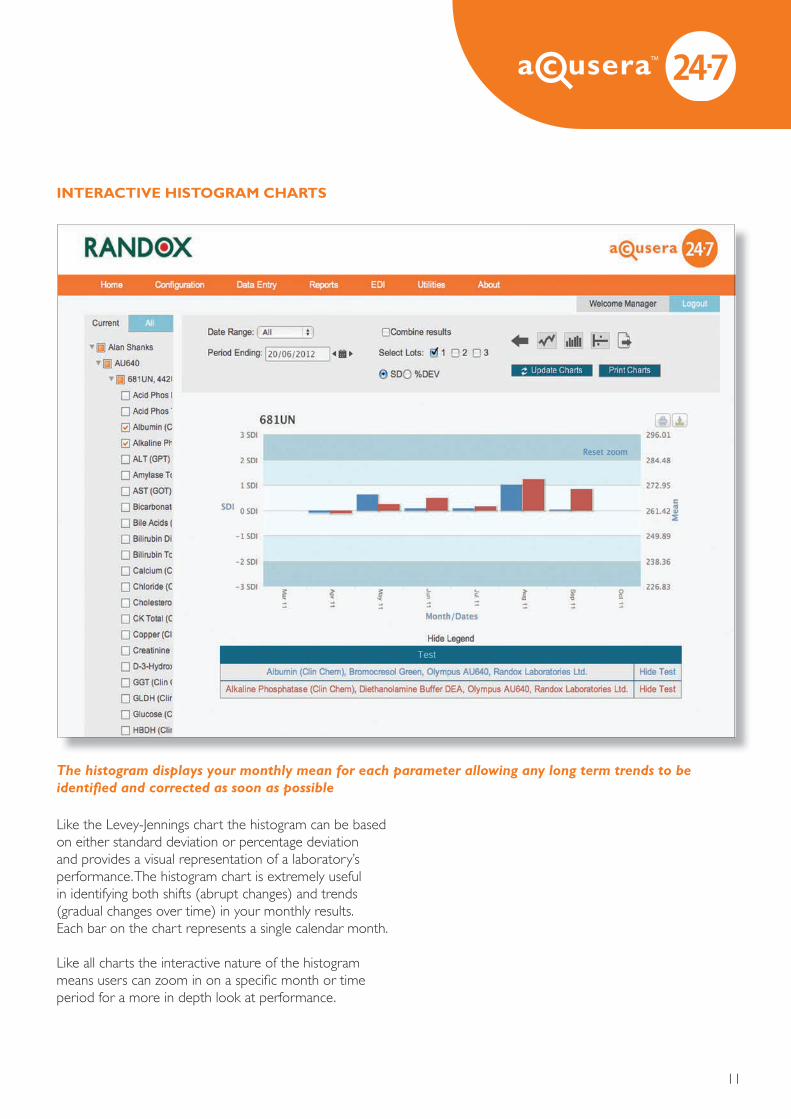
Like the Levey-Jennings chart the histogram can be basedon either standard deviation or percentage deviationand provides a visual representation of a laboratory’sperformance. The histogram chart is extremely usefulin identifying both shifts (abrupt changes) and trends(gradual changes over time) in your monthly results.Each bar on the chart represents a single calendar month.
Like all charts the interactive nature of the histogrammeans users can zoom in on a specific month or timeperiod for a more in depth look at performance.
The histogram displays your monthly mean for each parameter allowing any long term trends to be identified and corrected as soon as possible
INTERACTIVE HISTOGRAM CHARTS

12
Users can choose to display data for multiple levels of control and/or multiple parameters on the same histogram chart. The ability to display multiple data sets on a single chart enables laboratories to determine if the same shift in control values is seen between different levels of control or with more than one parameter.
Like the Levey-Jennings charts actual data can be displayed by simply hovering over the bar relating to the month of interest.
Display data for multiple levels of control and/or parameters on the same histogram chart
INTERACTIVE HISTOGRAM CHARTS

13
The performance summary report highlights potential bias and imprecision issues, displaying your SDI on the y-axis and your CVI on the x-axis. Your laboratory’s performance versus your chosen peer group and method peer group are plotted. Your cumulative or monthly results can be compared to world or affiliate group statistics enabling enhanced trouble shooting capabilities.
Analytical performance can be quickly and easily interpreted by identifying where your result falls in the shaded region.
Performance summary charts allow cumulative and monthly data to be compared to a peer group based on world or affiliate group results
LABORATORY PERFORMANCE OVERVIEW REPORT

14
Several options are available:
All methodsMethodMethod / ReagentMethod / Instrument ModelMethods / Instrument Model / ReagentMethod / Instrument GroupMethod / Instrument Group / Reagent
The peer group may be changed at any time and datacan be viewed on the same screen allowing for easiertroubleshooting. Acusera 24•7 peer group data is updated every 24 hours giving you access to the most up to dateinformation available. This service is unique to Acusera 24•7.
Peer group data can be customised so that laboratoriescan compare their performance either to their peersworldwide (world statistics) or to their peers in a selected affiliate group (group statistics). Group coordinators can view the performance of others in their group of affiliate laboratories.
Using Acusera 24•7 you can select the peer group statistics to which your results are compared
PEER GROUP STATISTICS
15
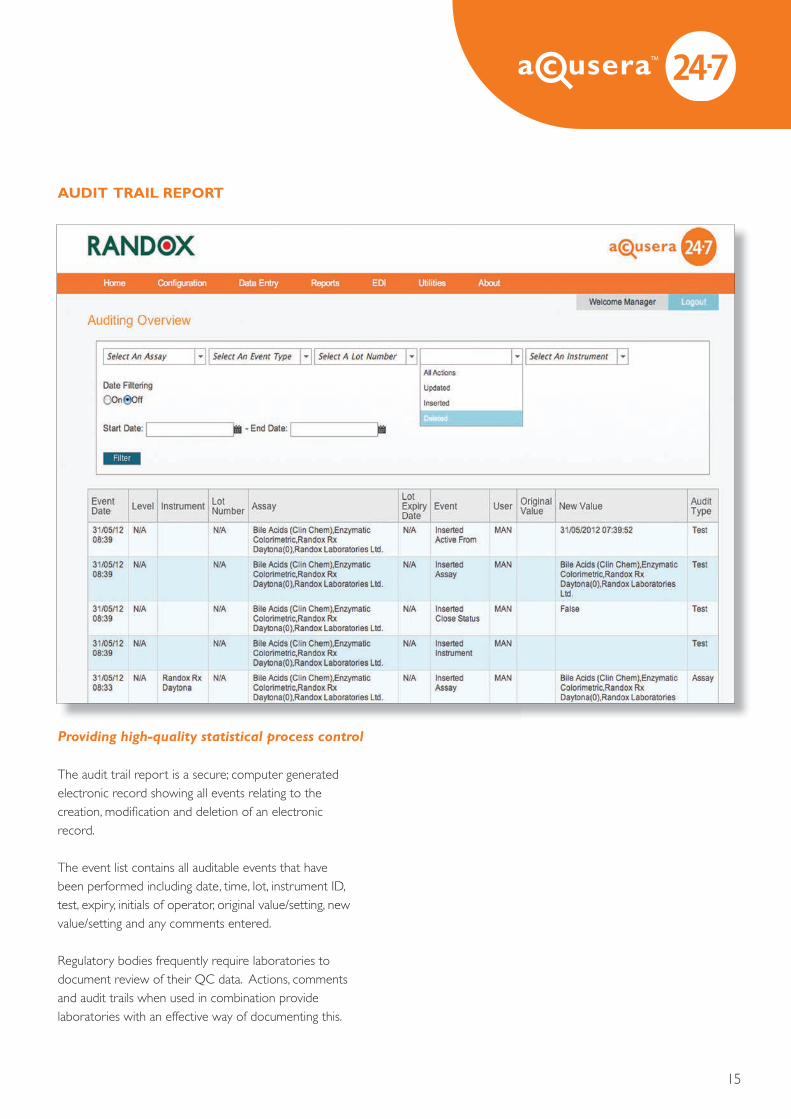
The audit trail report is a secure; computer generatedelectronic record showing all events relating to thecreation, modification and deletion of an electronicrecord.
The event list contains all auditable events that havebeen performed including date, time, lot, instrument ID,test, expiry, initials of operator, original value/setting, newvalue/setting and any comments entered.
Regulatory bodies frequently require laboratories todocument review of their QC data. Actions, commentsand audit trails when used in combination providelaboratories with an effective way of documenting this.
Providing high-quality statistical process control
AUDIT TRAIL REPORT
16
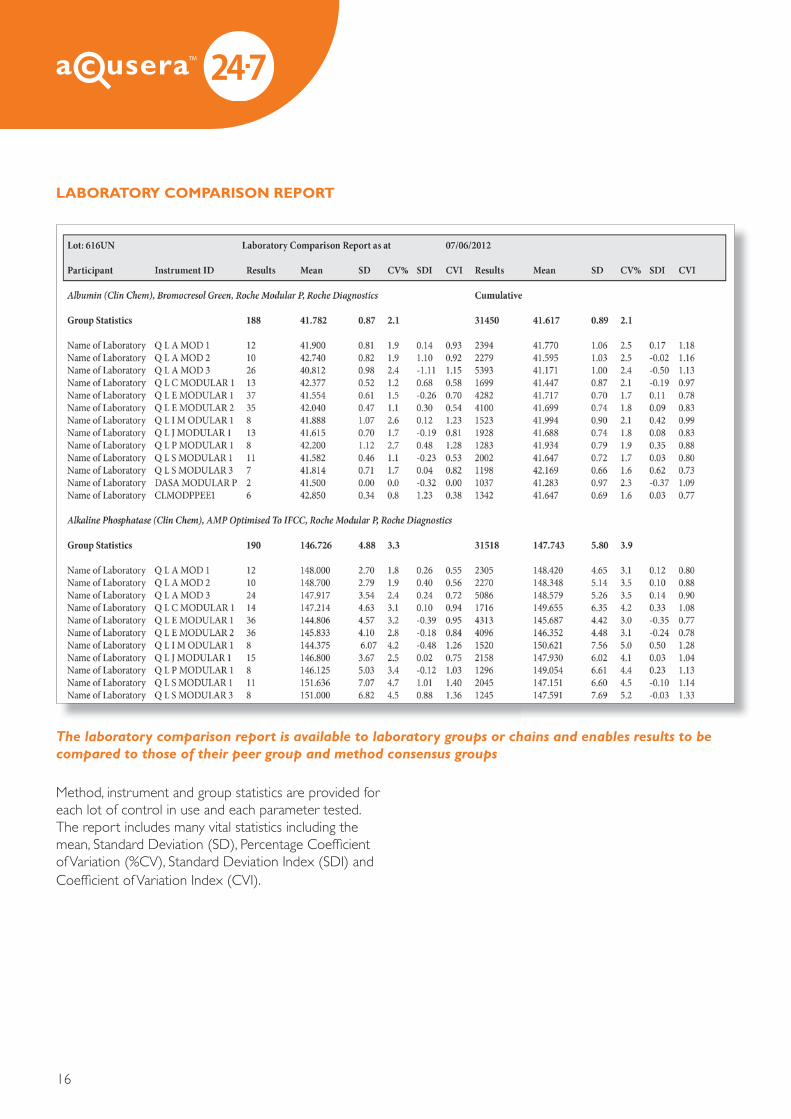
Method, instrument and group statistics are provided foreach lot of control in use and each parameter tested.The report includes many vital statistics including themean, Standard Deviation (SD), Percentage Coefficientof Variation (%CV), Standard Deviation Index (SDI) andCoefficient of Variation Index (CVI).
The laboratory comparison report is available to laboratory groups or chains and enables results to be compared to those of their peer group and method consensus groups
LABORATORY COMPARISON REPORT

17
The exception report is ideal for quality control coordinatorsor laboratory managers who manage multiple laboratory sitesor multiple instruments of the same make and model.
The report is available on request and lists any analyte thatexceeds the specified SDI or CVR warning limits compared tothe consensus groups. Any analyte rejected by Acusera 24•7is also listed for all laboratories within the affiliated laboratorygroup. Laboratory managers may also choose the frequency ofthe report.
Allows large laboratory chains or groups to view all analytes that exceed the pre defined SDI/CVR
EXCEPTION REPORT

18
Analytical goalsImprecision-BVTotal Error-BVMedical relevanceState of the art
QC StatisticsSix sigmaTotal allowable errorTotal error
Data ReviewBench and supervisor reports
ChartsYouden chartsLinearity charts
ReportsStatistical reportSupervisor reportOperator reportMonthly evaluation reportData rejection reportBias and imprecision reportStatistical profile reportManufacturer specific reportLaboratory histogram report
Improved functionality30 day warning before a QC lot expires
Registration and set upRilibak functionalityWestgard advisor
FEATURES IN DEVELOPMENT
Several new and exciting features are currently in development and will be available soon withAcusera 24•7 Web

19
CONNECTIVITY SOLUTIONS FOR AUTOMATED UPLOAD OF DATA TO ACUSERA 24•7
• Eliminates the problems associated with manual data entry and the risks associated e.g. time and transcription errors
• Laboratories can continue to use standard LIS QC reports.
• Real time connection
• Flexible enabling automatic upload from a laboratory’s instrument, LIS or middleware.
• The system is extremely secure capturing only the laboratory’s QC data. Lab managers can be confident patient results will not be affected.
• Similar process to the flow of data to the LIS
Automatic import Ideal for laboratories were an exported QC file containing all required information is currently available from the analyser, LIMs or Middleware. The exported QC file is uploaded directly to Acusera 24•7 Connect.
Site requirements:• Network Connection• QC file must contain date, time, lot
number, test, instrument and result
Data tap Ideal for laboratories where an analyser is connected to LIMs however the QC data available is incomplete. The data tap intercepts the transfer of data between the analyser and the LIMs separating the QC data and sending it to Acusera 24.7 Connect.
Site requirements: • LIMs Connection • Network Connection
Direct connection Suitable for laboratories with no LIMs connection. In this scenario all analysers will connect directly to Acusera 24.7 Connect.
Site requirements:• Network Connection
The diagram above demonstrates the flow of QC data from a laboratory’s instrument, middleware or LIS.
There are three main modes; data top, direct connection and automatic import.
Analyser
Analyser
Analyser Middleware
LIMs/LIS Acusera24•7 Connect
Acusera24•7 Web
Acusera24•7 Desktop
Acusera24•7 Programme
QC Data ManagementAutomationYour Laboratory Process
24•7
Acusera 24•7 Connect is a fully automated connectivity solution designed to securely and efficiently import QC data from a laboratory’s instrument, LIS or middleware to both Acusera 24•7 Web and Desktop services

Affiliate groupA collection of laboratories or a laboratory chaingrouped together on Acusera 24•7 to form a consensusgroup in order to receive specific affiliate group reports.
BiasThe term bias refers to the difference between theexpected result and an accepted reference value.
Coefficient of variation (CV)The coefficient of variation (CV) is the relative standarddeviation i.e. the SD expressed as a percentage of themean. The CV reflects a ratio of the standard deviationto the concentration level, and therefore provides abetter estimate of method performance over a range ofconcentrations.
MeanThe arithmetic mean is calculated by dividing the sumof all results by the number of results. Your mean ispresented as monthly or cumulative. The mean forcomparison (MFC) is used to calculate performancestatistics depending on the peer group you have chosen.
Peer groupA peer group consists of a number of laboratories usingthe same quality controls, methodology, instrument andreagents.
Percentage deviation (% deviation)Your % deviation from the mean comparison.
% Deviation = Result- MFC x 100%/MFC
Precision Precision refers to the reproducibility of test results andis a measure of how disperse the values are.
ShiftThe term shift is often used to describe an abrupt orsudden change in results.
Standard deviation (SD)The standard deviation of a normal distribution is ameasure of the scatter or dispersion of observations about the mean in the same units as the observations themselves. The standard deviation quantifies the degree of dispersion of data points around the mean.
Total errorTotal error represents the overall error that may occur in a test result due to both the imprecision (random error) and inaccuracy (systematic error) of the measurement procedure. It is commonly defined as;
Total error = Bias + ZSD.
Where bias is the estimate of systematic error, SD is the estimate of random error and Z is the multiplier that represents the desired confidence level.
Total error biological variationTotal error biological variation is a powerful tool used toset upper and lower limits of performance for each testbased on total allowable error using biological variationdata and the laboratories selected performance goals.
TrendThe term trend is used to describe a gradual change inQC results over time.
20
GLOSSARY OF TERMS

Standard Deviation Index (SDI)The standard deviation Index (SDI) expresses thedeviation of the participant’s result (in SD units) fromthe mean. The SDI facilitates the comparison of resultsfrom different tests at the same time, without havingto consider different units or magnitude of change.
An average SDI of 1.0 or greater indicates that the testresult shows a systematic difference from the group. TheIdeal SDI is zero, which would be the case if your resultexactly matched the peer group mean.
SDI = Mean – Peer Group Mean / SD of Peer Group Mean
Coefficient of Variation Index (CVI)CVI is an indicator of your precision and is calculated bydividing your CV% by the peer group %CV. The ideal CVIis <1, which is obtained when your %CV is less then thatof the peer group.
CVI = CV / Peer Group CV
21
PERFORMANCE STATISTICS

22
What is the speed?The speed depends on the laboratory’s local network,internet connection and other activities utilising thebandwidth.
How secure is Acusera 24•7?A number of security measures have been introducedsince the launch of the new Acusera 24•7 web version. Security features include automatic lock out after several failed log in attempts, encrypted passwords, individual role based accounts and recorded IP addresses.
Is any additional software required?Users must have access to a Java applet and haveseparate connectivity software.
How is the web version upgraded?All new Acusera 24•7 releases will be available onlineautomatically. Additional installation of software is notnecessary.
How much data can be stored?Data storage requirements will depend on the amountof QC data generated by the laboratory. At presentapproximately four million records required just 8GB ofdisc space. Users do not need to backup separately asRandox store all data securely.
What if the connection goes down?If connection is lost from the laboratories side all datawill be transferred to the web once reconnected, theprevious session will be remembered. Emergency powergenerators and dual high speed lines are in place atRandox HQ to ensure 99.8% uptime is guaranteed.
Is there a limitation to the number of concurrentusers?There is no limitation to the number of concurrent users;different servers are located globally to minimise lag times.
How many user levels are available?There are five user levels available; administrator, manager,user, coordinator and technical support. Coordinators will have access to all group data but cannot edit, delete or add any details.
How do I register for the web version?Register interest via www.acusera247.comAll participants will be registered on the host system;web users will be flagged and emailed a link to provideadministrator access. The administrator will then set upall other users with their access level, username andpassword.
What if I forget my username or password?If an individual with user level or manager level accessforgets their username and password they shouldcontact the administrator. If an administrator or groupcoordinator forgets their username or password theyshould contact technical support who will verify theadministrator and send a new link to the registered emailaccount.
How often is peer group data updated?Peer group data is updated on a daily basis providingusers with the latest performance data for their methodor instrument.
Is Acusera 24•7 available in any other languages?Yes, Acusera 24•7 is currently available in English, Spanish, Italian, French, Portuguese, Chinese, Polish, Korean, Russian and Slovakian. A unique software selection facility allows users to switch between languages if required.
FAQs

23
ACUSERA 24•7 SOFTWARE AND CONNECTIVITY SOLUTIONS
Randox offers two different solutions for participation in the Acusera 24•7 inter-laboratory data management programme. Acusera 24•7 Web eliminates the need to install and update software locally in your laboratory making it ideal for group installations while
our Acusera 24•7 Desktop is suited to laboratories that do not have access to the internet or have a limited internet connection. The table below is designed to help you determine which solution is best for your laboratory.
Type of Solution Acusera 24•7 Web Acusera 24•7 Desktop
Web service (internet based) Desktop Software
Platform
Hosted by Randox Installed on PC
Requirements
Internet Connection (For Peer Group Stats)
Connectivity Java applet
Reports and Charts
Summary of results
Audit Trail Report
Interactive Charts
Levey Jennings Chart
Multi Levey Jennings Chart
Histogram
Multi-Histogram Chart
Youden Charts Due 2012
Linearity Charts Due 2012
Performance Summary Charts
Peer Group Statistics
Statistical Report *
Supervisor Report *
Operator Report *
Bias and imprecision report
Data rejection report *
Manufacturer specific report *
Monthly evaluation report *
Affiliate Group Reports
Analytical Goals
Imprecision Biological Variation Due 2012
Total Error Biological variation Due 2012
Medical Relevance Due 2012
State of the Art Due 2012
Data Analysis *
Show data points exceeding SDI, CVR, Bias%, TE, TEB% + Sigma *
Evaluation mean and SD
Use of % instead of fixed SD *
Use of floating statistics to set a fixed mean or SD *
Enter expected responses for qualitative/semi-quantitative results *
QC statistics
Six Sigma Due 2012
Total Allowable Error Due 2012
Total Error Due 2012
Registration and setup
RiLiBAK functionality *
Westgard Advisor *
* Coming soon Please contact us if you would like further assistance or help deciding which solution is best for your laboratory

Randox Laboratories Limited, 55 Diamond Road, Crumlin, County Antrim, BT29 4QY, United KingdomT +44 (0) 28 9442 2413 F +44 (0) 28 9445 2912 E [email protected] I www.randox.com LT
244
JUN
12
The Acusera range of third party controls covers over 300 routine and specialised parameters.
Accurately target valuesRandox controls have the most accurately assigned target values and ranges available. This is made possible through access to a unique database of over 20, 000 independent laboratories.
Unrivalled stability Randox lyophilised controls have a shelf life of up to four years eliminating the problems associated with changing lot number and enabling long term QC monitoring. The extended working stability of many controls means they will meet and often exceed stability expectations.
Convenient and easy to use Many controls are available in liquid and liquid ready to use formats eliminating variability due to reconstitution errors.
Highest quality material The Acusera range of lyophilised controls contain no added preservatives or stabilisers which can cause interference. Furthermore all controls for use with antibody based methods are made from 100% human serum providing a matrix similar to the patient sample.
Consolidation With the Acusera range of multi-analyte controls you can dramatically reduce costs and the number of controls used in your laboratory by replacing multiple instrument specific controls with a single multi-analyser product.
Most consistent materialAdherence to strict manufacturing processes keeps variation between lots to a minimum.
Clinical Chemistry
Immunoassay
Urine Chemistry
Urinalysis
Lipids
Cardiac
Immunology/Proteins
Coagulation
Blood Gas
Diabetes
Therapeutic Drugs
Toxicology
Speciality/Research
Controls offering
• Global accreditation to ISO/IEC 17043
• Reduced parameter and reporting options available
• Comprehensive yet user friendly reports
• Reports available within 24-72 hours of final submission date
• Blind samples covering clinically relevant concentrations
• Extensive analyte menu enabling significant programme
consolidation
RANDOX INTERNATIONAL QUALITY ASSESSMENT SCHEME
Blood Gas
Cardiac
Clinical Chemistry
Coagulation
Glycated Haemoglobin
Haemataology
Human Urine
Immunoassay
Immunoassay Speciality I
Immunoassay Speciality II
Lipids
Liquid Cardiac
Maternal Screening
Serology (EBV)
Serology (HIV-Hepatitis)
Serology (Syphilis)
Serology (ToRCH)
Specific Proteins
Therapeutic Drugs
Urinalysis
Urine Toxicology
Programmes offering
RIQAS is the largest global EQA scheme with over 20, 000 participants in more than 100 countries worldwide.


