Interim Results Six months to 30 September 2015 -...
43
Interim Results Six months to 30 September 2015 11 November 2015
Transcript of Interim Results Six months to 30 September 2015 -...
Interim Results
Six months to 30 September 2015
11 November 2015

Disclaimer
2
This presentation, which has been prepared by ICAP plc ("ICAP"), is strictly confidential and is being provided to you solely for your information and comprises the written materials/slides for a
presentation concerning the proposed disposal of ICAP's global hybrid voice broking business to Tullett Prebon plc ("Tullett Prebon") (the "Proposed Transaction"). Where used in this document,
"Presentation" shall mean and include the slides that follow, the oral presentation of the slides by the ICAP's officers on behalf of ICAP, any question and answer session that follows the oral
presentation, hard copies of this Presentation and any materials distributed at, or in connection with, this Presentation.
Neither this Presentation nor any part of it, nor the fact of its distribution, shall form the basis of, or be relied on in connection with, any contract or commitment or investment decision in relation
thereto, nor does it constitute a recommendation regarding the shares of ICAP, Tullett Prebon, the combined company ("Enlarged Tullett Prebon") or the new holding company of the ICAP group
("NewCo"). Any decision to purchase must be made solely on the basis of the information gained from the recipients' own investigations and analysis of ICAP, NewCo, Tullett Prebon or Enlarged
Tullett Prebon. None of ICAP, its advisers, or any other party is under any duty to update or inform you of any change to such information. Shareholders should not base any voting decision in
connection with resolutions to authorise the Proposed Transaction except on the basis of information in any circular and/or prospectus (and any supplement(s) thereto) published in connection with
the Proposed Transaction, which information will supersede the information contained in this Presentation.
No reliance must be placed for any purpose whatsoever on the information contained in this Presentation, or any other information discussed verbally, or in its completeness (including, without
limitation, on the fairness, accuracy, completeness or correctness of the information or opinions contained herein) and it does not purport to contain all information that may be required to evaluate
ICAP or its business. No representation or warranty, express or implied, is or will be made as to, or in relation to, and no responsibility or liability is or will be accepted by or on behalf of ICAP or any
member of the ICAP's group (the "Group"), Evercore Partners International LLP, J.P. Morgan Limited or by any of their respective directors, officers, employees, agents, affiliates and advisers, or any
other person as to or in relation to the accuracy, fairness, correctness, sufficiency or completeness of the information or opinions contained in this Presentation (or any part hereof) or any other written
or oral information made available to, or publicly available to, any interested party or its advisers. Each of ICAP, Evercore Partners International LLP and J.P. Morgan Limited and each of their
respective directors, officers, employees, agents, affiliates and advisers accordingly disclaims to the fullest extent permitted by law all and any liability whatsoever, whether arising in tort, contract or
otherwise which it might otherwise have in respect of any statements or other information contained in this Presentation.
This Presentation contains certain statements which are, or may be deemed to be, "forward-looking statements" relating to the business, financial performance and results of ICAP, Tullett Prebon or
Enlarged Tullett Prebon and/or the industry in which they operate. These forward-looking statements involve substantial risks and uncertainties and actual results, levels of activity, performance,
achievements, developments and events may differ materially from those expressed or implied by these statements and depend on a variety of factors. By their nature, forward-looking statements
involve risk and uncertainty because they relate to future events and circumstances. The forward-looking statements concern future circumstances and results and other statements that are not
historical facts, sometimes identified by the words 'believes', 'expects', 'predicts', 'intends', 'projects', 'plans', 'estimates', 'aims', 'foresees', 'anticipates', 'targets', 'goals', 'due', 'could', 'may', 'should',
and similar expressions. These forward-looking statements include, without limitation, statements regarding future financial position, income growth, impairment charges, business strategy, projected
levels of growth in the relevant markets, projected costs, estimates of capital expenditures, and plans and objectives for future operations of ICAP, Tullett Prebon or Enlarged Tullett Prebon. Past
performance should not be taken as an indication or guarantee of future results, and no representation or warranty, express or implied, is made regarding future performance. No assurance can be
given that the forward-looking statements in this Presentation will be realised and these forward-looking statements speak only as at the date of this Presentation. ICAP or its directors, officers,
employees, agents, affiliates and advisers, or any other party undertakes no obligation publicly to release the results of any revisions or updates to any forward-looking statements in this Presentation
that may occur due to any change in its expectations or to reflect events or circumstances after the date of this Presentation (except to the extent required by applicable law or regulation or any
appropriate regulatory authority). As a result of these risks, uncertainties and assumptions, recipients should not place undue reliance on these forward-looking statements as a prediction of actual
results or otherwise. No statement in this Presentation is intended to be nor may be construed as a profit forecast.
The forward-looking statements, including assumptions, opinions and views of ICAP or cited from third party sources, contained in the half year results slides are solely opinions and forecasts which
are uncertain and subject to risks. Although ICAP believes that the expectations reflected in these forward-looking statements are reasonable, it can give no assurance that these expectations will
prove to be correct. Actual results may differ materially from those expressed or implied by these forward-looking statements. A number of factors could cause actual events to differ significantly.
These factors include, but are not limited to: volatility and changing conditions in financial markets; significant unexpected movements in interest and exchange rates; risk of disruption to existing client
relationships; adverse regulatory conditions being imposed on the transaction or significant delay in regulatory approval; difficulties in separating and integrating the respective businesses; unexpected
and greater costs arising out of the transaction.
Most of these factors are difficult to predict accurately and are generally beyond the control of ICAP. Any forward-looking statements made by, or on behalf of ICAP, speak only as of the date they
are made.
Evercore Partners International LLP, which is authorised and regulated in the United Kingdom by the Financial Conduct Authority, and J.P. Morgan Limited, which is authorised and regulated in the
United Kingdom by the Financial Conduct Authority, are acting exclusively for ICAP and NewCo and no one else in connection with the Proposed Transaction and will not regard any other person as a
client in relation to the Proposed Transaction and will not be responsible to anyone other than ICAP and NewCo for providing the protections afforded to their respective clients, nor for providing
advice, in relation to the Proposed Transaction or any other matter referred to in this Presentation.

Michael Spencer
Group Chief Executive Officer
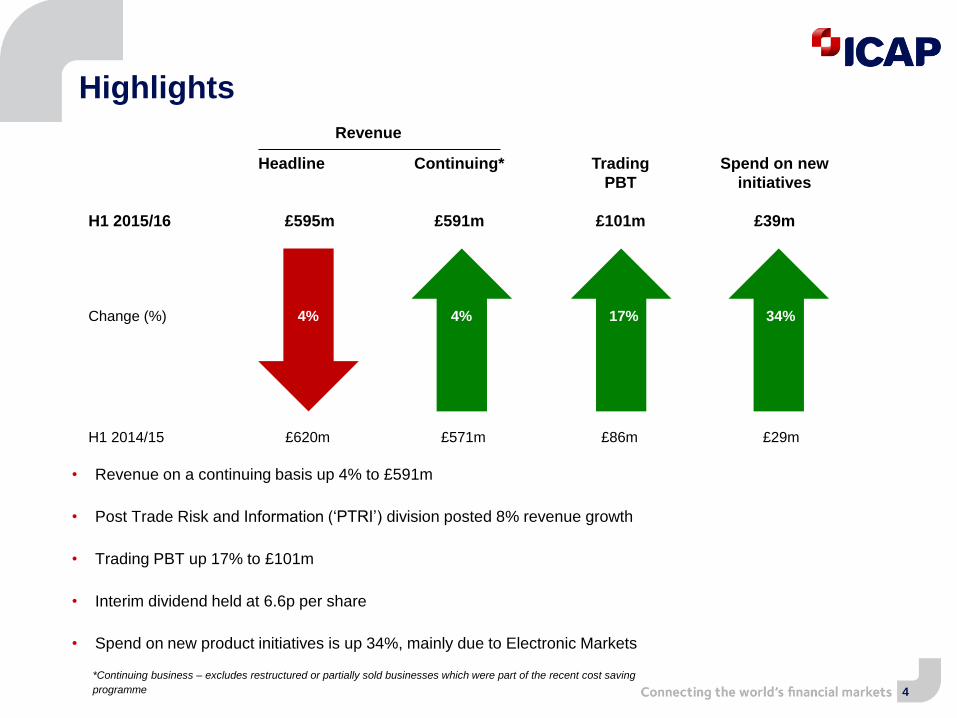
Revenue
H1 2015/16
Headline
£595m
Continuing*
£591m
Trading
PBT
£101m
Spend on new
initiatives
£39m
Change (%) 4% 4% 17% 34%
H1 2014/15 £620m £571m £86m £29m
• Revenue on a continuing basis up 4% to £591m
• Post Trade Risk and Information (‘PTRI’) division posted 8% revenue growth
• Trading PBT up 17% to £101m
• Interim dividend held at 6.6p per share
• Spend on new product initiatives is up 34%, mainly due to Electronic Markets
*Continuing business – excludes restructured or partially sold businesses which were part of the recent cost saving
programme
Highlights
4

Stuart Bridges
Group Finance Director

Group income statement
Headline results
6
Highlights
• Revenue down 4%, up 4% on a continuing
basis (up 1% on continuing/constant currency
basis)
• Expenses down 7%, up 1% on a continuing
basis (down 1% on continuing/constant
currency basis), as lower Global Broking
broadly offset by investment in Electronic
Markets / PTRI
• Trading PBT up 17% to £101m
• Despite significant new investment, margin up
3ppt
H1 H1 %
2015/16 2014/15 change
£m £m
Revenue 595 620 (4)
Net operating expense (485) (520) 7
Trading operating
profit110 100 10
Net finance charge (13) (18) 28
Associates & JV's 4 4 -
Trading Profit before tax 101 86 17
Trading operating
profit margin 19% 16% 3ppt
Interim dividend 6.6p 6.6p -
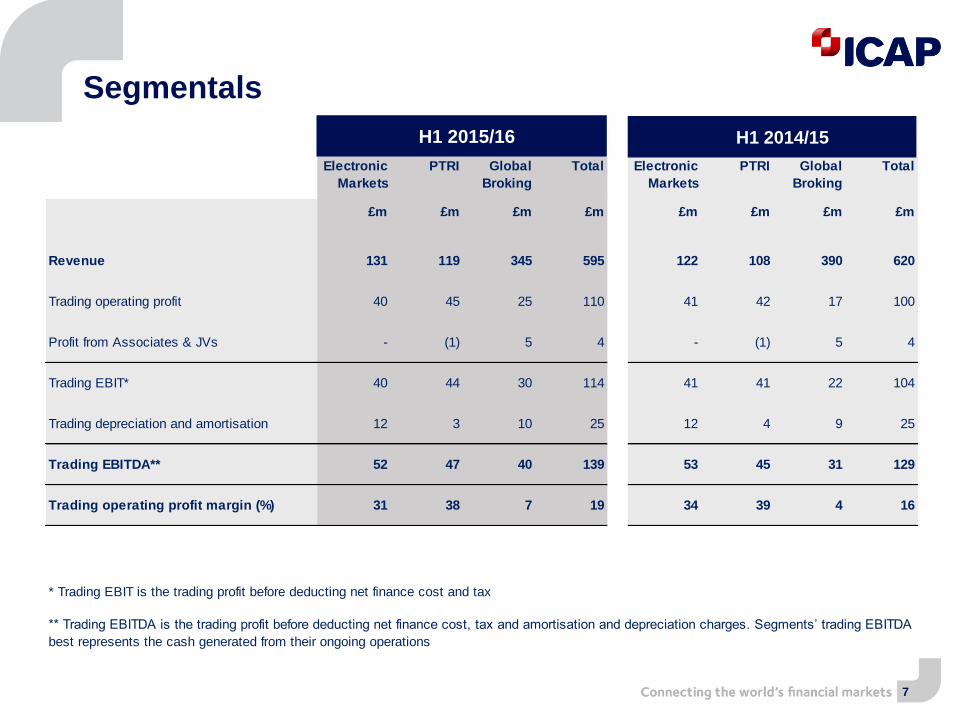
Electronic
Markets
PTRI Global
Broking
Total Electronic
Markets
PTRI Global
Broking
Total
£m £m £m £m £m £m £m £m
Revenue 131 119 345 595 122 108 390 620
Trading operating profit 40 45 25 110 41 42 17 100
Profit from Associates & JVs - (1) 5 4 - (1) 5 4
Trading EBIT* 40 44 30 114 41 41 22 104
Trading depreciation and amortisation 12 3 10 25 12 4 9 25
Trading EBITDA** 52 47 40 139 53 45 31 129
Trading operating profit margin (%) 31 38 7 19 34 39 4 16
* Trading EBIT is the trading profit before deducting net finance cost and tax
** Trading EBITDA is the trading profit before deducting net finance cost, tax and amortisation and depreciation charges. Segments’ trading EBITDA
best represents the cash generated from their ongoing operations
Segmentals
7
H1 2015/16 H1 2014/15
3
6
1
2
2
2
2
-
0 2 4 6 8 10 12
H12014/15
H12015/16
Electronic Markets Traiana TriOptima SEF
9
24
4
3
2
2
6
-
0 5 10 15 20 25 30 35
H12014/15
H12015/16
2%
4%6%
9%11%
3%
4%
6%
9%
12%
0%
5%
10%
15%
20%
25%
FY 201 1/12 FY 201 2/13 FY 201 3/14 FY 201 4/15 H1 2015/16
ElectronicMarkets
PTRI
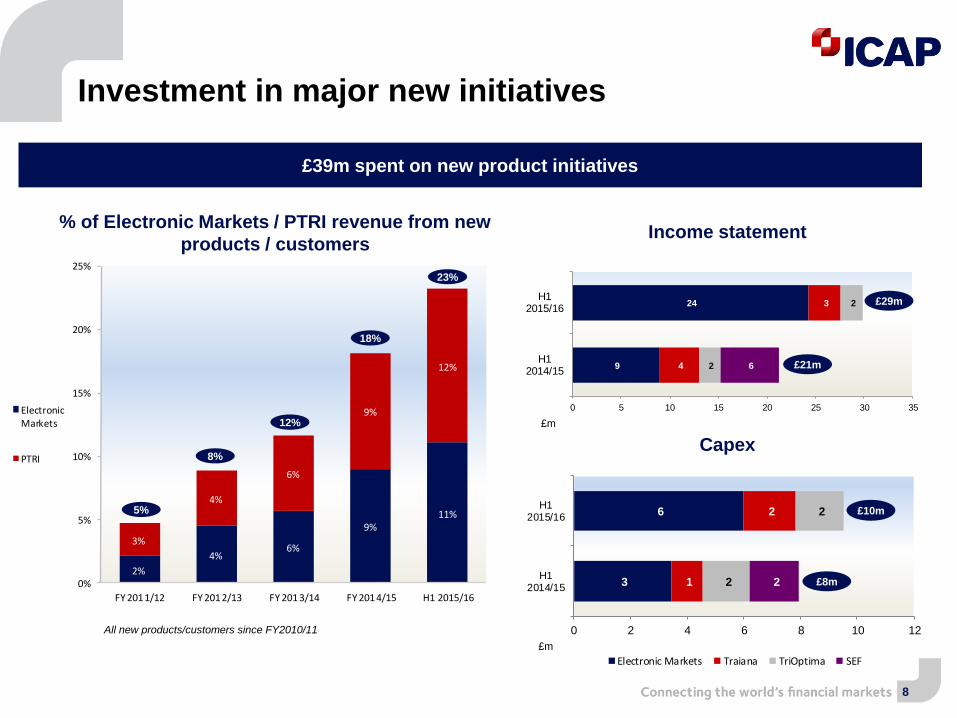
Investment in major new initiatives
£39m spent on new product initiatives
Income statement% of Electronic Markets / PTRI revenue from new
products / customers
23%
18%
12%
8%
5%
All new products/customers since FY2010/11
Capex
£29m
£21m
£10m
£8m
8
£m
£m

18%
18%
19%
20%
22%
12%
14%
15%
18%
20%
70%
68%
66%
62%
58%
0% 25% 50% 75% 100%
2011/12 FY
2012/13 FY
2013/14 FY
2014/15 FY
2015/16 H1
Electronic Markets PTRI Global Broking
34%
37%
37%
37%
36%
24%
29%
33%
38%
41%
42%
34%
30%
25%
23%
0% 25% 50% 75% 100%
2011/12 FY
2012/13 FY
2013/14 FY
2014/15 FY
2015/16 H1
Electronic Markets PTRI Global Broking
ICAP’s business mix
Revenue split
Trading operating profit margin by business
9
Operating profit split
• Electronic Markets / PTRI operating profit split up 19ppt to 77% from 58% 2011/12 FY
• Margins impacted by continued investment, £29mnew product initiative spend in Electronic Markets (£24m) / PTRI (£5m)
• Electronic Markets / PTRI revenue split up 12ppt to 42% from 30% 2011/12 FY
42% 42%40%
36%34%
31%
44% 43%45%
43%
39% 38%
13%11% 10%
8%4%
7%
0%
10%
20%
30%
40%
2011/12 FY 2012/13 FY 2013/14 FY 2014/15 FY 2014/15 H1 2015/16 H1
Electronic Markets PTRI Global Broking
FY H1

0%
5%
10%
15%
20%
25%
FY 2011/12 FY 2012/13 FY 2013/14 FY 2014/15 H1 2015/16
H1 H1 %
2015/16 2014/15 change£m £m
Revenue 131 122 7
Constant currency 130 1
Trading operating
profit40 41 (2)
Trading operating
profit margin 31% 34% (3ppt)
£64m£64m
£3m
£56m
£62m
£4m
EBS
BrokerTec
Other
Electronic Markets
Headline
10
H1 2014/15 H1 2015/16
£122m £131m
Revenue mix% of Electronic Markets revenue from new customers /
products
• Revenue up 1% on a constant currency basis, EBS up 7%, and BrokerTec down 3%
• Significantly increased FX volume in Asian currencies partially offset by cyclical pressures
• Margins down 3ppt owing to new product initiative spend of £24m investment in EBS Direct, forwards and swaps and BrokerTec Direct
Highlights
21%
17%
10%
8%
4%
All new products/customers since FY2010/11

0%
5%
10%
15%
20%
25%
FY 2011/12 FY 2012/13 FY 2013/14 FY 2014/15 H1 2015/16
29
35
34
40
25
26
20
18
0 20 40 60 80 100 120 140
H1 2014/15
H1 2015/16
TriOptima Information Traiana Reset/ReMatch
H1 H1 %
2015/16 2014/15 change
£m £m
Revenue 119 108 10
Constant currency 110 8
Trading operating
profit45 42 7
Trading operating
profit margin38% 39% (1ppt)
Post Trade Risk & Information
Headline Highlights
Revenue by product
11
• Revenue up 8% on a constant currency basis,
underpinned by TriOptima growth due to increased
demand for compression and reconciliation
• Reset affected by market headwinds from low volatility
• Margins slightly lower, new product initiative spend £5m
• Transaction v Subscription split 35% / 65%
% of PTRI revenue from new customers / products
25%
20%
13%
10%
6%
All new products/customers since FY2010/11
18% 10%21% 4%
£m

16 20 25 3016 16
2839 28
3012
13 1816
19
11
1127
27
23
18
68
84
37
37
1412
0
50
100
150
200
H1 2016 H1 2015 H1 2016 H1 2015 H1 2016 H1 2015
EMEA Americas Asiapac
Emerging markets Commodities Credit FX&MM Equities Rates
59%58% 58%
56%
50%
44%
46%
48%
50%
52%
54%
56%
58%
60%
H1 2011/12 H1 2012/13 H1 2013/14 H1 2014/15 H1 2015/16
Global Broking
Headline
12
Highlights
• Revenue on a continuing basis flat despite adverse
market conditions
• Broker compensation 50%
• Margin up 3ppt driven by cost savings
• Growth in Asia-Pacific region and Equities
Revenue by region
50
144
128
202
167
44
Broker Compensation
H1 H1 %
2015/16 2014/15 change
£m £m
Revenue 345 390 (12)
Constant currency 400 (14)
Trading operating
profit25 17 47
Trading operating
profit margin7% 4% 3ppt
Broker compensation 50% 56% (6ppt)
£m
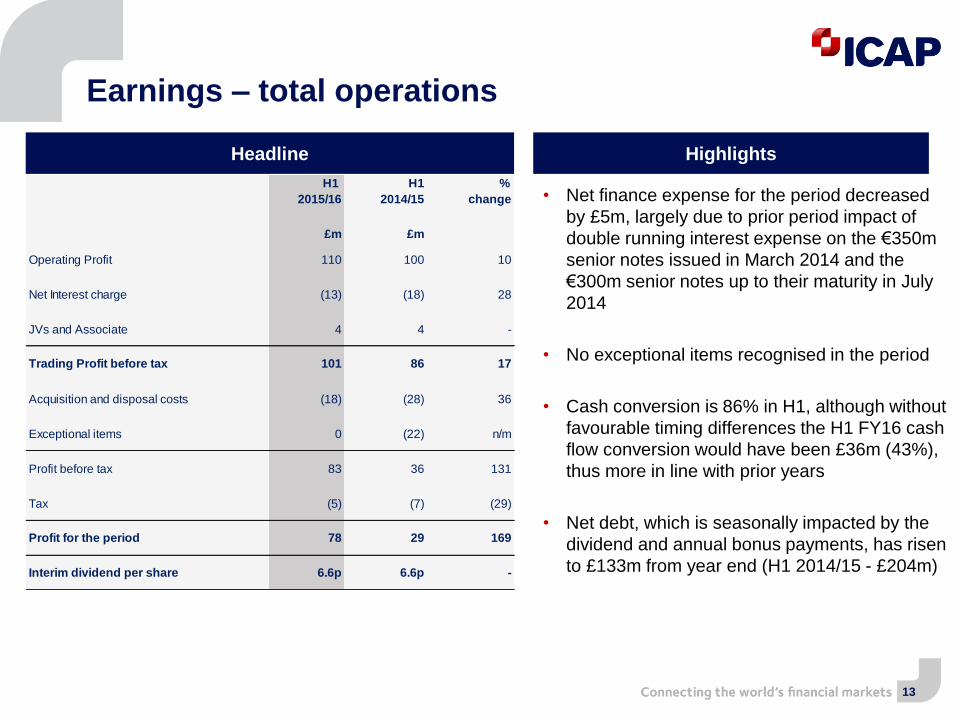
Earnings – total operations
Headline Highlights
• Net finance expense for the period decreased
by £5m, largely due to prior period impact of
double running interest expense on the €350m
senior notes issued in March 2014 and the
€300m senior notes up to their maturity in July
2014
• No exceptional items recognised in the period
• Cash conversion is 86% in H1, although without
favourable timing differences the H1 FY16 cash
flow conversion would have been £36m (43%),
thus more in line with prior years
• Net debt, which is seasonally impacted by the
dividend and annual bonus payments, has risen
to £133m from year end (H1 2014/15 - £204m)
13
H1 H1 %
2015/16 2014/15 change
£m £m
Operating Profit 110 100 10
Net Interest charge (13) (18) 28
JVs and Associate 4 4 -
Trading Profit before tax 101 86 17
Acquisition and disposal costs (18) (28) 36
Exceptional items 0 (22) n/m
Profit before tax 83 36 131
Tax (5) (7) (29)
Profit for the period 78 29 169
Interim dividend per share 6.6p 6.6p -
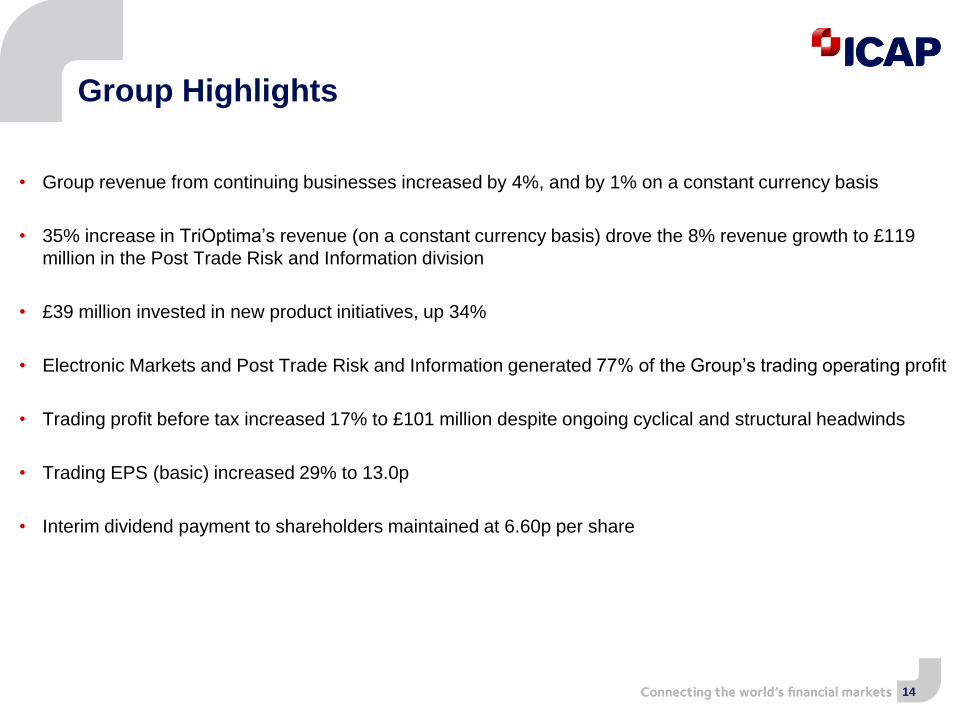
Group Highlights
• Group revenue from continuing businesses increased by 4%, and by 1% on a constant currency basis
• 35% increase in TriOptima’s revenue (on a constant currency basis) drove the 8% revenue growth to £119
million in the Post Trade Risk and Information division
• £39 million invested in new product initiatives, up 34%
• Electronic Markets and Post Trade Risk and Information generated 77% of the Group’s trading operating profit
• Trading profit before tax increased 17% to £101 million despite ongoing cyclical and structural headwinds
• Trading EPS (basic) increased 29% to 13.0p
• Interim dividend payment to shareholders maintained at 6.60p per share
14

Transaction Overview
Michael Spencer
Group Chief Executive Officer
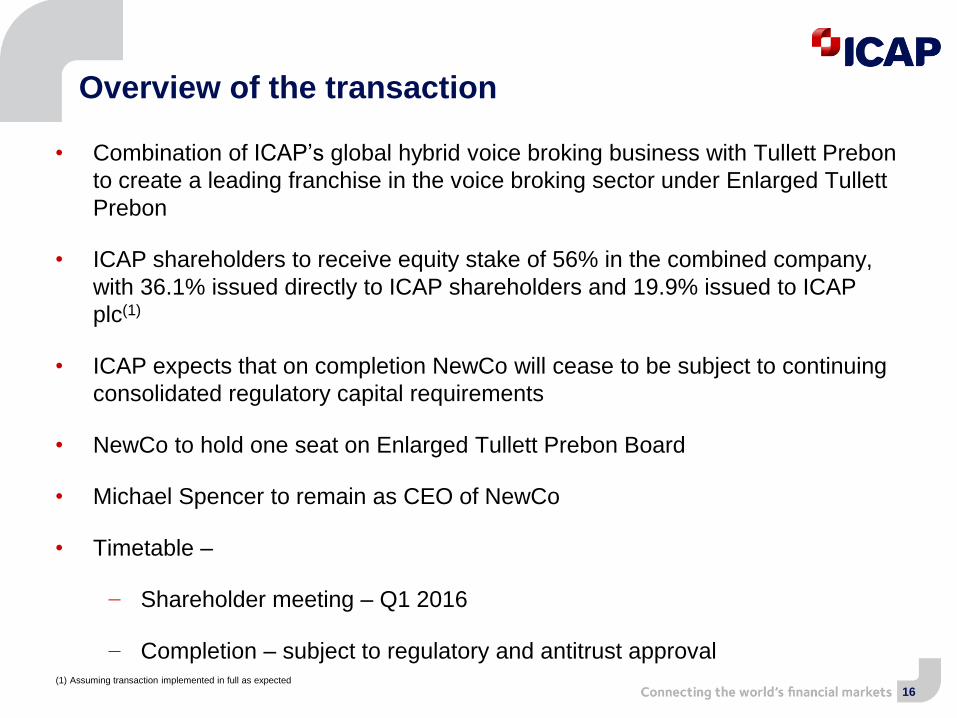
Overview of the transaction
16
• Combination of ICAP’s global hybrid voice broking business with Tullett Prebon
to create a leading franchise in the voice broking sector under Enlarged Tullett
Prebon
• ICAP shareholders to receive equity stake of 56% in the combined company,
with 36.1% issued directly to ICAP shareholders and 19.9% issued to ICAP
plc(1)
• ICAP expects that on completion NewCo will cease to be subject to continuing
consolidated regulatory capital requirements
• NewCo to hold one seat on Enlarged Tullett Prebon Board
• Michael Spencer to remain as CEO of NewCo
• Timetable –
− Shareholder meeting – Q1 2016
− Completion – subject to regulatory and antitrust approval(1) Assuming transaction implemented in full as expected
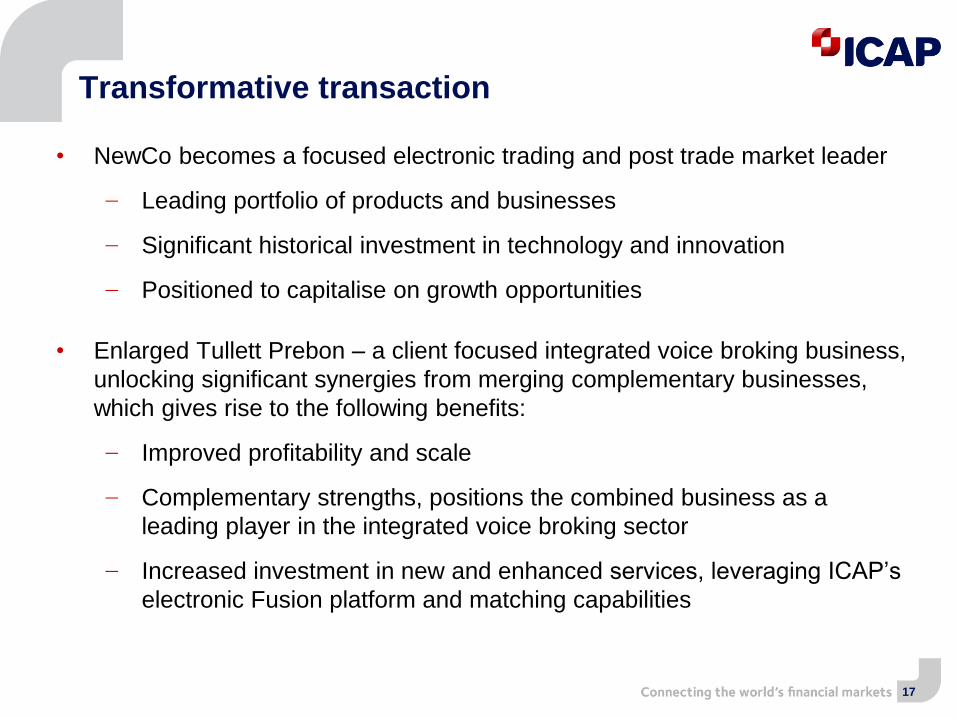
Transformative transaction
17
• NewCo becomes a focused electronic trading and post trade market leader
− Leading portfolio of products and businesses
− Significant historical investment in technology and innovation
− Positioned to capitalise on growth opportunities
• Enlarged Tullett Prebon – a client focused integrated voice broking business,
unlocking significant synergies from merging complementary businesses,
which gives rise to the following benefits:
− Improved profitability and scale
− Complementary strengths, positions the combined business as a
leading player in the integrated voice broking sector
− Increased investment in new and enhanced services, leveraging ICAP’s
electronic Fusion platform and matching capabilities

18
• 56% ownership stake represents attractive valuation of
ICAP’s global hybrid voice broking business, reflecting
its strong market position and prospects
Drivers of ICAP value creation
Attractive
transaction
terms for ICAP
shareholders
Synergies
Capital benefits
• Approximately £60m+ in annual synergies to Enlarged
Tullett Prebon shareholders
• 67-75% of expense savings realisable within two years
of transaction closing
• NewCo is expected to operate with a more capital-light
business model
• ICAP expects that on completion NewCo will cease to be
subject to continuing consolidated regulatory capital
requirements

NewCo – A focused
electronic and post
trade services group

20
• Leading portfolio at the heart of financial market infrastructure
• Drive expansion of addressable market through continuing product
development and broadening of geographic reach and customer base
• Offers solutions that are integrated into the workflow of our customers
• Increasing level of recurring subscription revenue
• Benefiting from regulatory-driven increased demand for post trade / risk
mitigation solutions and electronic trading infrastructure
• Management has strong track record of innovation
NewCo – A focused electronic and post trade services group

Post trade FX processing
21
Leading portfolio at the heart of financial market infrastructure
Derivatives portfolio compression and portfolio reconciliation franchises
Electronic trading platform in US Treasuries and repos
Electronic spot FX trading platform in EUR/USD, USD/JPY, Asian
NDFs and CNH
Basis risk management
Leading
position
Leading portfolio of early stage fin tech assets

22
Ac
qu
isit
ion
sP
rod
uct
lau
nch
es
Gro
wth
d
rive
rs(1
)
BTEC / EBS growth in algorithmic
trading / non-bank customers
Growth of FX
prime brokerage
underpins growth
of Traiana
Basel III / SLR
drives increased
demand for
compression
EMIR requirements
for portfolio
reconciliation
underpins triResolve
Market share gains /
migration from voice
drives growth of EM
currencies on EBS
20022004
20052006
20072008
20092010
20112012
2013
2014
2015
2016
Launch of
triResolve
Launch
of EBS
Direct
TriOptima
launches
bilateral
compression
TriOptima
launches CCP
compression
Launch of
Traiana
CreditLink
LimitHub Launch
of EBS
eFix
Launch of
EBS Select
TriOptima
expands
compression
to CME, JSCC
& FX forwards
EBS Direct
for FX
forwards /
corporates
2003
30%
stake in
TriOptima
BrokerTec –
£180m
EBS – £465m,
Reset – 25% stake
Traiana –
£120m
Remaining stake
in TriOptima –
£95m, stake in
AcadiaSoftMyTreasury
Remainder of Reset
in 3 tranches –
£143m
Investment
in Duco
Investment in
OpenGamma
Investments
in Enso
Further investment
in AcadiaSoft,
investment in
Abide Financial
Banks invest in
Traiana with implied
valuation of £185m
Strong track record of innovation
Launch of
BrokerTec
Direct
£1bn on acquisitions which now generate ~£170m of trading operating profit(1) Ranges are an approximation for the estimated start of each respective trend

23
Post Trade Risk Information
NewCo
• FY ‘15 revenue: £254m
• FY ‘15 trading operating profit: £102m
Michael SpencerGroup CEO
Electronic Markets
Gil MandelzisCEO
Jenny KnottCEO
• FY ‘15 revenue: £187m
• FY ‘15 trading operating profit: £70m
Charles GregsonNon-executive Chairman
Stuart BridgesGroup CFO
NewCo organisational chart
Steve GibsonCEO
Euclid Opportunities
Non-executive Directors
• John Sievwright
• Diane Schueneman
• Robert Standing
• Ivan Ritossa
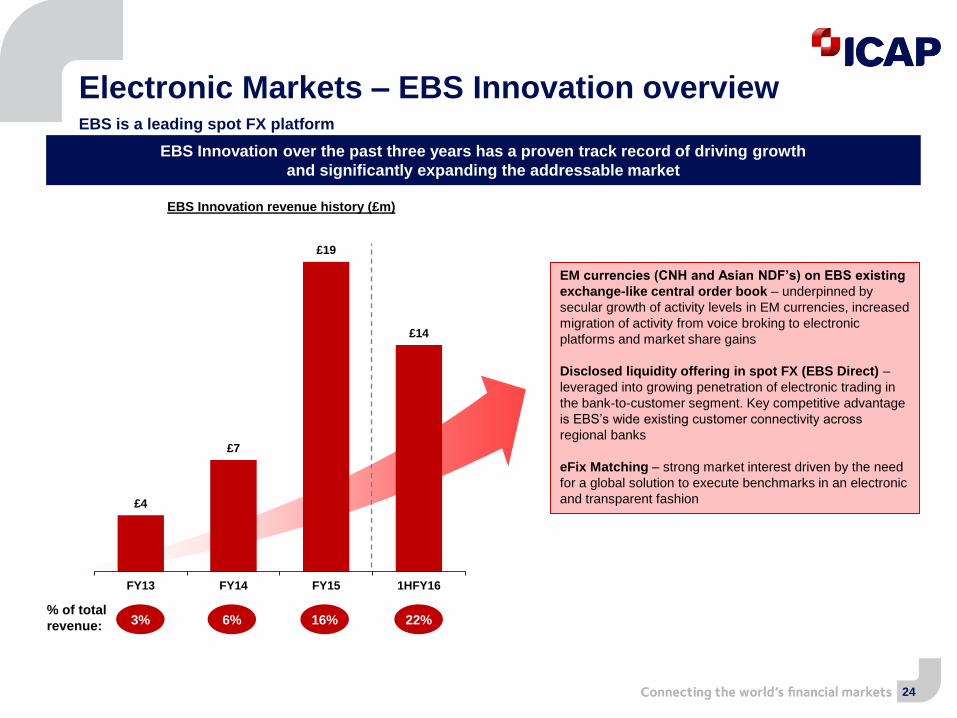
3% 6% 16% 22%
£4
£7
£19
£14
FY13 FY14 FY15 1HFY16
EBS Innovation revenue history (£m)
Electronic Markets – EBS Innovation overviewEBS is a leading spot FX platform
24
EBS Innovation over the past three years has a proven track record of driving growth
and significantly expanding the addressable market
% of total
revenue:
EM currencies (CNH and Asian NDF’s) on EBS existing
exchange-like central order book – underpinned by
secular growth of activity levels in EM currencies, increased
migration of activity from voice broking to electronic
platforms and market share gains
Disclosed liquidity offering in spot FX (EBS Direct) –
leveraged into growing penetration of electronic trading in
the bank-to-customer segment. Key competitive advantage
is EBS’s wide existing customer connectivity across
regional banks
eFix Matching – strong market interest driven by the need
for a global solution to execute benchmarks in an electronic
and transparent fashion

60
70
80
90
100
110
120
130
140
150
160
EBS Total EBS Market G3 Reuters Hotspot CME
Spot FX market
$5.3tn$5.3tn
Total FX market Total FX market
Voice
Electronic
Undistributed
$87bn $18bn
EBS Market EBS Direct
Electronic Markets – The EBS growth opportunity
Source: BIS Triannual Survey and company filings / websites
Note: Total FX market ADV for CY2013 period, and EBS ADV for LTM September 2015 (ICAP latest trading results)
25
EBS has a strong position in the spot FX IDB market…
By product By execution method
Spot
Forwards
FX Swaps
Other
$2.0tn
EBS Market /
Direct have a
sizable opportunity
in the Spot FX
market
This opportunity
expands as EBS
adds additional
products
Opportunity overview
(Average Daily Volume)
EBS vs Competitors Monthly ADV – Indexed• Building from EBS’s proven track record in
innovation, EBS has a significant opportunity to
expand its strong position in the broader FX market
− FX forwards / swaps – to be launched on EBS
Direct this year
− Corporates – currently in customer trials,
leveraging MyTreasury corporate relationships
− Asset managers – recent Molten Markets
acquisition will deepen relationships with asset
managers
… with substantial room to expand in the broader FX market

$170bn
$500bn
BrokerTec US Treasury Total US Treasury market
Electronic Markets – BrokerTec highlightsElectronic trading platform in Govt bonds and repos
Source: SIFMA and company filings / websites
Note: US Treasury ADV for CY 2014 period, and BrokerTec ADV for LTM September 2015 (ICAP latest trading results)
26
BrokerTec has a leading position in US Treasury…
0
2,000
4,000
6,000
8,000
10,000
12,000
14,000
0.0%
2.0%
4.0%
6.0%
8.0%
10.0%
12.0%
14.0%
2005 2006 2007 2008 2009 2010 2011 2012 2013 2014
Ou
tsta
nd
ing
($
bn
)
Ve
loc
ity (
AD
V /
Ou
tsta
nd
ing
%)
… which is trading at a historic low level of velocity
BrokerTec competitive positioning / opportunity
• BrokerTec has a strong position in interbank US
Treasury, US Repo, and European Repo products
• Meaningful opportunities exist for expansion into other
fixed income instruments
• BrokerTec Direct is expected to significantly expand
customer base (asset managers, regional banks, etc.)
Benefits of combining with EBS
• BrokerTec’s recent merger with EBS provides an
opportunity to leverage EBS’s experience in
innovation and driving growth across both businesses
• Operational synergies associated with this
combination:
− Sales – EBS sales force trained to sell BrokerTec
products
− Technology – BrokerTec Direct leverages
footprint of BrokerTec Market and platform
architecture of EBS Direct
− Engineering / other – operational cost savings
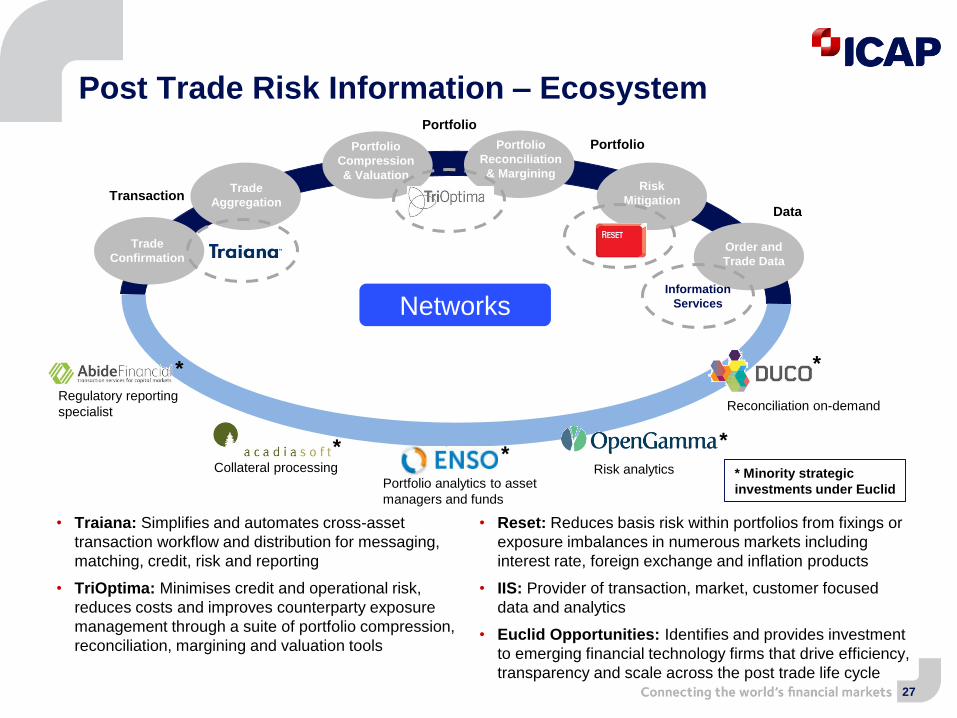
Post Trade Risk Information – Ecosystem
27
Networks
Trade
Confirmation
Trade
Aggregation
Portfolio
Compression
& Valuation
Portfolio
Reconciliation
& MarginingRisk
Mitigation
Order and
Trade Data
Transaction
Portfolio
Portfolio
Data
Information
Services
Reconciliation on-demand
Risk analyticsPortfolio analytics to asset
managers and funds
Collateral processing
Regulatory reporting
specialist
• Traiana: Simplifies and automates cross-asset
transaction workflow and distribution for messaging,
matching, credit, risk and reporting
• TriOptima: Minimises credit and operational risk,
reduces costs and improves counterparty exposure
management through a suite of portfolio compression,
reconciliation, margining and valuation tools
• Reset: Reduces basis risk within portfolios from fixings or
exposure imbalances in numerous markets including
interest rate, foreign exchange and inflation products
• IIS: Provider of transaction, market, customer focused
data and analytics
• Euclid Opportunities: Identifies and provides investment
to emerging financial technology firms that drive efficiency,
transparency and scale across the post trade life cycle
*
* **
*
* Minority strategic
investments under Euclid
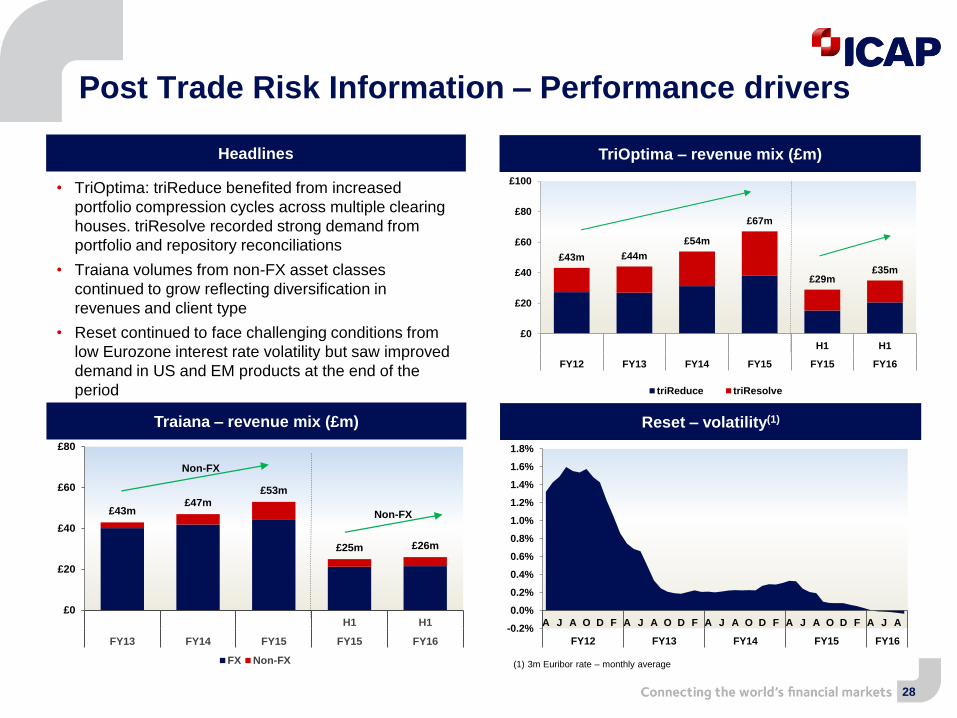
Post Trade Risk Information – Performance drivers
TriOptima – revenue mix (£m)Headlines
• TriOptima: triReduce benefited from increased
portfolio compression cycles across multiple clearing
houses. triResolve recorded strong demand from
portfolio and repository reconciliations
• Traiana volumes from non-FX asset classes
continued to grow reflecting diversification in
revenues and client type
• Reset continued to face challenging conditions from
low Eurozone interest rate volatility but saw improved
demand in US and EM products at the end of the
period
Reset – volatility(1)Traiana – revenue mix (£m)
-0.2%
0.0%
0.2%
0.4%
0.6%
0.8%
1.0%
1.2%
1.4%
1.6%
1.8%
A J A O D F A J A O D F A J A O D F A J A O D F A J A
FY12 FY13 FY14 FY15 FY16
£43m £47m
£53m
£25m £26m
£0
£20
£40
£60
£80
H1 H1
FY13 FY14 FY15 FY15 FY16
FX Non-FX
Non-FX
Non-FX
£43m £44m
£54m
£67m
£29m £35m
£0
£20
£40
£60
£80
£100
H1 H1
FY12 FY13 FY14 FY15 FY15 FY16
triReduce triResolve
28
(1) 3m Euribor rate – monthly average

0%
20%
40%
60%
80%
100%
120%
140%
H1 H1
FY13 FY14 FY15 FY15 FY16
FX Non-FX
47m 41m 44m45m39m
Post Trade Risk Information – Positioned for growth
29
TriOptimaHeadlines
300
800
1,300
1,800
2,300
2,800
-
20
40
60
80
100
120
140
160
H1 H1
FY12 FY13 FY14 FY15 FY15 FY16
(nu
mb
er
of
us
ers
)
($tn
)
triReduce - compressions triResolve - active users
Traiana – average monthly transactions
• Well positioned to take advantage of key industry
trends:
− Regulation – Electronification - Standardisation
of Products and Services
• Expanding asset classes and client offering:
− Connecting triReduce to new clearing houses
− Increasing non-FX transactions in Traiana
• Growing client base:
− triResolve more than doubled number of
clients in last 2 years to 1,500+
− Traiana reported double digit growth in client
activity across all assets
• Focus on new products and services:
− Bilateral margining product – bilateral OTC
swaps regulatory requirement for margining
− triCalculate valuation product – assist banks to
measure counterparty risk
− Comprehensive Regulatory Reporting
Solutions
• Euclid will continue to focus on identifying and
nurturing emerging opportunities that compliment
the Post Trade offering
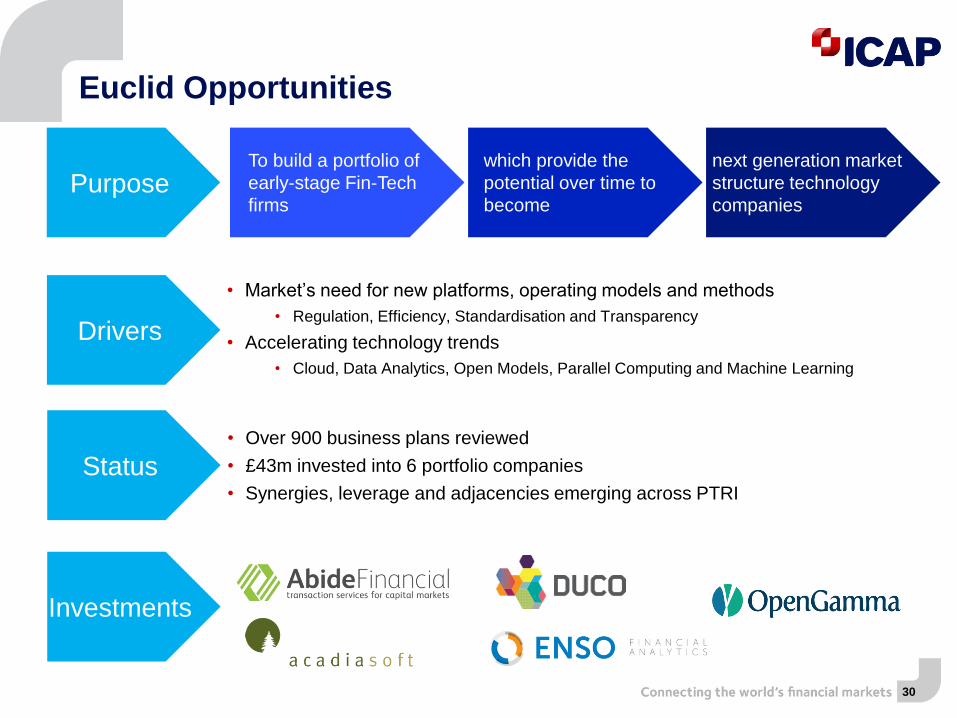
30
Euclid Opportunities
PurposeTo build a portfolio of
early-stage Fin-Tech
firms
which provide the
potential over time to
become
next generation market
structure technology
companies
Drivers
• Market’s need for new platforms, operating models and methods
• Regulation, Efficiency, Standardisation and Transparency
• Accelerating technology trends
• Cloud, Data Analytics, Open Models, Parallel Computing and Machine Learning
Status• Over 900 business plans reviewed
• £43m invested into 6 portfolio companies
• Synergies, leverage and adjacencies emerging across PTRI
Investments

Financial impact of the transaction
Stuart Bridges
Group Finance Director

Key financial strengths of NewCo
32
Historical revenue (£m)Financial highlights
% of revenue from new products and new customers(1)
• New products and new customers added since
FY2011 now account for over 20% of total
revenue
• Electronic markets revenues well diversified
− 29% of revenues are recurring in nature
− 36% of revenues from non-bank
customers
• Post trade risk mitigation revenues
− 50% of revenues are recurring in nature
− 5% organic revenue growth over the past
four years
• Well capitalised giving flexibility to take
advantage of growth opportunities
£98
£186 £243 £245 £246
£293 £289 £261 £257 £254 £4
£31
£51 £96 £113
£151 £172 £171 £174 £187
£102
£217
£294
£341 £359
£444 £461
£432 £431 £441
FY06 FY07 FY08 FY09 FY10 FY11 FY12 FY13 FY14 FY15
Electronic Post trade
1%
4%
8%
11%
17%
22%
FY11 FY12 FY13 FY14 FY15 1H16
(1) Based on launched / relaunched products since FY11

Electronic Markets
FY13
£m
FY14
£m
FY15
£m
% CAGR
(FY13 to
FY15)
Revenue 261 257 254 (1%)
Constant currency 254 254 (0%)
Trading operating
profit115 111 102 (6%)
Constant currency 112 110 (5%)
Trading operating
profit margin44% 43% 40%
33
Financial highlightsTrading results
Revenue by business (£m) P&L / cash investment in new products (£m)
£124 £122 £139
£128 £133 £121
£2 £2 £1 £254 £257 £261
FY15FY14FY13
EBS BrokerTec ISDX
£23 £22
£3
£16
£13 £13
FY15 FY14 FY13
Total cash spend Income statement
• This business has faced cyclical headwinds over the
past few years due to a depressed trading
environment in foreign exchange and fixed income
• Despite these headwinds, a significant level of
investment has been made in new and existing
products to drive the future growth of the business
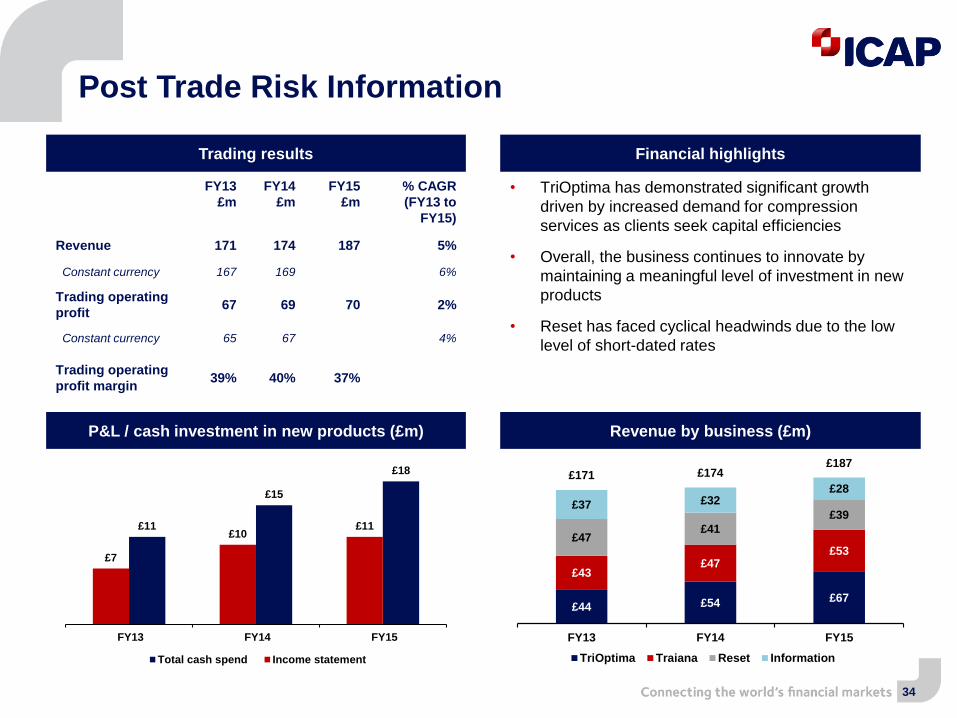
FY13
£m
FY14
£m
FY15
£m
% CAGR
(FY13 to
FY15)
Revenue 171 174 187 5%
Constant currency 167 169 6%
Trading operating
profit67 69 70 2%
Constant currency 65 67 4%
Trading operating
profit margin39% 40% 37%
Post Trade Risk Information
34
£67 £54 £44
£53 £47
£43
£39
£41 £47
£28 £32 £37
£187 £174 £171
FY15FY14FY13
TriOptima Traiana Reset Information
Financial highlightsTrading results
Revenue by business (£m) P&L / cash investment in new products (£m)
£18
£15
£11 £11 £10
£7
FY15 FY14 FY13
Total cash spend Income statement
• TriOptima has demonstrated significant growth
driven by increased demand for compression
services as clients seek capital efficiencies
• Overall, the business continues to innovate by
maintaining a meaningful level of investment in new
products
• Reset has faced cyclical headwinds due to the low
level of short-dated rates
• Balance sheet – NewCo is expected to operate with a more capital-light
business model. On completion NewCo will cease to be subject to
continuing consolidated regulatory capital requirements
• Dividend policy – Our policy is to maintain a progressive dividend in line
with our view of the underlying earnings and cash flow of NewCo
• Capex – To be in line with historical levels for the Electronic and Post
Trade businesses
35
NewCo key financials

Summary
Michael Spencer
Group Chief Executive Officer

37
Summary
• Strong investment track record – acquired NewCo businesses for
£1bn which now generate ~£170m of trading operating profit
• A portfolio of leading financial market infrastructure – major
businesses are all leading providers in respective segments
• Management team with strong track record of innovation – 20%+ of
revenues come from new products / customers in the last five years

Q&A

Appendix

Financial bridge (FY15)
40
Post Trade Risk Information (£m)Electronic Markets (£m)
£259
(£5)
£254
Current(Per ICAP)
iSwap adjustment Pro Forma
£93 £9 £102
Current(Per ICAP)
iSwap adjustment Pro Forma
£228
(£41)
£187
Current(Per ICAP)
Global Broking Dataadjustment
Pro Forma
£97
(£27)
£70
Current(Per ICAP)
Global Broking Dataadjustment
Pro Forma
Revenue bridge Revenue bridge
Trading operating profit bridge Trading operating profit bridge

41
A leading portfolio
• BrokerTec - a global electronic platform for the trading of US Treasuries, US Repos, and
European Repos. BrokerTec facilitates trading for institutions, banks and non-bank professional
trading firms.
• EBS - an electronic FX business, which is a reliable and trusted source of orderly, executable and
genuine liquidity across major and emerging market currencies. It supports multiple execution
methods and multiple ways of trading through a common distribution network.
• TriOptima - through triReduce and triResolve, is a leader in risk mitigation solutions for OTC
derivatives, primarily through the elimination and reconciliation of outstanding transactions.
• Information Services delivers independent data solutions to financial market participants,
generating subscription-based fees from a suite of products and services.
• Traiana - the leading market infrastructure for pre and post trade risk management and post trade
processing across multiple asset classes. Its robust and proven product suite automates trade
processing across the life cycle for FX, cash equities, equity swaps, futures, OTC derivatives and
fixed income.
• Reset - a provider of services that reduce the basis risk within portfolios from fixings in the interest
rate, FX and inflation derivatives and bonds markets. Basis risk results from the structure of the
instruments traded and unintended mismatches of exposure over time.

110
139129
101
72
4 25
36
4
(46) (28)
(33)
0
20
40
60
80
100
120
140
Trading
operating
profit
JVs & Associates Depreciation
&
amortisation
EBITDA Movement in
working
capital
Timing
differences
Cash from
trading
operations
Interest
&
tax
Cash from
trading operating
activities
Capex Dividends
from
associates &
invesments
Trading
free cash
flow
47
227
12
139
14
120
72
0
25
50
75
100
125
150
175
200
225
250
H1 2012/13 H2 2012/13 H1 2013/14 H2 2013/14 H1 2014/15 H2 2014/15 H1 2015/16
H1 2015/16 H2 2014/15 H1 2014/15
£m £m £m
Long term facilities (816) (811) (832)
Short term facilities and loans (55) (130) (175)
Overdrafts (7) (33) (23)
Less: undraw n 252 425 410
Gross debt (626) (549) (620)
Trading cash 453 441 413
Central cash 40 40 3
Gross cash 493 481 416
Net debt (133) (68) (204)
Restricted funds 34 43 47
** Includes net impact of unsettled items and changes in restricted funds
Free cash flow & borrowings – ICAP plc only
42
£m
Impact of trading activities on free cash flow
Historic cash conversion
**
Application of free cash flow
£m
Cash and debt
152%
22%
129%
47%
203%
12%
86%

ICAP plc
2 Broadgate, London EC2M 7UR
+44 (0) 20 7000 5000
www.icap.com
Investor Relations:Alex Dee+44 (0) 20 7050 [email protected]