INTERIM RESULTS - s3-eu-west-1.amazonaws.com · Gross profit Gross profit was £106.2m for the nine...
18
INTERIM RESULTS McLAREN HOLDINGS LTD NINE MONTHS ENDED 30 SEPT 2017
Transcript of INTERIM RESULTS - s3-eu-west-1.amazonaws.com · Gross profit Gross profit was £106.2m for the nine...
INTERIM RESULTS
McLAREN HOLDINGS LTDNINE MONTHS ENDED 30 SEPT 2017
TABLE OF CONTENTS
Business review and outlook ................................................................................................... 1
Recent developments and factors affecting comparability .................................................... 2
Financial review – income statement ....................................................................................... 4
Financial review – cash flow statement ................................................................................... 6
Consolidated profit and loss account ...................................................................................... 7
Consolidated statement of comprehensive income ............................................................... 7
Consolidated balance sheet ..................................................................................................... 8
Consolidated statement of changes in equity ......................................................................... 9
Consolidated statement of cash flows .................................................................................. 10
Notes to the financial statements .......................................................................................... 11
1
Business review and outlook
The McLaren Group is a global leader in luxury high performance and technology. The group is constituted from three divisions: Automotive, Racing and Applied Technologies.
Founded in 1963, the Racing division has been one of the most successful teams in motorsport history. Since its foundation, the team have won 20 Formula 1 World Championships, the Indy 500 three times and the Le Mans 24 Hour race.
The Automotive division first produced the iconic McLaren F1 road car in 1992 and more recently launched its new series of products in 2011 starting with the McLaren MP4-12C. Today, Automotive has a range of luxury high performance cars across three defined product families (Sports Series, Super Series and Ultimate Series) on offer and has produced further ground breaking cars such as the McLaren P1TM
and the McLaren 675LT. 2017 has been an extraordinary year for Automotive, updating the product range with the launch of a highly acclaimed new Super Series car (the McLaren 720S), a new Sports Series model (the 570S Spider) and a unique Ultimate Series car – the McLaren Senna. All current and future models continue to command premium pricing and a strong order bank.
The Applied Technologies division focuses on the application of McLaren’s technological know-how in a wider variety of fields. Starting from a successful motorsports division which to this day is still the sole supplier of Electronic Control Units to Formula 1, NASCAR, Indycar and Formula E. Applied Technologies has expanded to focus on three further market segments: Automotive, Public Transport and Health. Success in these areas has included taking our know-how in high speed data transmission from Formula 1 and applying it to public transport where we have worked with a number of train operating companies to design, test and introduce new systems that enable reliable high speed WIFI on UK trains. Applied Technologies is also working with new entrants to the connected and autonomous vehicle sectors.
2017 has been a transition year for the McLaren Group. Prior to July, the Group was two separate companies but with a common shareholding and heritage. McLaren Automotive was separate from the McLaren Technology Group, which contained the Racing and the Applied Technologies divisions. On the 20th July 2017, the two entities were brought together under McLaren Group Limited with the shareholders of the two companies taking ownership of the new company. The reconstruction also allowed Mr Dennis OBE, a long-term shareholder of McLaren, to exit the shareholder group. As the shareholding of both entities was not substantially changed by the transaction, the Group has taken the decision to apply merger accounting in these interim financial statements.
To finance the transaction, the Group issued a sterling bond of £370m and a dollar bond on $250m traded on the international stock exchange. The proceeds of the bonds were used to purchase the shares of Mr Dennis (£200m), refinance the debt of the combining entities (£223m), repay shareholder loans (£8m) and settle transaction fees (£38m). This netted £93m in cash to the new Group. The transaction also included further deferred consideration of £75m payable in December 2017 and August 2019.
In respect of operational performance, McLaren Automotive entered the year with three planned but important disruptions to production. The first was the implementation of a new Enterprise Resource Planning system, SAP, our long term technology partner. Production was halted for most of January to allow for the successful implementation of SAP and then output was affected throughout February 2017 as production returned to normal. The other disruptions were the launches of the second generation of the Super Series (McLaren 720S) and the Sports Series Spider (McLaren 570S Spider). The launch of the new Super Series completed the production life-cycle plan of McLaren Automotive but introduced a gap of six months as the old model was phased out and the McLaren 720S launched.
McLaren Racing started the third year of its partnership with Honda. Both parties were hopeful of improved performance in 2017 but this did not come to fruition.
2
Business review and outlook (continued)
McLaren Applied Technologies’ planned growth in 2017 continued. In particular, a new partnership with Deloitte was signed to develop products that solve complex industry challenges and improve clients’ business performance. Applied Technologies also continued to win new contracts, for example, McLaren won a competitive tender from the FIA, motorsport’s governing body, to become the exclusive supplier of batteries to Formula E. The batteries will allow cars to compete a full race distance without requiring a change of car, as was previously the case with rival’s system. This will not only help to significantly improve the show for fans but provide a perfect demonstration of McLaren’s technical capabilities in this area on a growing global motorsport platform.
Recent developments and factors affecting comparability
The Group is pleased to have completed the ramp up of volume in the Automotive division following the planned SAP implementation and major new product launches. This ramp up was completed in Q4 2017 (outside the period of these interim accounts) with 375 cars built in October 2017 and 430 cars built in November 2017. These monthly production rates more than support the planned volumes for 2018 when the Group is targeting volumes of over 4,300 for the year.
However, this has been achieved later than planned and therefore has left limited opportunity to catch back volumes that were lost earlier in the year. The Group has therefore cut expectations of annual production volumes to between 3,300 and 3,400 for 2017. These factors have had a substantial one-off impact on Group EBITDA. The Group therefore believes that, without the impact of these items, reported Q3 LTM EBITDA would have been £160m rather than the reported £72m. Given that both the SAP implementation and the product launches are unique to 2017, such an impact on production is not expected to be repeated in future years.
Sales continue to be strong. As production volume has increased through Q3, sales in some of the shorter lead markets are showing improvements in the 9 months to 30 September 2017. For example, sales in Europe are up 1.4% and the USA are up 1.9% year-on-year. In some of the longer lead markets the increased supply has yet to reach these countries and therefore a much better performance is expected in Q4 2017.
Only China remains an area where sales are not expected to exceed 2017. Early in 2017 an exemption for small volume manufacturers like McLaren was removed at short notice meaning that further testing was required in order to import the McLaren 720S and McLaren 570S Spider into China. This has delayed sales of these products so China volumes will only reflect sales of the other Sports Series models. However, McLaren expect to be able to start importing cars into China in February 2018 with sales expected to start in March 2018.
Sales volumes year to date are:
Region YTD 2016 YTD 2017
Europe 710 720
North America 696 709
Asia Pacific 369 335
China 137 72
RoW 179 184
Global 2,091 2,020
3
Recent developments and factors affecting comparability (continued)
Automotive order books continue to be strong, which means that higher sales volumes could have been achieved in 2017 has the production capacity been available. Super Series models are sold out into Q3 2018 and Sports Series models until Q2 2018. Further, the new Ultimate Series product for launch in mid-2018 has been announced. The McLaren Senna launch revealed in December is already sold out taking sales to the end of 2019.
In Racing, McLaren finished the 2017 season achieving ninth in the Formula 1 Constructors Championship. In September McLaren announced the early termination of its partnership with Honda and reached agreement with Renault to supply engines for the 2018, 2019 and 2020 seasons. The Group is confident that the performance of the McLaren chassis (widely considered to be one of the best in 2017) partnered with the race-winning Renault engine will see a significant improvement in on track performance in 2018. This will in turn drive improved sponsorship performance.
In respect of sponsorship for 2018 the Group has already announced the continuation of, or new, sponsorship with Kimoa, SAP, Stratasys, Kenwood, Hilton, Logitech, Akebono, Eden Games, Sparco, Technogym and ISS. Further, McLaren Racing is in discussions with several hundred organisations about sponsorship and is actively negotiating contracts with a significant number of these. The Group is hopeful that it can announce additional partners ahead of the 2018 season.
McLaren has also announced that that multiple World Champion Fernando Alonso will continue to partner Stoffel Vandoorne.
4
Financial review – income statement
Revenue
Revenue was £563.6m for the nine months ended 30 September 2017, a decrease of £7.2m or 1.3% on the nine months to 30 September 2016. This decrease is primarily attributed to a decline in Automotive vehicle sales following a planned reduction in production to complete the implementation of the business-wide SAP system in January 2017. Automotive revenues were also negatively impacted in the first half of 2017 by having only the Sports Series models (the McLaren 570S, 570GT and 540C) available to customers for the first five months due to the planned phasing in of 720S production; deliveries of the new Super Series model (McLaren 720S) only started in June 2017.
The decrease in Automotive revenues was partially offset by positive variances in McLaren Racing. Formula 1 prize money was higher in 2017 compared to 2016, reflecting the improved ranking in the Constructors Championship from ninth in 2015 to sixth in 2016, (with Formula 1 prize money paid retrospectively). In addition, the business recognised the sale of a number of heritage cars. These sales negated the decrease in sponsorship income during the same period as a result of some key sponsorship contracts failing to renew for 2017 due to on-track performance and new sponsorship contracts being of lower value.
Applied Technologies also saw a 28% increase in revenues primarily due to the increased product unit sales made to Honda Motorsport on their Formula 1 programme, additional sensor and Electronic Control Unit sales to other Formula 1 customers, offset by rail product that were sold in 2016. Service revenue also increased with the start of the connected train contract with C2C, the autonomous vehicle development programme that picked up pace during the nine months to Sept-17 and the Formula E battery development.
Gross profit
Gross profit was £106.2m for the nine months ended 30 September 2017, a decrease of £66m on the corresponding period for 2016. Gross profit as a percentage of revenue decreased from 30.2% in 2016 to 18.8% in 2017. The lower gross profit in absolute and percentage terms arose predominantly by a less favourable model mix in Automotive sales. In the nine months to 30 September 2016 Automotive sold a mix of Sports Series, Super Series and Ultimate Series vehicles compared to only selling Sports Series models for the first five months of 2017, with deliveries of Super Series vehicles starting in June 2017 and no Ultimate Series vehicles being offered during the period. McLaren Racing gross profit was also impacted by increased cost of car and release of work in progress provisions relating to the current season’s racing cars, driven by regulation changes for 2017. Applied Technologies saw a slight improvement in gross profit with higher revenue covering the increase in direct costs to support the development programmes. Administrative expenses
Administrative expenses were £128.0m for the period ended 30 September 2017, an increase of £11.2m or 9.6% on the nine months to 30 September 2016. This increase is primarily attributed to Automotive spend on planned operational upscaling and growth in the IT cost base following the implementation of the business-wide SAP system which went live in the first quarter of 2017.
Other operating income
Other operating income was £10.8m for the nine months to 30 September 2017, an increase of £2.8m or 35% on 2016. Racing recognised £4.5m income in 2017 on the transfer of a transmission dyno from Honda as part of the settlement agreement on termination of the contract. A matching asset has been recognised within Plant and Machinery on the balance sheet. Offsetting this is a reduction in R&D expenditure credits as 2016 contained a prior year true-up adjustment.
5
Financial review – income statement (continued)
Depreciation
Depreciation was £12.1m for the nine months to 30 September 2017, a decrease of £0.5m or 4%. This is mainly due to a lower level of capital expenditure in the last few years.
Amortisation
Amortisation was £42.5m for the nine months to 30 September 2017, a decrease of £2.3m or 5.1% primarily due to the lower Automotive car sales in 2017 and therefore lower level of development costs amortised to the profit and loss.
Finance costs
The net finance expense was £4.7m for the period ended 30 September 2017, a decrease of £48.1m or 91% on the nine months ended 30 September 2016. In 2016 Automotive adopted a hedge accounting policy designating certain derivatives as hedging instruments in cash flow hedges. The effective portion of changes in the fair value of derivatives incepted after 2015 and designated as a qualifying cash flow hedge have been recognised in other comprehensive income. In the nine months to 30 September 2016 Automotive was adversely impacted by exposure on foreign exchange contracts incepted prior to 2016 with the fair value adjustments being recognised in profit and loss.
Income tax
The income tax credit was £7.5m for the nine months ended 30 September 2017, £0.2m or 3.2% higher than the corresponding period in 2016. The credit in all periods is based on an estimate of the full year effective tax rate and is below the respective applicable UK corporation tax rates for 2017 and 2016 of 19% and 20% as a result of the credit not being taken for losses, the utilisation of which is not certain.
6
Financial review – cash flow statement
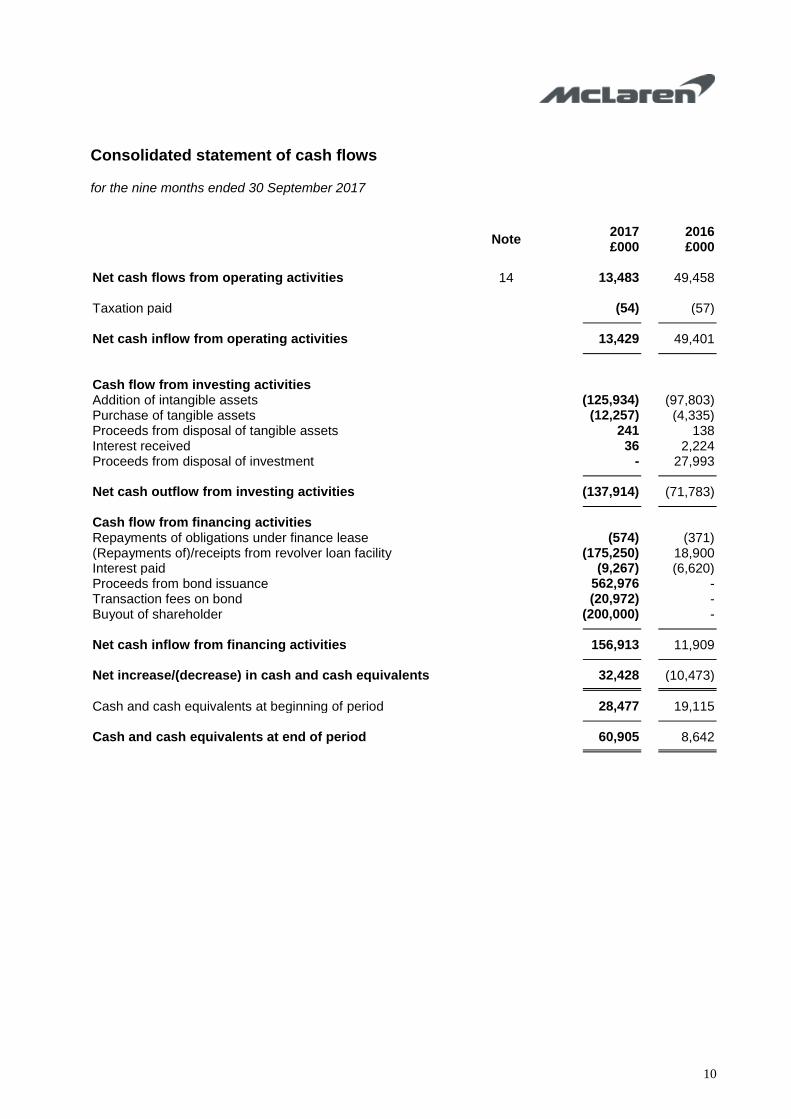
The nine months to 30 September 2017 saw a net cash inflow of £32.4m, compared to a net cash outflow of £(10.5m) in the nine months to 30 September 2016. The cash balance at 30 September 2017 was £60.9m, compared to £8.6m as at 30 September 2016.
Cash flow from operating activities
Cash generated from operating activities was £13.4m in the nine months to 30 September 2017 compared to £49.4m in the equivalent nine month period to 30 September 2016. The year on year decline is primarily attributed to the increase in operating loss, with an offset for improved working capital mainly due to advanced deposits on Ultimate Series car sales.
Cash flow from investing activities
Net cash used in investing activities increased to £(137.9m) for the period ended 30 September 2017 compared to £(71.8m) in the same period for 2016, an increase of £(66.1m). This is primarily due to a one-off receipt on disposal of investments of £28m in 2016, along with an increase in expenditure in 2017 on intangible assets as a result of continued growth in new product development in the Automotive business.
Cash flow from financing activities
Net cash inflow from financing activities was £156.9m for the nine months ended 30 September 2017, compared with £11.9m in 2016, an increase of £145.0m. This reflects the refinancing transaction on 20 July 2017, through issuance of a five year high yield bond worth £560m, with the funds used to buy out one of the shareholders, pay down existing bank loan facilities and leave a cash surplus.
7
Consolidated profit and loss account
for the nine months ended 30 September 2017 Note
2017 £000
2016 £000
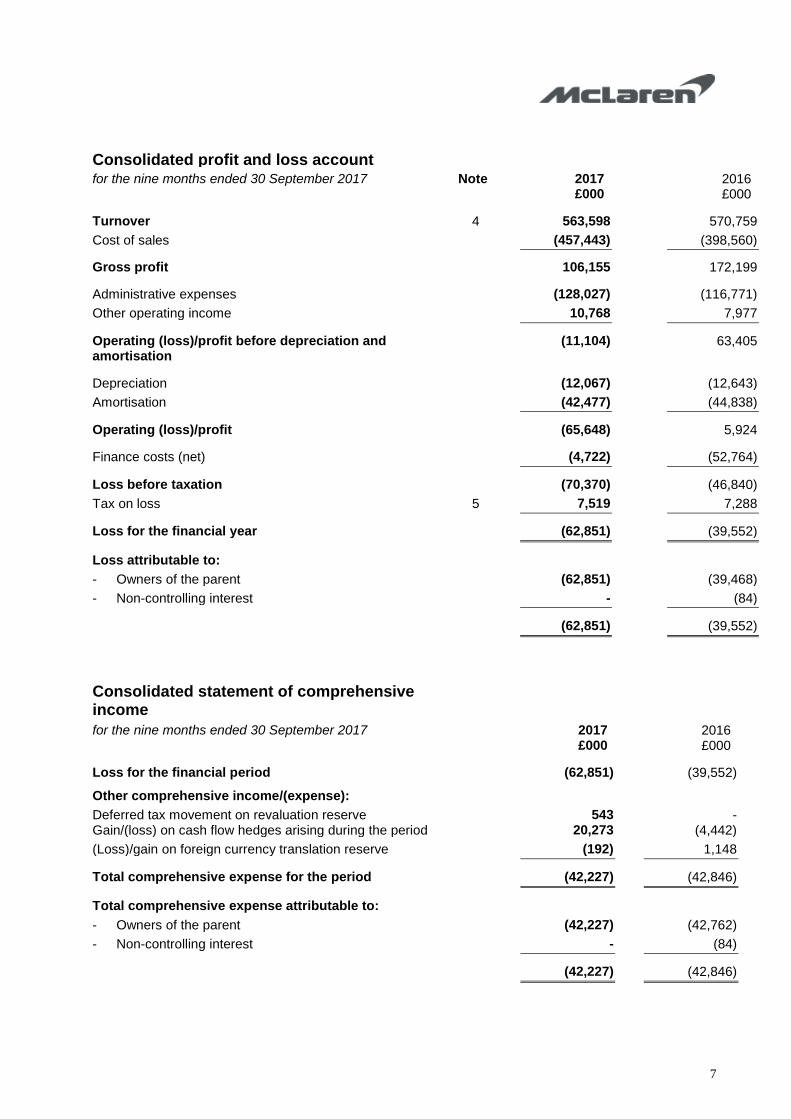
Turnover 4 563,598 570,759
Cost of sales (457,443) (398,560)
Gross profit 106,155 172,199
Administrative expenses (128,027) (116,771)
Other operating income 10,768 7,977
Operating (loss)/profit before depreciation and amortisation
(11,104) 63,405
Depreciation (12,067) (12,643)
Amortisation (42,477) (44,838)
Operating (loss)/profit (65,648) 5,924
Finance costs (net) (4,722) (52,764)
Loss before taxation (70,370) (46,840)
Tax on loss 5 7,519 7,288
Loss for the financial year (62,851) (39,552)
Loss attributable to:
- Owners of the parent (62,851) (39,468)
- Non-controlling interest - (84)
(62,851) (39,552)
Consolidated statement of comprehensive income
for the nine months ended 30 September 2017
2017 £000
2016 £000
Loss for the financial period
Other comprehensive income/(expense):
(62,851) (39,552)
Deferred tax movement on revaluation reserve Gain/(loss) on cash flow hedges arising during the period
543 20,273
- (4,442)
(Loss)/gain on foreign currency translation reserve (192) 1,148
Total comprehensive expense for the period (42,227) (42,846)
Total comprehensive expense attributable to:
- Owners of the parent (42,227) (42,762)
- Non-controlling interest - (84)
(42,227) (42,846)

8
Consolidated balance sheet
Note
As at 30 September
2017 £000
As at 31 December
2016 £000
Fixed assets
Intangible assets 6 548,176 467,312
Tangible assets 7 273,385 271,985
Heritage assets 8 73,725 76,925
895,286 816,222
Current assets
Inventories 9 107,039 68,081
Debtors 10 210,624 182,065
Cash at bank and in hand 60,905 28,477
378,568 278,623
Creditors: Amounts falling due within one year 11 (401,336) (363,073)
Net current liabilities (22,768) (84,450)
Total assets less current liabilities 872,518 731,772
Creditors: Amounts falling due after more than one year 12 (611,415) (153,478)
Provisions for liabilities (8,256) (8,576)
Deferred capital funding 13 (104,721) (107,464)
Net assets 148,126 462,254
Capital and reserves
Called-up share capital 80 57
Share premium account - 490,451
Merger reserve 218,547 -
Capital redemption reserve - 20
Foreign currency translation reserve 2,760 (17,321)
Revaluation reserve 56,915 58,127
Retained earnings (130,176) (69,080)
Total Equity 148,126 462,254
9
Consolidated statement of changes in equity
for the nine months ended 30 September 2017
Called up Share
Capital
Share premium account
Merger reserve
Capital Redemption
reserve
Foreign Currency
Translation reserve
Revaluation
reserve
Retained earnings
Equity
attributable to owners of
the parent
Non-controlling
interest Total
equity
£000 £000 £000 £000 £000 £000 £000 £000 £000 £000
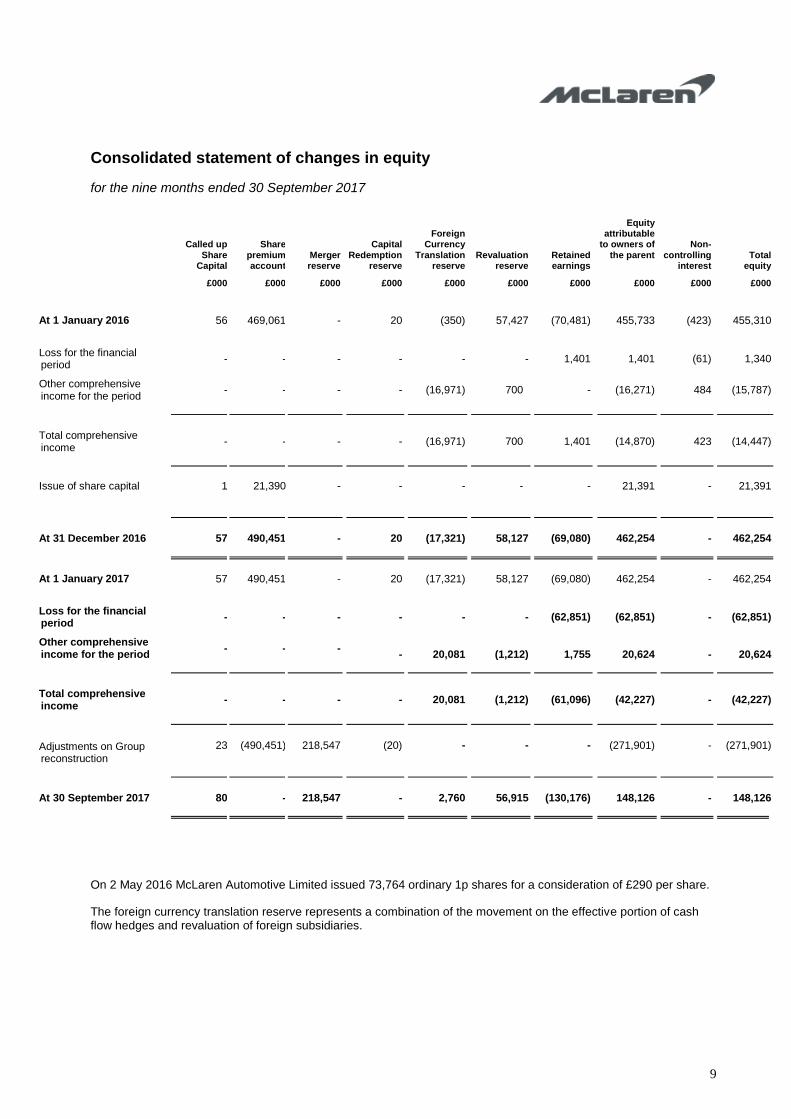
At 1 January 2016 56 469,061 - 20 (350) 57,427 (70,481) 455,733 (423) 455,310
Loss for the financial period
- - - - - - 1,401 1,401 (61) 1,340
Other comprehensive income for the period
- - - - (16,971) 700 - (16,271) 484 (15,787)
Total comprehensive income
- - - - (16,971) 700 1,401 (14,870) 423 (14,447)
Issue of share capital 1 21,390 - - - - - 21,391 - 21,391
At 31 December 2016 57 490,451 - 20 (17,321) 58,127 (69,080) 462,254 - 462,254
At 1 January 2017 57 490,451 - 20 (17,321) 58,127 (69,080) 462,254 - 462,254
Loss for the financial period
- - - - - - (62,851) (62,851) - (62,851)
Other comprehensive income for the period
- - -
-
20,081
(1,212)
1,755
20,624
-
20,624
Total comprehensive income
- - - - 20,081 (1,212) (61,096) (42,227) - (42,227)
Adjustments on Group reconstruction
23 (490,451) 218,547 (20) - - - (271,901) - (271,901)
At 30 September 2017 80 - 218,547 - 2,760 56,915 (130,176) 148,126 - 148,126
On 2 May 2016 McLaren Automotive Limited issued 73,764 ordinary 1p shares for a consideration of £290 per share.
The foreign currency translation reserve represents a combination of the movement on the effective portion of cash flow hedges and revaluation of foreign subsidiaries.
10
Consolidated statement of cash flows
for the nine months ended 30 September 2017
Note
2017 £000
2016 £000
Net cash flows from operating activities 14 13,483 49,458 Taxation paid (54) (57)
Net cash inflow from operating activities 13,429 49,401
Cash flow from investing activities Addition of intangible assets (125,934) (97,803) Purchase of tangible assets (12,257) (4,335) Proceeds from disposal of tangible assets 241 138 Interest received 36 2,224 Proceeds from disposal of investment - 27,993
Net cash outflow from investing activities (137,914) (71,783)
Cash flow from financing activities Repayments of obligations under finance lease (574) (371) (Repayments of)/receipts from revolver loan facility (175,250) 18,900 Interest paid (9,267) (6,620) Proceeds from bond issuance 562,976 - Transaction fees on bond (20,972) - Buyout of shareholder (200,000) -
Net cash inflow from financing activities 156,913 11,909
Net increase/(decrease) in cash and cash equivalents 32,428 (10,473)
Cash and cash equivalents at beginning of period 28,477 19,115
Cash and cash equivalents at end of period 60,905 8,642
11
Notes to the financial statements
1. General information
McLaren Holdings Limited (“the Company”) and its subsidiaries (together “the Group”) is privately owned and incorporated in the United Kingdom. The address of the registered office is McLaren Technology Centre, Chertsey Road, Woking, Surrey, GU21 4YH.
2. Basis of preparation
The condensed consolidated interim financial information for the nine months ended 30 September 2017 has been prepared with reference to FRS 104, ‘Interim financial reporting’, and does not constitute statutory accounts within the meaning of section 434 of the Companies Act 2006. This condensed consolidated interim financial information has not been audited or reviewed.
On 20 July 2017, the shareholders of both McLaren Technology Group and McLaren Automotive Limited combined both groups under a newly formed company, McLaren Holdings Limited, which is owned 100% by the newly formed ultimate parent company McLaren Group Limited. A new financing arrangement was put in place at a holding company level through issuance of a five year high yield bond worth circa £560m, with the funds used to buy out one of the shareholders, pay down existing bank loan facilities and leave a cash surplus of circa £93m. A new revolving credit facility for £90m was also put in place.
The introduction of a new holding company constitutes a Group reconstruction and has been accounted for using merger accounting principles. Therefore, although the Group reconstruction did not become effective until 20 July 2017, the consolidated financial statements of McLaren Holdings Limited are presented as if McLaren Technology Group and McLaren Automotive Limited had always been part of the same Group. As such, the results and cash flows of the combining entities have been brought into these consolidated financial statements from the beginning of the financial period. In addition, the comparative information has been restated by including the results for both the combining entities for the previous reporting period and their balance sheet for the previous reporting date as if the entities had been combined throughout the prior period.
3. Accounting policies
The accounting policies applied are consistent with those of the annual financial statements of McLaren Technology Group and McLaren Automotive Limited for the year ended 31 December 2016 as filed at Companies House, and included within the offering memorandum issued to prospective purchasers of the bonds in the lead up to the Group restructure.
12
Notes to the financial statements (continued)
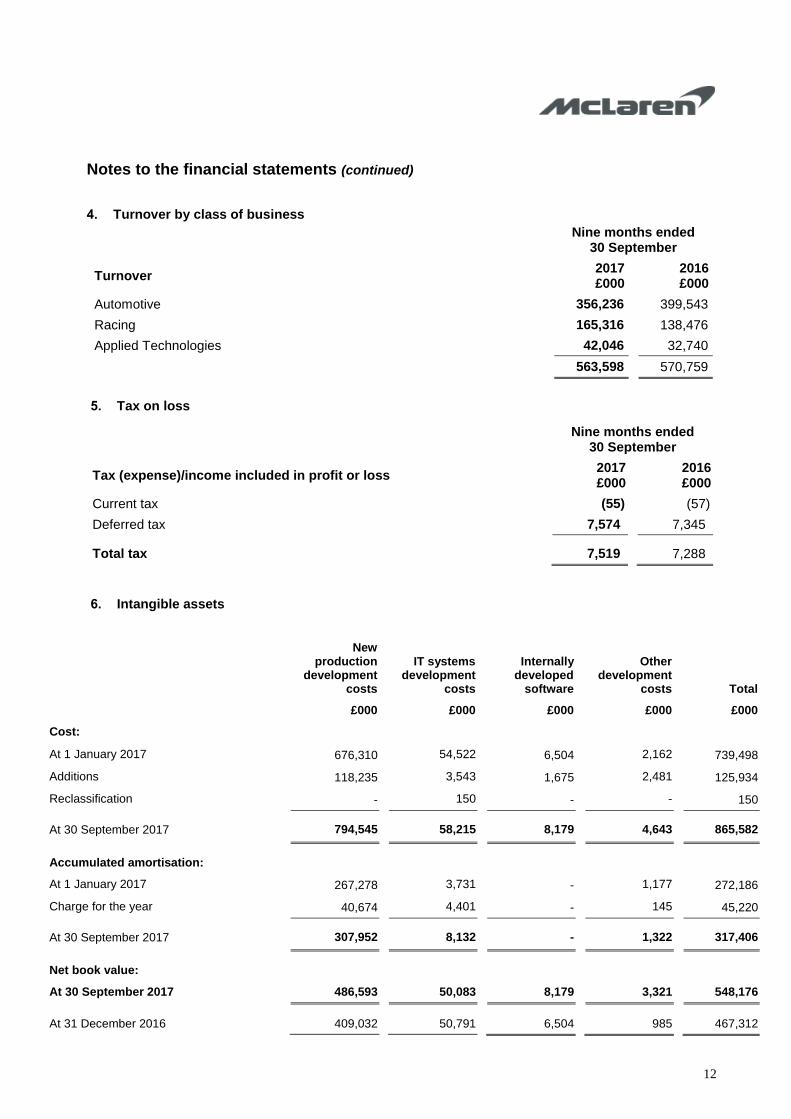
4. Turnover by class of business
Nine months ended
30 September
Turnover 2017 £000
2016 £000
Automotive 356,236 399,543
Racing 165,316 138,476
Applied Technologies 42,046 32,740
563,598 570,759
5. Tax on loss
Nine months ended
30 September
Tax (expense)/income included in profit or loss 2017 £000
2016 £000
Current tax (55) (57)
Deferred tax 7,574 7,345
Total tax 7,519 7,288
6. Intangible assets
New production
development costs
IT systems development
costs
Internally developed
software
Other development
costs Total
£000 £000 £000 £000 £000
Cost:
At 1 January 2017 676,310 54,522 6,504 2,162 739,498
Additions 118,235 3,543 1,675 2,481 125,934
Reclassification - 150 - - 150
At 30 September 2017 794,545 58,215 8,179 4,643 865,582
Accumulated amortisation:
At 1 January 2017 267,278 3,731 - 1,177 272,186
Charge for the year 40,674 4,401 - 145 45,220
At 30 September 2017 307,952 8,132 - 1,322 317,406
Net book value:
At 30 September 2017 486,593 50,083 8,179 3,321 548,176
At 31 December 2016 409,032 50,791 6,504 985 467,312
13
Notes to the financial statements (continued)
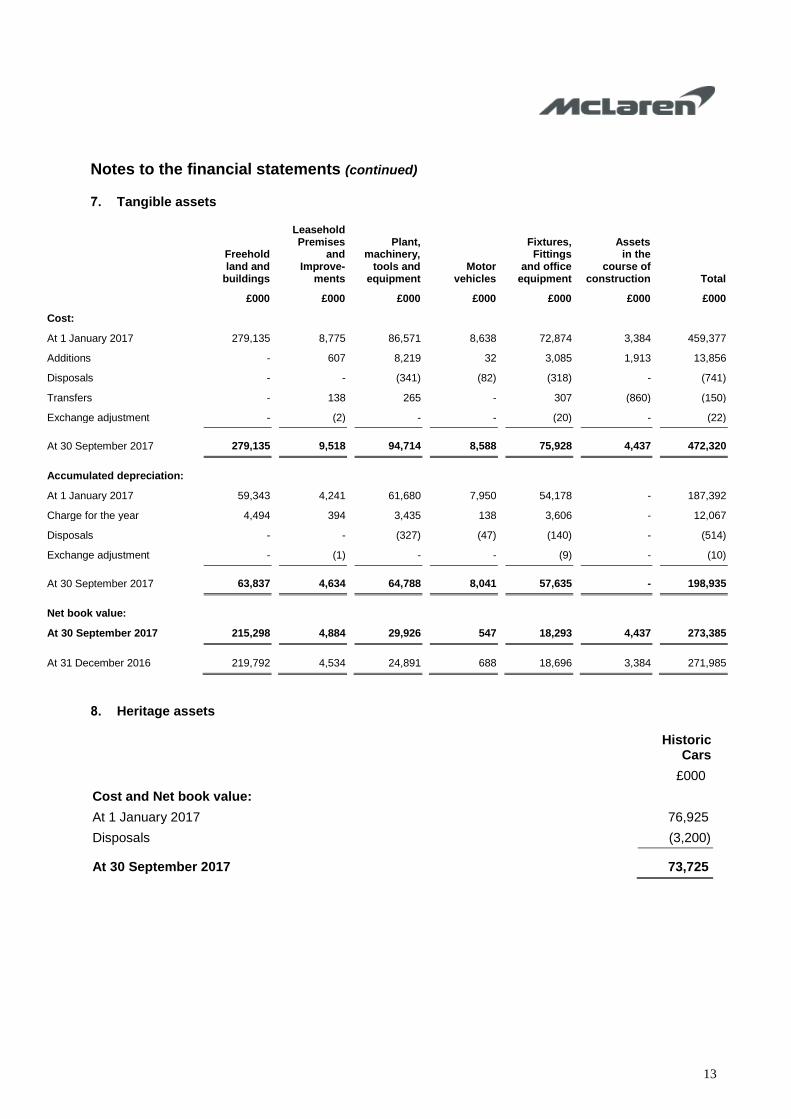
7. Tangible assets
Freehold land and
buildings
Leasehold Premises
and Improve-
ments
Plant, machinery,
tools and equipment
Motor vehicles
Fixtures, Fittings
and office equipment
Assets in the
course of construction Total
£000 £000 £000 £000 £000 £000 £000
Cost:
At 1 January 2017 279,135 8,775 86,571 8,638 72,874 3,384 459,377
Additions - 607 8,219 32 3,085 1,913 13,856
Disposals - - (341) (82) (318) - (741)
Transfers - 138 265 - 307 (860) (150)
Exchange adjustment - (2) - - (20) - (22)
At 30 September 2017 279,135 9,518 94,714 8,588 75,928 4,437 472,320
Accumulated depreciation:
At 1 January 2017 59,343 4,241 61,680 7,950 54,178 - 187,392
Charge for the year 4,494 394 3,435 138 3,606 - 12,067
Disposals - - (327) (47) (140) - (514)
Exchange adjustment - (1) - - (9) - (10)
At 30 September 2017 63,837 4,634 64,788 8,041 57,635 - 198,935
Net book value:
At 30 September 2017 215,298 4,884 29,926 547 18,293 4,437 273,385
At 31 December 2016 219,792 4,534 24,891 688 18,696 3,384 271,985
8. Heritage assets
Historic
Cars
£000
Cost and Net book value:
At 1 January 2017 76,925
Disposals (3,200)
At 30 September 2017 73,725
14
Notes to the financial statements (continued)
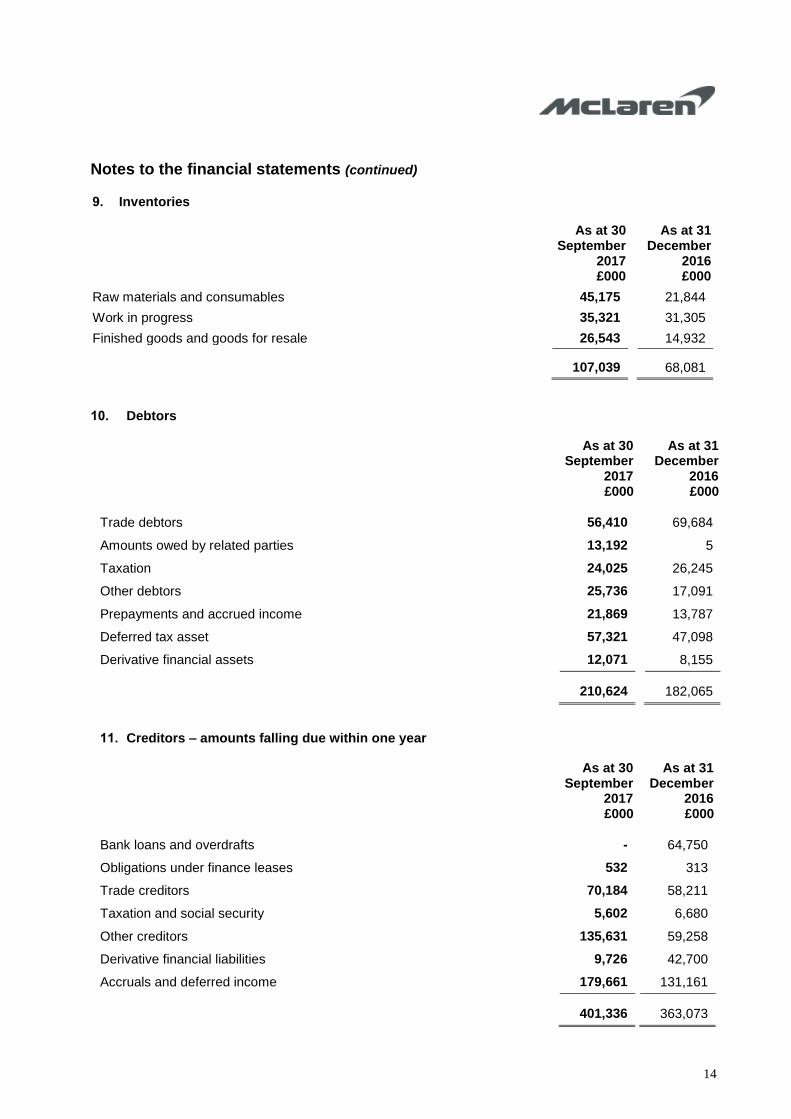
9. Inventories
As at 30 September
2017 £000
As at 31 December
2016 £000
Raw materials and consumables 45,175 21,844
Work in progress 35,321 31,305
Finished goods and goods for resale 26,543 14,932
107,039 68,081
10. Debtors
As at 30 September
2017 £000
As at 31 December
2016 £000
Trade debtors 56,410 69,684
Amounts owed by related parties 13,192 5
Taxation 24,025 26,245
Other debtors 25,736 17,091
Prepayments and accrued income 21,869 13,787
Deferred tax asset 57,321 47,098
Derivative financial assets 12,071 8,155
210,624 182,065
11. Creditors – amounts falling due within one year
As at 30 September
2017 £000
As at 31 December
2016 £000
Bank loans and overdrafts - 64,750
Obligations under finance leases 532 313
Trade creditors 70,184 58,211
Taxation and social security 5,602 6,680
Other creditors 135,631 59,258
Derivative financial liabilities 9,726 42,700
Accruals and deferred income 179,661 131,161
401,336 363,073
15
Notes to the financial statements (continued)
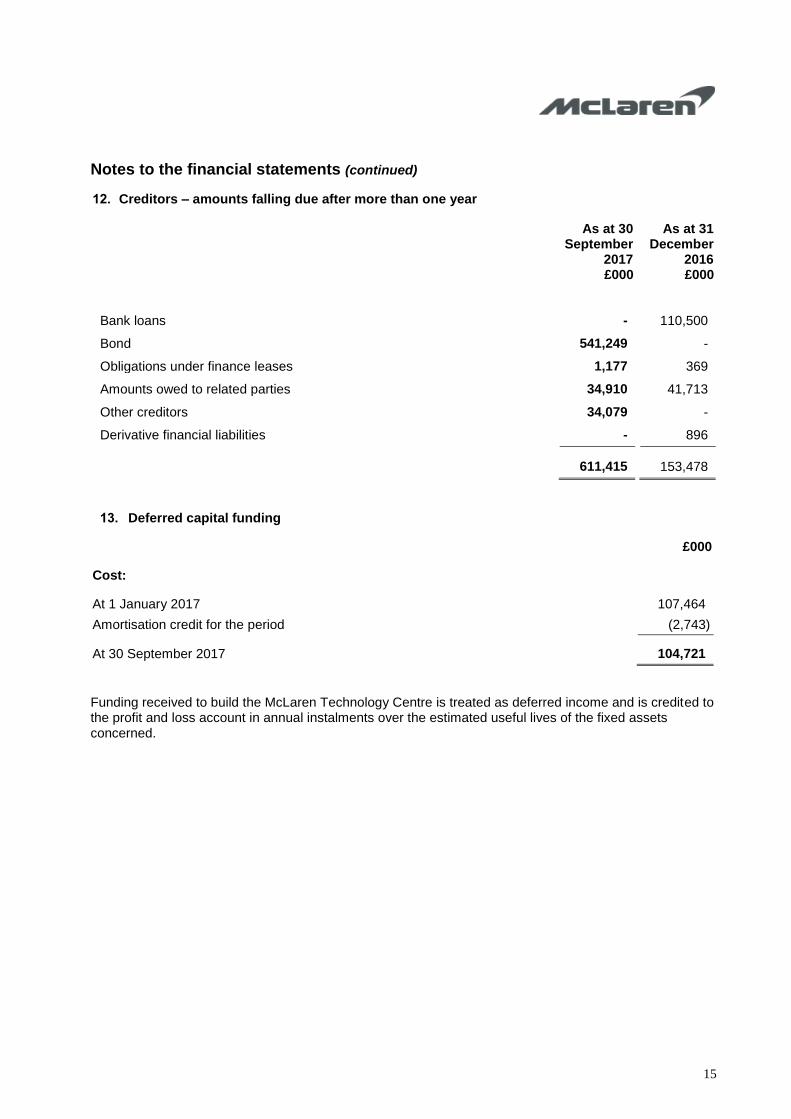
12. Creditors – amounts falling due after more than one year
As at 30 September
2017 £000
As at 31 December
2016 £000
Bank loans - 110,500
Bond 541,249 -
Obligations under finance leases 1,177 369
Amounts owed to related parties 34,910 41,713
Other creditors 34,079 -
Derivative financial liabilities - 896
611,415 153,478
13. Deferred capital funding
£000
Cost:
At 1 January 2017 107,464
Amortisation credit for the period (2,743)
At 30 September 2017 104,721
Funding received to build the McLaren Technology Centre is treated as deferred income and is credited to the profit and loss account in annual instalments over the estimated useful lives of the fixed assets concerned.
16
Notes to the financial statements (continued)
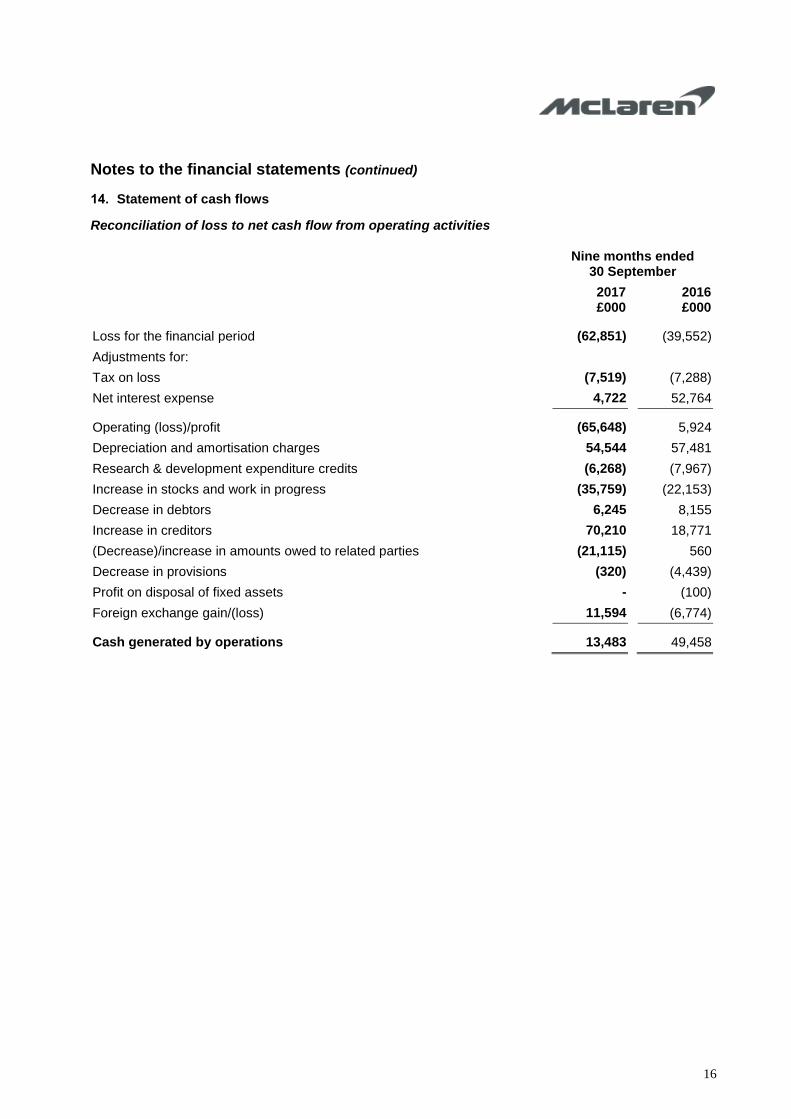
14. Statement of cash flows
Reconciliation of loss to net cash flow from operating activities
Nine months ended
30 September
2017 £000
2016 £000
Loss for the financial period (62,851) (39,552)
Adjustments for:
Tax on loss (7,519) (7,288)
Net interest expense 4,722 52,764
Operating (loss)/profit (65,648) 5,924
Depreciation and amortisation charges 54,544 57,481
Research & development expenditure credits (6,268) (7,967)
Increase in stocks and work in progress (35,759) (22,153)
Decrease in debtors 6,245 8,155
Increase in creditors 70,210 18,771
(Decrease)/increase in amounts owed to related parties (21,115) 560
Decrease in provisions (320) (4,439)
Profit on disposal of fixed assets - (100)
Foreign exchange gain/(loss) 11,594 (6,774)
Cash generated by operations 13,483 49,458