INTERIM RESULTS PRESENTATION | SIX MONTHS TO...
31
INTERIM RESULTS PRESENTATION | SIX MONTHS TO 30 JUNE 2017
Transcript of INTERIM RESULTS PRESENTATION | SIX MONTHS TO...
INTERIM RESULTS PRESENTATION | SIX MONTHS TO 30 JUNE 2017

The information contained in this presentation has not been independently verified and this presentation contains various forward-looking statements that reflect management’s current views with respect to future events and financial and operational performance. The words “growing”, “scope”, “platform”, “future”, “expected”, “estimated”, “accelerating”, “expanding”, “continuing”, “potential” and “sustainable” and similar expressions or variations on such expressions identify certain of these forward-looking statements. Others can be identified from the context in which the statements are made.
These forward-looking statements involve known and unknown risks, uncertainties, assumptions, estimates and other factors, which may be beyond Ibstock plc’s (the “Group’s”) control and which may cause actual results or performance to differ materially from those expressed or implied from such forward-looking statements. All statements (including forward-looking statements) contained herein are made and reflect knowledge and information available as of the date of preparation of this presentation and the Group disclaims any obligation to update any forward-looking statements, whether as a result of new information, future events or results or otherwise. There can be no assurance that forward-looking statements will prove to be accurate, as actual results and future events could differ materially from those anticipated in such statements. Accordingly, readers should not place undue reliance on forward-looking statements due to the inherent uncertainty therein. Nothing in this document should be construed as a profit forecast.
DISCLAIMER
2

PRESENTING TODAY
Wayne SheppardCEO
Kevin Sims CFO
3
AGENDA
Outlook
Wayne Sheppard
Overview
Wayne Sheppard
Financial review
Kevin Sims
Q&AOperating review
Wayne Sheppard
4

OVERVIEW
Operational Overview – six months ended 30 June 2017
Adjusted
EBITDA up 7%
to £60m
Net debt to
EBITDA at 1.4x
after £17m of
capex
Financial Overview – six months ended 30 June 2017
ROCE at 19% after
£46m of cumulative CX
on major projects –
with returns to come
Interim dividend
of 2.6p per share
(2016 interim 2.4p
per share)
Good activity
levels from the UK
new build housing
sector
UK Clay volumes ahead
y-o-y although volume
growth constrained by
capacity, particularly soft
mud
Continued
growth in UK
Concrete
Performance flat in US
with slowdown evident since
Spring
Major capital projects:
• Roof tile plant now in production
• Major brick investments on schedule
5
Group revenue
up 9% to
£228m
Continued strong
underlying cash
generation
AGENDA
Outlook
Wayne Sheppard
Highlights & Overview
Wayne Sheppard
Q&AOperating review
Wayne Sheppard
Financial review
Kevin Sims
6

FINANCIAL HIGHLIGHTSSIX MONTHS ENDED 30 JUNE 2017
Revenue £228m 9% (c6.4% CC)
Adjusted EBITDA1 £60m 7% (c6.4% CC)
EBITDA margin % 26% ◀
ROCE2 19% 1%pt
Cash conversion3 41% 15%pt
Net Debt to EBITDA 1.4 ◀
Interim dividend 2.6p 8%
Note
(1) Adjusted EBITDA is earnings before interest, taxation, depreciation and amortisation after adjusting for exceptional items
(2) ROCE is adjusted EBITA as a proportion of net debt plus equity adjusted for pensions
(3) Cash conversion is the ratio of adjusted EBITDA after movement in working capital less maintenance capex to adjusted EBITDA
7
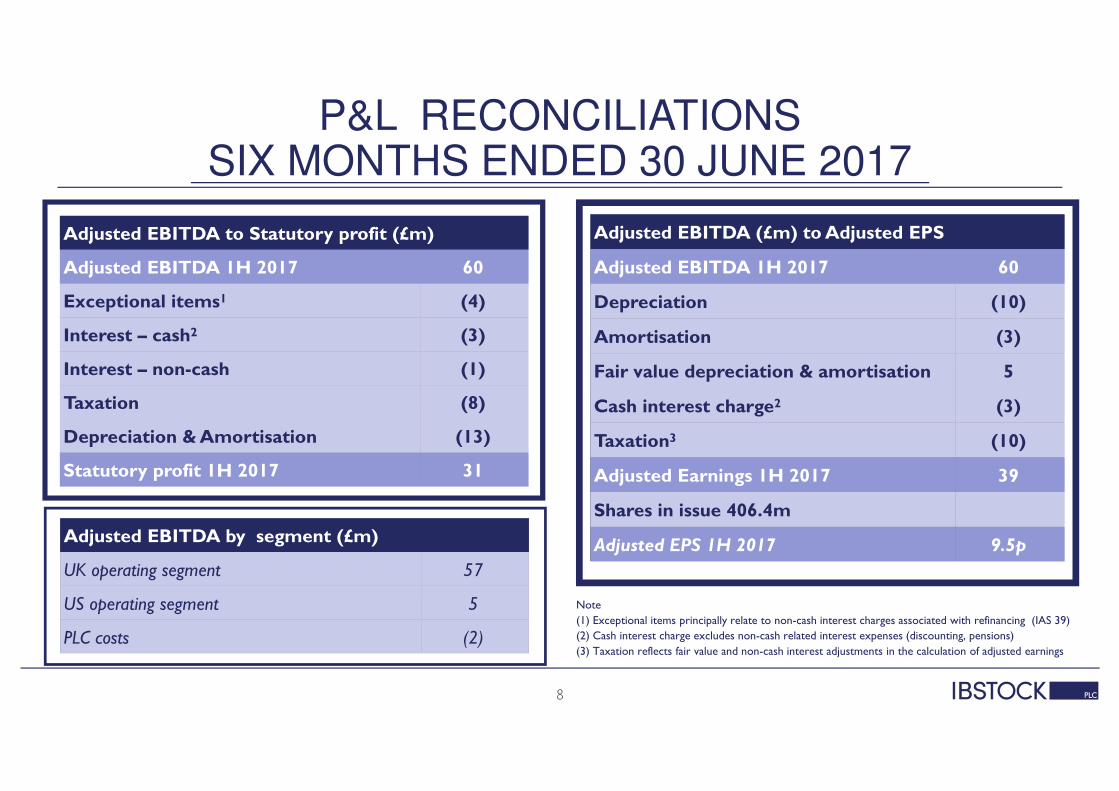
P&L RECONCILIATIONSSIX MONTHS ENDED 30 JUNE 2017
Adjusted EBITDA to Statutory profit (£m)
Adjusted EBITDA 1H 2017 60
Exceptional items1 (4)
Interest – cash2 (3)
Interest – non-cash (1)
Taxation (8)
Depreciation & Amortisation (13)
Statutory profit 1H 2017 31
Adjusted EBITDA (£m) to Adjusted EPS
Adjusted EBITDA 1H 2017 60
Depreciation (10)
Amortisation (3)
Fair value depreciation & amortisation 5
Cash interest charge2 (3)
Taxation3 (10)
Adjusted Earnings 1H 2017 39
Shares in issue 406.4m
Adjusted EPS 1H 2017 9.5p
Note
(1) Exceptional items principally relate to non-cash interest charges associated with refinancing (IAS 39)
(2) Cash interest charge excludes non-cash related interest expenses (discounting, pensions)
(3) Taxation reflects fair value and non-cash interest adjustments in the calculation of adjusted earnings
8
Adjusted EBITDA by segment (£m)
UK operating segment 57
US operating segment 5
PLC costs (2)
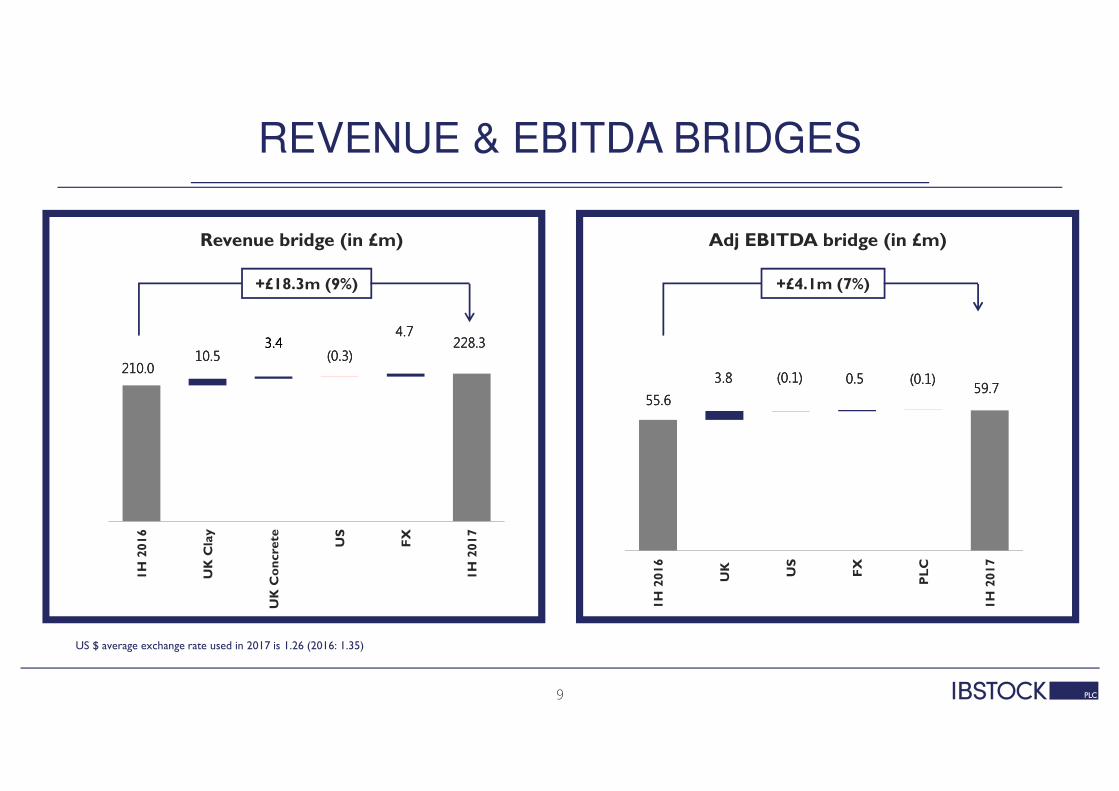
55.655.655.655.6
0.50.50.50.559.759.759.759.7
3.83.83.83.8 (0.1)(0.1)(0.1)(0.1) (0.1)(0.1)(0.1)(0.1)
1H 2016
UK US
FX
PLC
1H 2017
REVENUE & EBITDA BRIDGES
US $ average exchange rate used in 2017 is 1.26 (2016: 1.35)
210.0210.0210.0210.0
228.3228.3228.3228.310.510.510.510.5
3.43.43.43.4(0.3)(0.3)(0.3)(0.3)
4.74.74.74.7
1H 2016
UK C
lay
UK C
oncre
te US
FX
1H 2017
Revenue bridge (in £m)
+£18.3m (9%)
Adj EBITDA bridge (in £m)
+£4.1m (7%)
9

HIGHLY CASH GENERATIVE
Note
(1) Cash conversion is the ratio of adjusted EBITDA after movements in working capital less maintenance capex to adjusted EBITDA
(2) Cashflow from operating and investing activities is defined as EBITDA adjusted for changes in working capital less cash flows from
non-major capex
(3) Cash costs above P&L costs
Six months ended 30 June (£m) 2017 2016 Change % change
Adj. EBITDA 60 56 +4 8%
Share-based payments 1 1 -
Capex (excl major projects) (6) (8) +2
ΔΔΔΔ in net working capital (30) (18) (12)
Adj. EBITDA – capex – ∆ in NWC 25 31 (6) (21%)
Cash conversion (%)1 41 56
Major project capex (11) (21) +10
Cash from operating and investment activities2
14 10 +4 39%
Net interest (2) (3) +1
Tax (8) - (8)
Post-employment benefits3 (4) (2) (2)
Adj. free cash flow - 5 (5)
• Working capital reflects I.T. issues at a major customer
delaying payment until July and higher sales y-o-y
• Cash conversion 52% if adjusted for delayed payment
(c£6.4m)
• Cash tax in 2016 reduced by 2015 exceptional costs
10
Full Year Guidance 2017
• Major project capital expenditure c£23m and other capital expenditure spend c£13m
• Depreciation & Amortisation c£27m
• Cash interest charge £4m-£5m
• Income statement effective tax rate c21%
• Post employment benefits c£7m
• Full year cash conversion expected in line with 2016

FINANCIAL MANAGEMENT
11
UK scheme IAS
19R surplus of
£44m
compared to
£29m deficit at
Dec 2016
Scheme closed
to future
accrual from 1st
February 2017
Pension scheme
Next triennial valuation at November
2017
£9m US post-
retirement
obligations
unchanged from
year end
New debt
Refinanced in
March 2017
(5 year term)
RCF facility blended interest rate
150 bps at leverage <1.75x
(125bps at <1.25x)
No fixed debt
repayments and
includes accordion
facility of £50m
Comfortably within
covenants (interest cover
4.0x and debt leverage 3.0x
EBITDA)
Gross liabilities
of £649m
compared to
£698m at Dec
2016
Deficit recovery plan
continues
(£7m p.a.)
New £250m
Revolving Credit
Facility
AGENDA
Outlook
Wayne Sheppard
Highlights & Overview
Wayne Sheppard
Financial review
Kevin Sims
Q&AOperating review
Wayne Sheppard
12

OPERATING SEGMENT REVIEW - UK
Clay brick performance
Housebuilding
continues to
underpin
volume
growth
Stocks
reduced with
waiting times
on many
products
Low single digit
price increases by
channel, overall flat
due to channel &
product mix
Energy costs increased by
low double digit in line with
expectations
Good performance
from concrete products
Overall UK margins
maintained
1H 2017 1H 2016 % Growth
Revenue £186m £172m 8%
Adjusted EBITDA1 £57m £53m 7%
Adjusted EBITDA margin1 30.6% 30.8%
13
(1) 1H 2016 EBITDA and EBITDA margin revised from those previously disclosed to exclude unallocated plc costs (£2m in 1H 2016 and 1H 2017)
Soft mud
capacity
fully
utilised

MAJOR PROJECT
New brick factory – Ibstock Leicestershire
£54mCapex project
Scheduled to begin
commissioning in 4Q 2017
Addition of 100m
soft mud brick capacity
(13% of current total Ibstock brick capacity,
5% UK capacity)
High volume factory with expansion potential
Most modernand efficientbrick plant in
UK
Process flexibility to manufacture
existing product range and develop
new products
14
Anticipate capacity
utilisation of c50% in 2018
Margin enhancing in
2018
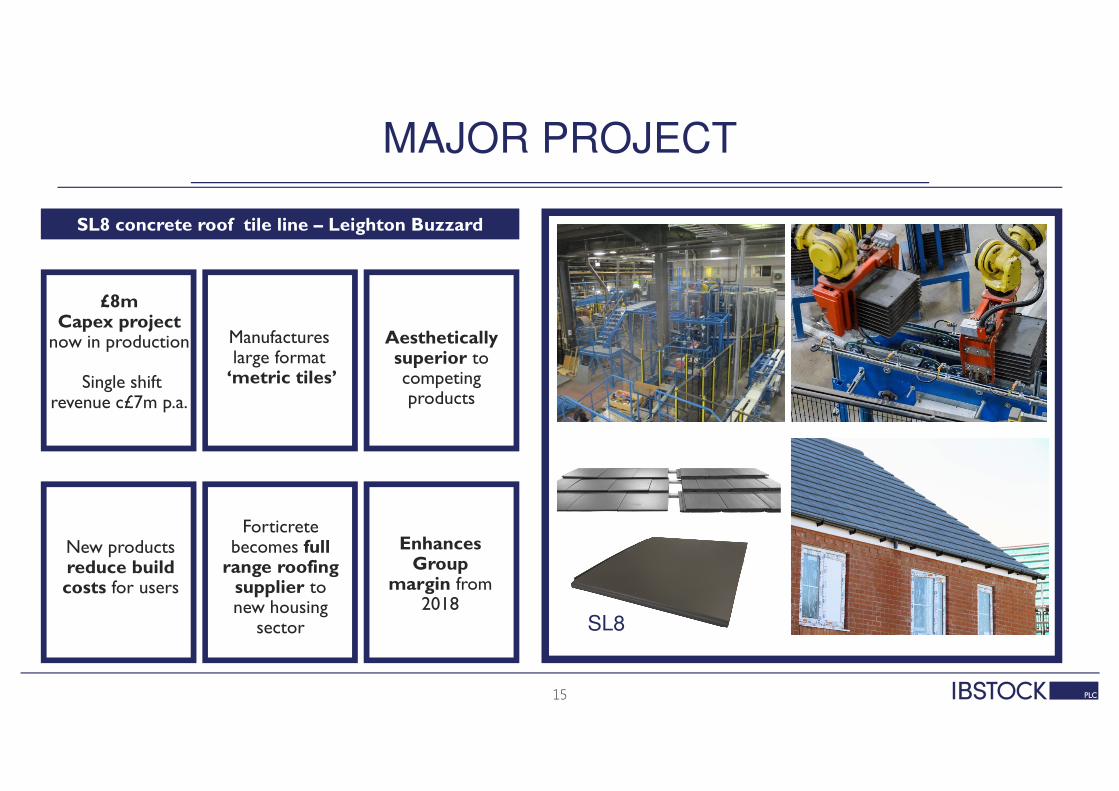
MAJOR PROJECT
SL8 concrete roof tile line – Leighton Buzzard
£8mCapex project
now in production
Single shift revenue c£7m p.a.
Manufactures large format‘metric tiles’
Aesthetically superior to competing products
Forticrete becomes full range roofing supplier to new housing
sector
Enhances Group
margin from2018
15
New products reduce build costs for users
SL8

MAJOR PROJECT
New brick kiln – Lodge Lane (Cannock in Staffordshire)
16
£8mCapex
improvement project
Scheduled to begin
commissioning in Q4 2017
Lodge Lane factory
manufactures ‘blue bricks’
Niche product range with
distinct visual aesthetics
Replacement kiln reduces costs and increasescapacity allowing
displacement of Ibstock imports
Maintains Ibstock’s leading
position as a full range
supplier. No disruption to volumes in
2017
Anticipated (yr1)
incremental 2018 EBITDA
c£1m

OPERATING SEGMENT REVIEW - US
Mid single digit
volume decline
with slowdown in
activity levels in Q2
Energy costs
higher year-on-
year although
expected to reduce
in second half
Modest price
increases
achieved across the
product ranges
Performance reflects BIA reduced brick demand in Glen-Gery’s regions of North-East and Mid-Atlantic and slight
growth in Mid-West
1H 2017 1H 2016 % Growth ($)
Revenue $53m (£42m) $54m (£38m) (1%)
Adjusted EBITDA $6m (£5m) $6m (£4m) (2%)
Adjusted EBITDA margin 11.5% 11.6%
17
Maintained margins despite lower
volumes
BIA – Brick Industry Association
AGENDA
Outlook
Wayne Sheppard
Highlights & Overview
Wayne Sheppard
Financial review
Kevin Sims
Q&AOperating review
Wayne Sheppard
18
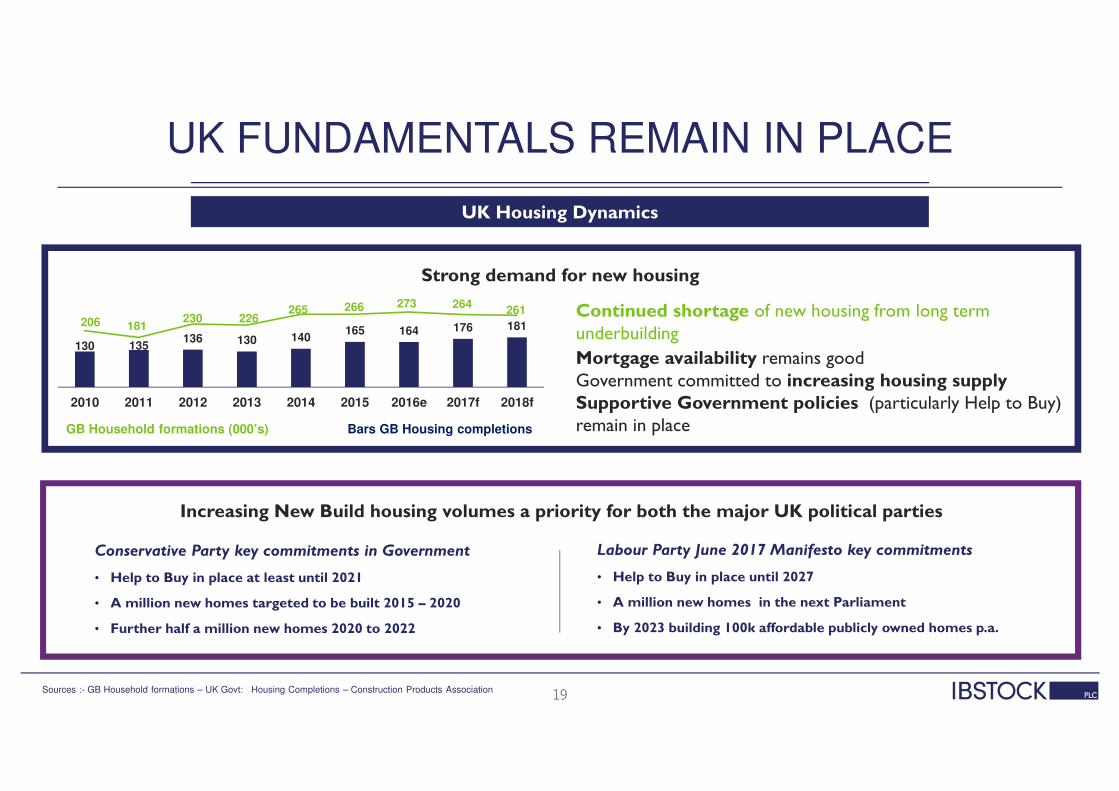
UK FUNDAMENTALS REMAIN IN PLACE
Increasing New Build housing volumes a priority for both the major UK political parties
Conservative Party key commitments in Government
• Help to Buy in place at least until 2021
• A million new homes targeted to be built 2015 – 2020
• Further half a million new homes 2020 to 2022
UK Housing Dynamics
130 135 136 130 140
165 164 176 181 206 181230 226
265 266 273 264261
2010 2011 2012 2013 2014 2015 2016e 2017f 2018f
Mortgage availability remains goodGovernment committed to increasing housing supplySupportive Government policies (particularly Help to Buy) remain in place
Continued shortage of new housing from long term underbuilding
GB Household formations (000’s) Bars GB Housing completions
Strong demand for new housing
Sources :- GB Household formations – UK Govt: Housing Completions – Construction Products Association 19
Labour Party June 2017 Manifesto key commitments
• Help to Buy in place until 2027
• A million new homes in the next Parliament
• By 2023 building 100k affordable publicly owned homes p.a.

US MARKET BACKDROP MORE MIXED
US Market Dynamics
• N-E residential starts down 11% in 2016, impacting 2017 brick demand. M-W and M-A up in 2016, but forecast flat in 2017.
• Single-family forecast to grow and multi-family to decline both by high single-digit.
Stable overall outlook for housing starts in Glen-Gery’s key markets (Starts 000’s)
211 217 260
331 344 390 399 400 405
2010 2011 2012 2013 2014 2015 2016e 2017f 2018f
North & East Midwest
279 295 335 357 384 393 395 406 425
2010 2011 2012 2013 2014 2015 2016e 2017f 2018f
North & East Midwest
• Commercial construction is expected to increase c3% in 2017 within Glen-Gery’s markets
• However, within the key sectors for Glen-Gery of education, retail, healthcare and Government we are experiencing fewer major brick projects in 2017 and some evidence of expected projects delayed into 2018
Continued headline recovery in commercial markets (000’s sq.ft)
Source :- Dodge Data and Analytics
North & East region comprises North-East, Mid-Atlantic and North Central areas 20

SUMMARY AND OUTLOOK
Long term fundamentals supporting UK housing remain
unchanged
UK Clay - good activity levels have continued into the second half of 2017
UK Concrete benefiting from new roof tile capacity
and a strong housing market
US Clay expected to reflect the weaker market conditions
now prevailing
Major capital projects progressing to
plan with main earnings benefits to
come
Continue to appraise opportunities for value creating organic or acquisitive
investments as they arise
Group remains strongly cash
generative and is investing for
growth
21
Expectations for another year of progress are maintained
(subject to political and economic uncertainties)
AGENDA
Outlook
Wayne Sheppard
Highlights & Overview
Wayne Sheppard
Financial review
Kevin Sims
Q&AOperating review
Wayne Sheppard
22
APPENDIX | ADDITIONAL FINANCIAL INFORMATION

INCOME STATEMENT SIX MONTHS ENDED 30 JUNE 2017
Income statement
Six months ended 30 June 2017
£m
Six months ended 30 June 2016
£m
Revenue 228 210
Operating profit pre-exceptional 47 43
Add exceptional items1 2 -
Operating profit 49 43
Net finance costs2 (10) (5)
Adjusted Profit before tax 39 38
Adjusted Taxation (8) (8)
Adjusted profit after tax 31 30
(1) Main exceptional items represents provision release(2) Includes exceptional finance costs of £6 million associated with refinancing
24

BALANCE SHEET AS AT 30 JUNE 2017
Balance Sheet
30 June 2017£m
31 Dec 2016£m
30 June 2016£m
Assets
PP&E 393 392 371
Intangible 120 123 125
Non-current assets 513 515 496
Inventories 90 89 94
Trade receivables 77 52 68
Other 4 3 -
Current assets 171 144 162
Total assets 684 659 658
Payables (83) (80) (84)
Other liabilities excl debt & pension (79) (79) (78)
Net assets 522 500 496
Net debt (160) (133) (161)
25
INTRODUCTION TO THE GROUP

KEY INVESTMENT HIGHLIGHTS
Market leadership positions
#1 in UK bricks
Strong household
formations with
supportive UK
government policy
Three UK brick
manufacturers
c90% of capacity
Vertically
integrated business
model with
planning and capital
barriers
High quality, broad
product range and
strong customer
relationships
Additional capacity,
product innovation
and strategic
development
Highly experienced
and extensive
through-the-cycle
track record
High operational gearing, strong
returns and cash flow
Structural demand growth
Industry structure
High barriers to entry
Strong customer
service ethic
Multiple growth options
Long-standing management
Outstanding financial
performance
27
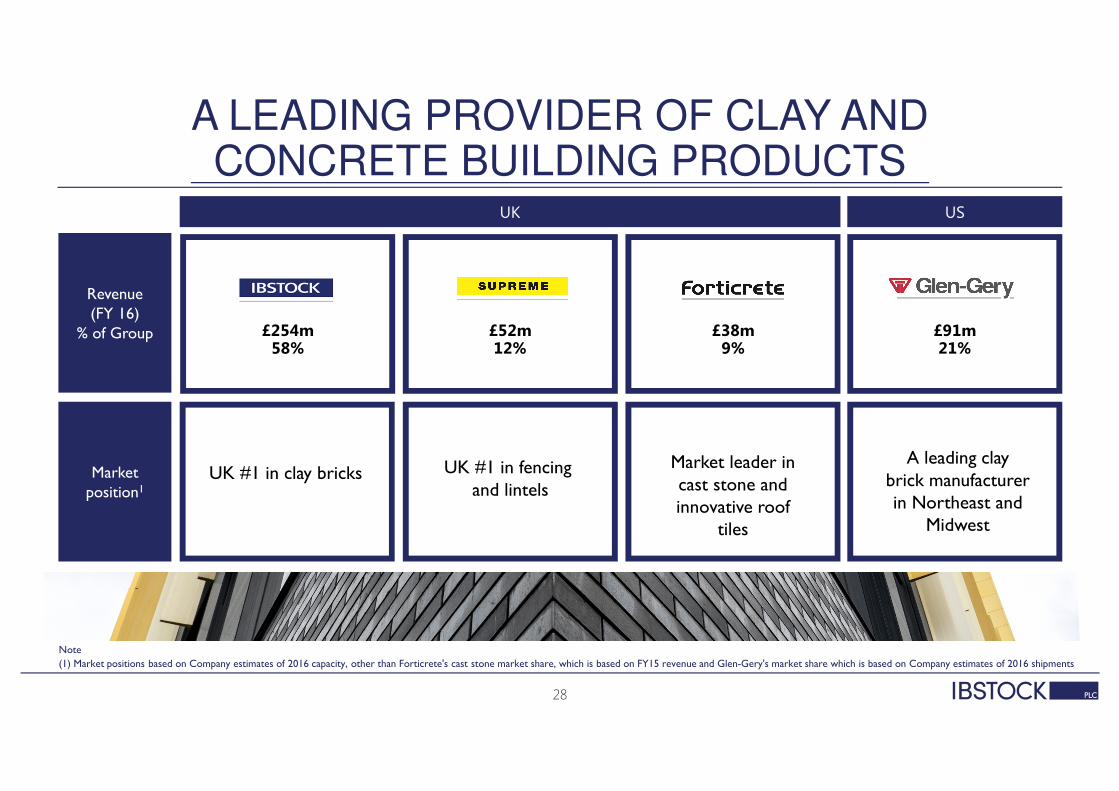
A LEADING PROVIDER OF CLAY AND CONCRETE BUILDING PRODUCTS
Note
(1) Market positions based on Company estimates of 2016 capacity, other than Forticrete's cast stone market share, which is based on FY15 revenue and Glen-Gery's market share which is based on Company estimates of 2016 shipments
USUK
£91m21%
£254m58%
£52m12%
£38m9%
A leading clay brick manufacturer in Northeast and
Midwest
UK #1 in fencing and lintels
UK #1 in clay bricks
Revenue (FY 16)
% of Group
Market position1
Market leader in cast stone and innovative roof
tiles
28
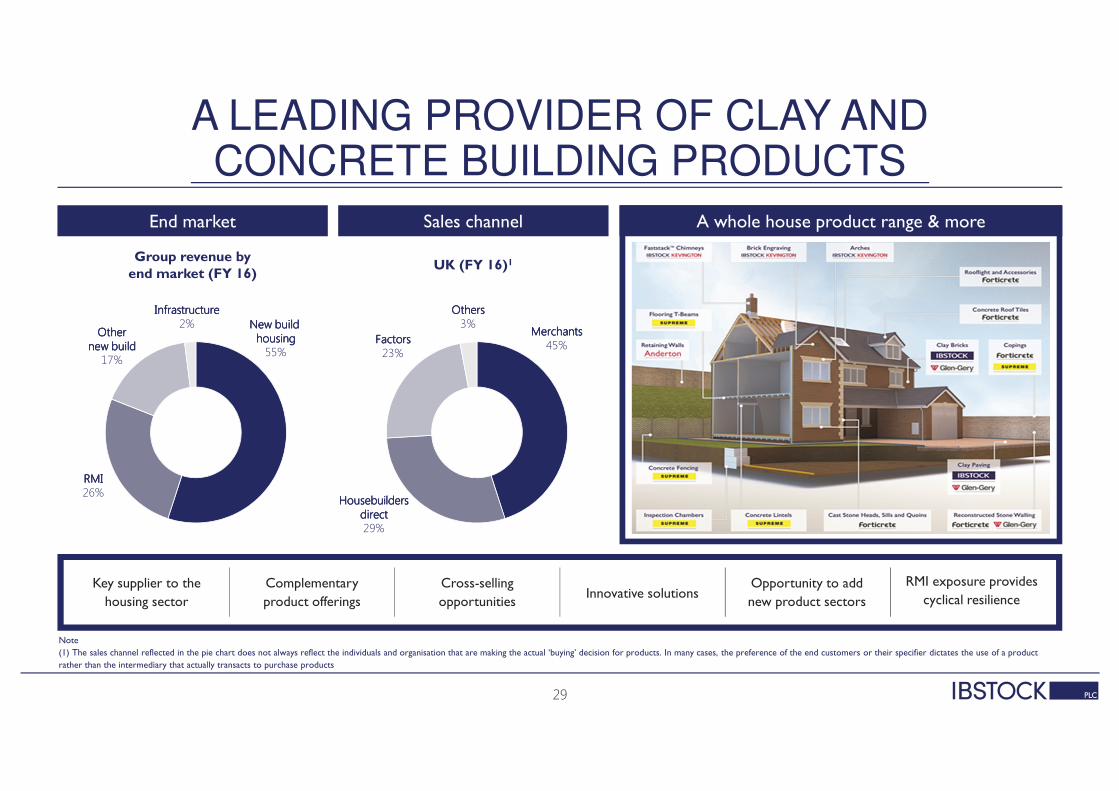
A LEADING PROVIDER OF CLAY AND CONCRETE BUILDING PRODUCTS
End market
Group revenue by end market (FY 16)
UK (FY 16)1
New build New build New build New build housinghousinghousinghousing55%
InfrastructureInfrastructureInfrastructureInfrastructure2%
RMIRMIRMIRMI26%
OtherOtherOtherOthernew buildnew buildnew buildnew build17%
Sales channel
Note
(1) The sales channel reflected in the pie chart does not always reflect the individuals and organisation that are making the actual ‘buying’ decision for products. In many cases, the preference of the end customers or their specifier dictates the use of a product
rather than the intermediary that actually transacts to purchase products
MerchantsMerchantsMerchantsMerchants45%
OthersOthersOthersOthers3%
Housebuilders Housebuilders Housebuilders Housebuilders directdirectdirectdirect29%
FactorsFactorsFactorsFactors23%
Key supplier to the
housing sector
Complementary
product offerings
Cross-selling
opportunitiesInnovative solutions
Opportunity to add
new product sectors
RMI exposure provides
cyclical resilience
A whole house product range & more
29

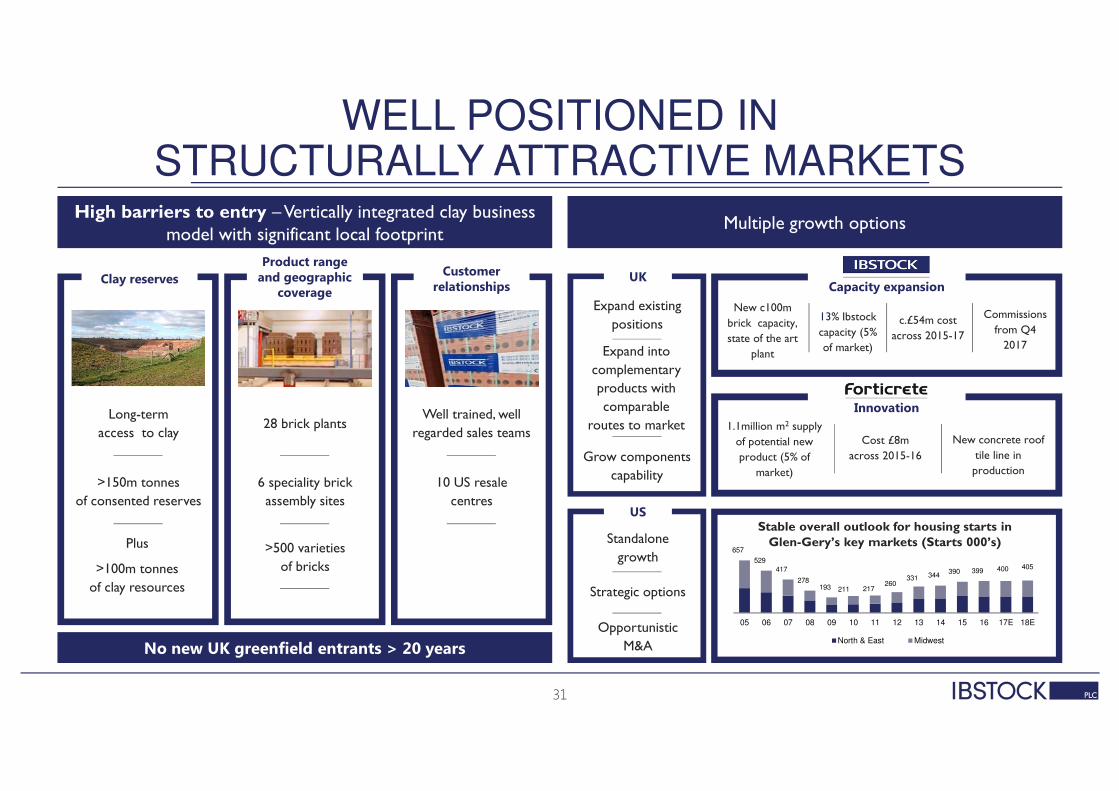
WELL POSITIONED IN STRUCTURALLY ATTRACTIVE MARKETS
UK Brick Market
0.9 0.8 0.9
2007 2016 2018
Ibstock Forterra Wienerberger Other
MAT May 2017 '98 - '07 Avg.
Imports (billions of bricks) UK brick capacity (billions)
0.25
2.62.62.62.6
2.02.02.02.02.12.12.12.1
0.1
Import volumes
peaked June 2015 at
c0.4bn MAT
Imports have higher
transport costs and
are exposed to forex
movements
Major additions to new
capacity have long lead
times
Existing capacity below
potential scale of the
market if housebuilding
volumes continue
to increase
Availability is partly a
function of domestic
demand levels in
Benelux
Permanent reduction
in capacity post 2008
financial crisis
Sources:- Imports – Govt statistics, Capacity – Company estimates
MAT – Moving Annual Total 30
657
529
417
278 193 211 217
260 331 344
390 399 400 405
05 06 07 08 09 10 11 12 13 14 15 16 17E 18E
North & East Midwest
Expand existing
positions
Expand into
complementary
products with
comparable
routes to market
Grow components
capability
Standalone
growth
Strategic options
Opportunistic
M&A
New c100m
brick capacity,
state of the art
plant
13% Ibstock
capacity (5%
of market)
c.£54m cost
across 2015-17
Commissions
from Q4
2017
1.1million m2 supply
of potential new
product (5% of
market)
Cost £8m
across 2015-16
New concrete roof
tile line in
production
Clay reserves
WELL POSITIONED IN STRUCTURALLY ATTRACTIVE MARKETS
Product range and geographic coverage
Customer relationships
No new UK greenfield entrants > 20 years
Long-term
access to clay
>150m tonnes
of consented reserves
28 brick plants
6 speciality brick
assembly sites
Well trained, well
regarded sales teams
10 US resale
centres
>500 varieties
of bricks
Stable overall outlook for housing starts in Glen-Gery’s key markets (Starts 000’s)
UK
US
Capacity expansion
Innovation
Multiple growth optionsHigh barriers to entry – Vertically integrated clay business
model with significant local footprint
31
Plus
>100m tonnes
of clay resources