Interim Results Presentation 2019 - Telkom · Broadband leadership •Upgrade from copper based to...
56
1 Interim Results Presentation 2019 Interim Results Presentation for the six months ended 30 September 2019 Telkom SA SOC Limited
Transcript of Interim Results Presentation 2019 - Telkom · Broadband leadership •Upgrade from copper based to...

1
Interim Results Presentation 2019
InterimResults Presentationfor the six months ended 30 September 2019
Telkom SA SOC Limited
2
Interim Results Presentation 2019
Operating environment
1
Interim Results Presentation 2019

3
Interim Results Presentation 2019
Tough trading environment
• Low GDP growth• Consumers under
pressure• Enterprise customers
deferring spend
Macro-economicenvironment
Competitiveenvironment
• Spectrum policy directive published
• Information Memorandum published for public comments
• Data market enquiry
Regulatory environment
• Fixed voice revenue under pressure
• Pricing pressure in Enterprise
• Competitive mobile propositions

4
Interim Results Presentation 2019
Business performance
2
Interim Results Presentation 2019

5
Interim Results Presentation 2019
Themes underlying performance
• Continued investment in key growth areas
• Investment in 4.5G technologies and fibre backhaul
Capital investment
Broadband leadership
• Upgrade from copper based to new technologies
• Higher customer retention on new technologies
Technology upgrade
• Highest home broadband customer base
• Highest FTTH connectivity rate • Highest mobile backhaul ratio
on fibre
6
Interim Results Presentation 2019Interim Results Presentation 2019
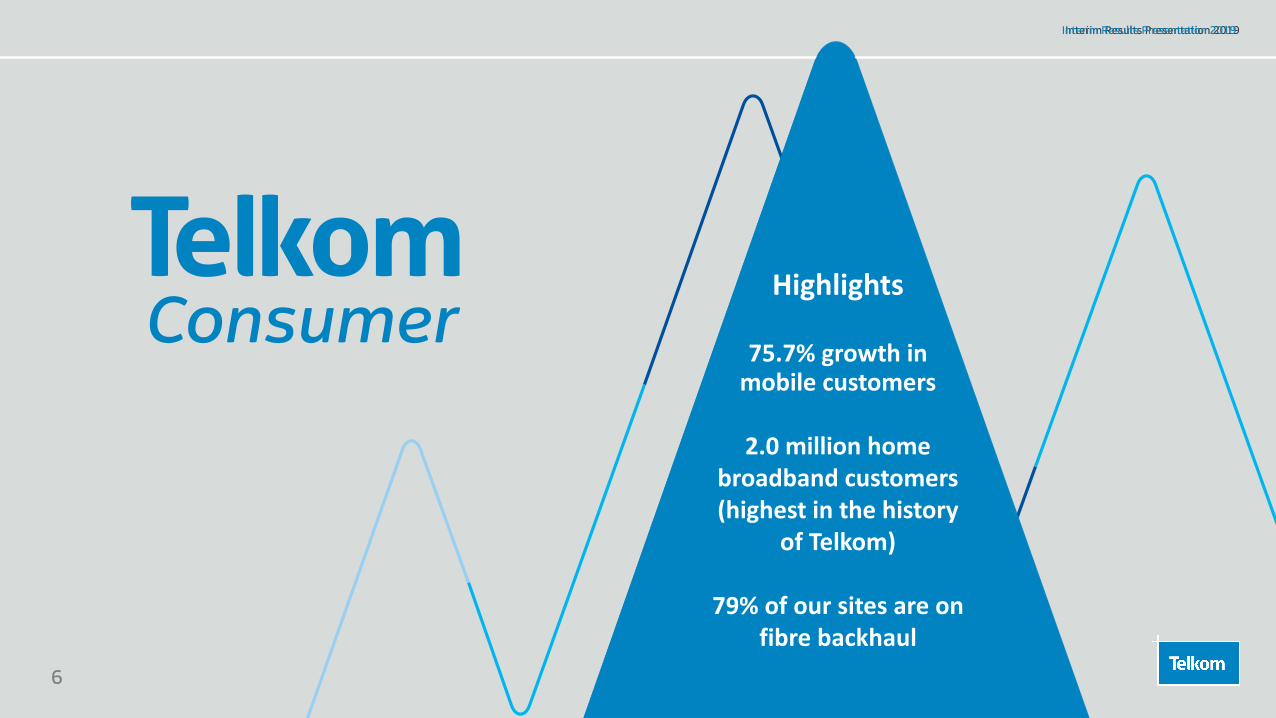
Highlights
75.7% growth in mobile customers
2.0 million home broadband customers(highest in the history
of Telkom)
79% of our sites are on fibre backhaul

7
Interim Results Presentation 2019
1 185 1 352
2 246
H1 FY2018 H1 FY2019 H1 FY2020
75.7%
3 035 4 878
9 398 1 330
1 667
2 103
H1 FY2018 H1 FY2019 H1 FY2020
4 3656 545
11 501
Pre-paidPost-paid
52 71 61
181191 178
H1 FY2018 H1 FY2019 H1 FY2020
91 104 82
Pre-paidPost-paid
1 713 2 669
3 907 614
909
1 695
H1 FY2018 H1 FY2019 H1 FY2020
Mobile growth trajectory continues Subscriber growth‘000
Blended ARPUR
Mobile service revenueR’m
Capex spendR’m
2 3273 578
5 602
DataVoiceOther
56.6%
66.1%21.1%

8
Interim Results Presentation 2019
73
159
265
H1 FY2018 H1 FY2019 H1 FY2020
501 407 304
180 206
213
788 962
1 530
H1 FY2018 H1 FY2019 H1 FY2020FWA/MiFi
Fixed BB high speeds (VDSL + Fibre)
Fixed BB lower speeds (ADSL)
1 4691 575
2 047
788 962 1 530 2 061
3 790 6 292
H1 FY2018 H1 FY2019 H1 FY2020
2 8494 752
7 822
Smartphone usersData only
Accelerated high-speed broadband growth Consumer home broadband subscribers‘000
Mobile broadband subscribers‘000
Mobile broadband trafficPetabytes
30.0%
66.7%
64.6%
9
Interim Results Presentation 2019
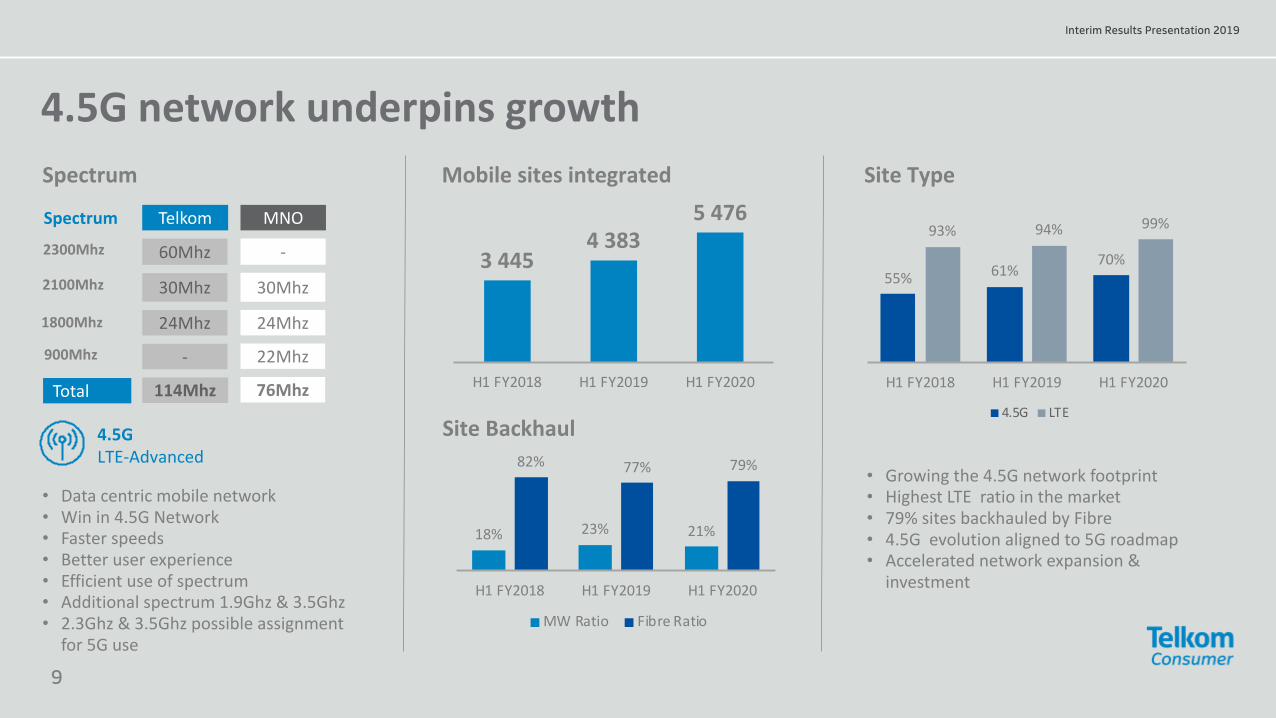
18% 23% 21%
82% 77% 79%
H1 FY2018 H1 FY2019 H1 FY2020
MW Ratio Fibre Ratio
4.5G network underpins growthSpectrum
• Data centric mobile network• Win in 4.5G Network • Faster speeds• Better user experience• Efficient use of spectrum• Additional spectrum 1.9Ghz & 3.5Ghz• 2.3Ghz & 3.5Ghz possible assignment
for 5G use
2300Mhz
2100Mhz
1800Mhz
900Mhz
Spectrum Telkom MNO
60Mhz
30Mhz
24Mhz
-
-
30Mhz
24Mhz
22Mhz
Total 114Mhz 76MhzTotal
Site Type
• Growing the 4.5G network footprint• Highest LTE ratio in the market• 79% sites backhauled by Fibre• 4.5G evolution aligned to 5G roadmap• Accelerated network expansion &
investment
Mobile sites integrated
Site Backhaul
3 4454 383
5 476
H1 FY2018 H1 FY2019 H1 FY2020
55% 61%70%
93% 94% 99%
H1 FY2018 H1 FY2019 H1 FY2020
4.5G LTE
4.5GLTE-Advanced

10
Interim Results Presentation 2019
Capacity & coverage expansion
Mobile sitesintegrated
Network capacity
24.9%
5 476 sites Massive MIMO Upgrades
2CC & 3CC Upgrades
Mobile Core Expansions & New Elements
0102
164
0
50
100
150
200
H1 FY2018 H1 FY2019 H1 FY2020
1621280
2280
0
500
1000
1500
2000
2500
H1 FY2018 H1 FY2019 H1 FY2020
14132832
3408
0
1000
2000
3000
4000
H1 FY2018 H1 FY2019 H1 FY2020
16 6
14 5 5
0
5
10
15
20
H1 FY2018 H1 FY2019 H1 FY2020
Expansion New
2100 Refarming

11
Interim Results Presentation 2019
Highlights
Strong EBITDA growth up 22.6% with a margin of
16.8%
IT revenue up 1% in a weak economy
Portfolio review concluded

12
Interim Results Presentation 2019
Successful execution
Improved profitability
• Organisation cost-to-serve reduced resulting in 22.6% increase in EBITDA
• EBITDA margin expanding by 3.6 percentage basis from 13.2% to 16.8%
Portfolio review concluded
• Complexity removed, legal entity reduced from 34 to 5
• Remaining subsidiaries retained for cross-border presence
Increased focus on customer experience• Improvement on the NPS score, this
improvement is 4 points
13
Interim Results Presentation 2019
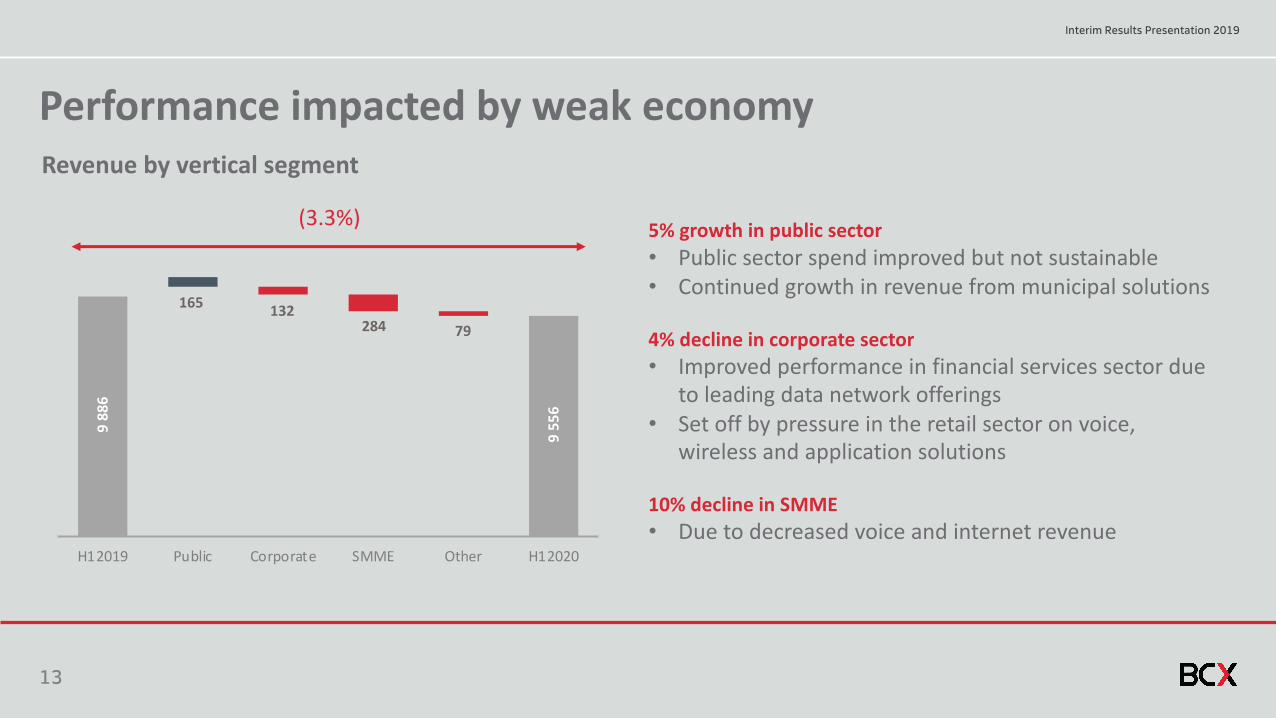
Performance impacted by weak economy
5% growth in public sector • Public sector spend improved but not sustainable• Continued growth in revenue from municipal solutions
4% decline in corporate sector• Improved performance in financial services sector due
to leading data network offerings• Set off by pressure in the retail sector on voice,
wireless and application solutions
10% decline in SMME• Due to decreased voice and internet revenue
Revenue by vertical segment
(3.3%)
9 88
6
165 132 284 79
9 55
6 H12019 Public Corporate SMME Other H12020
14
Interim Results Presentation 2019
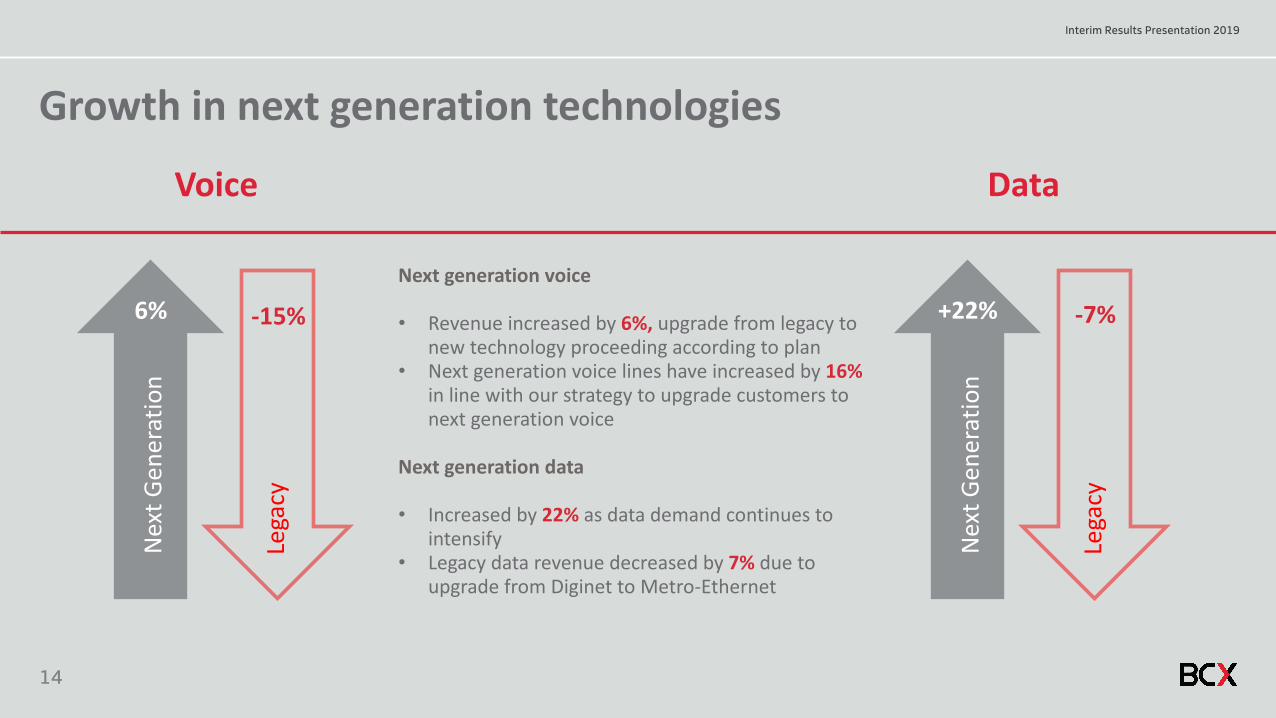
Growth in next generation technologies
Next generation voice
• Revenue increased by 6%, upgrade from legacy to new technology proceeding according to plan
• Next generation voice lines have increased by 16% in line with our strategy to upgrade customers to next generation voice
Next generation data
• Increased by 22% as data demand continues to intensify
• Legacy data revenue decreased by 7% due to upgrade from Diginet to Metro-Ethernet
Nex
t Gen
erat
ion
Lega
cy6%
Voice
-15%
Nex
t Gen
erat
ion
Lega
cy
+22%
Data
-7%
15
Interim Results Presentation 2019
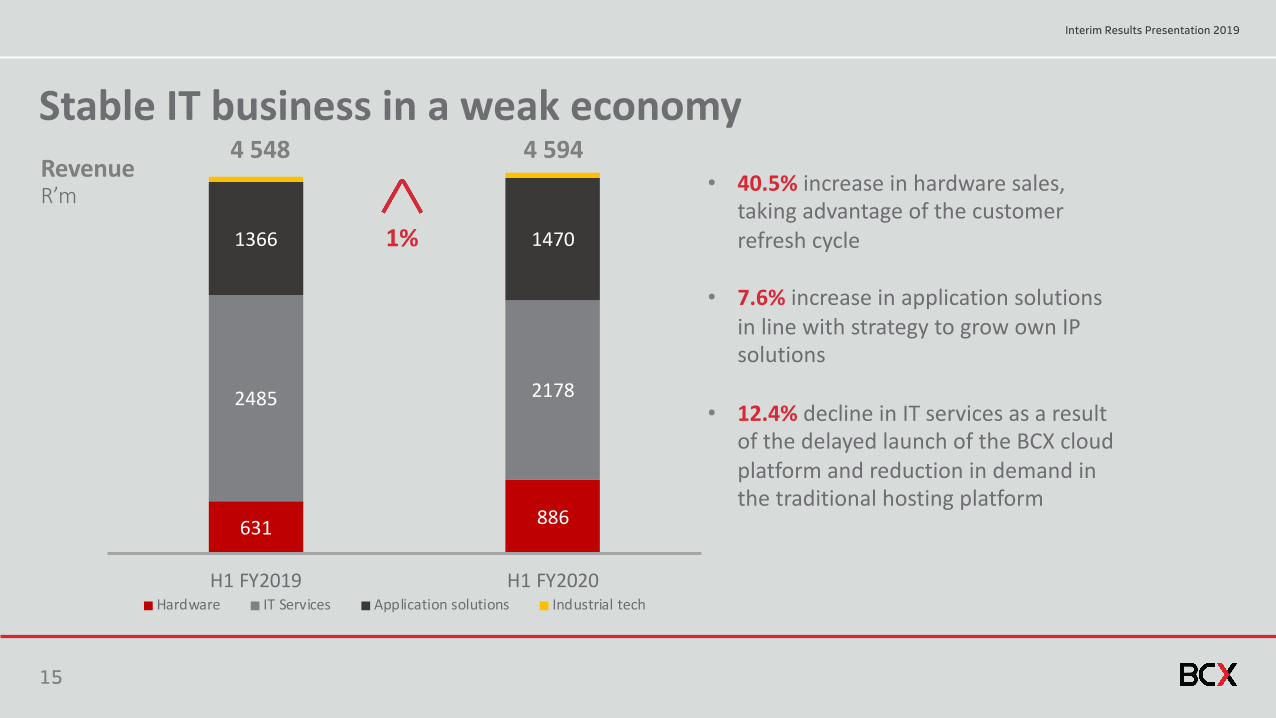
Stable IT business in a weak economy
631 886
2485 2178
1366 1470
H1 FY2019 H1 FY2020Hardware IT Services Application solutions Industrial tech
4 548 4 594• 40.5% increase in hardware sales,
taking advantage of the customer refresh cycle
• 7.6% increase in application solutions in line with strategy to grow own IP solutions
• 12.4% decline in IT services as a result of the delayed launch of the BCX cloud platform and reduction in demand in the traditional hosting platform
RevenueR’m
1%

16
Interim Results Presentation 2019
Reduce cost to serve
• Margin expansion due 7% reduction in costs, with 3% reduction in revenue
• 15% decrease in employee expenses, due to headcount reduction of 28%
• 7% decrease in selling, general and administration cost due to cost optimisation programme
• EBITDA margin improvement from 13.2% to 16.8%
982 1166500 433
2460 2093
4257 3949
428360
H1 FY2019 H1 FY2020Service fees, operating leasesSelling, general and administrationEmployee expensesSales commission, incentive, logistical costs, payment to other operatorsCost of handsets, equipment and directories
8 0018 627Total expense
R’m7.3%

17
Interim Results Presentation 2019
Highlights
42.6% FTTH connectivity rate
14.2% growth in fixed line
broadband data consumption
28.5% growth in Ethernet business

18
Interim Results Presentation 2019
390
488558
H1 FY2018 H1 FY2019 H1 FY2020
Fixed line broadband data consumption1
PetabytesEthernetbusiness
42 417services
connected
28.5%
Fibre to the base stations
7 388connected
7.4%
Homes connected
195 416connectivity
rate of
42.6%14.2%
1Access links
Connectivity gateway
19
Interim Results Presentation 2019
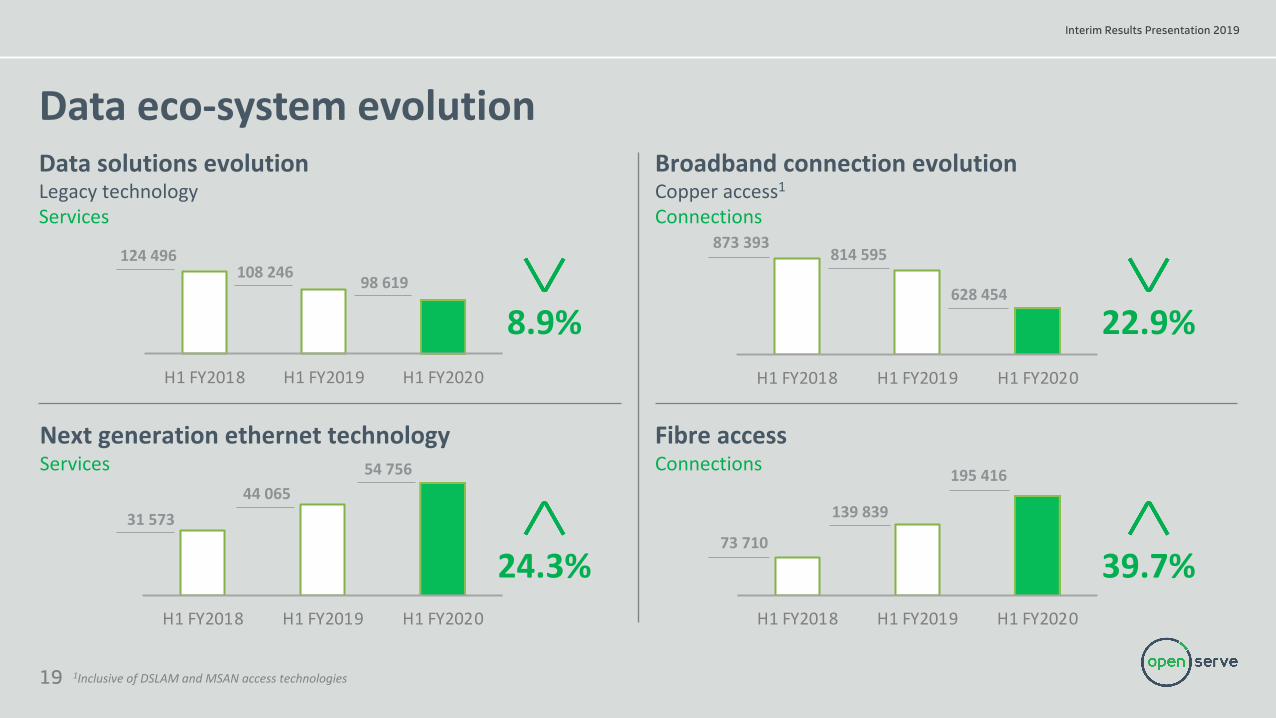
Data solutions evolutionLegacy technologyServices
Data eco-system evolution
124 496108 246 98 619
H1 FY2018 H1 FY2019 H1 FY2020
31 57344 065
54 756
H1 FY2018 H1 FY2019 H1 FY2020
873 393814 595
628 454
H1 FY2018 H1 FY2019 H1 FY2020
73 710
139 839
195 416
H1 FY2018 H1 FY2019 H1 FY2020
1Inclusive of DSLAM and MSAN access technologies
Next generation ethernet technologyServices
Broadband connection evolutionCopper access1
Connections
Fibre accessConnections
24.3% 39.7%
8.9% 22.9%
20
Interim Results Presentation 2019
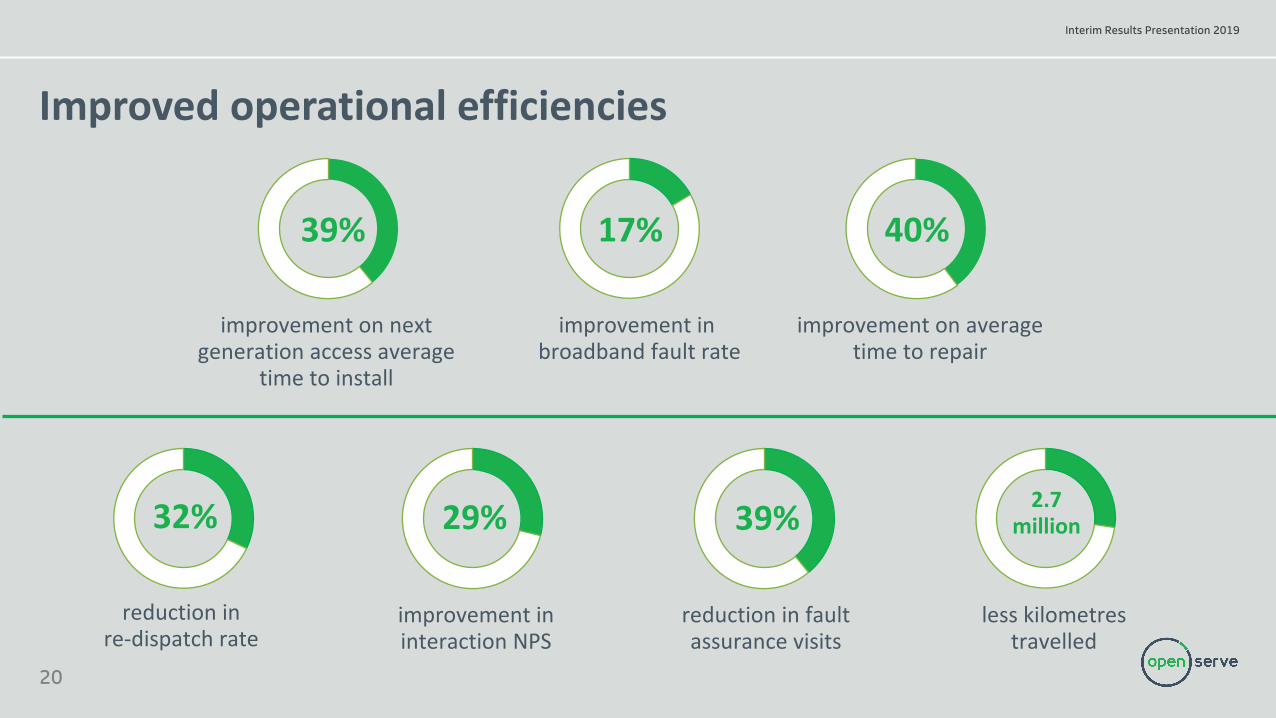
40%
Improved operational efficiencies
improvement on next generation access average
time to install
39% 17%
improvement inbroadband fault rate
improvement on average time to repair
32%
reduction in re-dispatch rate
29%
improvement in interaction NPS
39%
reduction in fault assurance visits
2.7 million
less kilometres travelled
21
Interim Results Presentation 2019
Highlights
44.1% increase in M&T revenue
11.4% growth in total tenant
18.5% growth in EBITDA margin
First 5G small cell site live

22
Interim Results Presentation 2019
M&T Portfolio performance
H1 FY2019 H1 FY2020
456
657
H1 FY2019 H1 FY2020
8 5779 551
H1 FY2019 H1 FY2020
175382
RevenueR’m
44.1%
EBITDAR’m
118.3%
11.4%
Total tenant growthNumber of leases
38.4%58.1%
H1 FY2019 H1 FY2020
EBITDA margin (%)

23
Interim Results Presentation 2019
M&T portfolio: Independent valuation
Commercially productive portfolio
• Independent valuation based on a portfolio of 3 648 commercially productive towers
FY2020 valuation considerations
Build-to-suit sites
• Development of 2 000 towers over the next 3 years, driven mainly by demand from MNOs
Small cells• New small cells and rooftop
towers for densification and preparation for 5G
Note: Valuation conducted by Delta Partners
Future additional valuation considerations
Portfolio valuation summary
Productive portfolio 3 648 towers
FY2020 EV/EBITDA Multiple 11.2x
Portfolio valuation R9.1 billion

24
Interim Results Presentation 2019
Note: § Mixed-use developments (office, retail, residential and
hospitality)§ Commercial developments (industrial, office and retail)§ Social infrastructure developments (residential, student
accommodation and educational facilities)
Disposal pipeline
Sectoral spread (CAPEX)
Sectoral spread (GLA)
Commercial21%
Social Infra
structure25%
Mixed-Use54%
Commercial16%
Social Infra
structure26%
Mixed-Use58%
Unlocking value
34
122
Property development pipeline – 16 Projects
Note: § Current sales properties § Planned disposals
Identified disposal properties (156)

25
Interim Results Presentation 2019
Financial Overview
3
Interim Results Presentation 2019

26
Interim Results Presentation 2019
Key factors impacting results
Marginpressure
IFRS 16 adoption
Financial risk management
Capex acceleration
Weak economic environment

27
Interim Results Presentation 2019
IFRS 16 impactCATEGORY
Balance Sheet
Income Statement
Cash Flow
Net Debt/EBITDA
IAS 17 (Previous standard)
• Lease smoothing receivable/payable
• Operating lease on straight line basis in operating expenses
• Lease payment in operating activities
• Operating lease payment in EBITDA
IFRS 16 (New standard)
• Recognise right of use of asset• Recognise lease liability
• Reduced operating lease (higher EBITDA)• Depreciation on right of use asset • Interest expense on lease liability• PAT• HEPS
• Lease payment in financing activities
• Higher EBITDA• Higher net debt
IMPACT
• R3.9bn• R4bn
• R564m• (R456m)• (R183m)• (R54m) • (10.9 cents)
• Reclassification on cash flow statement
• Increase by 0.2x

28
Interim Results Presentation 2019
Group performance
RmH1 FY2020 (IFRS 16)
H1 FY2020 (IAS 17)
H1 FY2019 (IAS 17) %
Operating Revenue1 21 479 21 479 20 511 4.7
Direct expenses 5 726 5 726 4 200 (36.3)
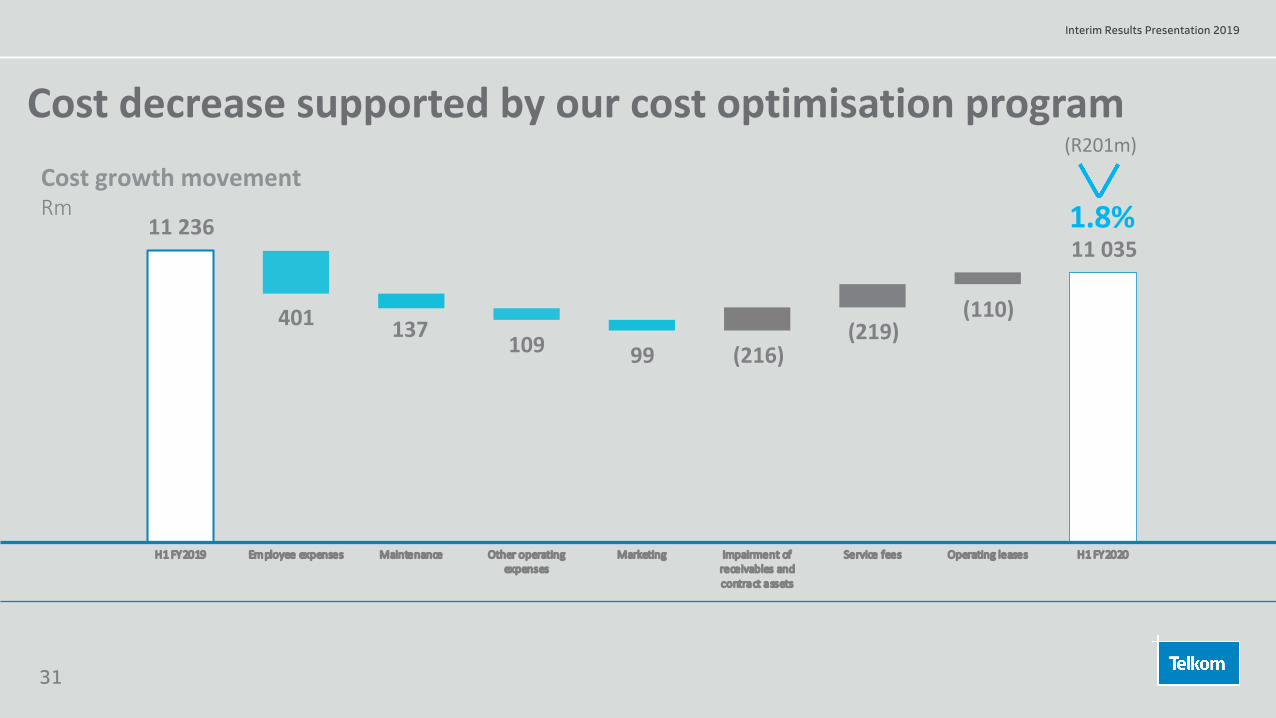
Operating expenses (excl. depreciation) 10 471 11 035 11 236 1.8
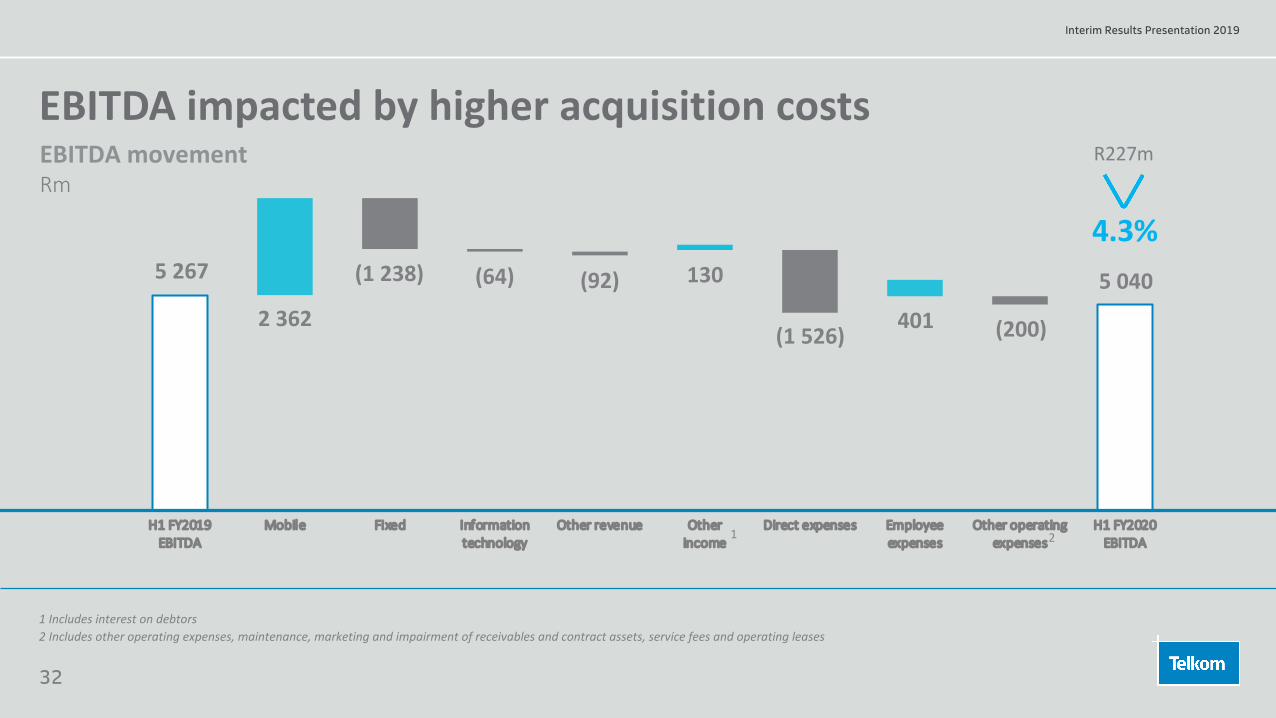
EBITDA 5 604 5 040 5 267 (4.3)
Headline earnings per share (cents) 183.4 194.3 327.8 (40.7)
Interim dividend (cents) 71.5 71.5 112.1 (35.7)
Capital investments 4 238 4 238 3 276 29.4
Free cash flow (1 267) (1 267) 138 (1 018.1)
All commentary, messaging and indicators in this presentation for H1 FY2020 exclude the impact of the adoption of IFRS 16. The IFRS 16 impact is a decrease of R564m on operating leases and depreciation and finance charges increase by R456 million and R183 million respectively. The related tax impact is R21 million. The comparative period exclude voluntary severance package (VSP) and voluntary early retirement packages (VERP) of R282 million and the related tax impact of R80 million. 1During the year we restated the prior period revenue by R337 million that relates to an erroneous consolidation of Smart Office Connexion, which was reported in March 2019.
29
Interim Results Presentation 2019
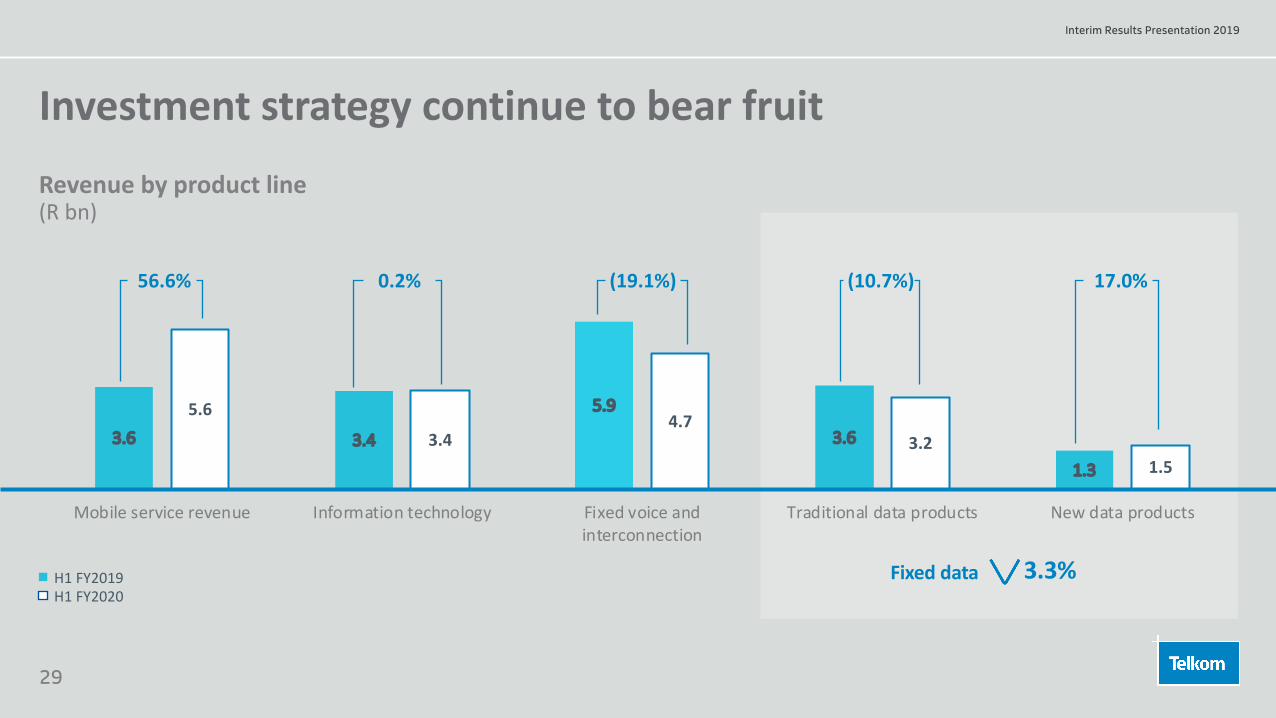
3.6 3.4
5.9
3.6
1.3
5.6
3.44.7
3.21.5
Mobile service revenue Information technology Fixed voice andinterconnection
Traditional data products New data products
Investment strategy continue to bear fruit
H1 FY2019H1 FY2020
3.3%Fixed data
56.6% 0.2% (19.1%) (10.7%) 17.0%
Revenue by product line(R bn)

30
Interim Results Presentation 2019
Higher direct expenses in support of mobile growth
11.7 10.4
4.7 7.1
3.43.40.3
0.40.40.2
H1 FY2019 H1 FY2020
1.3 1.8
2.3
2.90.6
1.0
H1 FY2019 H1 FY2020
+1.5
4.2
4.7%
36.3%
Direct expenses (R bn)
Group revenue(R bn)
Sales commission, incentives and logistical costsCost of handset, equipment and directoryPayments to other operators
5.7
OtherGyroInformation technologyMobileFixed
20.521.5
Amount includes:• Once off roaming
costs – R132m• Once off migration
costs – R78m
31
Interim Results Presentation 2019
H1 FY2019 Employee expenses Maintenance Other operatingexpenses
Marketing Impairment ofreceivables andcontract assets
Service fees Operating leases H1 FY2020
Cost decrease supported by our cost optimisation program
11 236
137(216)
401
11 035
(R201m)
(219)
1.8%
109(110)
Cost growth movementRm
99
32
Interim Results Presentation 2019
H1 FY2019EBITDA
Mobile Fixed Informationtechnology
Other revenue Otherincome
Direct expenses Employeeexpenses
Other operatingexpenses
H1 FY2020EBITDA
EBITDA impacted by higher acquisition costs
5 267
1 Includes interest on debtors
2 362 (200)(1 526)
5 040
EBITDA movementRm
(64)
R227m
(92)
4.3%
2 Includes other operating expenses, maintenance, marketing and impairment of receivables and contract assets, service fees and operating leases
1 2
(1 238) 130
401

33
Interim Results Presentation 2019
H1 FY2019Profit before tax
Operating profit Investmentincome
Finance charges Cost of hedging Fair valuemovements
Interest rateswaps
H1 FY2020Profit before tax
Earnings decline due to fair value adjustments
2 148
(392) (57) (118) (40)1 318
R830m
38.6%
(81)
Profit before tax movementRm
(142)

34
Interim Results Presentation 2019
10
11
12
13
14
15
16
4/3/
2017
5/3/
2017
6/3/
2017
7/3/
2017
8/3/
2017
9/3/
2017
10/3
/201
7
11/3
/201
7
12/3
/201
7
1/3/
2018
2/3/
2018
3/3/
2018
4/3/
2018
5/3/
2018
6/3/
2018
7/3/
2018
8/3/
2018
9/3/
2018
10/3
/201
8
11/3
/201
8
12/3
/201
8
1/3/
2019
2/3/
2019
3/3/
2019
4/3/
2019
5/3/
2019
6/3/
2019
7/3/
2019
8/3/
2019
9/3/
2019
10/3
/201
9
6.4
6.5
6.6
6.7
6.8
6.9
7
7.1
7.2
7.3
7.4
7.5
4/3/
2017
5/3/
2017
6/3/
2017
7/3/
2017
8/3/
2017
9/3/
2017
10/3
/201
7
11/3
/201
7
12/3
/201
7
1/3/
2018
2/3/
2018
3/3/
2018
4/3/
2018
5/3/
2018
6/3/
2018
7/3/
2018
8/3/
2018
9/3/
2018
10/3
/201
8
11/3
/201
8
12/3
/201
8
1/3/
2019
2/3/
2019
3/3/
2019
4/3/
2019
5/3/
2019
6/3/
2019
7/3/
2019
8/3/
2019
9/3/
2019
10/3
/201
9
Impact of financial risk managementSep-19 Sep-18 Movement
Cost of hedging 116 76 (40)Forex and fair value movements 22 (201) (223)Forex movements (30) (172) (142)Interest rate swaps 52 (29) (81)
3 Month - JIBAR(%)
ZAR/USD historical exchange rates(ZAR/USD)
Forward exchange contracts placed at favourable spot rate Lower interest rate environment in H1 results in unfavourable interest rate swaps
Sep-19 (IFRS16) Sep-19 (IAS 17) Sep-18 (IAS17)
Net finance charges
864 681 563
Movement 183 118

35
Interim Results Presentation 2019
Financial risk management - FY2016 to FY2020
H1 FY2020 H1 FY2019 H1 FY2018 H1 FY2017Foreign exchange and fair value movements 138 (125) (6) 78
Cost of hedging 116 76 123 100
Forex & fair value movements (30) (172) (119) (40)
Interest rate swaps 52 (29) (10) 18
FY2019 FY2018 FY2017 FY2016Foreign exchange and fair value movements 62 (42) 270 101
Cost of hedging 210 221 218 129
Forex & fair value movements (167) (269) 24 −
Interest rate swaps 19 6 28 (28)
36
Interim Results Presentation 2019
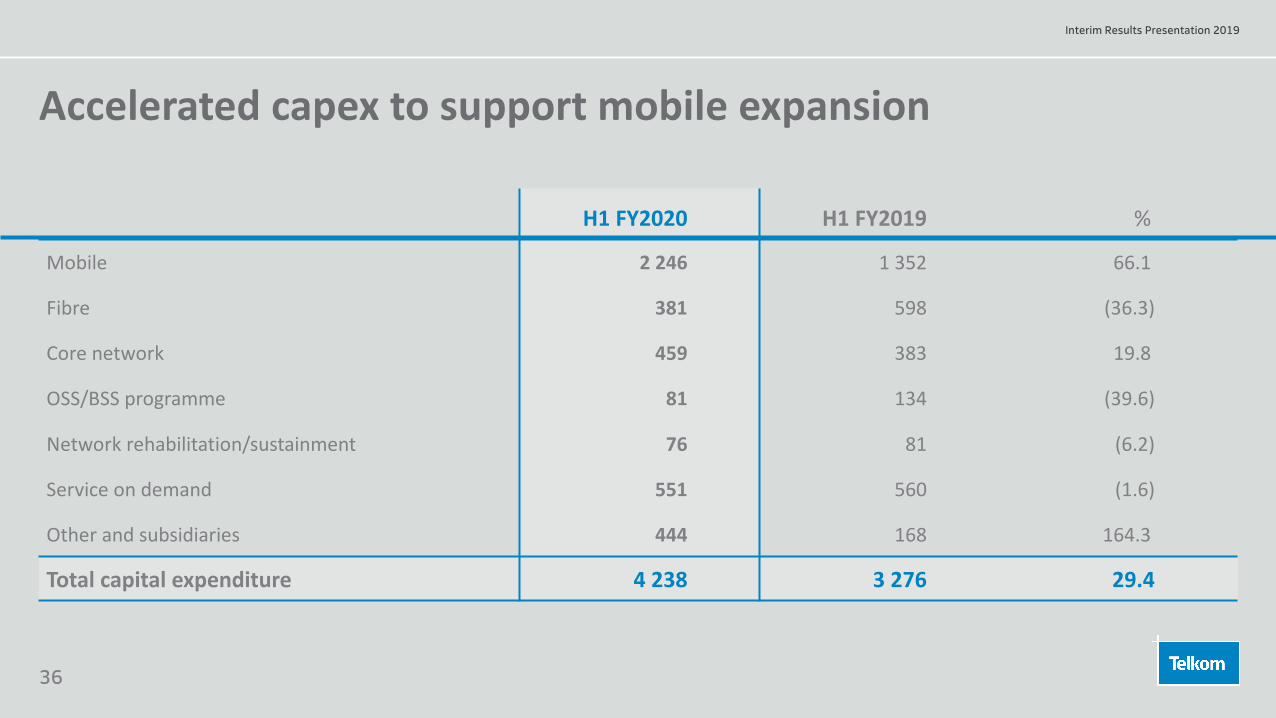
Accelerated capex to support mobile expansion
H1 FY2020 H1 FY2019 %
Mobile 2 246 1 352 66.1
Fibre 381 598 (36.3)
Core network 459 383 19.8
OSS/BSS programme 81 134 (39.6)
Network rehabilitation/sustainment 76 81 (6.2)
Service on demand 551 560 (1.6)
Other and subsidiaries 444 168 164.3
Total capital expenditure 4 238 3 276 29.4
37
Interim Results Presentation 2019
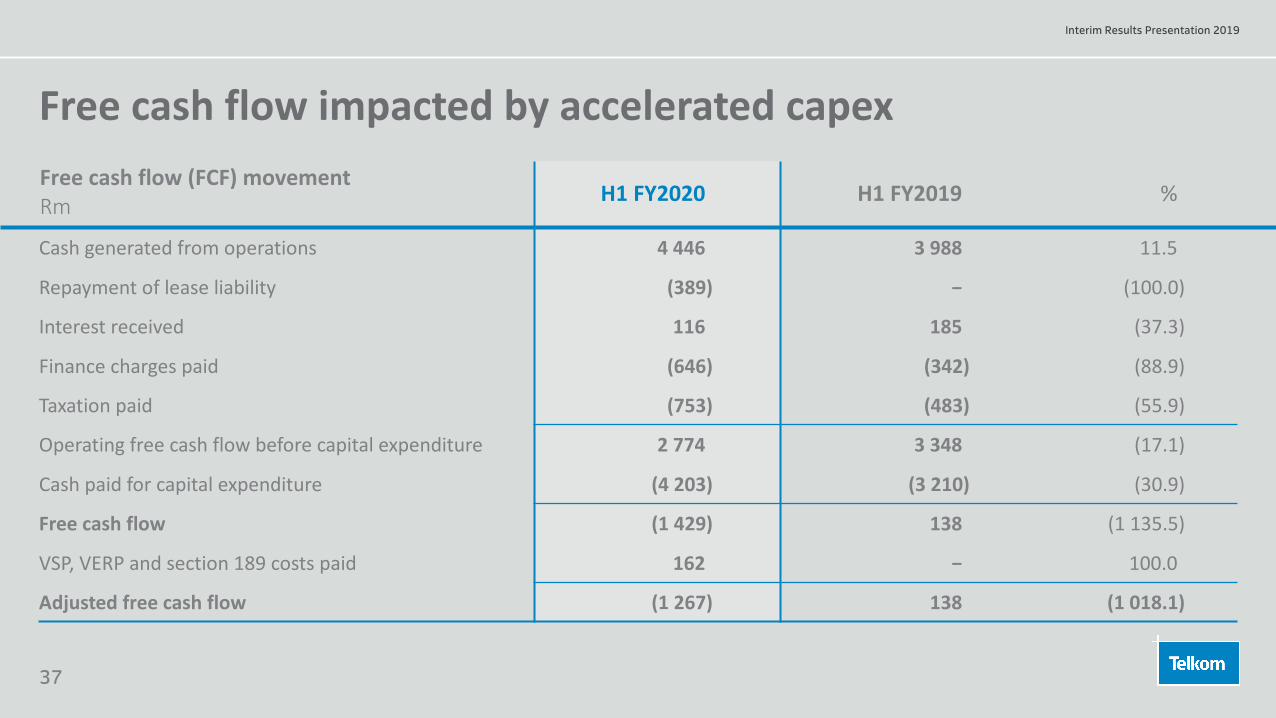
Free cash flow impacted by accelerated capexFree cash flow (FCF) movementRm H1 FY2020 H1 FY2019 %
Cash generated from operations 4 446 3 988 11.5
Repayment of lease liability (389) − (100.0)
Interest received 116 185 (37.3)
Finance charges paid (646) (342) (88.9)
Taxation paid (753) (483) (55.9)
Operating free cash flow before capital expenditure 2 774 3 348 (17.1)
Cash paid for capital expenditure (4 203) (3 210) (30.9)
Free cash flow (1 429) 138 (1 135.5)
VSP, VERP and section 189 costs paid 162 − 100.0
Adjusted free cash flow (1 267) 138 (1 018.1)

38
Interim Results Presentation 2019
Healthy balance sheet H1 FY2020 FY2019 %
Cash balances 1 002 1 428 (29.8)
Interest bearing debt
Opening balance 10 241 9 397 (9.0)
Net Funding raised 2 395 702 (241.2)
Other 141 142 (75.4)
Closing balance 12 777 10 241 (25.8)
Net debt* 11 775 8 813 (33.6)
Net debt/EBITDA (times)* 1.2 0.8 0.4
Average cost of debt (%) 9.7 9.6 0.1
Debt maturity profile
0
500
1000
1500
2000
2500
3000
3500
4000
F2020 F2021 F2022 F2023 F2024 F2025 F2026 F2027
R'm
Bonds Term Loans Commercial Paper Call Borrowing Foreign Loans
BB+
Baa3
Long-term credit rating
• Total gross debt R12.8 billion (H1 FY2019 R10.2 billion)• R1.5 billion of TL20 switched to a new five and seven year bond• ECA funding secured in October 2019 with a 10 year tenure
*Excludes the impact of IFRS 16
39
Interim Results Presentation 2019
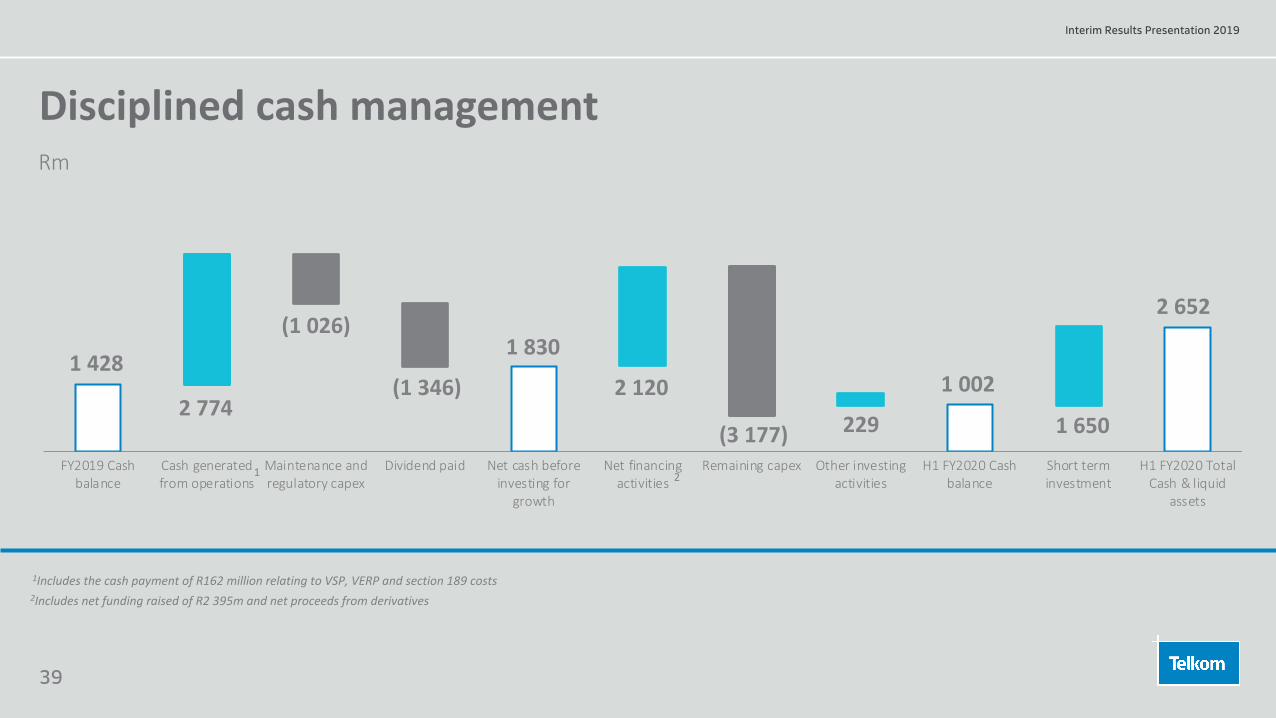
Disciplined cash management
1Includes the cash payment of R162 million relating to VSP, VERP and section 189 costs2Includes net funding raised of R2 395m and net proceeds from derivatives
FY2019 Cashbalance
Cash generatedfrom operations
Maintenance andregulatory capex
Dividend paid Net cash beforeinvesting for
growth
Net financingactivities
Remaining capex Other investingactivities
H1 FY2020 Cashbalance
Short terminvestment
H1 FY2020 TotalCash & liquid
assets
1 428
2 774
(1 026)
(1 346) 2 120
(3 177) 229
1 0021 830
1 2
Rm
1 650
2 652

40
Interim Results Presentation 2019
Progress against guidance
FY2019 – FY2021 Guidance*
H1 FY2020Actual
FY2020 – FY2021 Updated Guidance*
Operating revenue Mid-single digit 4.7% Mid-single digit
EBITDA Mid-single digit (4.3%) Mid-single digit
Capex to revenue 16% - 20% 19.7% 16% - 20%
Net debt to EBITDA (times)
1x (pre IFRS 16)1.2x (post IFRS 16)
1.2x (pre IFRS 16)1.4x (post IFRS 16) ≤ 1.5X (post IFRS 16)
* This excludes Corporate Action (M&A and Spectrum)

41
Interim Results Presentation 2019
Disciplined capital allocation framework
Framework that supports our sustainable value creation:
• Capital & Operational productivity
• Maintain a healthy balance sheet
• Optimal capital prioritisation criteria
• Maximise shareholder returns
Defend and grow
Protect decline in legacy business:• Upgrade customers
to new technologies
Accelerate new revenue streams:• Mobile, M&T, IT Solutions
Sustainable cost management
Effectively manage and contain cost escalation:
• External Spend• Process & Organisation• Rationalise IT landscape• Reduce Cost-to-serve
Positive free cash flow
• Optimise net working capital
• Supply chain financing• Handset financing• Opportunistic sale of
non-core assets
Sustainable financial framework
R

42
Interim Results Presentation 2019
Targets Measured against H1 FY2020 actuals
H2 quick win initiatives
H2 Cost to Revenue target of 75%
Sustainable cost management
3rd party contracts review
Reduce cost to acquire/serve
Optimize network utilisation
IT simplification and rationalisation
Various opex initiatives
Cost to revenue ratio 78%
Opex below inflationOpex
reduced 1.8%
Cost to revenue 75% to 73% by FY2022
Limit cost escalation To below inflation
Non-exhaustive

43
Interim Results Presentation 2019
Improve operating free cash flow
H2 KEY INITIATIVES
R700m - R1bn target
Supply chain financing
Handsets receivables financing
Disposal of non-core assets
R

44
Interim Results Presentation 2019
Capital allocation framework
Maintain a strong balance sheet
Portfolio review across investment decisions
Outputs
2
1 4
Operational cashflow and cash release initiatives/divestments
Maintenance & Regulatory CAPEX Organic Growth
Debt Issuance
Alternative Funding Solutions
Total Shareholder Returns
OptimalPerformance
Annual Strategic Planning/Investment Strategy
Sources of Capital
Inputs
3Dividend
Uses of Capital
*Selective M&A and spectrum Dividend policy will be reviewed in H2 in line with Capital Allocation Framework
Corporate Corporate Action

45
Interim Results Presentation 2019
Conclusion
4
Interim Results Presentation 2019

46
Interim Results Presentation 2019
Business evolution
5
Interim Results Presentation 2019

47
Interim Results Presentation 2019
Benefits of the operating model
• Transparency of individual BU performance
• Segment P&L reporting
• Transfer pricing for transactions between BUs implemented
• Standalone BUs
• Customer segmentation
• Increased focus on respective markets
• Improved BU identity and ownership of business
• Focus on BU cost structures to extract efficiencies
• Focus on different BU capital requirements
• Manage BUs based on different return profiles
• Trading model between BUs implemented
• Open access wholesale products
• Separation facilitates regulatory approval for inorganic growth
• Identify specific needs of the individual BUs
• Partnerships can be aligned to BU specific needs
• Different partnership options can be implemented
Profit accountability
Commercial focus
Cost & capital efficiency
Regulatory compliance
Strategic flexibility
• Valuation improved over the years
• Sum of the parts not achieved yet
Value realisation

48
Interim Results Presentation 2019
Evidence of the evolution
56%32%
3%
1%8%
Fixed voiceFixed dataMobileITOther
FY2013
22%
23%33%
16%
6%
H1 FY2020
49
Interim Results Presentation 2019
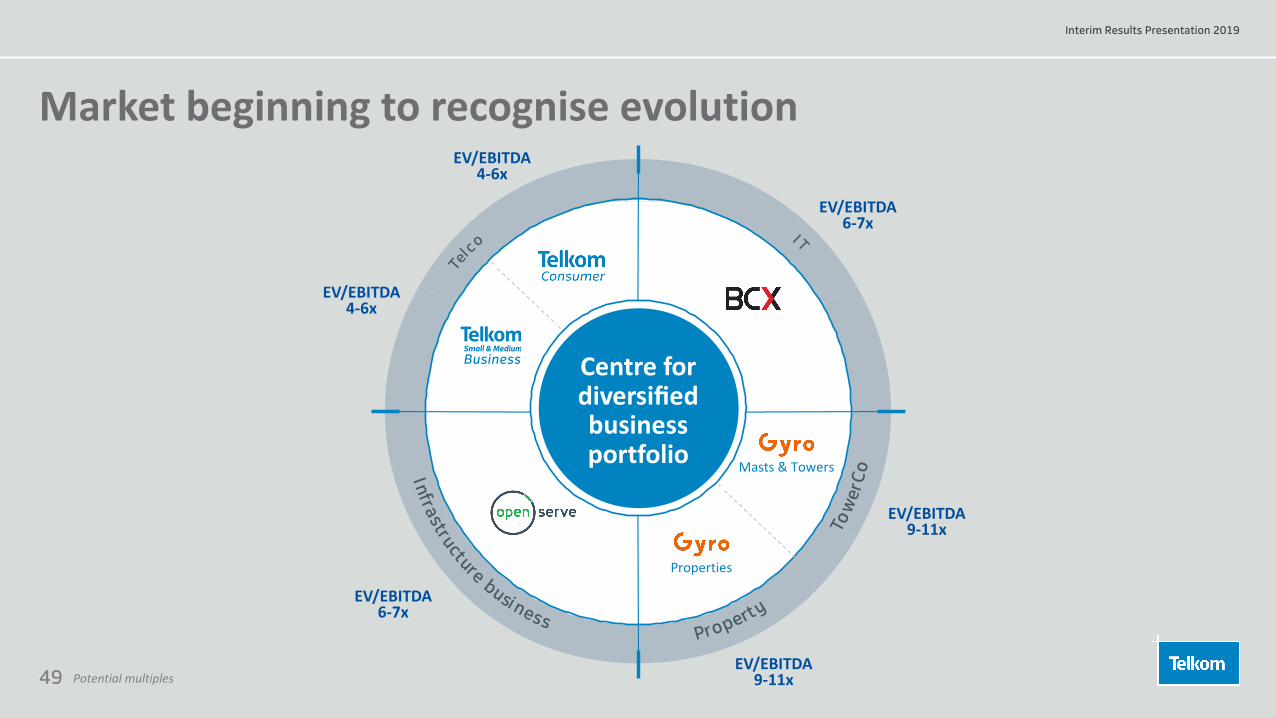
Infrastructure business
Te
lco
Property
Tow
erCo
I T
Market beginning to recognise evolution
EV/EBITDA6-7x
EV/EBITDA9-11x
EV/EBITDA4-6x
Centre for diversified business portfolio
EV/EBITDA6-7x
EV/EBITDA9-11x
Masts & Towers
Properties
Potential multiples
EV/EBITDA4-6x
50
Interim Results Presentation 2019
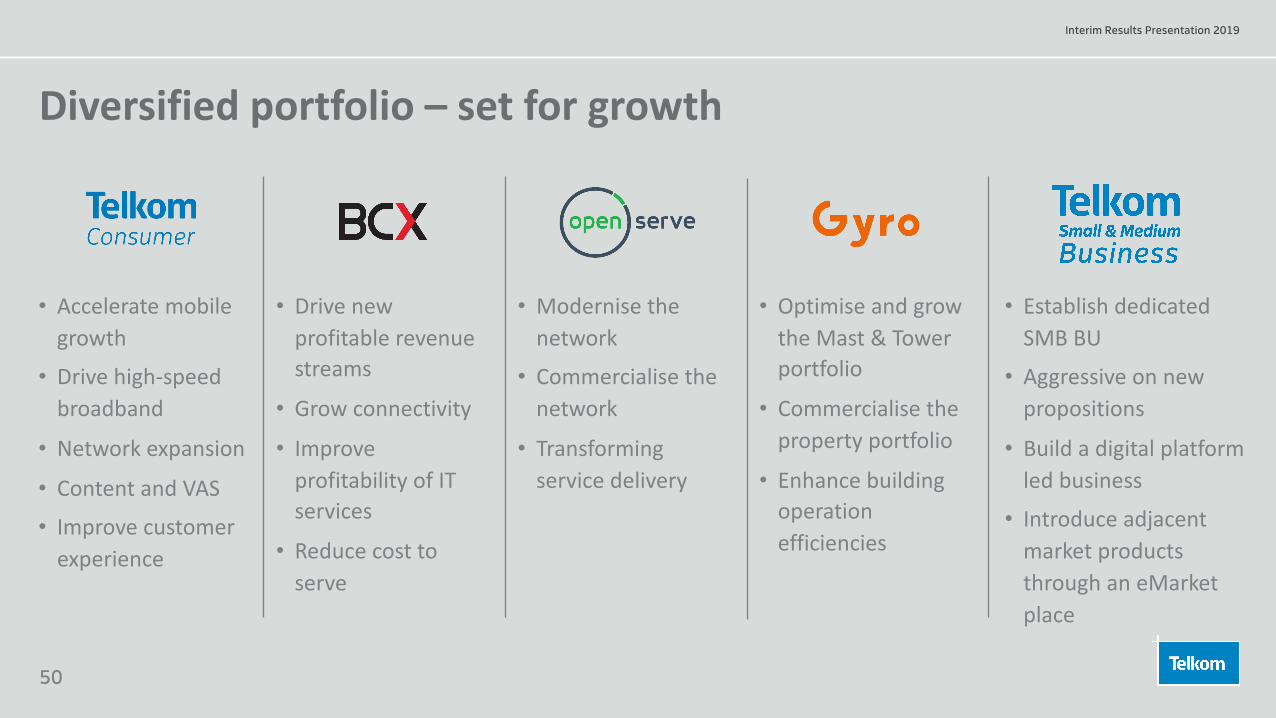
Diversified portfolio – set for growth
• Accelerate mobile growth
• Drive high-speed broadband
• Network expansion
• Content and VAS
• Improve customer experience
• Drive new profitable revenue streams
• Grow connectivity
• Improve profitability of IT services
• Reduce cost to serve
• Modernise the network
• Commercialise the network
• Transforming service delivery
• Optimise and grow the Mast & Tower portfolio
• Commercialise the property portfolio
• Enhance building operation efficiencies
• Establish dedicated SMB BU
• Aggressive on new propositions
• Build a digital platform led business
• Introduce adjacent market products through an eMarket place
51
Interim Results Presentation 2019
Spectrum assignment
6
Interim Results Presentation 2019

52
Interim Results Presentation 2019
National development plan
• Mobile market structure needs to be reviewed• Optimal spectrum
assignment• Spectrum policy must
favour competition
28 Sept 201615 May 2016
National integrated ICT policy
• 3.5 spectrum to be licensed now• Less spectrum to
WOAN• Auction preferred
licensing method
24 April 2019
Data market enquiry
• Spectrum licensing must address competition• WOAN one of the tools
to address competition
Policy Direction/ Policy amendment
26 July 2019
• Hybrid model• Preferential treatment for
WOAN• ICASA to hold off 3.5 & study
optimal way to license it for 5G
01 Nov 2019
Information memorandum
• Mobile market not competitive• All spectrum to be
assigned to WOAN
Spectrum journey remains complicated and uncertain

53
Interim Results Presentation 2019
ss 2, 3 & 31(3) of the ECA
Radio Frequency Spectrum Regulations 2015
National IntegratedICT Policy
Policy Directions
Spectrum assignment principles and legislative imperatives
Promotes competition and drives economic growth
Spectrum assignment to Address key principles
Efficient utilization of scarce resources
Promotes investment and innovation
ICASA legislative imperatives andconsiderations for spectrum licensing

54
Interim Results Presentation 2019
• Disregards the current market structure and competition dynamics
• Not clear what future market structure is intended
• 700 and 800 MHz are not commercially and technically available
• 3.5 GHz (5G) -requires 100 MHz of contiguous spectrum - only 116 MHz is available
• Extensive capital outlay required to meet the speed and coverage obligations
• No discernible WOAN construct
• Amount of spectrum assigned not sufficient for WOAN to be effective
Information Memorandum inconsistent with policy directive
Not informed by economics and
competition
Proposed spectrum lots are technically flawed
Unrealistic Spectrum
Obligations
Non Viable WOAN
55
Interim Results Presentation 2019
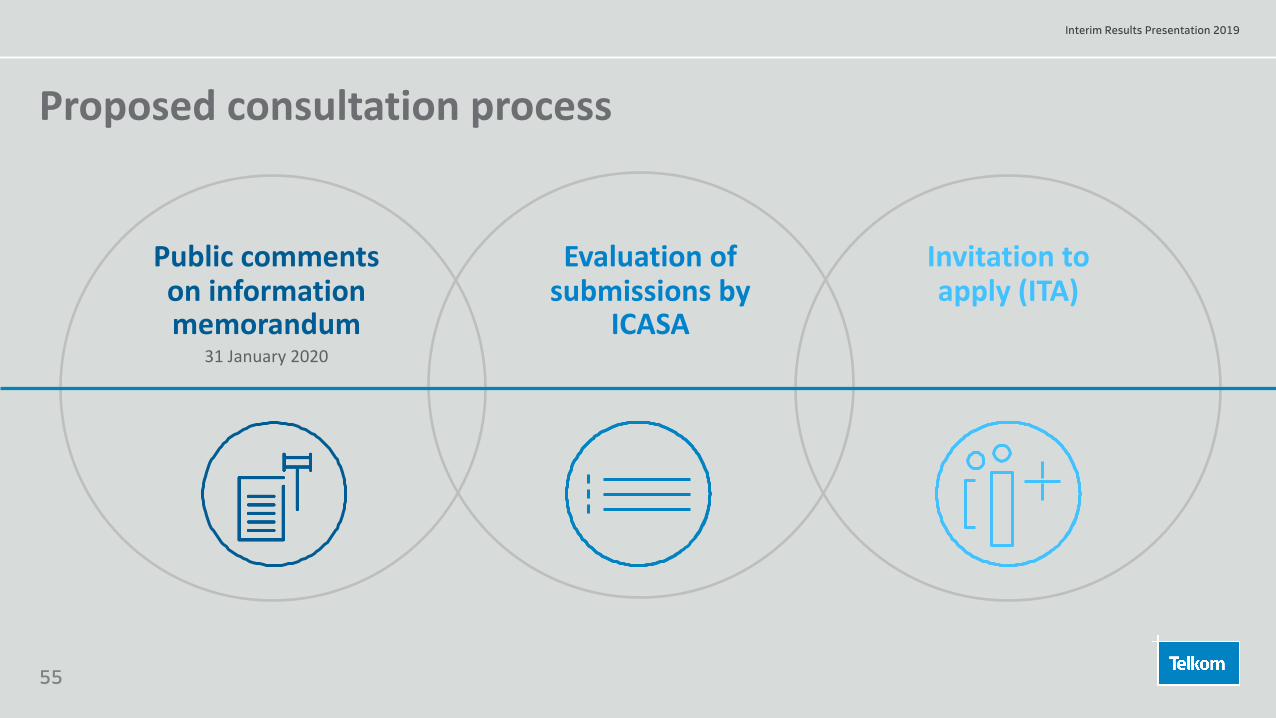
Proposed consultation process
Public comments on information memorandum
31 January 2020
Evaluation of submissions by
ICASA
Invitation to apply (ITA)

56
Interim Results Presentation 2019
Q&A
Telkom SA SOC Limited
Thank you
Interim Results Presentation 2019