Interim reports, participant closeout, and study archives
31
ELSEVIER Interim Reports, Participant Closeout, and Study Archives Ruth McBride, BS, and Stephen W. Singer INTRODUCTION This paper addresses aspects of interim reporting, participant closeout, and study archiving. In one sense, preparation of interim and final reports is the goal of data management. Published reports in the scientific literature represent the final “product” of research studies. All the planning, coordination, data collection, quality assurance and monitoring, and interim reports and other data analysis are designed to assure that the published conclusions of the study investigators are accurate and valid. This paper does not address production and content of such scientific manuscripts. Chalmers et al. [l], Friedman et al. [2], Meinert and Tonascia [3], Pocock [a], and Shapiro and Louis [5] have discussed the content and presentation of results from clinical trials. Similarly, issues related to closeout of participants in a clinical study have been discussed in the context of several completed clinical trials by Krol [61, by Bell et al. [ 71, and by Klimt and Canner [ 81. This paper focuses on (1) guidelines for production of reports generated repetitively during the course of the study, either for monitoring or administrative purposes, that use the database accumulated to interim points in time between study initiation and study completion, (2) the data management issues that should be addressed prior to and during participant closeout, and (3) data management issues regarding the study archives. INTERIM REPORTS To understand data management requirements for reports that are produced repetitively, one must begin with an understanding of the types of interim reports commonly required. The scope of interim reporting is extensive but largely stan- dardized within a given study. Discussion of interim reporting in the context of quality assurance is presented in the paper by Gassman et al. in this issue. Individ- ual projects inevitably have special needs, but the range of reports appropriate in many studies is somewhat like a ready-made garment, needing only a few custom alterations. We distinguish between two classes of interim reports-management aids and monitoring reports -primarily by timing and intent. Management aids include such items as contact reminders, appointment schedules, edit queries, and missing materials lists. These aids are generally proactive, intended help organize a field site or resource center’s day-to-day work flow. They function to Controlled Clinical Trials 16:137S-167s (1995) 0 Elsevier Science Inc. 1995 655 Avenue of the Americas, New York, NY 10010 0197.2456/95/$9.50 SSDI 0197-2456(94)00096-L
-
Upload
ruth-mcbride -
Category
Documents
-
view
212 -
download
0
Transcript of Interim reports, participant closeout, and study archives

ELSEVIER
Interim Reports, Participant Closeout, and
Study Archives
Ruth McBride, BS, and Stephen W. Singer
INTRODUCTION
This paper addresses aspects of interim reporting, participant closeout, and study archiving. In one sense, preparation of interim and final reports is the goal of data management. Published reports in the scientific literature represent the final “product” of research studies. All the planning, coordination, data collection, quality assurance and monitoring, and interim reports and other data analysis are designed to assure that the published conclusions of the study investigators are accurate and valid. This paper does not address production and content of such scientific manuscripts. Chalmers et al. [l], Friedman et al. [2], Meinert and Tonascia [3], Pocock [a], and Shapiro and Louis [5] have discussed the content and presentation of results from clinical trials. Similarly, issues related to closeout of participants in a clinical study have been discussed in the context of several completed clinical trials by Krol [ 61, by Bell et al. [ 71, and by Klimt and Canner [ 81. This paper focuses on (1) guidelines for production of reports generated repetitively during the course of the study, either for monitoring or administrative purposes, that use the database accumulated to interim points in time between study initiation and study completion, (2) the data management issues that should be addressed prior to and during participant closeout, and (3) data management issues regarding the study archives.
INTERIM REPORTS
To understand data management requirements for reports that are produced repetitively, one must begin with an understanding of the types of interim reports commonly required. The scope of interim reporting is extensive but largely stan- dardized within a given study. Discussion of interim reporting in the context of quality assurance is presented in the paper by Gassman et al. in this issue. Individ- ual projects inevitably have special needs, but the range of reports appropriate in many studies is somewhat like a ready-made garment, needing only a few custom alterations. We distinguish between two classes of interim reports-management aids and monitoring reports -primarily by timing and intent. Management aids include such items as contact reminders, appointment schedules, edit queries, and missing materials lists. These aids are generally proactive, intended help organize a field site or resource center’s day-to-day work flow. They function to
Controlled Clinical Trials 16:137S-167s (1995)
0 Elsevier Science Inc. 1995
655 Avenue of the Americas, New York, NY 10010
0197.2456/95/$9.50
SSDI 0197-2456(94)00096-L
13s R. McBride and S.W. Singer
l Confirm the receipt of materials or information sent elsewhere
l Flag questionable information reported by the field sites or resource centers
l Remind personnel of scheduled or overdue events and procedures
l Control inventories of study drugs, devices, equipment, specimens, photo- graphs, or other study materials
These aids are discussed in the paper by Gassman et al. in this issue. In contrast, interim monitoring reports are more often monthly, quarterly,
semiannual, or annual summaries of study progress, of performance of individual study centers, and of the accumulating study data concerning outcomes of interest. They represent a formal examination of the status of a study at an intermediate time point. Performance monitoring reports aim to highlight patterns and compare performance; all interim reports are intended to guide overall study direction.
The most important attribute of both management aids and monitoring reports is periodicity. Produced again and again, their production must be integrated with other aspects of the data management system but must not disrupt daily operations. The details of reporting and production methods depend heavily on their specific purpose and frequency. Thus, classifying reports by function and timing helps to determine their design as well as how much effort it is reasonable to expend in creating them.
Following Meinert and Tonascia [3], we distinguish between two types of in- terim monitoring reports: performance monitoring and treatment effects monitor- ing in clinical trials. A similar classification may apply to other types of studies. A third type of report, progress monitoring reports, may be produced separately or included as part of the other two types of interim reports. Progress monitoring reports may be produced frequently, e.g., monthly reports on participant screening and enrollment, or only at special times in the study, e.g., progress reports to sponsors at decision points regarding future funding. Performance monitoring reports summarize the performance of each of the field sites and resource centers in the study; their audience is primarily the study investigators and other research personnel. In some large studies, a subset of investigators may be charged with intensive review of performance monitoring reports. Treatment effects monitoring reports formally examine the clinical trial data collected to date. They usually are prepared for an external review group, such as a data monitoring committee, who review performance monitoring data as well. Although there is some overlap, these two types of monitoring reports have distinct audiences and purposes which affect both design and production strategy.
Performance Monitoring Reports
The duties of each study center (field site or resource center) determine the intensity and type of monitoring appropriate. Field sites tend to be the focus of a large proportion of these reports because they contribute the bulk of the data in most studies and are the source of primary data collection. Various aspects of their performance are monitored: participant screening and enrollment, follow-up contacts, protocol compliance, data completeness, and data quality [3]. During different phases of a study, different aspects of performance may receive more attention. Tables 1-3 describe some of the topics that typically are covered in

Interim Reporting 139s
Table 1 Monitoring Recruitment by Field Sites
l NumbeP of participants screened, compared to prestated goals l Number of ineligible participants, by reason for exclusion l Number of eligible participants not enrolled, by reason l Accrual patterns, by time and referral source
n Reports may include both raw counts and percentages.
Table 2 Monitoring Follow-up and Protocol ComrAiance
Expected follow-up visits conducted within specified time window, by field site Percent of most recent expected follow-up visits completed, by field site Percent of expected follow-up visits not completed within the specified time window, by reason not completed (e.g., participant refusal, physician refusal, out of window completion), by field site Percent of participants who have discontinued trial therapy, by reason for discontinuance, by field site Percent of follow-up procedures completed within the specified time window Percent of follow-up procedures not completed within the specified time window, by reason not completed, by field site Measure of compliance with treatment protocols, by field site (not by therapy assignment for masked trials) Number of major protocol violations (e.g., participant did not receive assigned study therapy), by field site
Table 3 Monitoring Completeness and Correctness of Data
l Number of data forms expected, compared to number and percentage actually completed within specified time windows
l Number of edit queries per field site, adjusted by the number of participants l Percent of resolved edit queries per field site l Distribution of time required to resolve edit queries, by field site l Number of edit queries, by tvpe of data form
Table 4 Monitoring Resource Centers
l Number of items or samples generated, by time interval l Number of items or samples processed, by time interval l Number of items or samples not analyzable, not identifiable, lost, or destroyed l Results of aualitv control analvses
these monitoring reports. The performance of resource centers, including the coor- dinating center, should also be reported and monitored. Table 4 lists some aspects of performance appropriate for resource centers.
Performance monitoring is directed at achieving specific goals. For example, reports that monitor participant screening and enrollment are aimed at encourag- ing field sites to meet or exceed established goals. Their design should help accom- plish this goal. If instilling a sense of competition between field sites is thought to promote recruitment, then the reports should clearly focus on a field site’s rank, both in comparison to preset goals and to other sites. Performance monitoring in this area may result in revisions of goals or changes in eligibility and exclusion criteria [9].

140s R. McBride and S.W. Singer
Participant recruitment monitoring highlights two considerations common to other aspects of performance monitoring: cumulative number of participants re- cruited and accrual rates over time. It is possible merely to count for the whole study at a single time point those screened, ineligible, failing to enroll, and enrolled.
However, considerable information may be lost by such a summary. A graph of
enrollment by time would display not only a rate for each category but also any shifts in that rate over time. This added information may provide the study leadership with valuable feedback about projected vs. actual participant popula- tions. Further information may be revealed by comparing graphs over time across field sites. Also, it may be useful to compare the performance of each field site
to other field sites using some statistic (e.g., maximum, mean, mode, median,
minimum, interquartile range) derived from the study totals. These comparisons may reveal atypical or differential recruitment patterns to be investigated further. Statistical methods appropriate for comparisons among multiple field sites have been presented by Canner [lo]. Similar considerations apply to other aspects of participant screening and enrollment, such as reasons for ineligibility and reasons
that eligible study candidates fail to enroll. At a minimum, the distributions by reason of ineligibility or failure to enroll should be tabulated. Trends over time and comparisons of field sites may reveal important information regarding selec-
tion biases. The emphasis of performance monitoring reports may convey either a positive
or a negative message. For example, emphasis may be placed on the completeness of data reporting (positive) or on the amount of missing data (negative). Both strategies may be useful in promoting improved performance, but neither will be
effective unless realistic norms have been established. These norms may emerge from direct comparisons among field sites, from ranking field sites against some statistic for the whole study, or from tracking performance for a given resource
center or field site over time. Comparisons with other studies may be helpful as
long as differences in design, characteristics of the target population, resources, support at field sites, and other pertinent factors are taken into account.
The frequency of production of performance monitoring reports is a function
of the purpose and intended audience of the report and the rate at which perfor- mance data accumulate. For example, when accrual of participants is slow, enroll- ment need not be summarized and reported weekly. Reporting schedules for perfor-
mance monitoring must also be coordinated carefully with the operational details of a study. As one example, reports monitoring data completeness and accuracy must account for the time required to prepare data for submission by those respon- sible for that data. Personnel at field sites and resource centers must be notified of data items that are missing or anomalous. They also need time after notification
to research the problems. Two recommendations then follow naturally. First, because the intent is to improve data quality rather than increase frustration, notices of missing materials or anomalous data should be sent at reasonable inter- vals. Second, a report on data completeness and accuracy must specify not only how many items met study standards but also elapsed time since centers were notified of missing or anomalous data items. Such a reporting approach distin- guishes new problems from those that study personnel have had sufficient opportu- nity to resolve.
Monitoring for the completeness of follow-up data collection requires clarity about expectations. For example, the study protocol should specify clearly which

Interim Reporting 141s
participants should be contacted, the procedures required, data to collect, opti-
mum time intervals, and permitted time window for each follow-up contact. Fur- ther, in order to account for delays in transmission and reporting of data, a cutoff date should be selected and announced in advance for each performance monitor- ing report. Only follow-up data collected or reported prior to that cutoff date should be included in the target monitoring report. The report itself should clearly
specify the cutoff date used. As noted earlier, both cumulative information and information by time period are useful. Similarly, data may be presented for individ- ual field sites as well as for the study as a whole.
Treatment Effects Monitoring Reports
In clinical trials, the distribution of treatment effects monitoring reports typi-
cally is restricted because of the potential effect of such reports on investigator bias. The audience for these reports is most often a data monitoring committee, convened specifically for review and discussion of the data at regular intervals. Further, some treatment effects monitoring reports incorporate masking of therapy
assignment [ll]. One type of treatment effects monitoring report is an exception
to this schedule. For regulatory, legal, medical, and ethical reasons, adverse event reports usually are produced more frequently and distributed to a wider group than other reports.
Treatment effects monitoring reports often follow an outline similar to the one
shown in Table 5 [l2]. They begin with introductory material that includes an overview of the study design. This material is important because the majority of
the members of groups reviewing these reports are not involved in the day-to-day operations of the trial and are convened only once or a few times each year [13]. In order to facilitate interpretation of the report, the introductory material often includes a narrative summary of the information presented as well as discussion of any new or critical analyses in the report. It should be noted that some data monitoring committees prefer not to receive such summaries until their meeting
and discussion have been completed. Another section of these reports usually describes the baseline characteristics
of study participants by treatment arm if the study is a clinical trial or has some other type of comparative design. The purpose of these data in a clinical trial is to ascertain that randomization (or some other method of treatment assignment) is providing fairly evenly balanced groups. An unexpectedly large number of
imbalances in a randomized trial may require review of the treatment assignment process to assure that bias is not being introduced by that process. Imbalances on important risk factors must be accounted for in the analysis of outcomes. Baseline characteristics compared typically include basic demographic variables, descriptive variables about the condition under study, and any potential risk factors associated with the outcome of interest. Similar information for partici-
pants screened but ineligible or failing to enroll may help reviewers to assess whether the study participants typify the target population or are a select subgroup. For example, overly restrictive eligibility criteria, inadequate information about the epidemiology of the condition at the time the study protocol was developed, or competing treatment options may contribute to selection bias. Baseline charac- teristics for both the study as a whole and by field site may be of interest, depending on the number of participants enrolled at each field site.

142s R. McBride and S.W. Singer
Table 5 Content of Treatment Monitoring Reports
I. Table of contents II. Introductory materials
A. Overview of report B. Summary of trial design
1. Purpose of the trial/primary hypothesis 2. Diagram of the study design 3. Therapy interventions and level of masking 4. Sample size and power determinations 5. Participant inclusion/exclusion criteria 6. Follow-up schedule and timetable for trial 7. Primary and secondary endpoints
C. Discussion of new, novel, or key analyses III. Baseline characteristics of study population
A. Democraphic characteristics by therapy arm B. Potential risk factors by therapy arm C. Response variables at baseline by therapy arm D. Cumulative results of screening and randomization to determine whether biases
may be introduced in the selection of the study population IV. Execution monitoring
A. Cumulative results of screening and randomization by field center compared to expected levels
B. Completeness of follow-up C. Completeness of data D. Dropout rates and other measures of participant adherence to treatment E. Results of quality control measures of key tests and procedures F. Number of ineligible participants randomized; number of participants refusing
trial intervention after randomization; number of other protocol violations V. Treatment effects
A. Primary and secondary outcomes B. Toxicity monitoring C. Appropriate stratified analyses and covariate adjustments for imbalance in therapy
arms D. Narrative summary of the results
The treatment effects monitoring report also contains performance data. Sum- mary performance monitoring reports should give the reviewers enough informa- tion to judge whether the protocol is being executed adequately at each field site and resource center. Summaries of screening, randomization, completeness of data and follow-up, treatment adherence, and protocol violations should be included because they affect the reliability and interpretation of data on study outcomes of interest. A measure of the number of participants who did not receive or are no longer receiving the assigned treatment should be provided because such infor- mation may affect the power of statistical tests to compare outcomes of different treatment groups. The primary difference between performance monitoring re- ports and the performance data included in treatment effects monitoring reports is that the emphasis in the former set of reports is on performance of individual centers and in the latter set of reports is on summary data for the study as a whole.
The level of detail in treatment effects monitoring reports varies depending on the approach of the external review group. At one extreme, the report may be as simple as a statement that no monitoring boundaries have been crossed. More frequently, extensive statistical analyses and many displays of outcome data may

Interim Reporting 143s
be presented. In an effort to minimize bias in decision making, some data monitor- ing committees (or some members) elect to remain unaware of the results by treatment arm; the treatment arms may be labeled “X” and 7” instead of “Drug” and “Placebo.” Alternatively, the data monitoring committee may elect to receive outcome data only for all treatment groups combined until a predefined number of participants have been enrolled or followed for some specified time interval or until a predefined number of primary outcome events have been observed. In order to preserve masking and to guard against mislabeled data displays, preparers of the masked report must take extra care in preparing and checking it. For exam- ple, knowledge of the expected side effects profile or the effect on blood chemistries may reveal treatment arm. It is almost impossible to mask reviewers to treatment arms unless data displays do not include actual counts or denominators. A key individual who participates in preparation of the report and attends data monitor- ing committee meetings should have an unmasked version of the report in case the need to reveal the treatment arms arises.
When a sequential monitoring plan has been established, the treatment effects monitoring report includes the results of statistical tests incorporated in that plan. Because the audience for these reports has infrequent contact with the study, special care should be taken to make sure that adequate explanation of the monitoring plan and its implementation are provided.
General Considerations for Design of Reports
The objective of any report is concise and accurate transmittal of information. That goal requires a balance between completeness and simplicity to achieve the clearest possible presentation. The different types of reports described above have individual design requirements based on their intended audience, purpose, and timing. However, all share the need to communicate clearly a specific message to a particular audience. Thus, the report designer’s job is to focus audience atten- tion on the central topic(s). Unnecessary, distracting, or confusing information should be eliminated. The focus of monitoring reports of each type changes with the phase of the study. For example, early in the study the emphasis may be on screening and enrollment of participants so that the feasibility of conducting the study and reaching a meaningful conclusion can be assessed. During later phases, the emphasis may shift to completeness of participant follow-up and outcome assessment. The design process for these interim reports tends, therefore, to be both iterative and collaborative.
Good report organization contributes to the clarity of the presentation and assists in leading the audience through the report. Any report of five or more pages should include a table of contents that specifies page numbers. Very long reports may be divided into sections with pages numbered sequentially within each section. This practice aids the report producers by restricting the scope of renumbering during revision. However, report readers may find a single page numbering sequence for the entire report easier to navigate. Clearly labeled section tabs with numbers that correspond to the section numbers that follow them is a mutually satisfactory approach that is used by many coordinating centers.
Report layout may also (mis)lead the reader. Reports composed of several tables or several graphs should maintain visual, typographic, and labeling consistency. For example, the position and format of page numbers should not vary. Variables
144s R. McBride and S.W. Singer
CONSISTENCY OF TUMOR DIAGNOSIS
BY IMAGING VERSUS HISTOPATHOLOGY
06-30-92
Imaging
Histopathology
Not /Unavailable- Consistent consistent */under edit
Total (%)
299 51 ‘2” 31;
2 100
* Histopathology review not yet completed t Image missing or of poor quality
Imaging
Consistency of Tumor Diagnosis by Imaging Versus Histopathology
As of June 30,199Z
/i
Consistent consistent /under edit Total (%)
Consistent E$:::yy * Histopathologyreviewnot yet completed tlmage missing or ofpoor quality
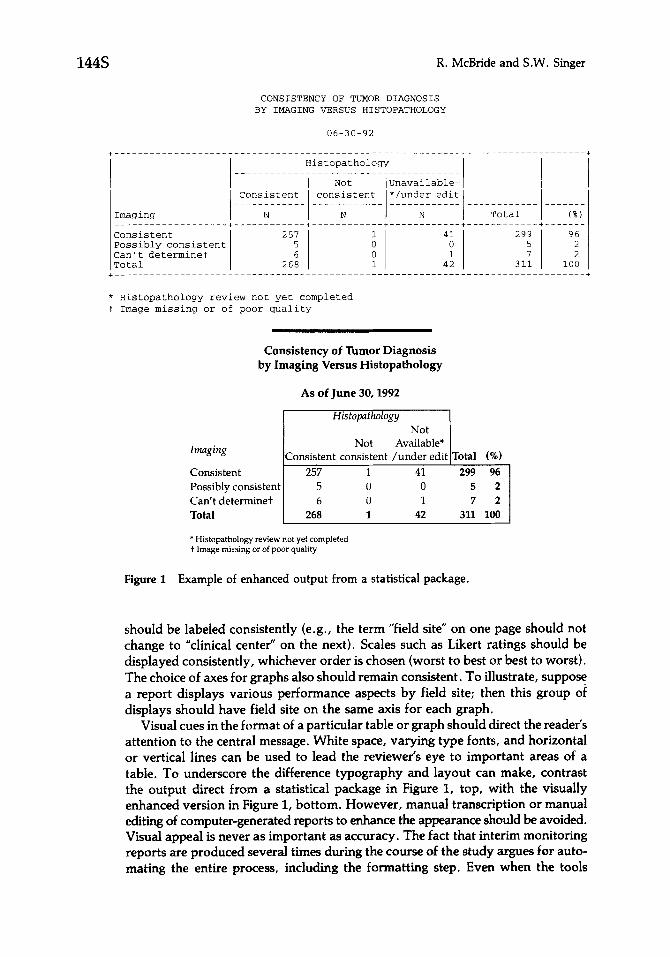
Figure 1 Example of enhanced output from a statistical package.
should be labeled consistently (e.g., the term “field site” on one page should not
change to “clinical center” on the next). Scales such as Likert ratings should be displayed consistently, whichever order is chosen (worst to best or best to worst). The choice of axes for graphs also should remain consistent. To illustrate, suppose a report displays various performance aspects by field site; then this group of displays should have field site on the same axis for each graph.
Visual cues in the format of a particular table or graph should direct the reader’s attention to the central message. White space, varying type fonts, and horizontal or vertical lines can be used to lead the reviewer’s eye to important areas of a table. To underscore the difference typography and layout can make, contrast the output direct from a statistical package in Figure I, top, with the visually enhanced version in Figure 1, bottom. However, manual transcription or manual editing of computer-generated reports to enhance the appearance should be avoided. Visual appeal is never as important as accuracy. The fact that interim monitoring reports are produced several times during the course of the study argues for auto- mating the entire process, including the formatting step. Even when the tools
Interim Reporting
chosen for generating tables have limited formatting power, many word processors and text editors contain macro or script facilities that can be exploited to automate formatting in a second step.
Labeling is a key component of any report. The title should be clear but should not overwhelm the report. Enrick [14] recommends using very short titles with longer subtitles. Each element of the report should be unambiguously labeled. Other papers in this series have discussed schemes for coding data such as adverse experiences or drug types. Reports for a specific study employ the coding schemes adopted. However, the labeling of codes in reports often must be more explicit. Treatment effects monitoring reports, for example, may require explicit labeling of adverse experiences in medical terminology. Abbreviations and jargon used among study investigators may not be understood by external reviewers or by the rest of the scientific community. One requirement in almost every longitudinal study is to translate the contact, “visit,” or examination sequence codes used in the data management system into actual dates or time intervals.
Despite the need for simplicity, a report’s individual elements must be compre- hensive and consistent; the “story” presented in the report must be largely self- contained. The contents of table cells should be defined as counts, percentages, rates, or something else. Computed variables should be documented and explained. Achieved sample sizes and denominators should be provided to clarify the subpop- ulation for which data are displayed, Anomalies in the data, outliers, or apparent inconsistencies between tables all require explanation in the narrative summary or, better, in footnotes to the displays. For example, a patient mistakenly classified in the wrong stratum at time of enrollment and treatment assignment typically is included in that stratum in treatment effects monitoring reports when an “inten- tion-to-treat” analysis strategy is employed, but an explanation of values outside the ranges established for classification in that stratum is a continuing requirement in subsequent reports. All reports should specify the dataset used because typically data continue to accumulate and undergo correction even while the report is being prepared and distributed. Footnotes are useful for providing information on these important aspects of a report and for explaining more fully the subpopulations that are the focus of a particular table or report. They provide information without diverting the reader’s attention from the main message.
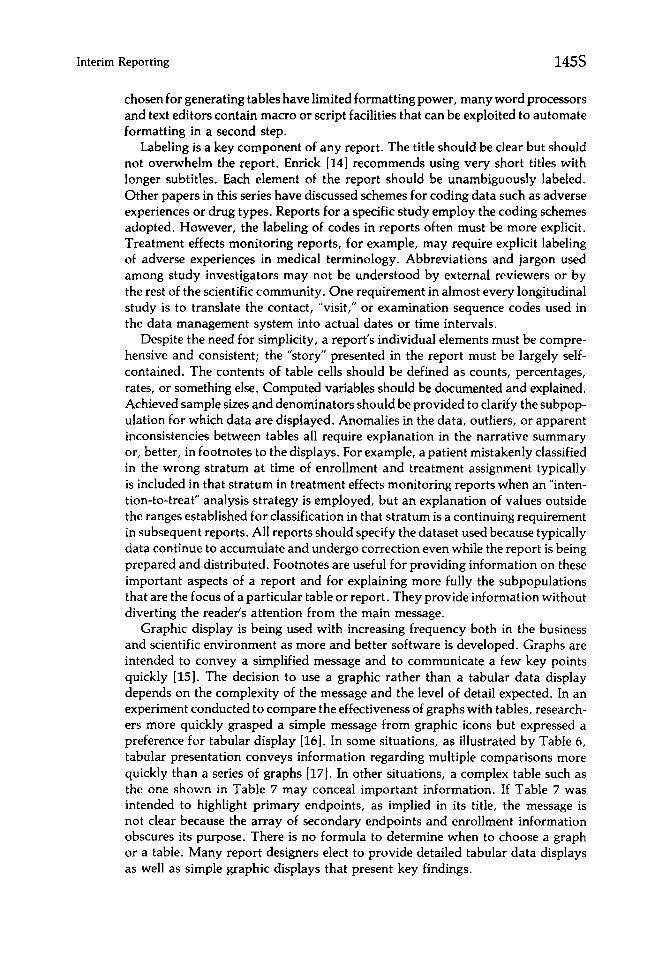
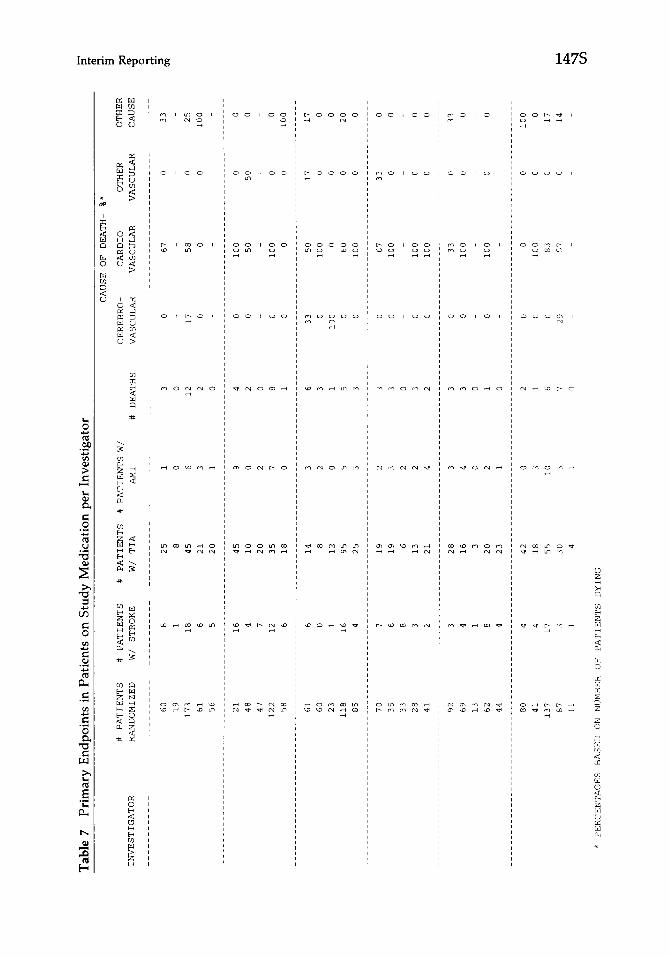
Graphic display is being used with increasing frequency both in the business and scientific environment as more and better software is developed. Graphs are intended to convey a simplified message and to communicate a few key points quickly [15]. The decision to use a graphic rather than a tabular data display depends on the complexity of the message and the level of detail expected. In an experiment conducted to compare the effectiveness of graphs with tables, research- ers more quickly grasped a simple message from graphic icons but expressed a preference for tabular display [16]. In some situations, as illustrated by Table 6, tabular presentation conveys information regarding multiple comparisons more quickly than a series of graphs [WI. In other situations, a complex table such as the one shown in Table 7 may conceal important information. If Table 7 was intended to highlight primary endpoints, as implied in its title, the message is not clear because the array of secondary endpoints and enrollment information obscures its purpose. There is no formula to determine when to choose a graph or a table. Many report designers elect to provide detailed tabular data displays as well as simple graphic displays that present key findings.
146s R. McBride and S.W. Singer
Table 6 Characteristics of the Study Population
Characteristic
Gender Pattern of AF Age (yr)
All Male Female Constant Intermittent I 60 61-75 L 76
Patients (n) 1330 943 387 Male sex ( % ) 71 - - Current smoker (%) 16 19 9 Age(%)
560 23 25 18 61-75 56 59 49 276 21 16 32
Mean (yr) age 67 65 69 Mean blood pressure (mm Hg)
Systolic 137 136 140 Diastolic 80 80 80
Onset of AF (%) <1 yr 28 27 30 21 yr 68 70 65 No estimate 4 3 5
Pattern of AF (%) Intermittent 34 33 36 Constant 66 67 64
Hx hypertension (%) 52 52 53 Cervical bruit (%) 4 3 5 Prior stroke or TIA (%) 7 7 7 Definite CHF (%) 19 19 20 Definite angina (% ) 10 11 8 Definite MI (%) a 9 5 Echocardiography
LAD > 5 cm (%) 26 28 22 Mean LAD (cm) 4.6 4.7 4.5 MVP (%) 6 7 5 Moderate-to-severe LV dys (%) 12 15 6
877 450 30.5 747 278 72 69 77 74 55 17 14 22 15 9
17 34 58 52 24 15 68 63
- - - - - - - - _
51 68 80
138 137 130 138 144 81 79 80 81 80
22 39 34 26 26 74 57 62 71 69 4 4 5 3 6
- - - -
54 47 4 3 a 5 21 14 9 11 8 a
50 31 24 50 69 76 40 57 53 14 7 4 7 10 13 18 28 5 11 12 3 10 7
32 14 18 29 28 4.8 4.3 4.4 4.7 4.7 7 6 7 6 8 13 10 12 11 14
AF, atria1 fibrillation; Hx hypertension, history of hypertension at entry; TIA, transient ischemic attack; CHF, congestive heart failure; MI, myocardial infarction; LAD, left atria1 dimension (cm); MVP, mitral valve prolapse; LV dys, left ventricle dysfunction. Reprinted from Circulation 84527-539, 1991, with permission.
Just as with tables, graphs should reveal information, not obscure it. Tufte
[l9] summarized the principles of graphic excellence in clarity, precision, and efficiency. Tufte defined a useful concept that he labeled “data-ink.” He used this term to refer to the portion of a graph that depicts data or information. In Figure 2, the “data ink” is that used for the bars of the graph. Using this concept, he defines the “data ink ratio” to be the proportion of ink in a graph devoted to data in relation to all the other ink in the graph. In Figure 2, the other “nondata” ink is that used for the grid, axes, and labels. Tufte stated that the goal is to
l Maximize the data ink ratio to the extent possible without losing clarity
l Erase redundant data ink and as much nondata ink as possible.
Comparison of Figure 2(a) with Figure 2(b) reveals that removal of nondata ink used in axes, tick marks, and even parts of the bars did not reduce the amount of information displayed or the clarity of the display.
Other excellent references are available on the design of effective graphic dis- plays [14,171.
Tabl
e i’
Prim
ary
Endp
oint
s in
Pat
ient
s on
Stu
dy
Med
icat
ion
per
Inve
stig
ator
z ._
CAUSF OF DEATH-
%*
2.
CEREBRO-
VASCULAR
CARD10
VASCULAR
OTHER
OTHER
VASCULAR
CAUSE
8
_________~~~~~~___
g
c.
0
33
ii
0
25
0
100
___________--_.--.--
0
0
50
0
0
0
0
100
17
17
0
0
0
0
0
20
0
0
33
0
0
0
0
0
0
0
0
33
0
0
0
0
# PATIENTS
# PATIENTS
# PATIENTS
# PATIENTS
W/
INVESTIGATOR
RANDOMIZED
W/ STROKE
WI TIA
AM1
60
8
25
1
19
1
8
0
173
18
45
6
61
6
21
3
56
5
20
1
21
16
45
9
48
4
10
0
47
7
20
2
122
12
35
I
58
6
18
0
61
6
14
3
60
0
8
2
23
1
12
0
118
16
95
5
85
4
25
3
70
7
19
2
35
6
19
3
33
8
6
2
28
3
13
2
41
2
21
4
92
3
28
3
69
4
16
4
13
1
3
0
62
8
20
2
44
4
23
1
80
4
42
0
41
4
18
3
137
17
55
10
87
3
30
3
11
1
4
1
* PERCENTAGES
BASED
ON NUMBER
OF PATIENTS
DYING
# DEATHS
67
58
0
100
50
100
0
50
100
0
60
100
67
100
100
100
33
100
100
_________
0
100
83
57
___.
0
100
0
0
0
17
0
14

148s R. McBride and S.W. Singer
Figure 2
10%
5%
Example of maximization of “data ink” in a graph. (a) Original bar graph. (b) Data ink maximized. Adapted from Tufte [19] and reprinted with permission from Graphics Press.
Production of Reports
Operationally, designing a new report or deciding on the content and format of the next version of an interim report takes place in several steps. First, someone (often a study statistician) prepares a draft or mockup of the report. The drafter extracts tables and figures from prior reports that continue to be of interest and adds “shells” for new tables and figures. Typically, this process is a manual one; however, it may be automated by maintaining a library of table shells from past reports, adding to it as required, and selecting the particular items to be printed for a particular report mockup. After distributing the preliminary mockup for comment, the study’s statisticians, data processing staff, and representatives of the target audience for the report meet to review the mockup. If external review

Interim Reporting 149s
and approval are required, the mockup is circulated to those reviewers. Once agreement on format and content has been reached, staff are assigned to extract a dataset for the report, to analyze the dataset using existing programs, to program new tables and figures as required, to update existing programs, to maintain docu- mentation of the report creation process, and to monitor progress with these tasks.
Methods for report production are as varied as the types of data management systems implemented. Generally, production of each report requires selecting the dataset from which the report will be produced; checking and verifying that data- set; generating individual data displays and sections of the report; checking the tables and graphs for accuracy and consistency; adding introductory material and the table of contents; and reproducing, binding, and distributing the reports. Issues concerning production are discussed in the following sections.
Selecting the Dataset
In an ongoing study, data are accumulating at the same time that monitoring reports are being produced and distributed. If just minutes are required to create and verify a report, a common practice is to suspend updates to the database during that period. When several hours are required to produce a report, scheduling the report to run overnight may eliminate conflicts between database activity and reporting needs. In some circumsta,nces, only a portion of the database may be required to produce a report. For example, production of reports that deal exclu- sively with enrollment or baseline data would not be affected by updates from follow-up examinations. Typically, performance monitoring reports and treat- ment effects monitoring reports require days or weeks to produce and validate; commonly, they are produced using a “frozen” dataset. That is, at a certain time, a copy of the study database is made and no further updates are applied to that copy. During production this technique permits (but does not ensure) consistency among tables and charts. After production, the copy serves as an archival snapshot of the database. Provided that the hardware, operating system, database manage- ment, and analysis software do not change, it permits one to reproduce the report, if required, during a subsequent data audit. Additional tables or graphs that are consistent with the report may be created from the same dataset when these are requested to supplement information already distributed. The prerequisites for reproducibility of report contents include:
l A copy of the treatment, administrative, and ancillary datasets
l A copy of all reporting programs, table definitions, and scripts used to pro- duce the report
l An audit trail (paper or electronic log) for any -manual “fixes” to the frozen dataset to correct problems unresolved before
the freeze -subsequent changes to the study data management system design
Because hardware evolves rapidly and operating system, database management, and statistical analysis software are frequently revised, reproducing a report for any reason becomes increasingly difficult with time. One needs only to consider the expense today of reproducing a study report whose technology was based on

150s R. McBride and S.W. Singer
punched cards, or even one based on an early personal computer, to appreciate the difficulties that could be encountered.
“Freezing the database” means that some boundary date, called a cutoff date or freeze date, must be chosen to define the data included in a report. Allowing late corrections to the study database may result in cleaner, more complete data. However, enforcing a cutoff date reduces possible bias. It may appear reasonable when problems are discovered after the copy has been made to resolve them by making parallel corrections to both the study database and to the copy. However, care must be taken to assure that such corrections do not introduce bias or delay production of the monitoring report to an unreasonable degree. For example, suppose that review of participant data revealed use of a nonstudy drug by those who experienced a primary outcome event. Then correction of the records for all participant drug use would be needed in order to avoid bias. Therefore, in central- ized data management systems, data received at the coordinating center after the cutoff date typically are not processed until after the copy of the frozen database is created and checked. In studies with distributed systems, the cutoff date deter- mines the last included data transfer from the field sites and resource centers.
Several factors should be considered when selecting a cutoff date:
l Data entry backlog, if any (applicable to both centralized and distributed systems)
l Estimated delays in transmitting data from field sites and resource centers
l Variety of data formats and media from field sites and resource centers
l Estimated effort and time to check and correct data
l Expected effort and time to update the contents of earlier reports
l Estimated effort and time to create new data displays or one-time reports
l Calendar boundaries, i.e., end of week, month, or some other significant point
l Need for timeliness by report’s audience
l Flexibility of the report delivery deadline
Choosing when to freeze the database is a trade-off between the complexity and difficulties in report production under time pressure vs. the value of more current information. Taking the snapshot early results in missing some data, but allows for more checking, a lower peak level of staff effort, more varied data analysis, and an opportunity to explore possible explanations for unexpected findings. Late freezing may result in less careful preparation and less comprehensive reporting. Where timely outcome information is critical, key tables can be updated and checked using a later copy of the database. Depending on the phase of the study, the amount of data already accumulated, the size of the report, the number of individuals assigned to produce the report, and other studywide tasks of similar or higher levels of priority competing for attention, the time interval typically selected ranges from 2 weeks to 2 months to produce a treatment effects monitoring report in multicenter clinical trials. Additional time is required to plan the report and agree on the mockup.

Interim Reporting 151s
Preparations for a Database Freeze
Maintaining negligible data submission and data entry backlogs in both central-
ized and distributed systems facilitates production of the most current report possi-
ble. Negligible backlogs are possible only when:
l Routine data entry is current
. Routine data corrections are up to date
l Transfer of data from field sites and resource centers is timely
l Routine edit query generation is up to date
l Exceptional corrections are few at any given time and can be processed quickly
In many studies routine edit queries continue to be produced as new data are
added to the database, even while preparations are underway to generate an
interim report. The questions raised by these queries about anomalous data typi-
cally are not resolved in time to be included in the report. Thus, some mechanism
is necessary that permits (but does not require) exclusion of questioned data from
the report. Such a mechanism is developed during design of the data management
and reporting system. One mechanism that has been implemented successfully in
some studies is to record the status of each item in the study database along with
that item’s value. Although recording both value and status for each data item
potentially may double the size of the database, it preserves the option to report
or exclude questioned values from the report or from selected analyses. Two other
mechanisms may reduce the amount of usable data available for a report:
l Sequestering large clusters of data items or entire records from the database
whenever any one of the set is questioned
l Replacing the anomalous data items with a status code
Both approaches completely exclude anomalous data from the study database,
thereby foreclosing the option to include them in an interim report. Such exclusion
may be acceptable when only a few records or values are affected at any point
in time. It is unacceptable when a large fraction of the data is in the sequestered
files or otherwise unavailable for analysis.
Creating the Interim Analysis Dataset
Once all checking has been completed, typically several database copies or
extracts are made, with at least one copy kept off-line (e.g., on tape), another
stored off-site, and one on-line to be used during statistical analysis and report
generation. Whenever statistical analysis is performed on a different computer,
a copy may be provided for use on that computer also. At least one copy should
be in a medium and format that permits transfer to another computer in case of
catastrophe during report generation. The analysis dataset may be either a com-
plete image or extracted subsets of the database. An extract is smaller, easier to
manipulate, and cheaper to process. However, some data needed for analysis could be missed during extraction; one missing variable could require the staff
to repeat the whole freeze cycle. It is clearly safer to make a complete copy when
space and processing capacity allow it.
152s R. McBride and S.W. Singer
Most commercial database management systems (DBMSs) offer built-in com- mands for making a database copy. Other tools may require more elaborate scripts. The process of creating an extract is almost certainly more complicated than simple copying. The same script should create both the off-line and on-line working versions of the analysis dataset. Whether trivial or not, the script containing copy or extract commands should be saved as part of the documentation needed for reproducibility. It is also good practice for the script to verify that a true image exists. Running several reporting procedures on both the study database and the analysis dataset and then comparing the results is one way to validate the process. DBMS utilities may be useful to verify that two database copies are identical but may be useless to compare an extracted subset with the corresponding segments of the database. After validation of the analysis dataset, the freeze is declared to be complete and production database transactions resume.
Secondary (derived) variables used frequently and those resulting from complex computations often are added to the analysis dataset rather than being recreated for each module of a complex report. In some data management systems, these values are derived or computed and stored in the database as soon as their constit- uent items are validated. In other systems, such variables are computed or derived only when the frozen copy or extract of the database is created. In either case, storing such values in the analysis dataset
l Promotes consistency in reporting
l Allows more careful checking of important variables
l Increases efficiency in generating and checking many report modules
l Accommodates reporting programs that require data in a format different from the one used for collection
Some secondary variables are created to ease report interpretation by reducing a set of data; for example, a visual acuity “score” summarizes a set of raw measure- ments (e.g., the number of lines and letters read from a standard chart at a stated distance). Endpoint status and exposure time are other examples of variables that may be derived or computed and saved. Calculating a mean or some other statistic from a set of measurements taken at successive follow-ups is also a common way to facilitate statistical analysis and reporting. “Recoding” is yet another way to reduce data complexity for reporting purposes. Tabular presentation frequently requires recoding information from continuous values into a smaller set of catego- ries. Examples include:
l Changing date of birth into a categorical variable that divides the population into adults and children
l Translating a number of adverse events reported within some time period into a single “event/no event” value
l Identifying the maximum or minimum value in a longitudinal series of mea- surements
l Computing fraction of expected dose taken over time
Recoding missing data and anomalous values may be necessary to satisfy statistical analysis software format conventions. Conversion of all missing value codes to a single category may produce a simpler report; retention of all codes may produce a more informative one. For instance, when generating edit queries, it may be

Interim Reporting 153s
important to distinguish between “illegible” and “not recorded.” When reporting the number of items missing, such a distinction may be less important.
Generating the Contents: Reporting Tools and Software
It is neither efficient nor reliable to produce tables and graphs by hand compila- tion of the data, although this approach is sometimes necessary when a very early report is required before all subsystems are operational. Except for elements absolutely guaranteed to be one-time procedures, which experience has shown rarely to be the case, automating report production is essential. There is more than enough manual labor required for careful checking of the product, as dis- cussed later.
The size of the investment to be made in tools for automation, whether pur- chased or developed in-house, depends on the complexity of reports and frequency of production. Many database management systems and statistical software pack- ages now include a report generator with extensive options for customization of the output. Frequently, they permit user control over
l Page formatting and layout
l Complex computations
l Control breaks
l Summary totals and statistics
Some packages also provide a fourth generation language; the best of these lan- guages offer nearly total control over content and layout. Coordinating centers such as those serving the cancer cooperative groups or Veterans Administration cooperative studies invest considerable effort in the development of report genera- tion tools because they are required to produce extensive compilations of reports on numerous protocols [20]. Such customized tools may provide templates for each treatment effects monitoring report or performance monitoring report so that information from each protocol or study is presented consistently.
When selecting or creating report automation tools, a few factors to consider are as follows:
l Does the software permit report creation by a simple declaration of its content, hiding the details of data retrieval and providing standard formats where none are specified (i.e., SQL type commands)?
l Does the structure imposed on the design and content of the reports fit the type of reports to be produced?
l Do defaults or templates available with the software fit the need?
l Does the software provide format and retrieval overrides for finer control over report generation? Does it offer a complete procedural language?
l How complete and flexible is the software’s treatment of missing values?
l If other products must be empIoyed to supplement missing features, how easy is it to move data in and out of the software?
l How easy is it to learn the software language and conventions?
l How easy is the software to use?
l Does the profile of the intended user match anyone on the staff?

154s R. McBride and S.W. Singer
l Are good technical support, updates, and documentation likely to be avail- able for the life of the study? (It should be noted that software developed at the coordinating center also requires continuing support and updates.)
General guidelines for database software selection are given in the paper by McFad- den et al. in this issue.
Checking the Report
Checking reports is an art; there is no formula for the process. To a large extent, the success of checking depends on the “data sense” of those responsible. Consistency is key. The denominators from each table in a report must match or be otherwise consistent throughout. Checks for consistency can be complex because a cell or group of cells from one table may correspond directly or indirectly to the cells of another table. Missing data may result in inconsistency between tables. The analysis software should report missing values consistently and also allow explicit display of those values. It is useful to review the entire report as the audience will, to consider the content and clarity of each table or graph, and to determine whether each is necessary to the purpose and message of the report as a whole. Data displays that are not necessary detract from the overall message of the report and should be eliminated. Tables or graphs that do not fit coherently into the document or do not flow logically from the previous table or graph make the report difficult to understand. New subsections may be appropriate for tables newly added. When reports have been produced previously, more recent reports can be compared with previous versions for logical consistency. Unexpected shifts in summary statistics or trends counter to an expected direction may point up potential problems.
Besides checks of consistency within the report, other checks are recommended. Whenever the new report contains information updated from previous reports, comparisons should be made to the previous report. Changes in unexpected direc- tions should be investigated. For example, if the cumulative number of study participants reported as having some event or outcome has decreased based on comparison of the two reports, one of the reports is incorrect and some explanation is required. Checks against external information such as logs of exceptions pro- cessed, protocol deviations, extraordinary events, and special documentation of key outcomes are useful. Several individuals should participate in review of a report before it is distributed.
Where therapy arms are to remain masked to the audience in treatment effects monitoring reports, a separate careful review of the entire report is required to make sure that this mask is preserved to the extent possible. Information regarding aggregate adverse effects may reveal to a knowledgeable reviewer the actual ther- apy arm but may leave others masked.
Suggestions and reactions from the intended audience are useful to ensure that the message from the report is clear to its intended audience and that all relevant issues have been covered by the report. Careful notes should be taken during meetings of groups assigned monitoring responsibility so that suggestions or modi- fications can be incorporated in future reports. Based on special knowledge or expertise, the audience also may point out logical inconsistencies between data displays or identify errors in assumptions or programs.

Interim Reporting
PARTICIPANT CLOSEOUT
Near the end of a prospective study, attention shifts to plans for orderly comple- tion of data collection, participant closeout, and final study activities. Some of the issues to be addressed concern responsibility for continued medical care of study participants, when indicated, changes in that care prompted by study results, orderly transfer of clinical and study records, and systematic phase-out of opera- tions at each study site. These issues have been discussed in the context of several completed trials by Krol [6], by Bell et al. [7], and by Klimt and Canner [8]. From the standpoint of data management, the closeout and termination phases are especially busy for personnel and investigators located at the coordinating center. Participant closeout provides a final opportunity to make sure that study data are as complete and consistent as possible. It is during this period that final archival copies of the database and other materials are created. Careful advance planning helps to assure a methodical conclusion to study activities. Such planning is more difficult but even more critical when a study ends earlier than anticipated [Y’].
Collection of Additional Information at Participant Closeout Contacts
Whether a study is ended prematurely or continues to its planned conclusion, decisions must be made about the amount of information to collect final participant follow-up examinations or other contacts. In many cases, the last contact may consist of a routine follow-up contact, with a final assessment of status with respect to study outcomes of interest. In studies designed to complete data collection for all participants by a single date, this follow-up contact may not coincide with a regularly scheduled follow-up contact for many participants because those sched- ules vary depending on enrollment date. Additional or one-time information may be collected at this final follow-up contact. Consider, for example, a study in which stroke is a primary outcome. The functional and cognitive status of all participants may be assessed at the end of the study, whether or not they experi- enced a stroke during the period of follow-up in the study. With studies that incorporate masking in their designs, it may be worthwhile to assess the success of masking by asking those masked to treatment assignment to guess the assignment. Because data on masking or some other topic may not have been collected at any other time, special forms may be developed and provisions made in the data management system for incorporating this information. Care should be taken to make sure that the information collected during this phase is (1) consistent with that collected from routine follow-up contacts, (2) really necessary, and (3) usable to answer a well-defined question.
For intervention clinical trials there may be concern about the long-term effects of therapy, such as a rebound effect from stopping a drug or adverse events that may occur only after prolonged usage. Prompted by these or related concerns, study investigators may continue to follow participants in some limited way after the formal closeout contact. An annual or semiannual telephone interview may satisfy the continuing need to monitor participant status. However, after the for- mal end of the study, personnel may be moving on to other projects or to other positions. Therefore, even limited further contact with study participants may be delegated to someone who has had no prior contact with participants or involve- ment in the study. This lack of prior contact or involvement may require the

Table 8 Data Items Used by National Death Index Searching Algorithms
1. Last name 2. First name 3. Middle initial 4. Social security number 5. Date of birth 6. Father’s surname (for females) 7. Gender 8. Age at death (actual or estimated) 9. Race
10. Marital status 11. Last known state of residence 12. State of birth
Data REQUIRED for search: last name and first name and social security number, or last name and first name and date of birth (month and year minimum)
coordinating center investigators to design special follow-up contact forms for such personnel to use. Also, some provision must be made for managing and reporting information from these contacts for long-term monitoring purposes. Such activities may require a separate funding application and may be carried out by a different team of investigators and personnel.
When long-term mortality is an issue, studies conducted in the United States often take advantage of the National Death Index (NDI). In order to use the NDI, certain pieces of information about the participant must be provided (Table 8). The personal identifying information must be checked and updated during the final participant contact within the study follow-up period [21]. The more items of information that can be provided, the more certain the ND1 match. In a large study of participants with cardiovascular disease, Davis et al. [21] found social security number along with first and last name, gender, race, and date of birth to be most efficient for selecting true matches from a set of possible matches. (Instructions, pricing, and an application form to use the ND1 are available from the National Death Index, National Center for Health Statistics, 6525 Belcrest Road, Hyattsville, Maryland 20782.) Because of the time required to process appli- cations to use the NDI, application should be made several months in advance of the anticipated time of the first search request. For searches that involve large numbers of participants, identifiers should be submitted on magnetic media (9- track computer tape or computer diskettes). Information regarding potential matches is returned in several ,computer files that must be processed. The ND1 supplies detailed format instructions for preparing files to be sent for matching and a complete guide to interpreting the files they return from which to assess matches.
In many studies, participant identification information is not sent to the coordi- nating center and is kept only at the field sites to protect confidentiality. By the time that an ND1 search is initiated, field site personnel may no longer be supported by study funding. Thus, in order to follow participants through the NDI, partici- pant identification information must be collected in a protected database at the coordinating center before each field site ceases operation. Collection of personal identifiers centrally imposes special security responsibilities. It is possible :to keep sensitive biomedical data anonymous. First, conforming to standard practice in most coordinating centers, files containing sensitive medical information should

Interim Reporting 157s
la1 \ ‘alidation, Correction, and Closure of the Study Database
have no traceable personal identifiers in them. Personal identifiers when collected
centrally are kept in a separate data file. Linkage between the medical information and personal identifier files typically is possible only through some shared (unique)
study identifier, such as a number and namecode. The file containing personal identifiers may be protected further through passwords known only to personnel
whose responsibilities include preparing ND1 search requests. These data also
may be encrypted (scrambled), with the key for decoding them kept off-line and protected appropriately. Finally, personal data should be kept off-line and physi- cally secure except when actually in use. Ideally, personal information should be collected during the course of the study so that completeness and accuracy can be checked by routine data quality assurance and monitoring procedures. The Coronary Artery Surgery Study investigators [21] found that careful keying, in-
cluding double data entry, of name and social security number reduced the number of mismatches.
In those studies in which the field sites are assured funding throughout the period of a ND1 search, it is possible for personnel at each field site to initiate
search requests and to assess possible matches for the local participant population. This decentralized approach preserves confidentiality. In the Cardiac Arrhythmia
Pilot Study (CAPS), all but one of the participating clinics continued participation in the Cardiac Arrhythmia Suppression Trial. An ND1 search of the CAPS partici- pants was undertaken approximately one year after the end of follow-up for the pilot study. Using a microcomputer database, the coordinating center sent each CAPS clinical investigator a file that contained the CAPS identification number, age, gender, race, date of birth, and date of death when known for study partici-
pants enrolled at that center. The clinic staff then added each participant’s name
and social security number and forwarded the data on diskette to the NDI. The ND1 report was returned directly to the field site investigator. Again, using the microcomputer database, field site personnel reviewed the possible matches and
judged who among their participants had died. They entered the date of death provided by the ND1 for the individual believed to be a study participant and
returned a data file, without name or social security number appended, to the coordinating center.
During the closeout phase of study operations, the coordinating center staff
may focus particular attention on obtaining missing data whenever possible and resolving anomalies that may not be apparent until the complete record for each participant has been assembled. When adequate quality assurance and monitoring
measures have been in place throughout the study, the additional effort at the end is minimal. However, activities that have been scheduled for the end of data collection, such as preparation of participant data profiles, may reveal anomalies
not detected in any other way. Some final (possibly redundant) checks of key data may be worthwhile. For example, the field sites may be provided with a list of all participants reported to have experienced a primary outcome event together with a request to check that list against local records. The University Group Diabetes Program [22,23] conducted a final survey of materials that should have been collected at the coordinating center. For each participant in the database, they generated a one-page summary of materials (data forms, central reading

158s R. McBride and S.W. Singer
reports, laboratory reports, etc.). Coordinating center personnel verified this in- ventory against materials actually on file at the coordinating center and then forwarded these lists to the field sites. These summaries were appropriate for distribution to the participant and to his or her primary medical caregiver. They helped to uncover a small number of anomalies in the data and also were useful in the process of returning the study participants to medical care outside the study. An example of such a listing from a more recently completed study, the Macular Photocoagulation Study, is shown in Figure 3.
In some studies, the field sites intensify efforts during the participant closeout phase to locate participants lost to follow-up [22]. In many cases the trail of such participants has cooled by this time. Efforts to locate them may be time consuming and futile. It is preferable, therefore, to monitor carefully participants deemed lost to follow-up as they are identified. Many studies use a special lost-to-follow-up form or patient search form to standardize and structure attempts by field staff to locate such participants. When a participant has missed two or more consecutive follow-up visits, routine monitoring reports on the completeness of follow-up alert both field site and coordinating center staff. That alert should trigger immediate efforts to locate the participant. Typically, a “form” to guide field site personnel to search for the participant is provided by the coordinating center investigators [24]. Some studies have used private investigators, national credit reporting data- bases, and even “skip tracers” to locate missing participants. Some participants appear at the field site after long absences, e.g., after completing military service outside the country, returning from an extended visit with relatives, or completing a prolonged work assignment elsewhere. Some participants who have avoided communicating with the field site staff for a long time have been persuaded by friends or family members to permit one final contact to assess status or to be informed of study findings. No participant should be assigned unknown status until exhaustive efforts have been made to locate him or her [25]. Thus, the data management staff should anticipate some last minute status updates to the database.
Even in the most carefully conducted study, data are never 100% complete and accurate. During the closeout phase, the emphasis should be on collecting those missing data that are most critical to the major outcomes of the trial, i.e., key baseline measures and outcome events or measures. Typically, the field sites close down before the coordinating center. Thus, efforts to complete data collec- tion and correction should be made early in the closeout period in order to take advantage of field site staff experience. Personnel at the field sites often are busy during this period with issues related to arrangements for long-term participant care. They also may be seeking future employment or transferring attention and effort to new responsibilities. Therefore, data collection and correction efforts should be prioritized. Routine reports on completeness and consistency of data may require revision to direct the field staff’s attention toward the most important items. Similarly, reports to the study group and sponsor should be adjusted to concentrate on the completeness of critical data.
Issues Related to Early Termination of a Clinical Trial
Special challenges must be met whenever a clinical trial is stopped early, whether due to unexpected benefit or harm or to the extremely low probability of showing any difference between therapies 17,263. In such situations, there may be quite a

scnt
nma
se
fe
n n
n 9
” n
” n
Y
”
Y
”
Y
” Y
”
Y
”
cent
er
cove
red
se
fe
” n
” 9
” ”
” n
Y
”
Y
”
Y
” n
”
Y
”
‘WiO
” S
t.atY
s
se
f.2
NW
n
WM
n
Nvw
”
ml4
”
wm
”
m
”
ml4
”
NIS
”
NIS
”
N,S
9
N/S
E
9
NIS
9 Readina Cards
se -
fe -_-..
1 Visual Acuitv
se -
fe -.-..
Figu
re
3 Fi
nal
data
su
mm
ary
for
a st
udy
part
icip
ant
in c
onju
nctio
n w
ith
retu
rn
to
com
mun
ity
care
.

160s R. McBride and S.W. Singer
bit of urgency to disseminate the primary trial results. This urgency puts pressure on the data management staff to complete data collection and editing. There may be ethical reasons for publishing the study findings immediately, with little or no time for orderly clean-up of the database.
Furthermore, once study results become known, collection and correction of some data items may be biased by the knowledge of the results [ 71. Thus, in these situations, one must be careful to screen data changes made after dissemination of study results to make sure that such bias is not introduced.
Ideally, data on the primary outcome event are current before a decision is made to stop a clinical trial. The data monitoring committee for a clinical trial relies on the coordinating center investigators to assure that the data are complete and timely when a decision is made to discontinue further enrollment of partici- pants. Practically, there are always some lags in reporting events due to follow-up schedules and delays in data submission. The continuing possibility of an early decision in a clinical trial should be invoked to motivate field site, resource center, and coordinating center staff to keep data reporting, database validation, and correction up to date.
Whenever materials submitted by the field sites must undergo review or adjudi- cation to verify outcome events, the inherent delay may make it impossible to classify all events before the decision to disseminate results. For this reason, the coordinating center must monitor and report on a regular basis the backlog and average delay for event adjudication by such committees or resource centers. The coordinating center investigators may find it necessary to take a major hand in scheduling meetings of groups such as mortality coding committees prior to the cutoff dates for treatment effects monitoring reports so that the latest coded infor- mation can be provided in each report. The Cardiovascular Health Study [27] currently provides study field sites with a microcomputer-based subsystem to track collection of event verification materials. For each outcome event, field site personnel may review a screen that summarizes the documents required, those already submitted, and those still to be obtained and forwarded. Every week, the coordinating center personnel update the field site database automatically from information maintained centrally. Coordinating center staff also monitor progress with submitting materials.
Dissemination of Study Findings
Completing manuscripts to disseminate study results may be a primary task during the closeout phase of a study. Other authors [20,21] have suggested sched- ules for publishing study results. Regardless of whether primary findings are pub- lished earlier or at the end of a study, those data that formed the basis for the report, analysis programs, intermediate files, reporting programs, and final output from data analysis programs associated with these important reports should be archived and documented thoroughly (see next section). The process for creating publications should be at least as methodical and thorough as the process of producing interim reports that was described earlier.
At the end of some masked clinical trials it may be appropriate to reveal the assigned therapy to each participant. Unmasking requires careful planning to make sure that all expected follow-up information is complete prior to revealing the assignment. Clinical centers in the Cardiac Arrhythmia Suppression Trial (CAST)

Interim Reporting 161s
1281 were provided with sealed envelopes containing the therapy assignment for each participant. After completion of the final telephone follow-up contact, this envelope was opened by a field site staff member who then discussed the assignment with the participant.
Greenberg [29] suggested distribution of datasets to participating investigators at the end of a study to stimulate interest among physician investigators in exploring the data for hypothesis-generating ideas. Distribution of datasets poses problems which are discussed in the next section. Whether complete or partial datasets should be distributed is a matter of debate. Certainly, control by the study leadership over the use and interpretation of such data effectively is abandoned once the data are distributed. Furthermore, the coordinating center staff can no longer guarantee integrity and confidentiality of the contents of datasets after distribution.
STUDY ARCHIVES
Helms and Hosking [3O] distinguished between archives associated with interim reports or manuscripts intended for possible audit and project level archives in- tended to permit access. Archives of the former type are maintained mainly to ensure that the authors can reproduce the contents of a particular report or manu- scripts. A project level archive is normally intended as a resource which documents objectives and methods in order that others may readily access and use study data. The earlier section of this paper entitled “Interim Reports” referred to the requirements for archives associated with interim reports. Hosking et al. [31] also discussed database closure, which they defined as periodically assuring complete- ness of production data management, evaluating its integrity, and documenting the closed dataset. In this section we are concerned with project level archives, i.e., those created for “public” use. Some of the issues were addressed in a workshop at the 1991 annual meeting of the Society for Clinical Trials from which a report was published [ 321.
Archival facilities are provided for federally funded projects by the National Technical Information Service (NTIS) of the U.S. Department of Commerce. NTIS accepts printed, microfilm, and electronic media and distributes copies as required by the Freedom of Information Act. Databases may be submitted on magnetic computer tape, IBM tape cartridge, or computer diskette. NTIS staff fill requests from copies on file or by making additional copies. Information on NTIS services is available from its Office of Program Management and Acquisi- tions, Room 301F, 5285 Port Royal Road, Springfield, Virginia 22161.
Protecting the identity of study participants is a key consideration whenever data are to be made available under the Freedom of Information Act (whether indirectly through NTIS or directly as a result of a request to the sponsoring government agency for study materials) or as a result of placing data with NTIS or a similar facility. Clearly, identifying information such as participant name, social security number, and hospital identification number should never be in- cluded in a multipurpose database available to all. However, the problem is subtler than it may appear at first glance. The investigators’ identities almost always are revealed when study results are published and the number of participants recruited at each field site also may be reported. Therefore, clinically memorable data on individuals identified by field site might easily unmask the identity of participants. One approach would be to recode data associated with each participant so that

162s R. McBride and S.W. Singer
Table 9 Deliverables at Conclusion of Study
a. Protocol b. Manual of operations c. Sample data forms (all versions and revisions) d. Data tape with documentation e. Microfilm records of baseline, event, and key follow-up forms (varies by study) f. Documentation for analyses in primary results papers g. All key interim reports and documentation
they cannot be associated with a particular field site. This approach has statistical implications [ 331 in clinical trials because random allocations frequently are strati- fied by field site. Including the date of rare outcome events in the database presents a similar danger of revealing participant identity indirectly. Converting such dates into the number of days, weeks, or months after enrollment makes them less revealing, provided the date of enrollment is not present in the database.
The coordinating center typically is responsible for developing an archiving plan. This plan specifies how often archives are created, as well as how long and where each copy is kept. As discussed in the earlier sections on interim report generation and closeout, copies of the database should be made at critical junctures. These copies should be saved for at least the lifetime of the study. Longer retention may be warranted. However, in many institutions, retention of records beyond the end of funding cannot be supported.
When data collection and primary publications have been completed, the coor- dinating center typically is left with a mountain of study data and materials. Careful consideration must be given by the coordinating center investigators, other study investigators, and the study sponsor regarding materials and data to be retained and archived and the length of time that archival materials should be maintained. Whenever documents such as ECG tracings, Holter monitor recordings, photographs, X-ray films, or laboratory specimens will be stored centrally, the master study database should contain information to identify the materials avail- able for each participant and the physical location of each item. At a workshop on closeout and posttreatment follow-up sponsored by the National Institutes of Health (NIH) [34], the items listed in Table 9 were recommended as “deliverables.” However, study archiving should begin before other study activities have been completed because it is inevitable that some items will not be found centrally. The assistance of field site staff or staff from other resource centers almost always will be needed to assemble the archives.
In most studies, field sites retain the primary participant source documents, i.e., the medical record. It is generally preferable to leave everything that could identify participants at the field sites. Collecting such data in any central archive raises issues of security and confidentiality. Information that compromises confi- dentiality directly, such as participant name, hospital number, driver’s license number, or social security number, is usually obvious. But clinically memorable conditions or the date of clinical events may be combined with other public knowl- edge, such as the identity of the field site, to violate confidentiality indirectly. A decision to store personal identifiers at the coordinating center may depend on the likelihood that they will be required for an audit of the data at some future time. The possible need to alert participants to long-term undesirable effects arising

Interim Reporting 163s
Table 10 Typical Database and System Archiving Schedule
Week On-site Set Off-site Set
1 BackupA 2 Backups 3 Backupc 4 Backupn 5 Backup,+ 6 Backups 7 Backupc 8 Backups 9 BackupA 10 Backups 11 Backupc 12 Backupo
13 BackupA
Month1
Month2
QuarterI, Quarterz, Quarters, Quarter4
from one of the study therapies may also lead the investigators or sponsor to a decision to collect and store such records centrally.
Archives Established and Maintained During Study Execution
Archiving should be a continuing study activity. A typical schedule for creating and archiving backup copies of the database and system is provided in Table 10. As soon as therapy assignment lists are generated, copies of these lists should be placed in some secure location away from the coordinating center. Similarly, whenever reports are produced that provide data for key decisions (e.g., treatment effects monitoring reports or funding renewal requests to the sponsor), copies of all the data and programs needed to reproduce that report should be placed in some secure location external to the coordinating center. Whenever major revisions are made to data forms or to the database structure, a copy of the database prior to these changes should be made and kept. Data may be lost or corrupted during revisions to database definitions or modifications. Despite careful checking, prob- lems may go undetected for long periods. The archives created during interim report generation and before major changes serve as important “checkpoint insur- ance.” The raw data (as received from the field sites) also should be archived routinely as additional insurance. Studies with centralized, paper-based data man- agement systems typically create microfilm archives once edit queries have been resolved. Studies with distributed data management must save the transmitted data files in much the same fashion as they archive programs and data for interim reports. Where the database management system allows, journal files of all data- base updates should be archived. These provisions make it possible to audit the data, if required, and also to track certain data discrepancies.
Archives Established at Study Completion
The major difference between archiving activities prior to the conclusion of a study and those associated with study termination is that the former are undertaken primarily for the benefit of the study investigators and that the latter are for the

164s R. McBride and S.W. Singer
benefit of the sponsor and interested individuals who have not taken part in the study. Archives created by the study investigators may provide information to buttress controversial conclusions. They also may prove valuable when revisited in the light of later findings.
For the final study archives, the coordinating center investigators, in consulta- tion with the study leadership, must select a date beyond which no further data or corrections will be accepted into the database. This archival cutoff date is analogous to the cutoff date for interim reports. By setting and adhering to such a date, a great deal of confusion can be avoided about “final” data archives. Timing for the creation of the final archive depends on the length of time the coordinating center expects to be funded and, more importantly, on the sponsor’s requirements for delivery of the data. Although no current agencywide guidelines exist for NIH-funded studies, most final datasets should be delivered within 3 years after completion of the study [3.5].
When plans are made to archive study materials, some thought should be given to which materials are to be stored. Helms and Hosking [30] proposed that perma- nent archives be organized into three components: project documentation, dataset documentation, and the datasets themselves. Careful though should also be given to how long these materials are to be stored. The U.S. Food and Drug Administra- tion (FDA) requires that materials be kept 2 years following the date of marketing approval for drug studies, if the drug is approved for marketing, or 2 years after the investigation (if no application for new drug approval is filed or if the application is not approved for the indication) [36]. Institutional review boards typically require retention of all research records for 2-5 years after completion of the study [37]. Pharmaceutical companies, on the other hand, retain study case report forms in perpetuity, either in original form or on microfilm. There is always the possibility of a comprehensive adverse event review or the appearance of long-term adverse effects. However, the participants in a 1981 NIH workshop recommended retention of data from clinical studies for 20 years [34]. The Veterans Affairs Cooperative Studies Program (VACSP) recommends that VACSP coordinating centers retain physical possession of all study data in readily accessible files for 5 years after its completion, at which time the data can be placed into storage and reevaluated at 5 year intervals regarding its continued retention [38]. Long-term programs, such as the cooperative oncology groups, retain data on all protocols indefinitely. However, decisions to retain data indefinitely may lead to loss or corruption if responsibility for periodic review and testing is not assigned and monitored.
Almost certainly, the database will be archived on some magnetic medium. Current technologies include 9-track computer tape at various recording densities, quarter-inch cartridge tape, 4-mm DAT cartridges, S-mm tape cartridges, various magnetooptical disks, and diskettes in several sizes and densities. Quite aside from the proliferation of “standards,” incompatibility among vendors, and short technological life of devices are to read each format, all of these media have shelf life problems. Even computer tapes hung on reels for long periods of time deform, stretching or sagging to the shape of the reel. Temperature and humidity variations can weaken the tape. Further, nearby magnets, magnetized tools or paper clips, and electrical equipment can destroy the information on any magnetic medium. Microcomputer diskettes are particularly vulnerable to physical damage and par- tial erasures. In any case, magnetic media should be stored in a location where
Interim Reporting 165s
variations in temperature and humidity are kept to a minimum and where they are protected from accidental exposure to magnetic fields.
The longer the retention anticipated, the more conservative should be the choice of archival medium and data format. Those who doubt the wisdom of a conserva- tive choice are urged to consider where they might now find an S-in. diskette drive or a magnetic tape drive able to read very-low-density tapes. The data format of final archives should be as independent as possible of the computer, operating system, and applications software as possible. For example, standard labeled ANSI tapes written using the ASCII character set are preferable to an operating system dump format. These, in turn, are preferable to tapes created by specific database backup utilities. Such system-specific or database-specific backups assume that the equipment, operating system, and database will be available when retrieval is desired, possibly far into the future.
For security, more than one copy of important archival elements should be retained. At least one copy should be kept in a secure location separate from the coordinating center to minimize loss in case of fire or vandalism. In a university setting, central computer facilities or computer facilities in other departments may be willing to provide such service. Commercial vault facilities are also available. For smaller storage units (cartridge tapes, microcomputer diskettes, and optical disks), bank vaults may also be an option. As noted earlier, retention of records beyond the end of funding often cannot be guaranteed by many institutions. Therefore, detailed arrangements between the study sponsor and the archiving institution should be spelled out in a written agreement before extended retention begins.
Documentation of the items in each archive is necessary for the contents to be useful, regardless of whether the user participated in the original study. Depending on the expected user, documentation may range from very general to very technical [30,32]. However, considerably more than just the contents of the magnetically stored items needs to be documented. Careful documentation of how to access electronic records should be retained on paper, microfilm, or microfiche, together with other archival materials. Documentation should be prepared under the as- sumption that no one related to the study will be available when the data are accessed. At a minimum, the final data archive should include paper documenta- tion that describes in detail the format of the data tape or diskette, provides summary statistics for each variable on the tape, and includes notes on the interpre- tation of variables. A paper copy of all data forms used to collect the information should be included. The correspondence between database variable names and items on the forms should be explicit and detailed. Computed variables, particu- larly those used in key analyses, should be included in the archive documentation. To test the adequacy of documentation and accuracy of the archive, it may be advisable to arrange for a statistician at another location who has not been associ- ated with data analysis or report generation for the study to reproduce key study retilts using only the archived materials.
CONCLUSION
Although at first glance the topics discussed in this paper appear to be unrelated, they are in fact closely related. Interim reports document the progress of the study investigators toward the ultimate goal, the performance of each study center during

166s R. McBride and S.W. Singer
REFERENCES
1. Chalmers TC, Smith H, Blackbum B, Silverman B, Schroeder B, Reitman D, Ambroz A: A method for assessing the quality of a randomized control trial. Controlled Clin Trials 2:31-49, 1981
2. Friedman LM, Furburg CD, DeMets DL: Fundamentals of Clinical Trials. Littleton, MA, PSG, 1985
3. Meinert CL, Tonascia S: Clinial Trials: Design, Conduct, and Analysis. New York, Oxford University Press, 1986
4. Pocock SJ: Clinical Trials: A Practical Approach. New York, John Wiley and Sons, 1983
5. Shapiro SH, Louis TA: Clinical Trials: Issues and Approaches. New York, Marcel Dekker, 1983
6.
7.
8.
Krol WF: Closing down the study. Controlled Clin TriaIs 4:505-512, 1983
Bell RL, Curb JD, Friedman LM, Payne GH: Termination of clinical trials: The Beta- Blocker Heart Attack Trial and the Hypertension Detection and Follow-up Program experience. Controlled Clin Trials 6:102-111, 1985
Klimt CR, Canner PL: Terminating a long-term clinical trial. Clin Pharmacol Ther 25(5):641-646, 1979
9.
10.
11.
12.
Collins JF, Bingham SF, Weiss BG, WilIiford WO, Kuhn RM: Some adaptive strategies for inadequate sample acquisition in Veterans Administration cooperative clinical tri- als. Controlled Clin Trials 1:227-248, 1980
Canner PL: Monitoring of the data for evidence of adverse or beneficial treatment effects. Controlled Clin Trials 4:467-483, 1983
Knatterud GL: Lessons learned in monitoring for treatment effects in the Diabetic Retinopathy Study. [abstract] Am J Epidemiol 106:247, 1977
Meinert CL, Hawkins BS: Design and Management of Clinical Trials [Course materials from July 9-10, 19901. The Johns Hopkins Center for Clinical Trials, Baltimore, MD, 1990, p 2-2
13. Hawkins BS: Data monitoring committees for multicenter clinical trials sponsored by the National Institutes of Health. I. Roles and membership of data monitoring commit- tees for trials sponsored by the National Eye Institute. Controlled Clin Trials 12:424- 437, 1991
14.
15.
16.
Enrick NL: Effective Graphic Communication. Princeton, NJ, Auerbach, 1972, p 119
Cleveland WS: The Elements of Graphing Data. Monterey, CA, Wadsworth, 1985
Elting LS, Bodey GP: Is a picture worth a thousand medical words? A randomized trial of reporting formats for medical research data. Meth Inform Med 30:145-150, 1991
17.
18.
Tufte ER: Envisioning Information. Chesire, CT, Graphics Press, 1989
Chambers JM, Cleveland WS, Kleiner B, Tukey PA: Graphical Methods for Data Analysis. Monterey, CA, Wadsworth, 1983
specified intervals, and the state of knowledge about study outcomes at each decision point in the study. The participant closeout phase is an important time during which documentation of the study history of each participant is completed and the participant is debriefed. Although study archives may be established early in the course of the study, the emphasis changes near the end of the study and there is necessarily increased activity in this area as the end of funding to support study activities approaches. These archives, together with publications from the study, provide the final record of the manner in which the study was designed and executed and the data on which study recommendations are based.

Interim Reporting 167s
19. Tufte ER: The Visual Display of Quantitative Information. Chesire, CT, Graphics Press, 1983
20. Goodman P, Crowley J, Benson C: Creation of a semiannual report for a multicenter cooperative clinical trials group (SWOG). Stat Med 11:1367, 1992
21. Davis KB, Fisher L, Gillespie MJ, Pettinger M: A test of the National Death Index using the Coronary Artery Surgery Study, CASS. Controlled Clin Trials 6:179-191, 1985
22. Hawkins BS, Canner PL: Impact of closeout on operations at two coordinating centers. In: Proceedings of the 5th Annual Symposium on Coordinating Clinical Trials, Arling- ton, VA, May 25-26, 1978. NTIS accession no. PB 289 461/6, National Technical Information Service, Springfield, VA, 1978
23. University Group Diabetes Program Research Group: Paper listing of baseline and follow-up data on UGDP patients (one volume per treatment group). NTIS accession no. PB 83-136-325, National Technical Information Service, Springfield, VA, 1983
24. Collaborative Ocular Melanoma Study Group: COMS Forms Book. National Techni- cal Information Service, Springfield, VA. NTIS accession no. PB91-217315, 1991
25. Nordberg, PM: Leave no stone unturned. Am J Epidemiol 136:1160-1166, 1992
26. Macular Photocoagulation Study Group: Changing the protocol: a case report from the Macular Photocoagulation Study. Controlled Clin Trials 5:203-216, 1984
27. Fried LP, Borhani NO, Enright P, et al: The Cardiovascular Health Study: design and rationale. Ann Intern Med 1~263-279, 1991
28. Cardiac Arrhythmia Suppression Trial II Investigators: Effect of the antiarrhymic agent moricizine on survival after myocardial infarction. N Engl J Med 327(4):227-233, 1992
29. Greenberg H: Access to data: a contemporary direction for clinical trials. Controlled Clin Trials 13:93-96, 1992
30. Helms RW, Hosking JD: A proposal for the content of a project archive. In: Proceedings of the 7th Annual SAS Users Group International Conference, Cary, NC, SAS Institute, 1982, pp 386-393
31. Hosking JD, Rochon J, Scott P: Data base closure: The transition from data processing to data archiving. In: Proceedings of the 1981 Meeting of the American Statistical Association, Washington DC (Stat Comp Sect), Washington, DC, American Statistical Association, 1981, pp 246-251
32. Hawkins BS, Gannon C, Hosking JD, James KE, Markowitz JA, Mowery RL: Report from a workshop: archives for data and documents from completed clinical trials. Controlled CIin TriaIs 9:19-22, 1988
33. Green SB, Byar DP: The effect of stratified randomization on size and power of statisti- cal tests in clinical trials. J Chron Dis 31:445-454, 1978
34. Schron E: National Institutes of Health Workshop on Closeout and Post-treatment Follow-up, April 29-30,1981, Summary of Discussion. Personal communication from Eleanor Schron, National Heart, Lung, and Blood Institute, to Ruth McBride
35. Frommer PL: (Deputy Director, National Heart, Lung, and Blood Institute) to Ruth McBride, personal communication, August 10, 1993
36. Nightingale S: Required recordkeeping in clinical investigations. Rockville, MD, U.S. Department of Health and Human Services, Food and Drug Administration, May 1989
37. Hendrix TR (chairman, The Johns Hopkins Joint Committee on Clinical Investigations) to Barbara S. Hawkins, personal communication, September 11, 1989
38. Guidelines for the Planning and Conduct of Cooperative Studies in the Department of Veterans Affairs. Washington, DC, Department of Veterans Affairs Central Office, January 1990, pp 29-30