Interim Report January – June 2016 · Interim Report January – June 2016 July 15, 2016. JM...
31
Interim Report January – June 2016 July 15, 2016
Transcript of Interim Report January – June 2016 · Interim Report January – June 2016 July 15, 2016. JM...
Interim Report January – June 2016July 15, 2016
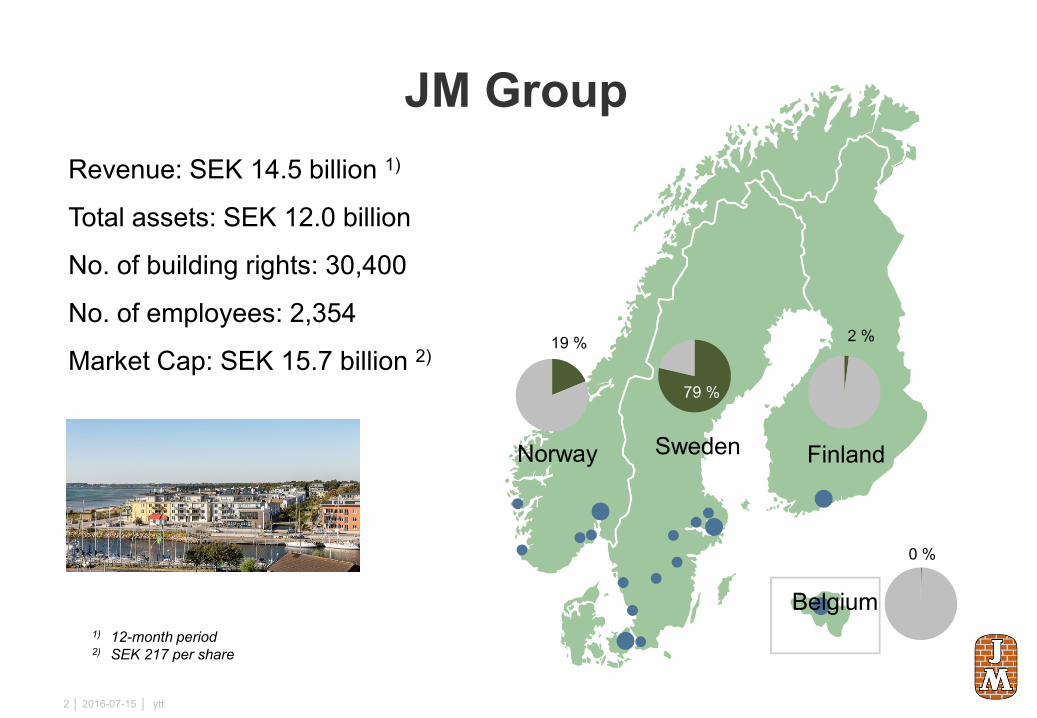
JM Group
2016-07-15 │ ytf2 │
Revenue: SEK 14.5 billion 1)
Total assets: SEK 12.0 billion
No. of building rights: 30,400
No. of employees: 2,354
Market Cap: SEK 15.7 billion 2)
Norway Sweden
Belgium
Finland
1) 12-month period2) SEK 217 per share
19 % 2 %
0 %
79 %

0
2
4
6
8
10
12
14
16
18
20
0
200
400
600
800
1 000
1 200
1 400
1 600
1 800
2 000
2011 2012 2013 2014 2015 Q2 2016
Operating profit Operating margin
• Revenue increased toSEK 7,727m (7,233)
• Operating profit increased toSEK 893m (771)
• Operating margin increased to 11.6 percent (10.7)
• Gains from property sales SEK -23m (34)
Group Summary January – June 2016
2016-07-15 │ ytf3 │
According to segment reporting%SEK m
1) 12-month period
1)

Group Summary January – June 2016
According to IFRIC 15
• Revenue increased to SEK 7,336m (6,785)
• Operating profit increased toSEK 824m (722)
• Profit before tax increased toSEK 801m (691)
• Earnings per share increased toSEK 8.40 (7.00)
• Return on equity was 27.5 percent (28.8)
2016-07-15 │ ytf4 │

• Number of residential units sold 1,958 (1,940)
• Number of housing starts 1,772 (1,777)
• Cash flow from operations was SEK 1,478m (386)
• Building rights portfolio was 30,400 (27,900)
Group Summary January – June 2016
2016-07-15 │ ytf5 │
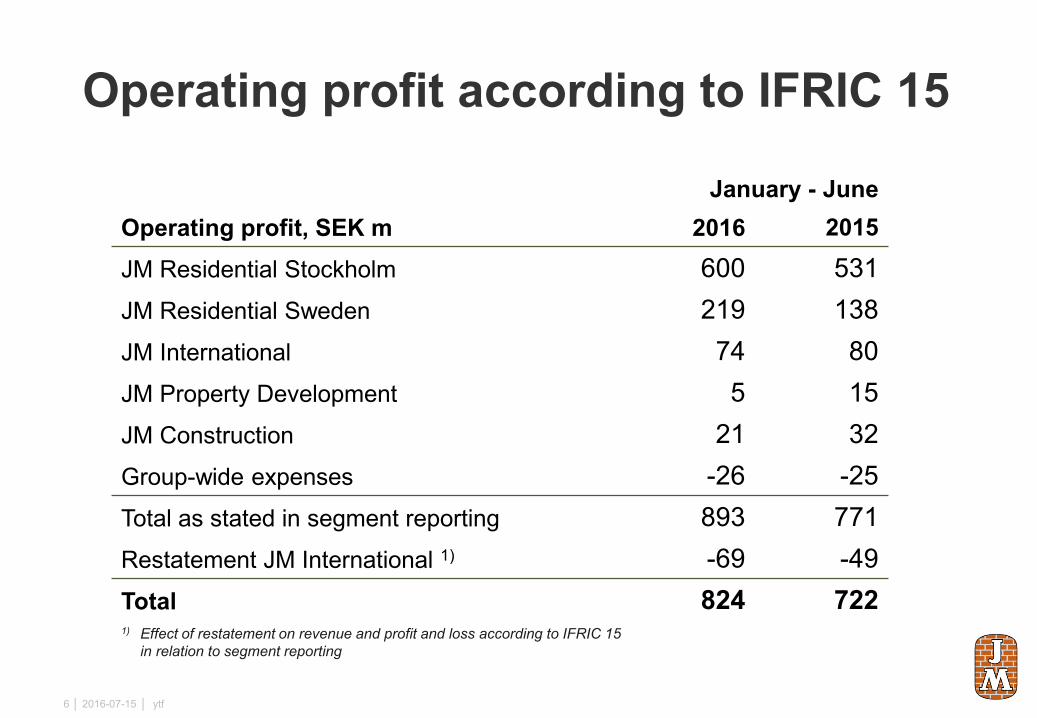
Operating profit according to IFRIC 15
2016-07-15 │ ytf6 │
January - JuneOperating profit, SEK m 2016 2015JM Residential Stockholm 600 531JM Residential Sweden 219 138JM International 74 80JM Property Development 5 15JM Construction 21 32Group-wide expenses -26 -25Total as stated in segment reporting 893 771Restatement JM International 1) -69 -49Total 824 7221) Effect of restatement on revenue and profit and loss according to IFRIC 15
in relation to segment reporting
Stable demand and continued strong sales• Demand in Sweden and Norway continued
to be stable during the first six months• Strong sales in Sweden and Norway • High level of housing starts - temporarily
fewer starts in Stockholm during the second quarter according to plan
• Revenue for the first six months confirms stable development in our operations in Stockholm
• Housing operations in the rest of Sweden is demonstrating improvement in terms of revenue, profit and margin
• The percentage of sold/reserved residential units in relation to ongoing production 83 % (87) – high level
2016-07-15 │ ytf7 │
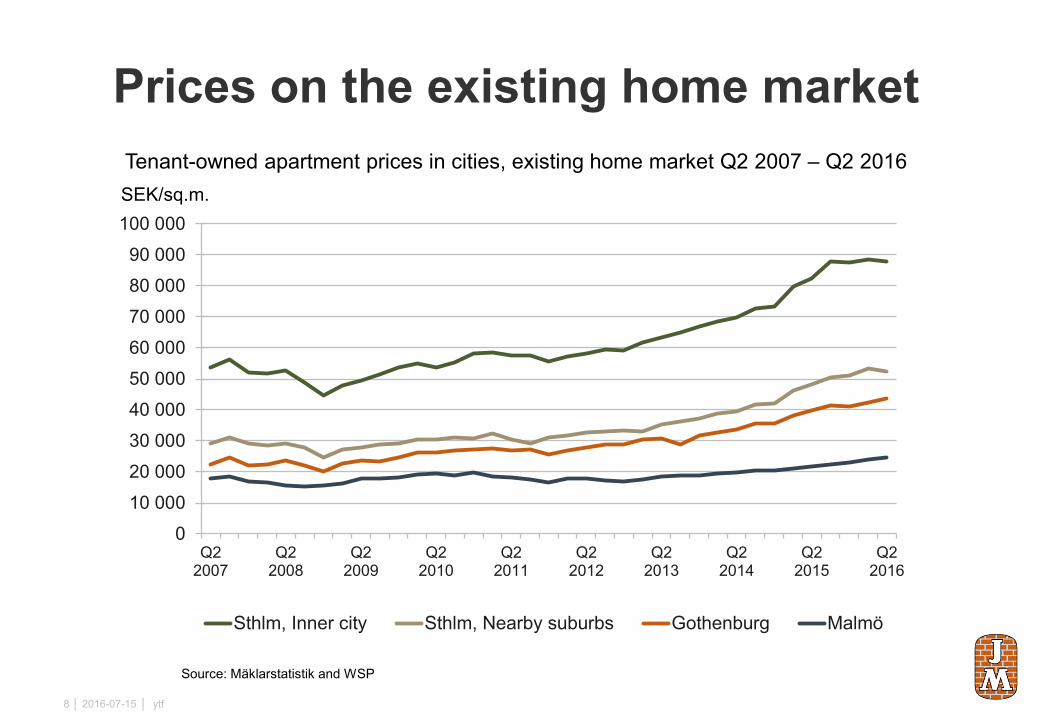
Prices on the existing home market
2016-07-15 │ ytf8 │
Tenant-owned apartment prices in cities, existing home market Q2 2007 – Q2 2016SEK/sq.m.
Source: Mäklarstatistik and WSP
010 00020 00030 00040 00050 00060 00070 00080 00090 000
100 000
Q22007
Q22008
Q22009
Q22010
Q22011
Q22012
Q22013
Q22014
Q22015
Q22016
Sthlm, Inner city Sthlm, Nearby suburbs Gothenburg Malmö

785 855 800
452625 664
194460 494
0
768745
529
648
413
383
0
200
400
600
800
1 000
1 200
1 400
1 600
1 800
2014 2015 2016 2014 2015 2016 2014 2015 2016 2014 2015 2016
High level of sold residential units
2016-07-15 │ ytf9 │
Numberof units
Q1-Q2 Q3-Q4
JM Residential Stockholm JM Residential Sweden JM International JM Property Development
1,553
981
607
54
1,600
1,273
843
54

761 753 655444 543 647
205427 470
0
744914
559
685
448
355
0
200
400
600
800
1 000
1 200
1 400
1 600
1 800
2014 2015 2016 2014 2015 2016 2014 2015 2016 2014 2015 2016
High level of housing starts
2016-07-15 │ ytf10 │
JM Residential Stockholm JM Residential Sweden JM International JM Property Development
Numberof units
1,505
1,003
653
284
1,667
1,228
782
54
Q1-Q2 Q3-Q4

Kuttern - KanalstadenÖsteråker
2016-07-15 │ ytf11 │
No. of residential units 150Housing starts Q2 2016 50Completed in 2018
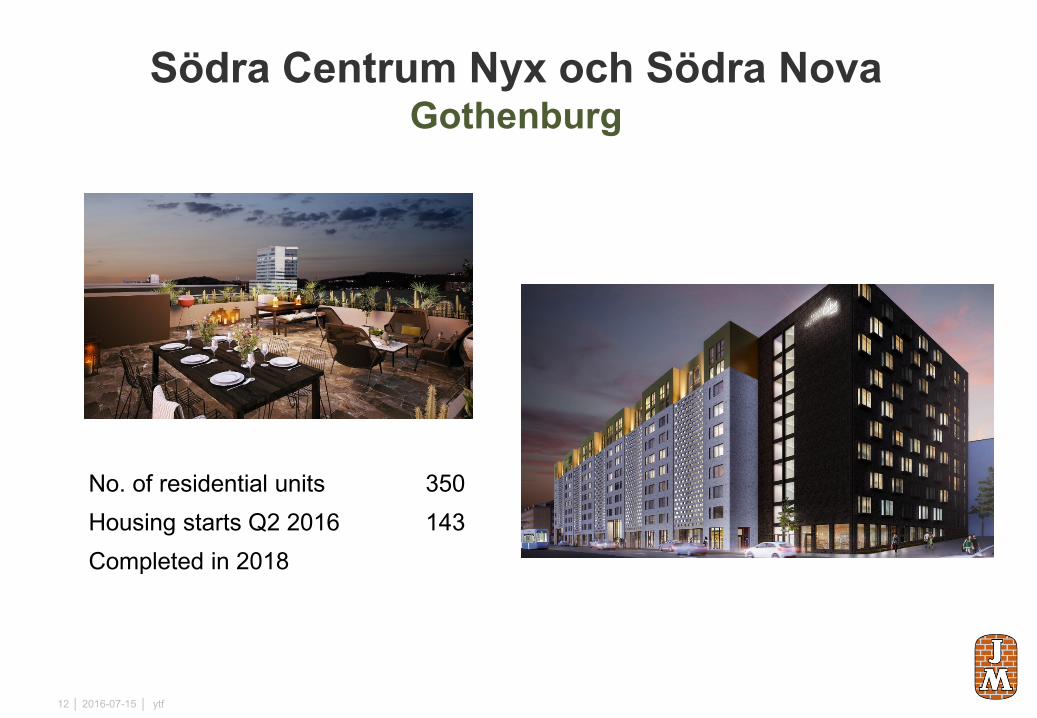
Södra Centrum Nyx och Södra NovaGothenburg
2016-07-15 │ ytf12 │
No. of residential units 350Housing starts Q2 2016 143Completed in 2018
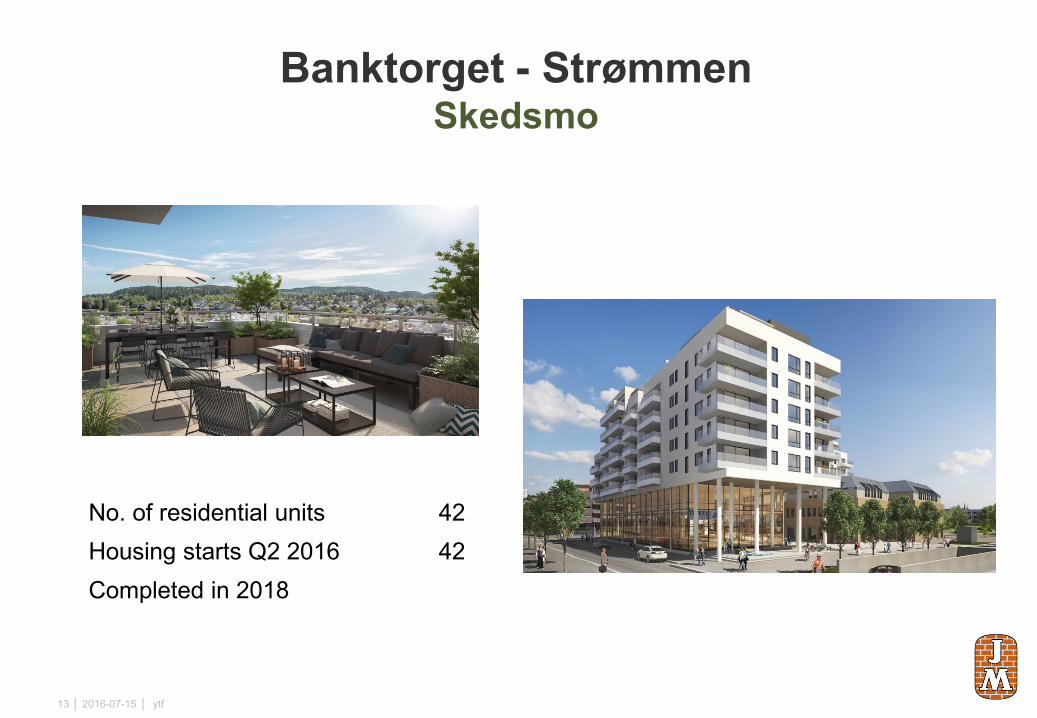
Banktorget - StrømmenSkedsmo
2016-07-15 │ ytf13 │
No. of residential units 42Housing starts Q2 2016 42Completed in 2018
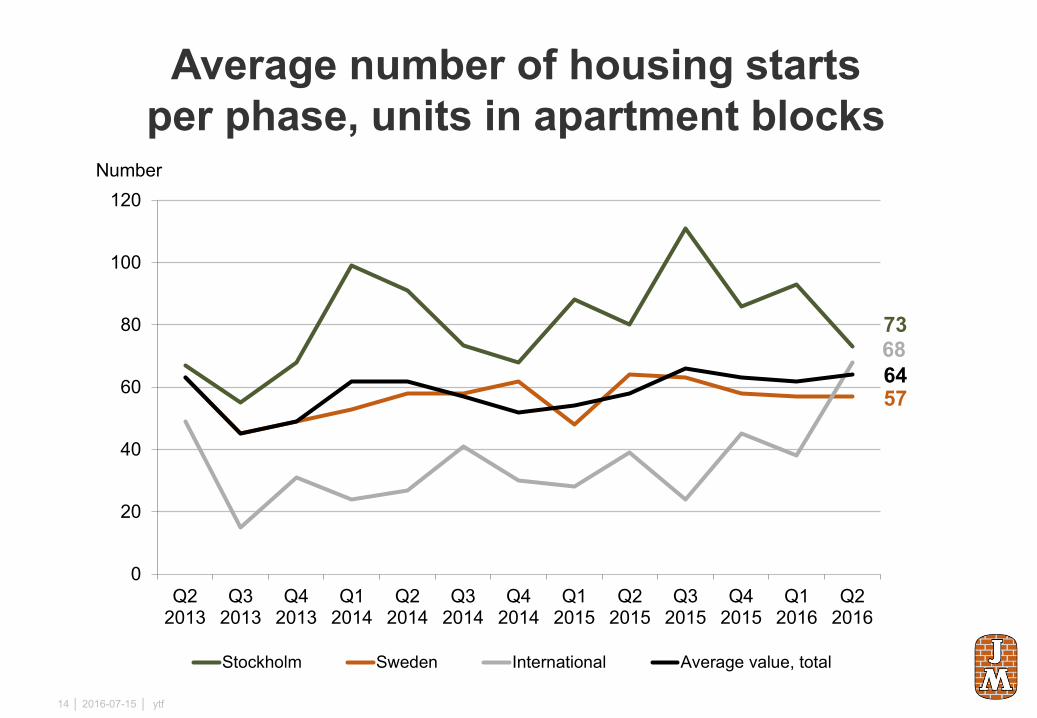
Average number of housing starts per phase, units in apartment blocks
2016-07-15 │ ytf14 │
73
57
6864
0
20
40
60
80
100
120
Q22013
Q32013
Q42013
Q12014
Q22014
Q32014
Q42014
Q12015
Q22015
Q32015
Q42015
Q12016
Q22016
Stockholm Sweden International Average value, total
Number
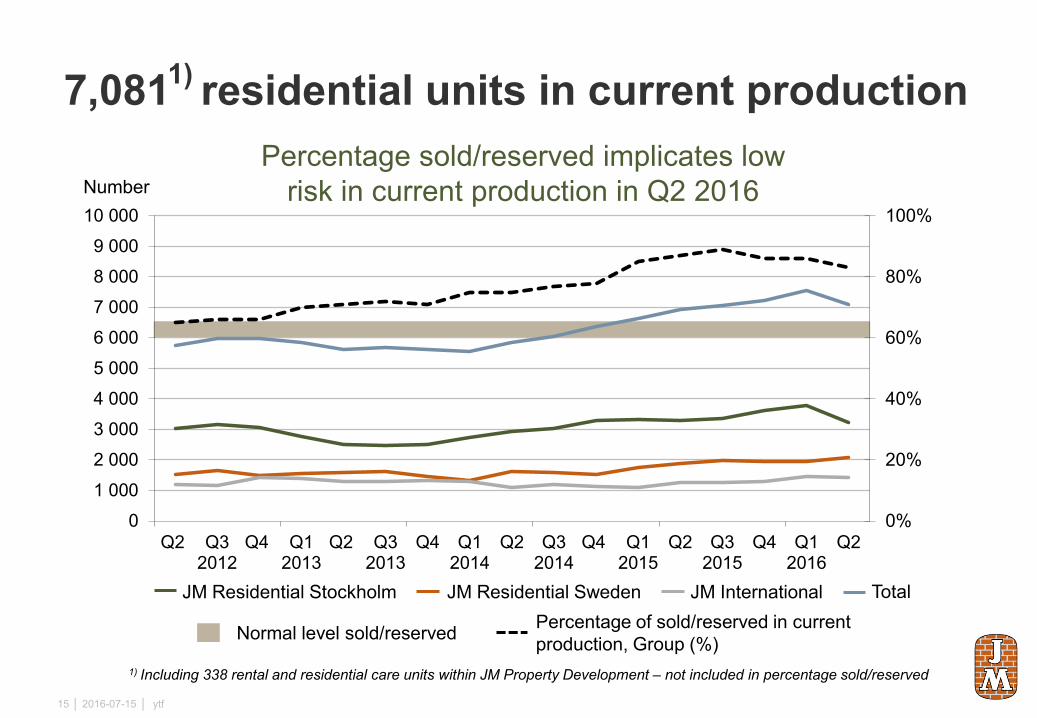
7,0811) residential units in current production
2016-07-15 │ ytf15 │
0%
20%
40%
60%
80%
100%
01 0002 0003 0004 0005 0006 0007 0008 0009 000
10 000
Q2 Q32012
Q4 Q12013
Q2 Q32013
Q4 Q12014
Q2 Q32014
Q4 Q12015
Q2 Q32015
Q4 Q12016
Q2
NumberPercentage sold/reserved implicates low
risk in current production in Q2 2016
Percentage of sold/reserved in current production, Group (%)
JM InternationalJM Residential SwedenJM Residential Stockholm
Normal level sold/reserved
Total
1) Including 338 rental and residential care units within JM Property Development – not included in percentage sold/reserved
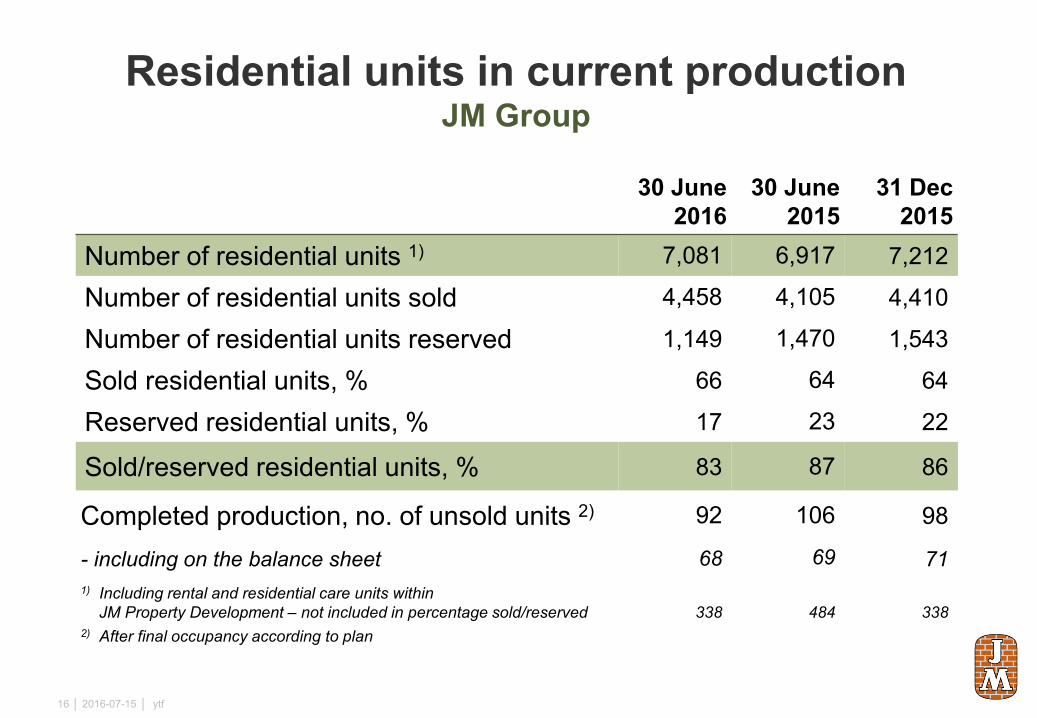
Residential units in current productionJM Group
30 June 2016
30 June 2015
31 Dec 2015
Number of residential units 1) 7,081 6,917 7,212
Number of residential units sold 4,458 4,105 4,410
Number of residential units reserved 1,149 1,470 1,543
Sold residential units, % 66 64 64
Reserved residential units, % 17 23 22
Sold/reserved residential units, % 83 87 86
Completed production, no. of unsold units 2) 92 106 98
- including on the balance sheet 68 69 711) Including rental and residential care units within
JM Property Development – not included in percentage sold/reserved 338 484 3382) After final occupancy according to plan
2016-07-15 │ ytf16 │
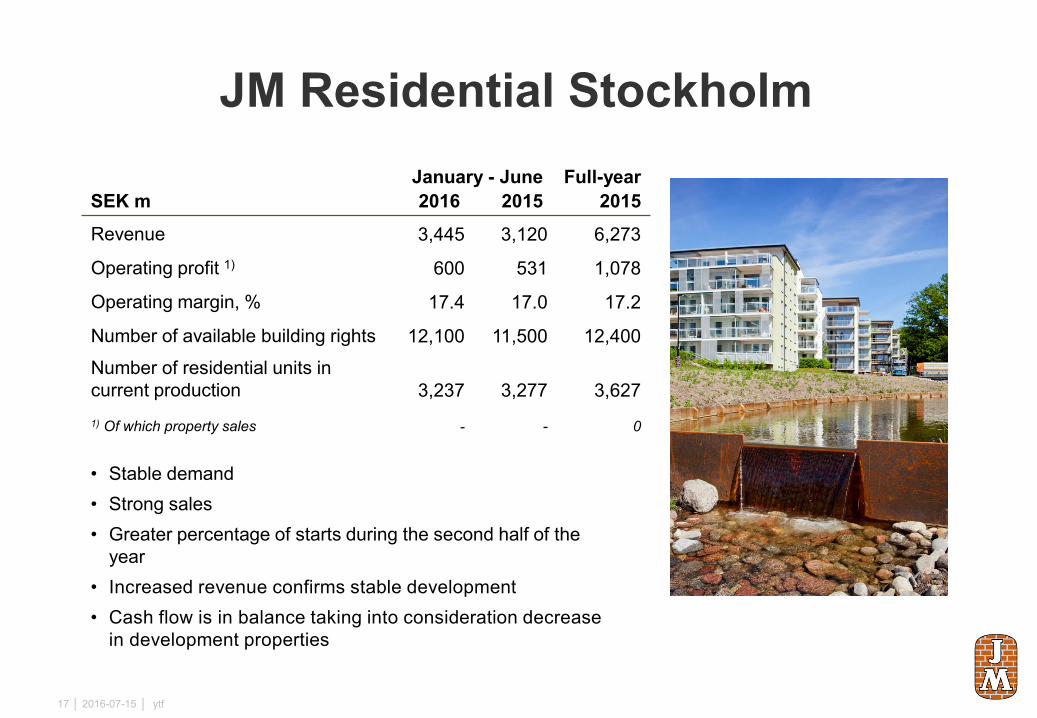
JM Residential Stockholm
2016-07-15 │ ytf17 │
January - June Full-yearSEK m 2016 2015 2015Revenue 3,445 3,120 6,273
Operating profit 1) 600 531 1,078
Operating margin, % 17.4 17.0 17.2
Number of available building rights 12,100 11,500 12,400Number of residential units in current production 3,237 3,277 3,6271) Of which property sales - - 0
• Stable demand • Strong sales• Greater percentage of starts during the second half of the
year• Increased revenue confirms stable development• Cash flow is in balance taking into consideration decrease
in development properties

JM Residential Sweden
2016-07-15 │ ytf18 │
• Stable demand
• Strong sales
• Improved revenue, profit and margin• Cash flow is in balance taking into consideration
decrease in development properties
January - June Full-yearSEK m 2016 2015 2015Revenue 1,993 1,588 3,278
Operating profit 1) 219 138 308
Operating margin, % 11.0 8.7 9.4
Number of available building rights 9,600 8,900 9,900Number of residential units in current production 2,075 1,883 1,9441) Of which property sales 0 0 0

JM International
2016-07-15 │ ytf19 │
• Stable demand • Strong sales in Norway• The concentration of our foreign operations strengthens the
operating margin• Building rights portfolio in Denmark liquidated• Cash flow strengthened by decrease in working capital
January - June Full-yearSEK m 2016 2015 2015Revenue 1,667 1,528 3,059Of which Norway 1,487 1,331 2,664
Operating profit 1) 74 80 166Of which Norway 96 83 181
Operating margin, % 4.4 5.2 5.4Of which Norway 6.5 6.2 6.8
Number of available building rights 8,000 7,000 8,200Number of residential units in current production 1,431 1,273 1,3031) Of which property sales -23 20 39
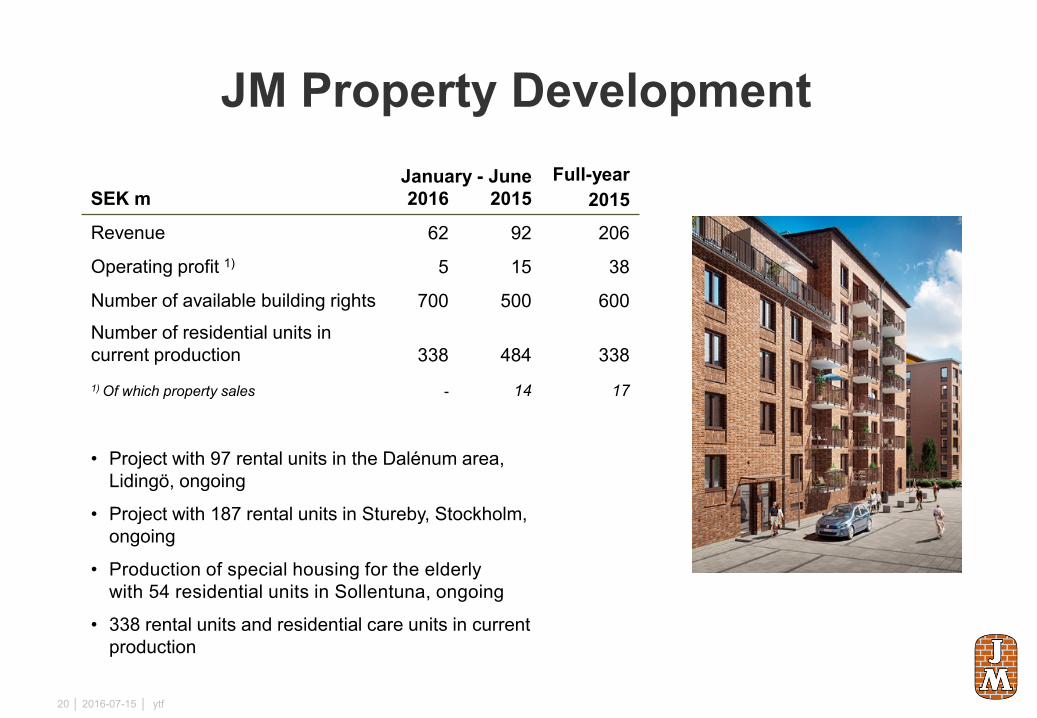
JM Property Development
2016-07-15 │ ytf20 │
• Project with 97 rental units in the Dalénum area, Lidingö, ongoing
• Project with 187 rental units in Stureby, Stockholm, ongoing
• Production of special housing for the elderlywith 54 residential units in Sollentuna, ongoing
• 338 rental units and residential care units in current production
January - June Full-yearSEK m 2016 2015 2015Revenue 62 92 206
Operating profit 1) 5 15 38
Number of available building rights 700 500 600Number of residential units in current production 338 484 3381) Of which property sales - 14 17

JM Construction
2016-07-15 │ ytf21 │
January - June Full-yearSEK m 2016 2015 2015
Revenue 1) 807 1,112 2,084
Operating profit 21 32 45
Operating margin, % 2.6 2.9 2.2
1) Of which internal 247 207 453
• Good demand but tough competition
• Solid orders
• Decreased revenue – co-generation plant project completed
• Lower profit
• Cash flow is limited by a delayed payment from an external orderer that is under dispute
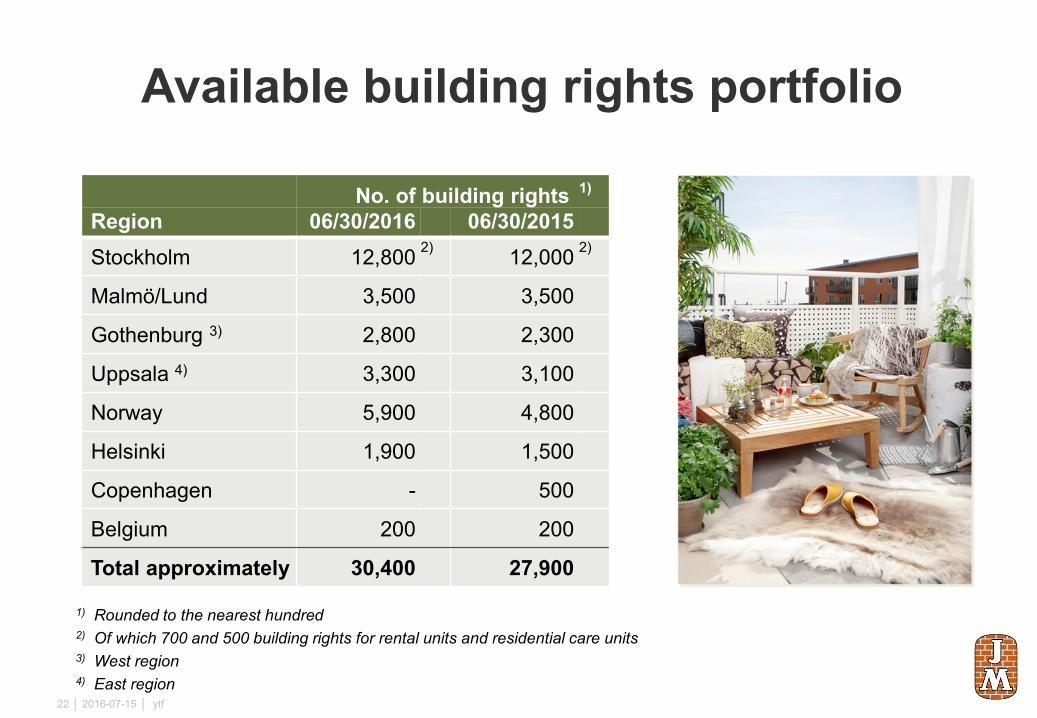
Available building rights portfolio
2016-07-15 │ ytf22 │
1) Rounded to the nearest hundred2) Of which 700 and 500 building rights for rental units and residential care units3) West region4) East region
No. of building rights 1)
Region 06/30/2016 06/30/2015Stockholm 12,800 2) 12,000 2)
Malmö/Lund 3,500 3,500
Gothenburg 3) 2,800 2,300
Uppsala 4) 3,300 3,100
Norway 5,900 4,800
Helsinki 1,900 1,500
Copenhagen - 500
Belgium 200 200
Total approximately 30,400 27,900

SEK m 2013 2014 2015Jan-Jun
2016Opening balance 5,769 5,988 6,802 7,067
Plus 1,274 2,273 2,695 375
Minus -1,055 -1,459 -2,430 -908
Closing balance 5,988 6,802 7,067 6,534
Lower level of development properties Building rights in Balance Sheet
2016-07-15 │ ytf23 │
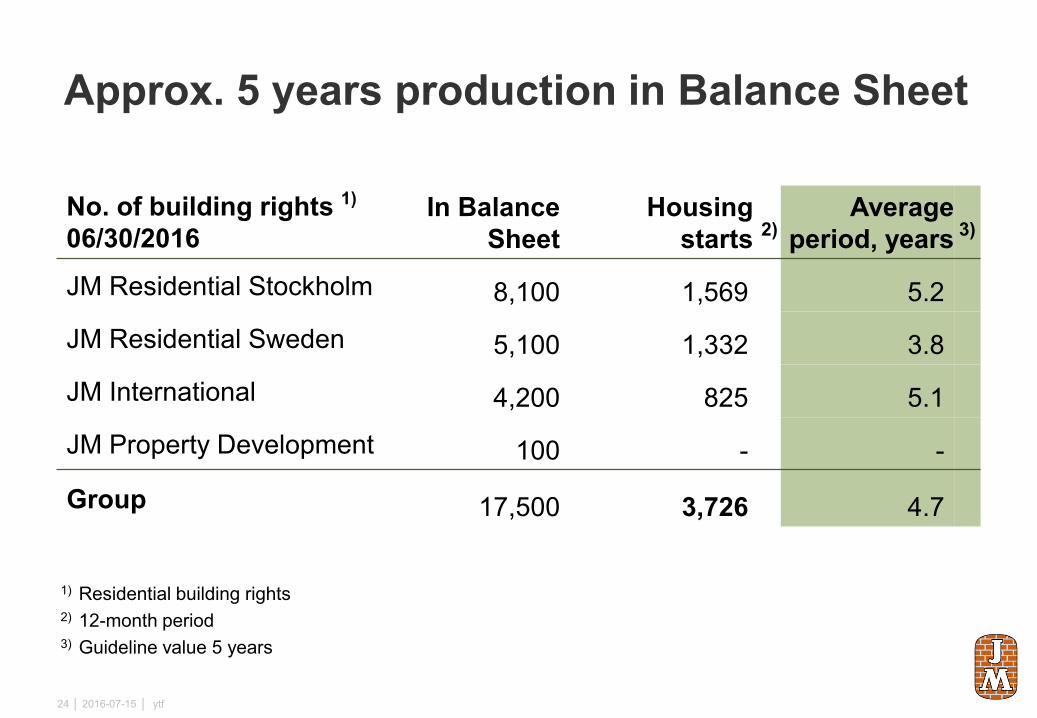
Approx. 5 years production in Balance Sheet
2016-07-15 │ ytf24 │
1) Residential building rights2) 12-month period3) Guideline value 5 years
No. of building rights 1)
06/30/2016In Balance
SheetHousing
starts 2)Average
period, years 3)
JM Residential Stockholm 8,100 1,569 5.2
JM Residential Sweden 5,100 1,332 3.8
JM International 4,200 825 5.1
JM Property Development 100 - -
Group 17,500 3,726 4.7

68 unsold residential units in the Balance Sheet, SEK 247m
2016-07-15 │ ytf25 │
292
229 235 233 247
0
100
200
300
400
Q2 2015 Q3 2015 Q4 2015 Q1 2016 Q2 2016
SEK m

Cash flow
2016-07-15 │ ytf26 │
Cash flow statement, SEK m Q2
2015Q3
2015Q4
2015Q1
2016Q2
2016From operating activities 1) 2) 3) 659 -193 -423 601 886
From investing activities -5 -2 -2 0 -3
From financing activities -841 -131 143 -696 -784
Total cash flow for the quarter -187 -326 -282 -95 99Cash and cash equivalentsend of period 1,887 1,557 1,275 1,182 1,2821) Of which net investment
project properties -42 -48 -54 -54 -582) Of which net investment
development properties 321 108 -604 319 241
3) Of which paid tax -115 -521 -79 -135 -99
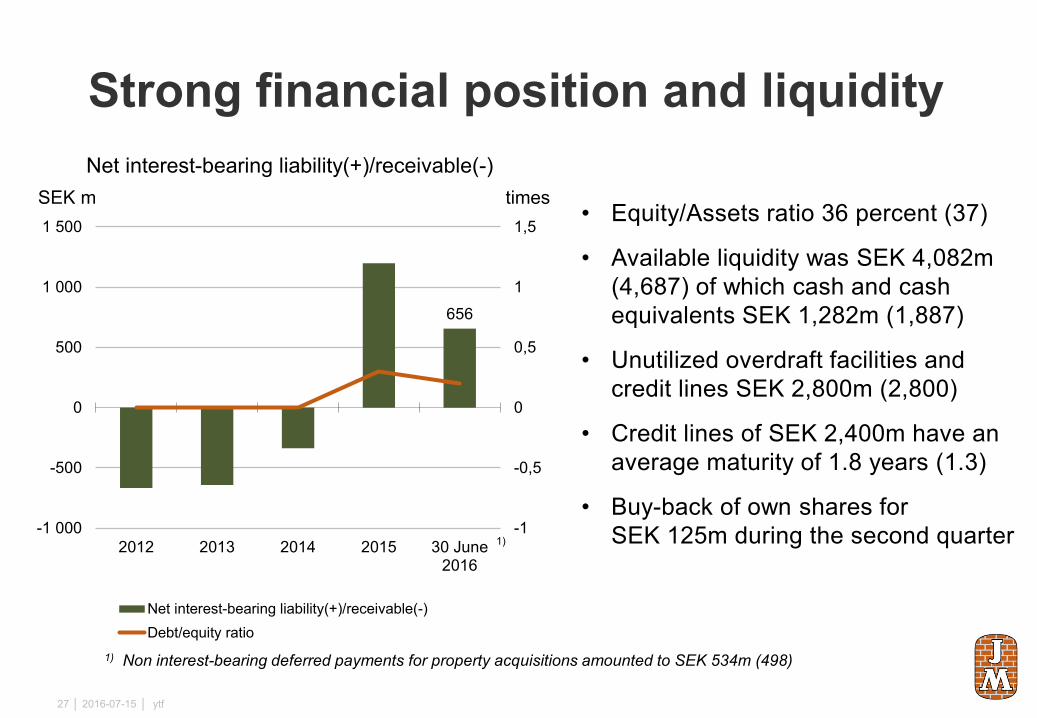
Strong financial position and liquidity
• Equity/Assets ratio 36 percent (37)
• Available liquidity was SEK 4,082m (4,687) of which cash and cash equivalents SEK 1,282m (1,887)
• Unutilized overdraft facilities and credit lines SEK 2,800m (2,800)
• Credit lines of SEK 2,400m have an average maturity of 1.8 years (1.3)
• Buy-back of own shares for SEK 125m during the second quarter
656
-1
-0,5
0
0,5
1
1,5
-1 000
-500
0
500
1 000
1 500
2012 2013 2014 2015 30 June2016
Net interest-bearing liability(+)/receivable(-)Debt/equity ratio
2016-07-15 │ ytf27 │
SEK m times
1) Non interest-bearing deferred payments for property acquisitions amounted to SEK 534m (498)
1)
Net interest-bearing liability(+)/receivable(-)
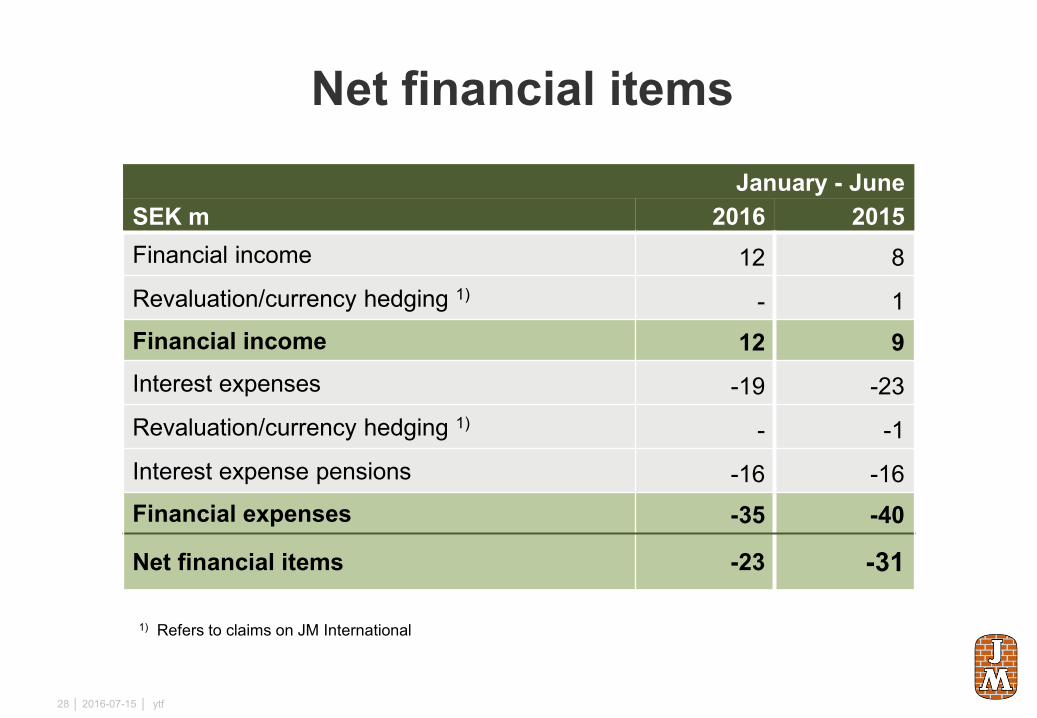
Net financial items
2016-07-15 │ ytf28 │
1) Refers to claims on JM International
January - June SEK m 2016 2015Financial income 12 8
Revaluation/currency hedging 1) - 1Financial income 12 9Interest expenses -19 -23
Revaluation/currency hedging 1) - -1
Interest expense pensions -16 -16Financial expenses -35 -40
Net financial items -23 -31

Components of profit/loss – housing business Percentage of completion method (gross) Q2 2016 (Q1 2016)
2016-07-15 │ ytf29 │
Cost-based effectSEK 280m (305)
Revaluation effect SEK 333m (287)
Sales effectSEK 64m (16)+ +
=Profit/loss
for the periodSEK 677m (608)
Recognized expenses ×contribution margin (for the current period).
Changed assessment about forecast total contribution margin and/or total cost of a project that involves revaluation of recognized profit/loss from earlier periods.
Change in the relationship between stage of completion and sales rate in a period (incoming – outgoing)(Adjustment of accumulated profit for unsold homes).
Always positive Usually positive Positive/negative
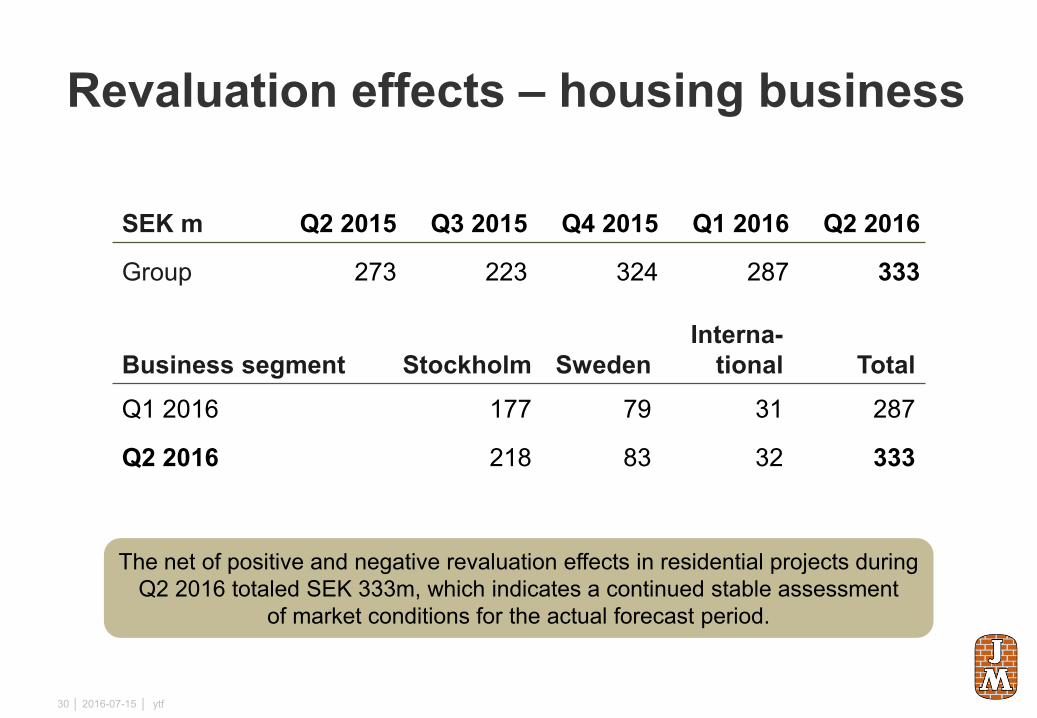
Revaluation effects – housing business
2016-07-15 │ ytf30 │
SEK m Q2 2015 Q3 2015 Q4 2015 Q1 2016 Q2 2016
Group 273 223 324 287 333
The net of positive and negative revaluation effects in residential projects during Q2 2016 totaled SEK 333m, which indicates a continued stable assessment
of market conditions for the actual forecast period.
Business segment Stockholm SwedenInterna-
tional TotalQ1 2016 177 79 31 287
Q2 2016 218 83 32 333
• Customer focused – strong brand
• 30,400 building rights in attractive locations
• Fundamentally favorable prospects
• Sustainable urban planning
• Efficient management system
• Strong balance sheet – focus on cash flow
• Well balanced risk profile
• Skills development prioritized
JM today
2016-07-15 │ ytf31 │