Interim Report for the six months ended 30 September...
32
1 Press Release 10 November 2015 Interim Report for the six months ended 30 September 2015 DCC, the international sales, marketing, distribution and business support services group, today announced its results for the six months ended 30 September 2015. Highlights 2015 2014 1 % change DCC Energy volumes (litres) 5.818b 5.215b 11.6% Revenue (excl. DCC Energy) £1.407b £1.348b 4.3% Operating profit 2 £88.4m £70.1m 26.1% Adjusted earnings per share 2 70.3p 59.3p 18.5% Interim dividend 33.04p 28.73p 15.0% Operating cash flow £120.7m £17.9m 26.1% growth in Group operating profit, driven in particular by the performances of DCC Energy and DCC Healthcare. Adjusted earnings per share on a continuing basis up 18.5% to 70.3 pence. Interim dividend increased by 15% to 33.04 pence per share. Strong cash flow performance with investment in net working capital reducing by 4.6 days. Net cash position at 30 September 2015 of £153 million (pro-forma net debt of £170 million adjusting for the consideration for Butagaz). Completion of acquisitions of Butagaz (ahead of schedule) and Esso Retail France, with both trading well. Further bolt-on acquisitions announced today in DCC Healthcare and DCC Technology. Assuming normal winter weather conditions in the balance of the financial year, the Group expects that both operating profit and adjusted earnings per share for the year ending 31 March 2016 will be very significantly ahead of the prior year and modestly ahead of current market consensus expectations. Commenting on the results, Tommy Breen, Chief Executive, said: “I am pleased to report that operating profit of £88.4 million was 26.1% ahead of the prior year in the seasonally less significant first half. This very strong Group performance was achieved through excellent performances from the Energy, Healthcare and Environmental divisions, notwithstanding a more difficult background for the Technology division. Adjusted earnings per share increased by 18.5% to 70.3 pence. 1 Income Statement items have been restated to reflect the disposal of DCC Food & Beverage 2 Excluding net exceptionals and amortisation of intangible assets
Transcript of Interim Report for the six months ended 30 September...

1
Press Release
10 November 2015
Interim Report for the six months ended 30 September 2015 DCC, the international sales, marketing, distribution and business support services group, today announced its results for the six months ended 30 September 2015.
Highlights 2015 20141 % change
DCC Energy volumes (litres) 5.818b 5.215b 11.6%
Revenue (excl. DCC Energy) £1.407b £1.348b 4.3%
Operating profit2 £88.4m £70.1m 26.1%
Adjusted earnings per share2 70.3p 59.3p 18.5%
Interim dividend 33.04p 28.73p 15.0%
Operating cash flow £120.7m £17.9m
26.1% growth in Group operating profit, driven in particular by the performances of DCC Energy and DCC Healthcare.
Adjusted earnings per share on a continuing basis up 18.5% to 70.3 pence.
Interim dividend increased by 15% to 33.04 pence per share.
Strong cash flow performance with investment in net working capital reducing by 4.6 days.
Net cash position at 30 September 2015 of £153 million (pro-forma net debt of £170 million adjusting for the consideration for Butagaz).
Completion of acquisitions of Butagaz (ahead of schedule) and Esso Retail France, with both trading well.
Further bolt-on acquisitions announced today in DCC Healthcare and DCC Technology.
Assuming normal winter weather conditions in the balance of the financial year, the Group expects that both operating profit and adjusted earnings per share for the year ending 31 March 2016 will be very significantly ahead of the prior year and modestly ahead of current market consensus expectations.
Commenting on the results, Tommy Breen, Chief Executive, said: “I am pleased to report that operating profit of £88.4 million was 26.1% ahead of the prior year in the seasonally less significant first half. This very strong Group performance was achieved through excellent performances from the Energy, Healthcare and Environmental divisions, notwithstanding a more difficult background for the Technology division.
Adjusted earnings per share increased by 18.5% to 70.3 pence.
1 Income Statement items have been restated to reflect the disposal of DCC Food & Beverage 2 Excluding net exceptionals and amortisation of intangible assets

2
The Board has decided to pay an interim dividend of 33.04 pence per share, which represents a 15% increase on the prior year. The Group continued to be very active from a development perspective. DCC Energy successfully completed the acquisitions of Butagaz and Esso Retail in France and both businesses are performing well. The Healthcare and Technology divisions have also been active, with the acquisition of Design Plus by the Health & Beauty business and CUC by the Continental European Technology business. Assuming normal winter weather conditions in the balance of the financial year, the Group expects that both operating profit and adjusted earnings per share for the year ending 31 March 2016 will be very significantly ahead of the prior year and modestly ahead of current market consensus expectations. The successful completion in May 2015 of the 5% share placing has ensured that the Group retains significant financial capacity for further development while preserving the balance sheet strength that has served it well over many years. DCC remains ambitious to continue the growth and development of its business.”
Presentation of results and dial-in facility There will be a presentation of these results to analysts and investors/fund managers at 8.45 am today in the London Stock Exchange. The slides for this presentation can be downloaded from DCC’s website, www.dcc.ie. A dial-in facility will be available for this meeting: Ireland: 1800 937 657 UK / International: +44 (0) 203 427 1909 Passcode: 6734192 This report and further information on DCC is available at www.dcc.ie
For reference, please contact:
Tommy Breen, Chief Executive Tel: +353 1 2799 400
Fergal O’Dwyer, Chief Financial Officer Email: [email protected]
Kevin Lucey, Head of Group Finance & Investor Relations Web: www.dcc.ie

3
Group Results A summary of the Group’s results for the six months ended 30 September 2015 is as follows: 2015
£’m 20141 £’m % change
Revenue 5,066 5,425 -6.6%
Operating profit2
DCC Energy 52.9 31.9 +65.6% DCC Technology 8.6 15.2 -43.6% DCC Healthcare 18.4 15.9 +16.1% DCC Environmental 8.5 7.1 +20.0%
Group operating profit2 88.4 70.1
+26.1%
Equity accounted investments’ profit after tax 0.2 0.1
Finance costs (net) (14.6) (13.3)
Profit before net exceptionals, amortisation of intangible assets and tax 74.0 56.9 +30.0%
Net exceptional charge (9.7) (2.0)
Amortisation of intangible assets (11.8) (12.3)
Profit before tax from continuing operations 52.5 42.6 +23.1%
Profit before tax from discontinued operations - 4.9
Taxation (10.3) (5.2)
Profit after tax 42.2 42.3
Non-controlling interests (0.9) -
Attributable profit 41.3 42.3
Adjusted earnings per share2 70.3 pence 59.3 pence +18.5%
Dividend per share 33.04 pence 28.73 pence +15.0%
Operating cash flow 120.7 17.9
Net cash / (debt) at 30 September 153.4 (272.8)
Pro-forma net debt at 30 September3 (169.5) (272.8)
1 Income Statement items have been restated to reflect the disposal of DCC Food & Beverage
2 Excluding net exceptionals and amortisation of intangible assets 3Adjusting for the cash cost of the Butagaz acquisition which completed on 2 November 2015
4
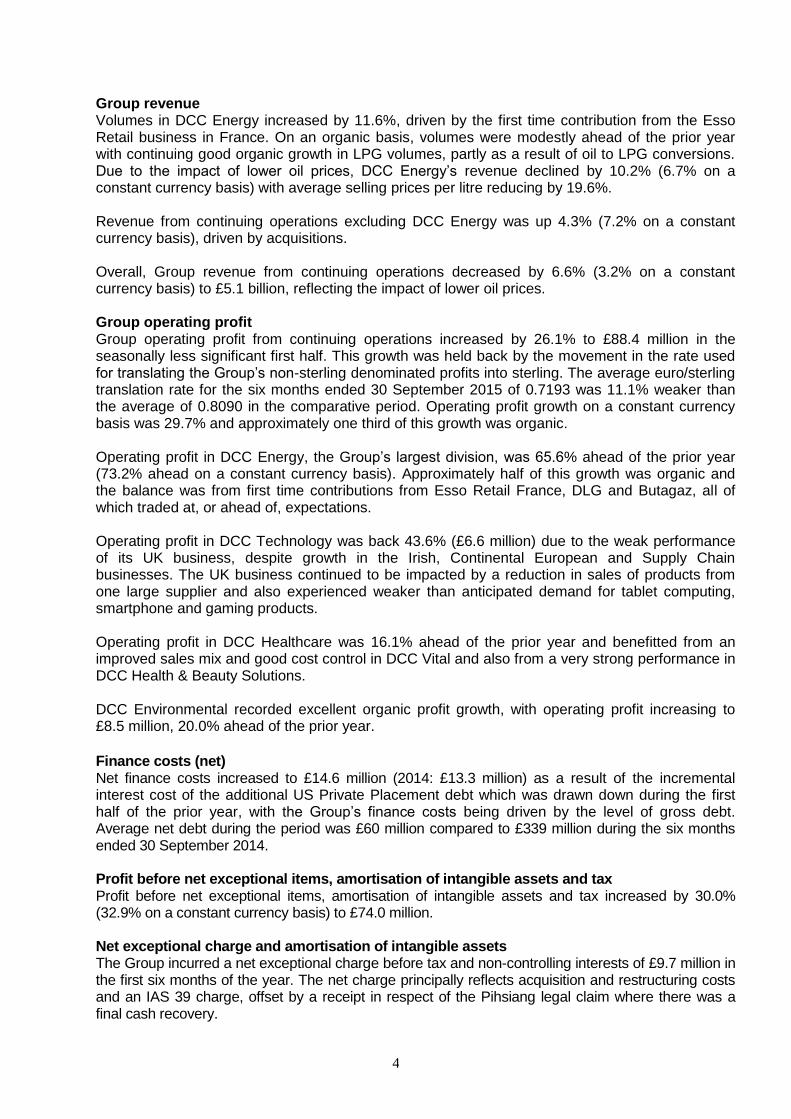
Group revenue Volumes in DCC Energy increased by 11.6%, driven by the first time contribution from the Esso Retail business in France. On an organic basis, volumes were modestly ahead of the prior year with continuing good organic growth in LPG volumes, partly as a result of oil to LPG conversions. Due to the impact of lower oil prices, DCC Energy’s revenue declined by 10.2% (6.7% on a constant currency basis) with average selling prices per litre reducing by 19.6%. Revenue from continuing operations excluding DCC Energy was up 4.3% (7.2% on a constant currency basis), driven by acquisitions. Overall, Group revenue from continuing operations decreased by 6.6% (3.2% on a constant currency basis) to £5.1 billion, reflecting the impact of lower oil prices. Group operating profit Group operating profit from continuing operations increased by 26.1% to £88.4 million in the seasonally less significant first half. This growth was held back by the movement in the rate used for translating the Group’s non-sterling denominated profits into sterling. The average euro/sterling translation rate for the six months ended 30 September 2015 of 0.7193 was 11.1% weaker than the average of 0.8090 in the comparative period. Operating profit growth on a constant currency basis was 29.7% and approximately one third of this growth was organic. Operating profit in DCC Energy, the Group’s largest division, was 65.6% ahead of the prior year (73.2% ahead on a constant currency basis). Approximately half of this growth was organic and the balance was from first time contributions from Esso Retail France, DLG and Butagaz, all of which traded at, or ahead of, expectations. Operating profit in DCC Technology was back 43.6% (£6.6 million) due to the weak performance of its UK business, despite growth in the Irish, Continental European and Supply Chain businesses. The UK business continued to be impacted by a reduction in sales of products from one large supplier and also experienced weaker than anticipated demand for tablet computing, smartphone and gaming products. Operating profit in DCC Healthcare was 16.1% ahead of the prior year and benefitted from an improved sales mix and good cost control in DCC Vital and also from a very strong performance in DCC Health & Beauty Solutions. DCC Environmental recorded excellent organic profit growth, with operating profit increasing to £8.5 million, 20.0% ahead of the prior year.
Finance costs (net) Net finance costs increased to £14.6 million (2014: £13.3 million) as a result of the incremental interest cost of the additional US Private Placement debt which was drawn down during the first half of the prior year, with the Group’s finance costs being driven by the level of gross debt. Average net debt during the period was £60 million compared to £339 million during the six months ended 30 September 2014. Profit before net exceptional items, amortisation of intangible assets and tax Profit before net exceptional items, amortisation of intangible assets and tax increased by 30.0% (32.9% on a constant currency basis) to £74.0 million. Net exceptional charge and amortisation of intangible assets The Group incurred a net exceptional charge before tax and non-controlling interests of £9.7 million in the first six months of the year. The net charge principally reflects acquisition and restructuring costs and an IAS 39 charge, offset by a receipt in respect of the Pihsiang legal claim where there was a final cash recovery.
5
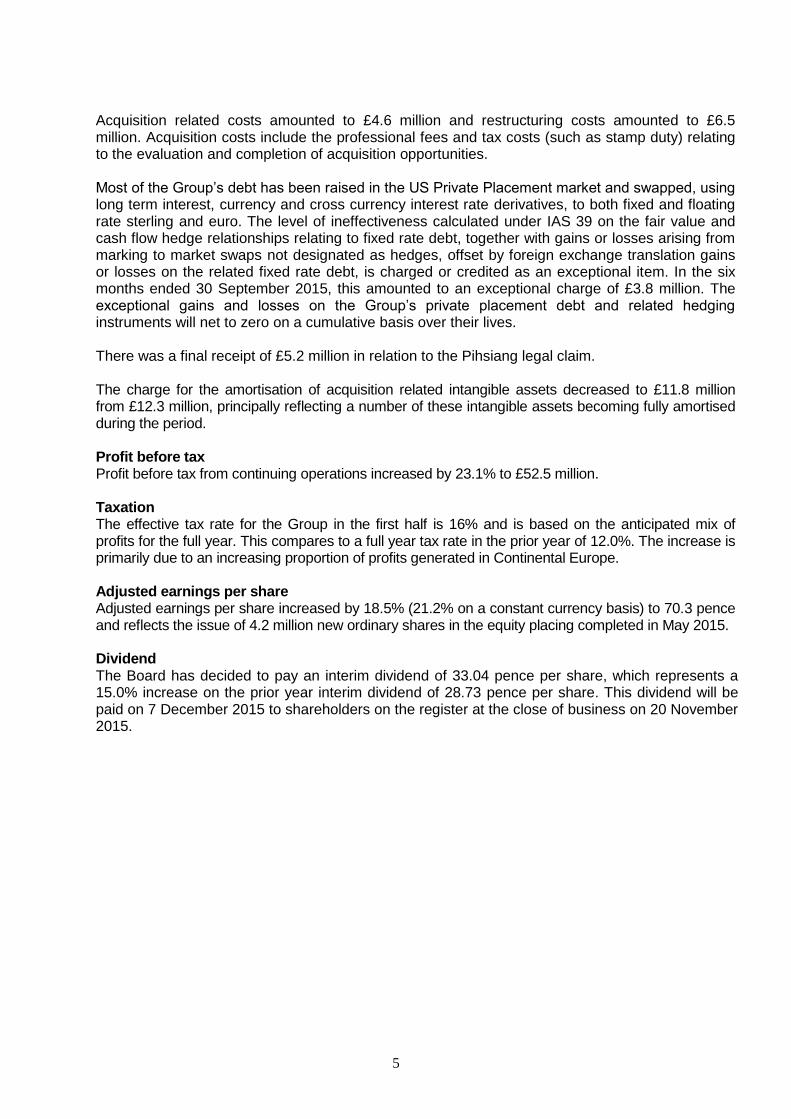
Acquisition related costs amounted to £4.6 million and restructuring costs amounted to £6.5 million. Acquisition costs include the professional fees and tax costs (such as stamp duty) relating to the evaluation and completion of acquisition opportunities. Most of the Group’s debt has been raised in the US Private Placement market and swapped, using long term interest, currency and cross currency interest rate derivatives, to both fixed and floating rate sterling and euro. The level of ineffectiveness calculated under IAS 39 on the fair value and cash flow hedge relationships relating to fixed rate debt, together with gains or losses arising from marking to market swaps not designated as hedges, offset by foreign exchange translation gains or losses on the related fixed rate debt, is charged or credited as an exceptional item. In the six months ended 30 September 2015, this amounted to an exceptional charge of £3.8 million. The exceptional gains and losses on the Group’s private placement debt and related hedging instruments will net to zero on a cumulative basis over their lives. There was a final receipt of £5.2 million in relation to the Pihsiang legal claim. The charge for the amortisation of acquisition related intangible assets decreased to £11.8 million from £12.3 million, principally reflecting a number of these intangible assets becoming fully amortised during the period. Profit before tax Profit before tax from continuing operations increased by 23.1% to £52.5 million. Taxation The effective tax rate for the Group in the first half is 16% and is based on the anticipated mix of profits for the full year. This compares to a full year tax rate in the prior year of 12.0%. The increase is primarily due to an increasing proportion of profits generated in Continental Europe. Adjusted earnings per share Adjusted earnings per share increased by 18.5% (21.2% on a constant currency basis) to 70.3 pence and reflects the issue of 4.2 million new ordinary shares in the equity placing completed in May 2015. Dividend The Board has decided to pay an interim dividend of 33.04 pence per share, which represents a 15.0% increase on the prior year interim dividend of 28.73 pence per share. This dividend will be paid on 7 December 2015 to shareholders on the register at the close of business on 20 November 2015.

6
Cash flow As with its operating profit, the Group’s operating cash flow is significantly weighted towards the second half of the year. The cash flow of the Group for the six months ended 30 September 2015 can be summarised as follows: Six months ended 30 September 2015
£’m 2014
£’m
Operating profit 88.4 73.2 Increase in working capital (4.4) (82.5) Depreciation and other 36.7 27.2 Operating cash flow 120.7 17.9 Capital expenditure (net) (51.3) (36.3) Free cash flow 69.4 (18.4) Dividend from equity accounted investments - 0.7 Interest and tax paid (29.8) (26.2) Free cash flow after interest and tax 39.6 (43.9) Acquisitions (134.2) (105.5) Disposals 2.3 - Dividends (49.9) (43.0) Exceptional items (net) (10.4) (3.6) Share issues 194.0 1.7 Net inflow / (outflow) 41.4 (194.3) Opening net cash / (debt) 30.0 (87.3) Translation and other (7.8) 8.8 Cash acquired - Butagaz 89.8 - Closing net cash / (debt) 153.4 (272.8) Consideration for Butagaz (322.9) Pro-forma net debt (169.5)
Operating cash flow in the six months ended 30 September 2015 of £120.7 million compared to £17.9 million in the prior year. Working capital increased by £4.4 million with overall working capital days improving by 4.6 days to a negative 2.3 days sales. Working capital improvements were achieved by each of the Group's divisions with overall Group receivables days reducing from 29.3 days to 27.3 days. Acquisitions and capital expenditure A number of acquisitions, previously announced, were completed in the period from 1 April 2015 up to the date of this report. These included: DCC Energy Butagaz As announced on 2 November 2015, DCC Energy completed the acquisition of Butagaz, a leading LPG business in France, from Shell. The acquisition of Butagaz represents the largest ever acquisition by DCC and a major step forward in the continuing expansion of its LPG business. The French LPG market is the second largest in Western Europe and approximately twice the size of

7
the market in Britain. The acquisition of Butagaz has provided DCC Energy with a substantial presence in the French LPG market, an experienced management team and a high quality sales, marketing and operating infrastructure. Following receipt of competition clearance from the EU, the agreement to acquire Butagaz became unconditional in all respects on 1 September 2015, well ahead of the schedule anticipated at the time of announcing the acquisition. The economic risks and benefits and related cash flows have accrued to DCC and the Group has been in control since 1 September 2015; accordingly Butagaz has been consolidated by the DCC Group since that date. The consideration for the acquisition of Butagaz (inclusive of cash acquired) of €450 million (£323 million) was accrued at 30 September 2015 and substantially all of this amount was paid on 2 November 2015 following the separation of the Butagaz IT infrastructure from Shell’s global infrastructure. In addition, certain debt-like items provided for within the business will fall due over the medium term. Esso Retail France As previously announced on 24 June 2015, DCC completed the acquisition of the assets that comprise the Esso Express unmanned retail petrol station network and the Esso branded motorway concessions in France from Esso Société Anonyme Française. The business has annual volumes of approximately 1.9 billion litres and the total consideration, inclusive of stock in tank at the date of acquisition, was €130 million (£94 million). DLG Denmark In July 2015, following the receipt of competition clearance, DCC Energy combined its Danish oil distribution business with the fuel distribution activities of DLG, a leading Danish agricultural business. The transaction resulted in DCC Energy owning 60% of the enlarged business which distributes approximately 400 million litres of fuel and is being managed by DCC Energy’s management team. DCC Technology Computers Unlimited In May 2015, DCC Technology acquired Computers Unlimited for an initial enterprise value of £24 million. Computers Unlimited is a consumer technology distributor operating primarily in the UK but also with operations in France and Spain. The business has annual revenue of approximately £140 million and is focused on the ‘connected home’ and professional design market. The business distributes a range of products that are complementary to those distributed by DCC Technology, including design software, printers, accessories and premium audio systems. Acquisition and capital expenditure committed Committed acquisition and capital expenditure in the current period amounted to £91.7 million as follows:
Acquisitions Capex Total £’m £’m £’m DCC Energy 3.5 23.6 27.1 DCC Technology 16.4 16.3 32.7 DCC Healthcare 20.5 4.6 25.1 DCC Environmental - 6.8 6.8 Total 40.4 51.3 91.7
Acquisition activity Committed acquisition expenditure amounted to £40.4 million.

8
DCC Technology CUC In October 2015, DCC Technology made a binding offer for the acquisition of CUC Groupe (“CUC”), a cabling and connectors distribution business headquartered near Paris. Employing 192 people and with annual revenue of approximately €60 million, CUC sells a broad range of cabling products to over 9,000 customers (resellers, systems integrators and electricians) from its operations in France and Germany. The acquisition, which is expected to complete in the final quarter of the financial year, will add specialist expertise in cabling and connector products and significantly broaden the customer base of the Continental European business. DCC Healthcare Design Plus In September 2015, DCC Health & Beauty Solutions strengthened its market position in the contract manufacture of creams and liquids through the acquisition of Design Plus (Holdings) Ltd (“Design Plus”) based in Lancashire, England. The consideration, which was paid in cash at completion, was based on an enterprise value of £15 million. Design Plus brings specialist expertise in sachet filling – it is the leader in this market segment in Britain – and strong relationships with a complementary range of health and beauty brand owners and retailers in Britain, Continental Europe and the USA. Espiner In October 2015, DCC Vital acquired Espiner Medical (“Espiner”), a small medical devices company based near Bristol, England, for a modest consideration. Espiner has developed a range of tissue retrieval bags for use in a wide range of laparoscopic surgical procedures. The acquisition will increase DCC Vital’s own brand revenues and also provides access to an established network of distributors in Europe, the USA and Australasia. Total cash spend on acquisitions in the six months ended 30 September 2015 The previously announced acquisitions of Esso Retail France, DLG and Computers Unlimited, along with the acquisition of Design Plus and other smaller acquisitions, were completed during the six month period for a total consideration of £133 million. Inclusive of the payment of deferred and contingent acquisition consideration previously provided of £1 million, the total cash spend on acquisitions in the six months ended 30 September 2015 was £134 million. Substantially all of the consideration for Butagaz (inclusive of cash acquired) of £323 million accrued at 30 September 2015 was paid on 2 November 2015. Capital expenditure Net capital expenditure for the six months of £51.3 million (2014: £36.3 million) compares to a depreciation charge of £32.5 million (2014: £30.2 million). As previously reported, DCC Technology is continuing to integrate its UK businesses under the Exertis brand and as part of this project is significantly upgrading its ERP and logistics infrastructure. DCC Technology has commenced the construction of a new, purpose built, 450,000 sq.ft. UK national distribution centre in the north of England, close to the majority of its existing facilities. The project is progressing well and the relocation to the new facility will take place on a staged basis, beginning in the second half of the year ending 31 March 2017. Financial strength An integral part of the Group’s strategy is the maintenance of a strong and liquid balance sheet to leave it well placed to take advantage of opportunities as they arise. To that end, and cognisant that the Group had already committed to acquire both the Esso Retail and Butagaz businesses in France, the Group successfully completed a placing of new ordinary shares representing 5% of its issued share capital in May 2015. The shares were placed at a premium to the previous day’s closing price, raising a net £193 million.

9
As a result of the placing and the continuing strong focus on operating cash flow, DCC’s financial position remains very strong. At 30 September 2015, the Group had pro-forma net debt (allowing for the cash cost for Butagaz) of £170 million and total equity of £1.2 billion. At the same date, DCC had pro-forma cash resources, net of overdrafts, of £951 million and a further £140 million of undrawn committed debt facilities. The Group’s outstanding term debt at 30 September 2015 had an average maturity of 6.6 years. Substantially all of the Group’s debt has been raised in the US Private Placement market with an average credit margin of 1.66% over floating Euribor/Libor. Outlook Assuming normal winter weather conditions in the balance of the financial year, the Group expects that both operating profit and adjusted earnings per share for the year ending 31 March 2016 will be very significantly ahead of the prior year and modestly ahead of current market consensus expectations.

10
Performance Review – Divisional Analysis
DCC Energy 2015 2014 % change
Volumes (litres) 5.818b 5.215b 11.6%
Revenue £3.660b £4.077b -10.2%
Operating profit £52.9m £31.9m 65.6%
DCC Energy had an excellent first half with operating profit 65.6% ahead of the prior year (73.2% ahead on a constant currency basis). Approximately half of this growth was organic, benefitting from a strong performance in LPG. DCC Energy sold 5.8 billion litres of product, an increase of 11.6% over the prior year (+0.5% organic). DCC Energy made significant progress in its strategy to expand both its LPG and Retail & Fuel Card businesses through the acquisitions of Butagaz and the Esso Retail business in France. The LPG business performed particularly well. Strong organic volume growth was achieved, driven by growth in sales to commercial and industrial customers, and the business also benefitted from a favourable product pricing environment. The acquisition of Butagaz became unconditional in all respects on 1 September 2015 following the receipt of competition clearance and has been consolidated in DCC’s results since that date. Butagaz significantly strengthens DCC’s LPG business and positions it as the strong number two player in the French market. The Oil Distribution business performed well in the first half. In July, following receipt of competition clearance, DCC Energy combined its Danish oil distribution business with the fuel distribution business of DLG, a leading Danish agricultural group, and the enlarged business contributed strongly in the first half. DCC Energy now owns 60% of the enlarged group which distributes c. 400 million litres of oil in the Danish market. DCC Energy made excellent progress in the development of its Retail & Fuel Card business. On 24 June 2015, DCC completed the acquisition of the Esso Retail petrol station business in France, comprising 272 unmanned Esso Express sites and concessions to operate 47 Esso branded motorway sites. The migration of the business onto DCC’s newly developed operating platform went smoothly and the business has performed strongly since acquisition. DCC continued to expand its retail petrol station business in Sweden where it operates 324 sites. DCC’s Fuel Card business continued its track record of excellent organic volume and profit growth and is now the largest reseller of fuel cards in Britain. DCC Energy has significantly expanded its business since the start of the financial year and now operates across 10 countries in Europe and remains well positioned to grow in these markets and to continue to expand into new geographies.
11
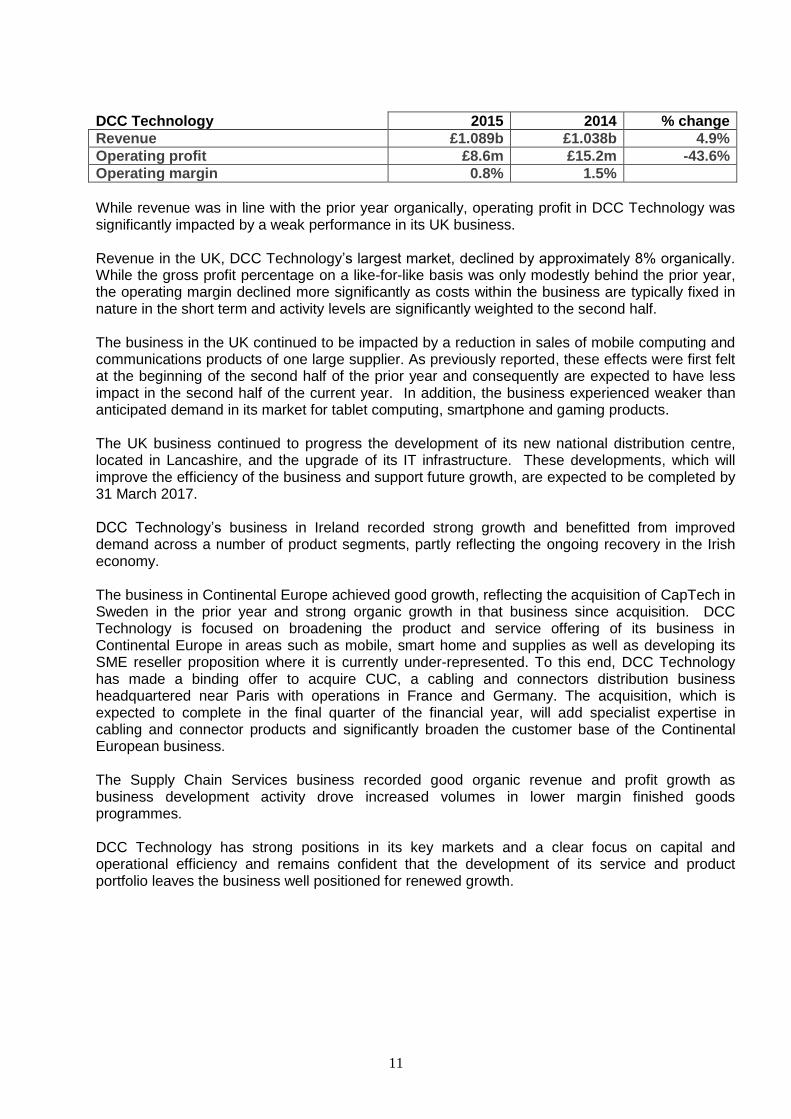
DCC Technology 2015 2014 % change
Revenue £1.089b £1.038b 4.9%
Operating profit £8.6m £15.2m -43.6%
Operating margin 0.8% 1.5%
While revenue was in line with the prior year organically, operating profit in DCC Technology was significantly impacted by a weak performance in its UK business. Revenue in the UK, DCC Technology’s largest market, declined by approximately 8% organically. While the gross profit percentage on a like-for-like basis was only modestly behind the prior year, the operating margin declined more significantly as costs within the business are typically fixed in nature in the short term and activity levels are significantly weighted to the second half. The business in the UK continued to be impacted by a reduction in sales of mobile computing and communications products of one large supplier. As previously reported, these effects were first felt at the beginning of the second half of the prior year and consequently are expected to have less impact in the second half of the current year. In addition, the business experienced weaker than anticipated demand in its market for tablet computing, smartphone and gaming products. The UK business continued to progress the development of its new national distribution centre, located in Lancashire, and the upgrade of its IT infrastructure. These developments, which will improve the efficiency of the business and support future growth, are expected to be completed by 31 March 2017. DCC Technology’s business in Ireland recorded strong growth and benefitted from improved demand across a number of product segments, partly reflecting the ongoing recovery in the Irish economy. The business in Continental Europe achieved good growth, reflecting the acquisition of CapTech in Sweden in the prior year and strong organic growth in that business since acquisition. DCC Technology is focused on broadening the product and service offering of its business in Continental Europe in areas such as mobile, smart home and supplies as well as developing its SME reseller proposition where it is currently under-represented. To this end, DCC Technology has made a binding offer to acquire CUC, a cabling and connectors distribution business headquartered near Paris with operations in France and Germany. The acquisition, which is expected to complete in the final quarter of the financial year, will add specialist expertise in cabling and connector products and significantly broaden the customer base of the Continental European business. The Supply Chain Services business recorded good organic revenue and profit growth as business development activity drove increased volumes in lower margin finished goods programmes. DCC Technology has strong positions in its key markets and a clear focus on capital and operational efficiency and remains confident that the development of its service and product portfolio leaves the business well positioned for renewed growth.

12
DCC Healthcare 2015 2014 % change
Revenue £239.1m £236.9m 0.9%
Operating profit £18.4m £15.9m 16.1%
Operating margin 7.7% 6.7%
DCC Healthcare continued its track record of strong operating profit growth in the first half with profits up 16.1%. The business generated good organic profit growth, benefitting from an improved sales mix and cost control in DCC Vital and organic sales growth in DCC Health & Beauty Solutions. Approximately half of the overall profit growth was from acquisitions completed in the current and prior year. DCC Vital, which is focused on the sales, marketing and distribution of pharmaceuticals and medical devices in Britain and Ireland, recorded good operating profit growth across each of its business areas. In pharma, excellent organic growth was achieved in hospital injectables, including a strong performance from the Beacon Pharmaceuticals portfolio acquired in November 2014. In medical devices, the focus on increasing the proportion of sales generated by its own branded products and streamlining the agency portfolio drove an increase in contribution. The bolt-on acquisition in October 2015 of Espiner Medical, a specialist consumables business, further strengthened DCC Vital’s own brand offering. Williams Medical, the leading provider of medical supplies and services to GP surgeries in Britain, continued to perform well and delivered growth across its portfolio of equipment, consumables and related services. DCC Health & Beauty Solutions, which provides outsourced solutions to nutrition and beauty brand owners in Europe, generated very strong organic operating profit growth. In nutrition, the business benefitted from strong sales growth with a number of European customers as well as further efficiencies from the successful integration of its Swedish tablet manufacturing and packing operations into its larger facility in Britain. The final phase of this integration is on course to be completed in the second half of the year. In beauty, the business benefitted from a number of successful new product development projects on behalf of international brand owners. In September 2015, DCC Health & Beauty Solutions completed the acquisition of Design Plus, the market leader in Britain in sachet filling for health and beauty brand owners, which enhances its service offering and provides access to a range of new customers.

13
DCC Environmental 2015 2014 % change
Revenue £78.3m £73.6m 6.5%
Operating profit £8.5m £7.1m 20.0%
Operating margin 10.8% 9.6%
DCC Environmental performed very strongly during the first half of the year, increasing its operating profit by 20.0% to £8.5 million. This performance was driven by business development initiatives, the improving economic environment in Ireland and continued growth in the construction sector in Britain. Despite declines in commodity prices, the business generated good operating leverage due to cost control. The business in Scotland relocated its Edinburgh operations to a new, larger facility which will enable the further development of DCC Environmental in this region.
Forward-looking statements This announcement contains some forward-looking statements that represent DCC’s expectations for its business, based on current expectations about future events, which by their nature involve risk and uncertainty. DCC believes that its expectations and assumptions with respect to these forward-looking statements are reasonable, however because they involve risk and uncertainty as to future circumstances, which are in many cases beyond DCC’s control, actual results or performance may differ materially from those expressed in or implied by such forward-looking statements. Principal risks and uncertainties The Board of DCC is responsible for the Group’s risk management and internal control systems, which are designed to identify, manage and mitigate potential material risks to the achievement of the Group’s strategic and business objectives. The Board has approved a Risk Management Policy which sets out delegated responsibilities and procedures for the management of risk across the Group. The principal risks and uncertainties facing the Group in the short to medium term, as set out on pages 12 to 15 of the 2015 Annual Report (together with the principal mitigation measures), continue to be the principal risks and uncertainties facing the Group for the remaining six months of the financial year. This is not an exhaustive statement of all relevant risks and uncertainties. Matters which are not currently known to the Board or events which the Board considers to be of low likelihood could emerge and give rise to material consequences. The mitigation measures that are maintained in relation to these risks are designed to provide a reasonable and not an absolute level of protection against the impact of the events in question.
14
Group Income Statement Restated Unaudited 6 months ended Unaudited 6 months ended Audited year ended 30 September 2015 30 September 2014 31 March 2015
Pre exceptionals
Exceptionals (note 6)
Total
Pre exceptionals
Exceptionals
Total
Pre exceptionals
Exceptionals
Total
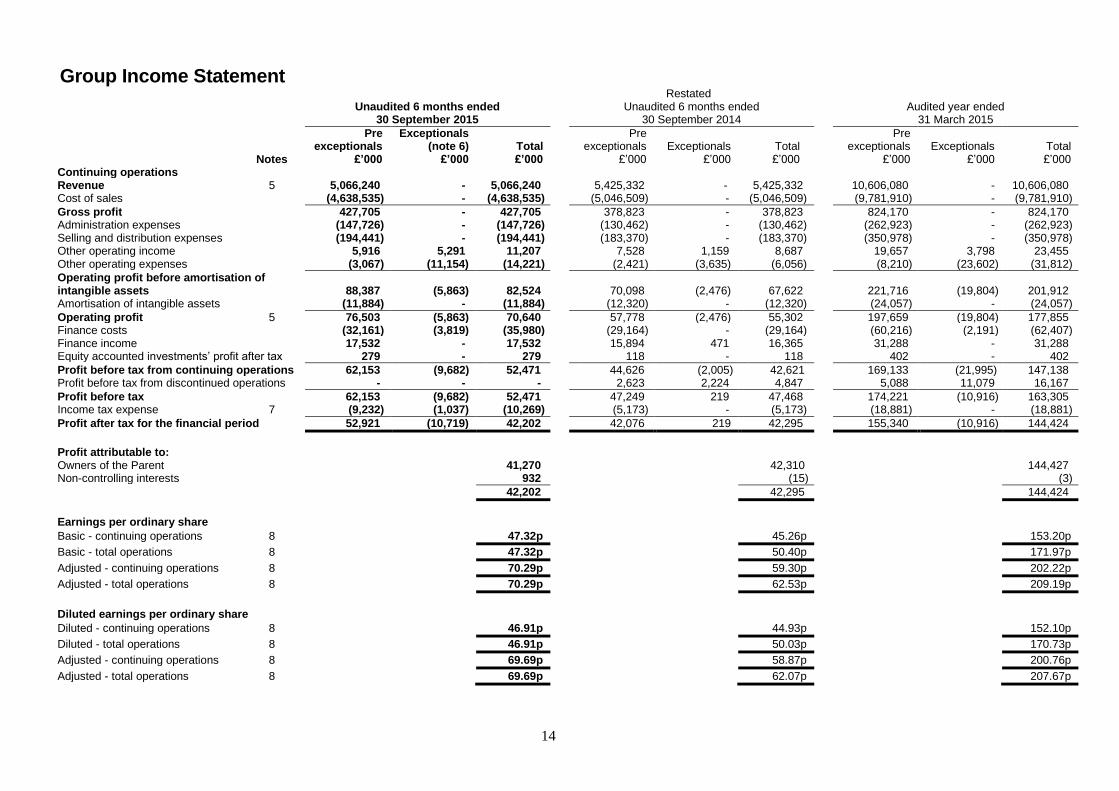
Notes £’000 £’000 £’000 £’000 £’000 £’000 £’000 £’000 £’000 Continuing operations Revenue 5 5,066,240 - 5,066,240 5,425,332 - 5,425,332 10,606,080 - 10,606,080 Cost of sales (4,638,535) - (4,638,535) (5,046,509) - (5,046,509) (9,781,910) - (9,781,910)
Gross profit 427,705 - 427,705 378,823 - 378,823 824,170 - 824,170 Administration expenses (147,726) - (147,726) (130,462) - (130,462) (262,923) - (262,923) Selling and distribution expenses (194,441) - (194,441) (183,370) - (183,370) (350,978) - (350,978) Other operating income 5,916 5,291 11,207 7,528 1,159 8,687 19,657 3,798 23,455 Other operating expenses (3,067) (11,154) (14,221) (2,421) (3,635) (6,056) (8,210) (23,602) (31,812)
Operating profit before amortisation of intangible assets
88,387
(5,863)
82,524
70,098
(2,476)
67,622
221,716
(19,804)
201,912
Amortisation of intangible assets (11,884) - (11,884) (12,320) - (12,320) (24,057) - (24,057)
Operating profit 5 76,503 (5,863) 70,640 57,778 (2,476) 55,302 197,659 (19,804) 177,855 Finance costs (32,161) (3,819) (35,980) (29,164) - (29,164) (60,216) (2,191) (62,407) Finance income 17,532 - 17,532 15,894 471 16,365 31,288 - 31,288 Equity accounted investments’ profit after tax 279 - 279 118 - 118 402 - 402
Profit before tax from continuing operations 62,153 (9,682) 52,471 44,626 (2,005) 42,621 169,133 (21,995) 147,138 Profit before tax from discontinued operations - - - 2,623 2,224 4,847 5,088 11,079 16,167
Profit before tax 62,153 (9,682) 52,471 47,249 219 47,468 174,221 (10,916) 163,305 Income tax expense 7 (9,232) (1,037) (10,269) (5,173) - (5,173) (18,881) - (18,881)
Profit after tax for the financial period 52,921 (10,719) 42,202 42,076 219 42,295 155,340 (10,916) 144,424
Profit attributable to: Owners of the Parent 41,270 42,310 144,427 Non-controlling interests 932 (15) (3)
42,202 42,295 144,424
Earnings per ordinary share
Basic - continuing operations 8 47.32p 45.26p 153.20p
Basic - total operations 8 47.32p 50.40p 171.97p
Adjusted - continuing operations 8 70.29p 59.30p 202.22p
Adjusted - total operations 8 70.29p 62.53p 209.19p
Diluted earnings per ordinary share
Diluted - continuing operations 8 46.91p 44.93p 152.10p
Diluted - total operations 8 46.91p 50.03p 170.73p
Adjusted - continuing operations 8 69.69p 58.87p 200.76p
Adjusted - total operations 8 69.69p 62.07p 207.67p

15
Group Statement of Comprehensive Income Unaudited Unaudited Audited 6 months 6 months year ended ended ended 30 Sept. 30 Sept. 31 March 2015 2014 2015 £’000 £’000 £’000 Group profit for the period 42,202 42,295 144,424 Other comprehensive income: Items that may be reclassified subsequently to profit or loss Currency translation: - arising in the period 6,956 (7,903) (15,007) - recycled to the Income Statement on disposal - - (2,721) Movements relating to cash flow hedges (3,881) (4,004) (6,942) Movement in deferred tax liability on cash flow hedges 1,337 20 324
4,412 (11,887) (24,346)
Items that will not be reclassified to profit or loss Group defined benefit pension obligations: - remeasurements 8,041 (12,129) (19,302) - movement in deferred tax asset (1,132) 1,443 2,187
6,909 (10,686) (17,115)
Other comprehensive income for the period, net of tax 11,321 (22,573) (41,461)
Total comprehensive income for the period 53,523 19,722 102,963
Attributable to: Owners of the Parent 51,996 20,034 103,555 Non-controlling interests 1,527 (312) (592)
53,523 19,722 102,963

16
Group Balance Sheet Unaudited Unaudited Audited 30 Sept. 30 Sept. 31 March 2015 2014 2015
Notes £’000 £’000 £’000 ASSETS Non-current assets Property, plant and equipment 723,360 483,919 464,689 Intangible assets 1,115,861 784,608 759,179 Equity accounted investments 5,329 5,305 4,963 Deferred income tax assets 12,338 10,431 9,380 Derivative financial instruments 194,133 95,709 233,150
2,051,021 1,379,972 1,471,361
Current assets Inventories 402,658 399,395 320,655 Trade and other receivables 898,780 938,228 847,274 Derivative financial instruments 5,900 5,747 5,395 Cash and cash equivalents 1,458,748 1,075,909 1,260,942
2,766,086 2,419,279 2,434,266 Assets classified as held for sale - 57,624 12,196
2,766,086 2,476,903 2,446,462
Total assets 4,817,107 3,856,875 3,917,823
EQUITY Capital and reserves attributable to owners of the Parent Share capital 15,443 14,688 14,688 Share premium 274,339 83,032 83,032 Share based payment reserve 10 13,623 11,649 12,756 Cash flow hedge reserve 10 (13,006) (7,828) (10,462) Foreign currency translation reserve 10 39,044 42,216 32,683 Other reserves 10 932 932 932 Retained earnings 849,323 776,509 849,119
Equity attributable to owners of the Parent 1,179,698 921,198 982,748 Non-controlling interests 24,314 4,525 4,245
Total equity 1,204,012 925,723 986,993
LIABILITIES Non-current liabilities Borrowings 1,285,721 1,209,269 1,314,386 Derivative financial instruments 1,083 16,177 92 Deferred income tax liabilities 75,060 26,892 30,533 Post employment benefit obligations 12 (79) 15,053 10,230 Provisions for liabilities and charges 220,531 36,213 29,016 Deferred and contingent acquisition consideration 40,319 40,285 40,149 Government grants 1,098 1,461 1,272
1,623,733 1,345,350 1,425,678
Current liabilities Trade and other payables 1,383,587 1,287,277 1,312,136 Current income tax liabilities 27,952 25,057 16,095 Borrowings 199,657 218,222 149,472 Derivative financial instruments 18,891 7,992 7,902 Provisions for liabilities and charges 24,799 5,335 8,096 Deferred and contingent acquisition consideration 334,476 10,389 3,235
1,989,362 1,554,272 1,496,936 Liabilities associated with assets classified as held for sale - 31,530 8,216
1,989,362 1,585,802 1,505,152
Total liabilities 3,613,095 2,931,152 2,930,830
Total equity and liabilities 4,817,107 3,856,875 3,917,823
Net cash/(debt) included above (including cash attributable to assets held for sale)
11
153,429
(272,828)
29,987

17
Group Statement of Changes in Equity
For the six months ended 30 September 2015 Attributable to owners of the Parent
Other Non- Share Share Retained reserves controlling Total capital premium earnings (note 10) Total interests equity £’000 £’000 £’000 £’000 £’000 £’000 £’000 At 1 April 2015 14,688 83,032 849,119 35,909 982,748 4,245 986,993 Profit for the period - - 41,270 - 41,270 932 42,202 Currency translation - - - 6,361 6,361 595 6,956 Group defined benefit pension obligations: - remeasurements - - 8,041 - 8,041 - 8,041 - movement in deferred tax asset - - (1,132) - (1,132) - (1,132) Movements relating to cash flow hedges - - - (3,881) (3,881) - (3,881) Movement in deferred tax liability on cash flow hedges - - - 1,337 1,337 - 1,337
Total comprehensive income - - 48,179 3,817 51,996 1,527 53,523 Issue of share capital (net of expenses) 755 191,307 - - 192,062 - 192,062 Re-issue of treasury shares - - 1,922 - 1,922 - 1,922 Share based payment - - - 867 867 - 867 Dividends - - (49,897) - (49,897) - (49,897) Non-controlling interests arising on acquisition - - - - - 18,542 18,542
At 30 September 2015 15,443 274,339 849,323 40,593 1,179,698 24,314 1,204,012
For the six months ended 30 September 2014 Attributable to owners of the Parent
Other Non- Share Share Retained reserves controlling Total capital premium earnings (note 10) Total interests equity £’000 £’000 £’000 £’000 £’000 £’000 £’000 At 1 April 2014 14,688 83,032 786,158 57,540 941,418 4,837 946,255 Profit for the period - - 42,310 - 42,310 (15) 42,295 Currency translation - - - (7,606) (7,606) (297) (7,903) Group defined benefit pension obligations: - remeasurements - - (12,129) - (12,129) - (12,129) - movement in deferred tax asset - - 1,443 - 1,443 - 1,443 Movements relating to cash flow hedges - - - (4,004) (4,004) - (4,004) Movement in deferred tax liability on cash flow hedges - - - 20 20 - 20
Total comprehensive income - - 31,624 (11,590) 20,034 (312) 19,722 Re-issue of treasury shares - - 1,717 - 1,717 - 1,717 Share based payment - - - 1,019 1,019 - 1,019 Dividends - - (42,990) - (42,990) - (42,990)
At 30 September 2014 14,688 83,032 776,509 46,969 921,198 4,525 925,723
For the year ended 31 March 2015 Attributable to owners of the Parent
Other Non- Share Share Retained reserves controlling Total capital premium earnings (note 10) Total interests equity £’000 £’000 £’000 £’000 £’000 £’000 £’000 At 1 April 2014 14,688 83,032 786,158 57,540 941,418 4,837 946,255 Profit for the financial year - - 144,427 - 144,427 (3) 144,424 Currency translation: - arising in the year - - - (14,418) (14,418) (589) (15,007) - recycled to the Income Statement on disposal - - - (2,721) (2,721) - (2,721) Group defined benefit pension obligations: - remeasurements - - (19,302) - (19,302) - (19,302) - movement in deferred tax asset - - 2,187 - 2,187 - 2,187 Movements relating to cash flow hedges - - - (6,942) (6,942) - (6,942) Movement in deferred tax liability on cash flow hedges - - - 324 324 - 324
Total comprehensive income - - 127,312 (23,757) 103,555 (592) 102,963 Re-issue of treasury shares - - 1,699 - 1,699 - 1,699 Share based payment - - - 2,126 2,126 - 2,126 Dividends - - (66,050) - (66,050) - (66,050)
At 31 March 2015 14,688 83,032 849,119 35,909 982,748 4,245 986,993

18
Group Cash Flow Statement Unaudited Unaudited Audited 6 months 6 months year ended ended ended 30 Sept. 30 Sept. 31 March 2015 2014 2015
£’000 £’000 £’000 Cash flows from operating activities Profit for the period 42,202 42,295 144,424 Add back non-operating expenses/(income) - tax 10,269 5,173 18,881 - share of equity accounted investments’ profit (279) (401) (489) - net operating exceptionals 5,863 252 8,725 - net finance costs 18,448 12,915 31,313
Group operating profit before exceptionals 76,503 60,234 202,854 Share-based payments expense 867 1,019 2,126 Depreciation 32,534 30,222 59,710 Amortisation of intangible assets 11,884 13,009 25,345 Loss/(profit) on disposal of property, plant and equipment 208 (643) (3,256) Amortisation of government grants (176) (179) (358) Other 3,346 (3,342) (11,159) (Increase)/decrease in working capital (4,427) (82,462) 102,556
Cash generated from operations before exceptionals 120,739 17,858 377,818 Exceptionals (10,386) (3,631) (16,454)
Cash generated from operations 110,353 14,227 361,364 Interest paid (31,348) (27,513) (59,678) Income tax paid (15,927) (13,066) (32,361)
Net cash flows from operating activities 63,078 (26,352) 269,325
Investing activities Inflows: Proceeds from disposal of property, plant and equipment 3,439 3,249 16,054 Government grants received - 52 52 Dividends received from equity accounted investments - 647 828 Disposal of subsidiaries and equity accounted investments 2,296 - 55,090 Interest received 17,479 14,383 31,222
23,214 18,331 103,246
Outflows: Purchase of property, plant and equipment (54,695) (39,588) (79,401) Acquisition of subsidiaries (134,744) (91,448) (101,738) Net cash/(debt) acquired on acquisition of subsidiaries 91,429 (5,812) (5,485) Deferred and contingent acquisition consideration paid (1,059) (8,215) (16,326)
(99,069) (145,063) (202,950)
Net cash flows from investing activities (75,855) (126,732) (99,704)
Financing activities Inflows: Proceeds from issue of shares 193,984 1,717 1,699 Increase in interest-bearing loans and borrowings - 448,989 448,989 Increase in finance lease liabilities 68 - -
194,052 450,706 450,688
Outflows: Repayment of interest-bearing loans and borrowings - (124,305) (169,631) Repayment of finance lease liabilities (83) (551) (486) Net cash outflow on derivative financial instruments - (13,869) (9,832) Dividends paid to owners of the Parent (49,897) (42,990) (66,050)
(49,980) (181,715) (245,999)
Net cash flows from financing activities 144,072 268,991 204,689
Change in cash and cash equivalents 131,295 115,907 374,310 Translation adjustment 13,322 (26,222) (58,206) Cash and cash equivalents at beginning of period 1,129,665 813,561 813,561
Cash and cash equivalents at end of period 1,274,282 903,246 1,129,665
Cash and cash equivalents consists of: Cash and short term bank deposits 1,458,748 1,075,909 1,260,942 Overdrafts (184,466) (174,130) (133,629) Cash and short term deposits attributable to assets held for sale - 1,467 2,352
1,274,282 903,246 1,129,665

19
Notes to the Condensed Financial Statements for the six months ended 30 September 2015
1. Basis of Preparation The Group condensed interim financial statements which should be read in conjunction with the annual financial statements for the year ended 31 March 2015 have been prepared in accordance with the Transparency (Directive 2004/109/EC) Regulations 2007, the related Transparency rules of the Irish Financial Services Regulatory Authority and in accordance with International Accounting Standard 34, Interim Financial Reporting (IAS 34) as adopted by the EU. The preparation of the interim financial statements requires management to make judgements, estimates and assumptions that affect the application of policies and reported amounts of certain assets, liabilities, revenues and expenses together with disclosure of contingent assets and liabilities. Estimates and underlying assumptions are reviewed on an ongoing basis. These condensed interim financial statements for the six months ended 30 September 2015 and the comparative figures for the six months ended 30 September 2014 are unaudited and have not been reviewed by the Auditors. The summary financial statements for the year ended 31 March 2015 represent an abbreviated version of the Group’s full accounts for that year, on which the Auditors issued an unqualified audit report and which have been filed with the Registrar of Companies.
2. Accounting Policies
The accounting policies and methods of computation adopted in the preparation of the Group condensed interim financial statements are consistent with those applied in the Annual Report for the financial year ended 31 March 2015 and are described in those financial statements on pages 123 to 132. The Group has adopted the following amendments to existing standards during the period which did not result in a material change to the Group’s consolidated financial statements:
IAS 19 Defined Benefit Plans: Employee Contributions;
Annual Improvements 2010-2012 Cycle; and
Annual Improvements 2011-2013 Cycle.
There were a number of other amendments to existing standards which became effective for the Group for the first time from 1 April 2015. None of these had a material impact on the Group.
3. Going Concern Having reassessed the principal risks facing the Group (as detailed on pages 12 to 15 of the Annual Report for the year ended 31 March 2015), the Directors believe that the Group is well placed to manage these risks successfully. The Directors have a reasonable expectation that the Group has adequate resources to continue in operational existence for the foreseeable future, a period of not less than twelve months from the date of this report. For this reason, the Directors continue to adopt the going concern basis of accounting in preparing the condensed interim financial statements.
20
Notes to the Condensed Financial Statements
for the six months ended 30 September 2015
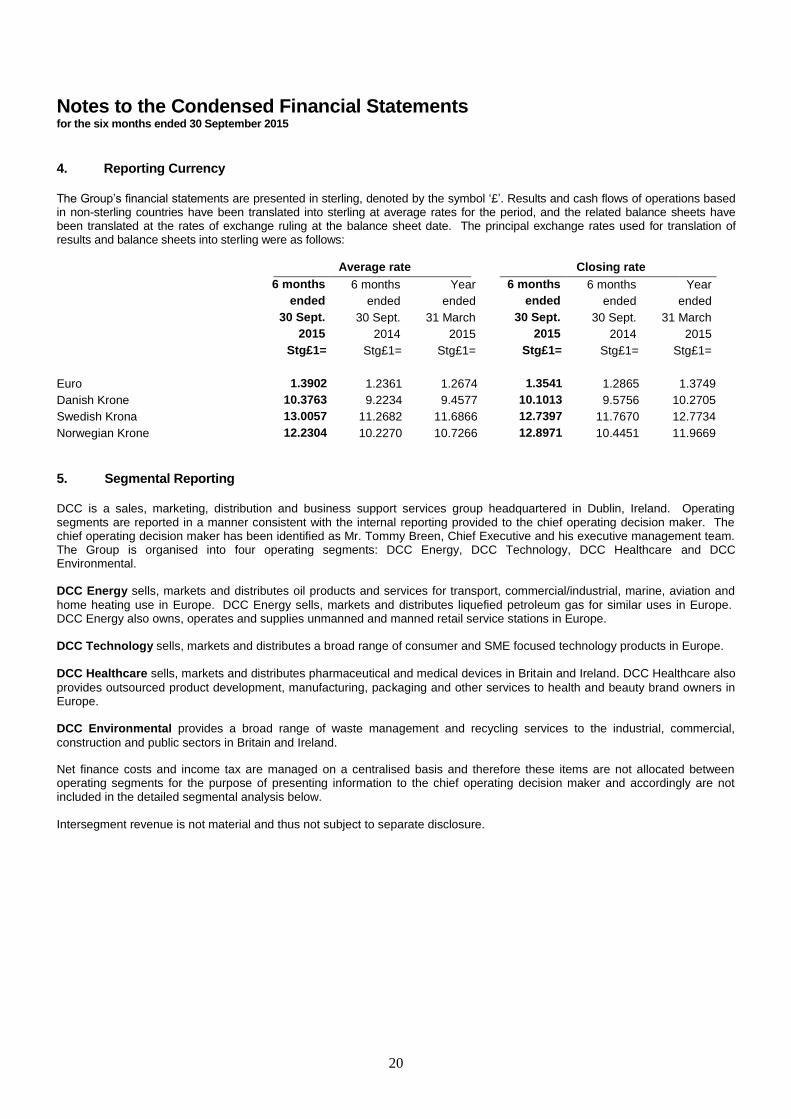
4. Reporting Currency The Group’s financial statements are presented in sterling, denoted by the symbol ‘£’. Results and cash flows of operations based in non-sterling countries have been translated into sterling at average rates for the period, and the related balance sheets have been translated at the rates of exchange ruling at the balance sheet date. The principal exchange rates used for translation of results and balance sheets into sterling were as follows: Average rate Closing rate
6 months 6 months Year 6 months 6 months Year
ended ended ended ended ended ended
30 Sept. 30 Sept. 31 March 30 Sept. 30 Sept. 31 March
2015 2014 2015 2015 2014 2015
Stg£1= Stg£1= Stg£1= Stg£1= Stg£1= Stg£1=
Euro 1.3902 1.2361 1.2674 1.3541 1.2865 1.3749
Danish Krone 10.3763 9.2234 9.4577 10.1013 9.5756 10.2705
Swedish Krona 13.0057 11.2682 11.6866 12.7397 11.7670 12.7734
Norwegian Krone 12.2304 10.2270 10.7266 12.8971 10.4451 11.9669
5. Segmental Reporting DCC is a sales, marketing, distribution and business support services group headquartered in Dublin, Ireland. Operating segments are reported in a manner consistent with the internal reporting provided to the chief operating decision maker. The chief operating decision maker has been identified as Mr. Tommy Breen, Chief Executive and his executive management team. The Group is organised into four operating segments: DCC Energy, DCC Technology, DCC Healthcare and DCC Environmental. DCC Energy sells, markets and distributes oil products and services for transport, commercial/industrial, marine, aviation and
home heating use in Europe. DCC Energy sells, markets and distributes liquefied petroleum gas for similar uses in Europe. DCC Energy also owns, operates and supplies unmanned and manned retail service stations in Europe. DCC Technology sells, markets and distributes a broad range of consumer and SME focused technology products in Europe.
DCC Healthcare sells, markets and distributes pharmaceutical and medical devices in Britain and Ireland. DCC Healthcare also
provides outsourced product development, manufacturing, packaging and other services to health and beauty brand owners in Europe. DCC Environmental provides a broad range of waste management and recycling services to the industrial, commercial,
construction and public sectors in Britain and Ireland.
Net finance costs and income tax are managed on a centralised basis and therefore these items are not allocated between operating segments for the purpose of presenting information to the chief operating decision maker and accordingly are not included in the detailed segmental analysis below. Intersegment revenue is not material and thus not subject to separate disclosure.

21
Notes to the Condensed Financial Statements
for the six months ended 30 September 2015
5. Segmental Reporting (continued)
An analysis of the Group’s performance by segment and geographic location is as follows: (a) By operating segment
Unaudited six months ended 30 September 2015
DCC DCC DCC DCC Energy Technology Healthcare Environmental Total
£’000 £’000 £’000 £’000 £’000
Segment revenue 3,659,729 1,089,055 239,120 78,336 5,066,240
Operating profit* 52,885 8,570 18,465 8,467 88,387
Amortisation of intangible assets (7,246) (1,092) (3,307) (239) (11,884)
Net operating exceptionals (note 6) (6,221) (2,503) 3,586 (725) (5,863)
Operating profit 39,418 4,975 18,744 7,503 70,640
Unaudited six months ended 30 September 2014 (restated)
DCC DCC DCC DCC Energy Technology Healthcare Environmental Total £’000 £’000 £’000 £’000 £’000 Segment revenue 4,076,971 1,037,877 236,922 73,562 5,425,332
Operating profit* 31,934 15,204 15,902 7,058 70,098 Amortisation of intangible assets (7,450) (1,402) (3,074) (394) (12,320) Net operating exceptionals (note 6) (1,788) (965) 308 (31) (2,476)
Operating profit 22,696 12,837 13,136 6,633 55,302
Audited year ended 31 March 2015
DCC DCC DCC DCC Energy Technology Healthcare Environmental Total £’000 £’000 £’000 £’000 £’000
Segment revenue 7,624,082 2,350,284 488,114 143,600 10,606,080
Operating profit* 119,392 49,341 39,689 13,294 221,716 Amortisation of intangible assets (14,334) (2,794) (6,143) (786) (24,057) Net operating exceptionals (note 6) (7,137) (11,101) (1,161) (405) (19,804)
Operating profit 97,921 35,446 32,385 12,103 177,855
* Operating profit before amortisation of intangible assets and net operating exceptionals

22
Notes to the Condensed Financial Statements
for the six months ended 30 September 2015
5. Segmental Reporting (continued)
(b) By geography
Unaudited six months ended 30 September 2015
Republic of Rest of UK France Ireland the World Total
£’000 £’000 £’000 £’000 £’000
Segment revenue 3,537,671 485,229 318,768 724,572 5,066,240
Operating profit* 59,610 11,180 3,762 13,835 88,387
Amortisation of intangible assets (7,095) (1,095) (551) (3,143) (11,884)
Net operating exceptionals (note 6) 477 (3,515) (1,648) (1,177) (5,863)
Operating profit 52,992 6,570 1,563 9,515 70,640
Unaudited six months ended 30 September 2014 (restated)
Republic of Rest of UK France Ireland the World Total £’000 £’000 £’000 £’000 £’000 Segment revenue 4,086,447 95,802 327,627 915,456 5,425,332
Operating profit* 56,490 999 1,105 11,504 70,098 Amortisation of intangible assets (7,784) (231) (590) (3,715) (12,320) Net operating exceptionals (note 6) (1,482) (309) (344) (341) (2,476)
Operating profit 47,224 459 171 7,448 55,302
Audited year ended 31 March 2015
Republic of Rest of UK France Ireland the World Total £’000 £’000 £’000 £’000 £’000 Segment revenue 8,023,403 210,275 717,077 1,655,325 10,606,080
Operating profit* 170,014 4,246 17,671 29,785 221,716 Amortisation of intangible assets (15,200) (451) (1,164) (7,242) (24,057) Net operating exceptionals (note 6) (12,822) (1,731) (5,222) (29) (19,804)
Operating profit 141,992 2,064 11,285 22,514 177,855
* Operating profit before amortisation of intangible assets and net operating exceptionals

23
Notes to the Condensed Financial Statements
for the six months ended 30 September 2015
6. Exceptionals Restated Unaudited Unaudited Audited 6 months 6 months year ended ended ended 30 Sept. 30 Sept. 31 March 2015 2014 2015 £’000 £’000 £’000 Restructuring costs (6,458) (1,227) (15,027) Impairment of goodwill - - (5,637) Acquisition and related costs (4,633) (2,174) (3,396) Impairment of property, plant and equipment - - (1,508) Adjustments to deferred and contingent acquisition consideration - 202 415 Gain arising from the Pihsiang legal claim 5,201 - 894 Restructuring of Group defined benefit pension schemes - - 6,381 Legal and other operating exceptional items 27 723 (1,926)
Net operating exceptional items (5,863) (2,476) (19,804) Mark to market of swaps and related debt (3,819) 471 (2,191)
Net exceptional items before taxation (9,682) (2,005) (21,995) Tax on the Pihsiang legal claim (1,037) - -
Net exceptional items after taxation (continuing operations) (10,719) (2,005) (21,995) Net profit on disposal of Food & Beverage division - - 8,214 Other net exceptional items relating to discontinued operations - 2,224 2,865
Net exceptional items (10,719) 219 (10,916)
The analysis of the net operating exceptional items is as follows:
Unaudited Unaudited Audited 6 months 6 months year ended ended ended 30 Sept. 30 Sept. 31 March 2015 2014 2015 £’000 £’000 £’000 Exceptional operating income 5,291 1,159 3,798 Exceptional operating expense (11,154) (3,635) (23,602)
(5,863) (2,476) (19,804)
The Group incurred a net exceptional charge after tax of £10.719 million in the first six months of the year. The net charge principally reflects acquisition and restructuring costs and an IAS 39 charge, offset by a receipt in respect of the Pihsiang legal claim where there was a final cash recovery. Acquisition costs include the professional and tax costs (such as stamp duty) relating to the evaluation and completion of acquisition opportunities. During the six month period, acquisition related costs amounted to £4.633 million and restructuring costs amounted to £6.458 million. Most of the Group’s debt has been raised in the US Private Placement market and swapped, using long term interest, currency and cross currency interest rate derivatives, to both fixed and floating rate sterling and euro. The level of ineffectiveness calculated under IAS 39 on the fair value and cash flow hedge relationships relating to fixed rate debt, together with gains or losses arising from marking to market swaps not designated as hedges, offset by foreign exchange translation gains or losses on the related fixed rate debt, is charged or credited as an exceptional item. In the six months ended 30 September 2015 this amounted to an exceptional charge of £3.819 million. There was a final net receipt of £4.164 million in relation to the Pihsiang legal claim.
24
Notes to the Condensed Financial Statements
for the six months ended 30 September 2015
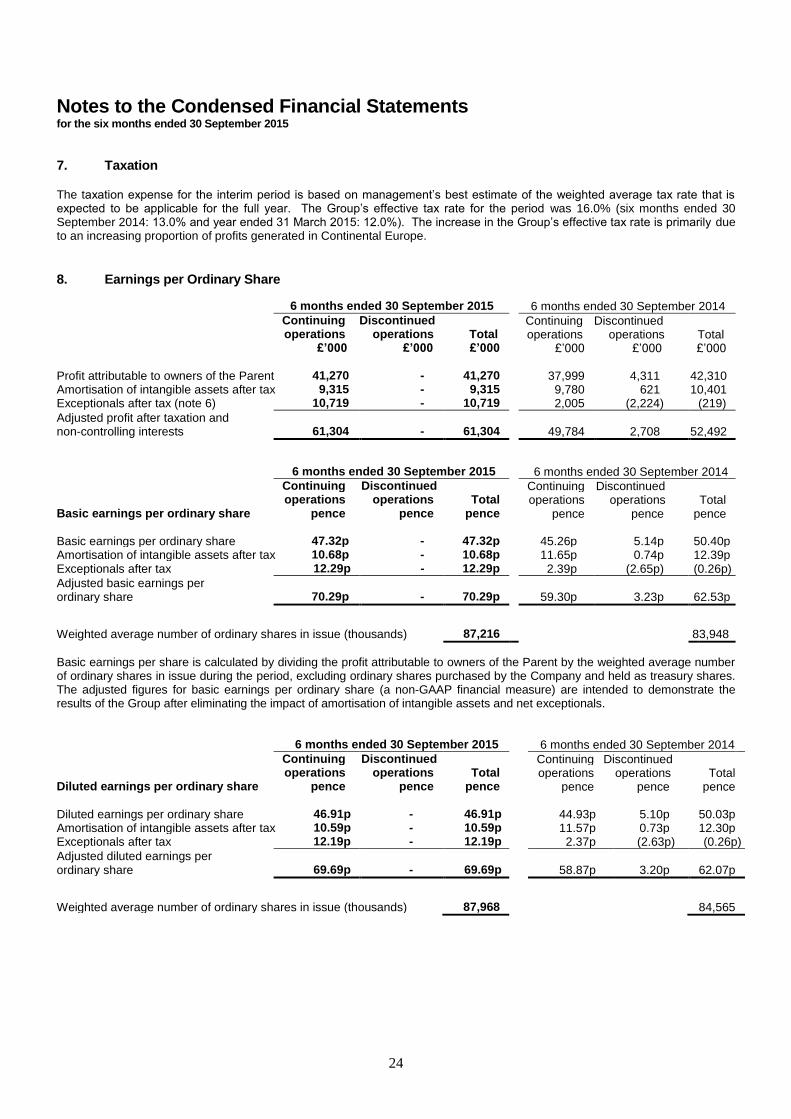
7. Taxation The taxation expense for the interim period is based on management’s best estimate of the weighted average tax rate that is expected to be applicable for the full year. The Group’s effective tax rate for the period was 16.0% (six months ended 30 September 2014: 13.0% and year ended 31 March 2015: 12.0%). The increase in the Group’s effective tax rate is primarily due to an increasing proportion of profits generated in Continental Europe.
8. Earnings per Ordinary Share
6 months ended 30 September 2015 6 months ended 30 September 2014
Continuing Discontinued Continuing Discontinued operations operations Total operations operations Total £’000 £’000 £’000 £’000 £’000 £’000 Profit attributable to owners of the Parent 41,270 - 41,270 37,999 4,311 42,310 Amortisation of intangible assets after tax 9,315 - 9,315 9,780 621 10,401 Exceptionals after tax (note 6) 10,719 - 10,719 2,005 (2,224) (219)
Adjusted profit after taxation and non-controlling interests
61,304
-
61,304
49,784 2,708 52,492
6 months ended 30 September 2015 6 months ended 30 September 2014 Continuing Discontinued Continuing Discontinued operations operations Total operations operations Total Basic earnings per ordinary share pence pence pence pence pence pence Basic earnings per ordinary share 47.32p - 47.32p 45.26p 5.14p 50.40p Amortisation of intangible assets after tax 10.68p - 10.68p 11.65p 0.74p 12.39p Exceptionals after tax 12.29p - 12.29p 2.39p (2.65p) (0.26p)
Adjusted basic earnings per ordinary share
70.29p
-
70.29p
59.30p 3.23p 62.53p
Weighted average number of ordinary shares in issue (thousands) 87,216 83,948
Basic earnings per share is calculated by dividing the profit attributable to owners of the Parent by the weighted average number of ordinary shares in issue during the period, excluding ordinary shares purchased by the Company and held as treasury shares. The adjusted figures for basic earnings per ordinary share (a non-GAAP financial measure) are intended to demonstrate the results of the Group after eliminating the impact of amortisation of intangible assets and net exceptionals. 6 months ended 30 September 2015 6 months ended 30 September 2014
Continuing Discontinued Continuing Discontinued operations operations Total operations operations Total Diluted earnings per ordinary share pence pence pence pence pence pence Diluted earnings per ordinary share 46.91p - 46.91p 44.93p 5.10p 50.03p Amortisation of intangible assets after tax 10.59p - 10.59p 11.57p 0.73p 12.30p Exceptionals after tax 12.19p - 12.19p 2.37p (2.63p) (0.26p)
Adjusted diluted earnings per ordinary share
69.69p
-
69.69p
58.87p 3.20p 62.07p
Weighted average number of ordinary shares in issue (thousands) 87,968 84,565

25
Notes to the Condensed Financial Statements
for the six months ended 30 September 2015
8. Earnings per Ordinary Share (continued)
Diluted earnings per share is calculated by adjusting the weighted average number of ordinary shares outstanding to assume conversion of all dilutive potential ordinary shares. Share options and awards are the Company’s only category of dilutive potential ordinary shares. Employee share options and awards, which are performance-based, are treated as contingently issuable shares because their issue is contingent upon satisfaction of specified performance conditions in addition to the passage of time. These contingently issuable shares are excluded from the computation of diluted earnings per ordinary share where the conditions governing exercisability have not been satisfied as at the end of the reporting period. The adjusted figures for diluted earnings per ordinary share are intended to demonstrate the results of the Group after eliminating the impact of amortisation of intangible assets and net exceptionals. The weighted average number of ordinary shares used in calculating the diluted earnings per share for the six months ended 30 September 2015 was 87.968 million (six months ended 30 September 2014: 84.565 million). A reconciliation of the weighted average number of ordinary shares used for the purposes of calculating the diluted earnings per share amounts is as follows: Unaudited Unaudited 6 months 6 months ended ended 30 Sept. 30 Sept. 2015 2014 ‘000 ‘000 Weighted average number of ordinary shares in issue 87,216 83,948 Dilutive effect of options and awards 752 617
Weighted average number of ordinary shares for diluted earnings per share 87,968 84,565
9. Dividends Unaudited Unaudited Audited 6 months 6 months year ended ended ended 30 Sept. 30 Sept. 31 March
2015 2014 2015 £’000 £’000 £’000 Interim - paid 28.73 pence per share on 28 November 2014 - - 24,123 Final - paid 55.81 pence per share on 23 July 2015 (paid 50.73 pence per share on 24 July 2014)
49,897
42,990
41,927
49,897
42,990
66,050
On 9 November 2015, the Board approved an interim dividend of 33.04 pence per share (£29.220 million). These condensed interim financial statements do not reflect this dividend payable.

26
Notes to the Condensed Financial Statements
for the six months ended 30 September 2015
10. Other Reserves For the six months ended 30 September 2015
Foreign
Share based Cash flow currency
payment hedge translation Other
reserve reserve reserve reserves Total
£’000 £’000 £’000 £’000 £’000
At 1 April 2015 12,756 (10,462) 32,683 932 35,909
Currency translation - - 6,361 - 6,361
Movements relating to cash flow hedges - (3,881) - - (3,881) Movement in deferred tax liability on cash flow hedges - 1,337 - - 1,337
Share based payment 867 - - - 867
At 30 September 2015 13,623 (13,006) 39,044 932 40,593
For the six months ended 30 September 2014 Foreign Share based Cash flow currency payment hedge translation Other reserve reserve reserve reserves Total £’000 £’000 £’000 £’000 £’000 At 1 April 2014 10,630 (3,844) 49,822 932 57,540 Currency translation - - (7,606) - (7,606) Movements relating to cash flow hedges - (4,004) - - (4,004) Movement in deferred tax liability on cash flow hedges - 20 - - 20 Share based payment 1,019 - - - 1,019
At 30 September 2014 11,649 (7,828) 42,216 932 46,969
For the year ended 31 March 2015 Foreign Share based Cash flow currency payment hedge translation Other reserve reserve reserve reserves Total £’000 £’000 £’000 £’000 £’000 At 1 April 2014 10,630 (3,844) 49,822 932 57,540 Currency translation - arising in the year - - (14,418) - (14,418) - recycled to the Income Statement on disposal of subsidiary
-
-
(2,721)
-
(2,721)
Movements relating to cash flow hedges - (6,942) - - (6,942) Movement in deferred tax liability on cash flow hedges - 324 - - 324 Share based payment 2,126 - - - 2,126
At 31 March 2015 12,756 (10,462) 32,683 932 35,909

27
Notes to the Condensed Financial Statements
for the six months ended 30 September 2015
11. Analysis of Net Cash/(Debt) Unaudited Unaudited Audited 30 Sept. 30 Sept. 31 March 2015 2014 2015
£’000 £’000 £’000 Non-current assets: Derivative financial instruments 194,133 95,709 233,150
Current assets: Derivative financial instruments 5,900 5,747 5,395 Cash and cash equivalents 1,458,748 1,075,909 1,260,942
1,464,648 1,081,656 1,266,337
Non-current liabilities: Finance leases (199) (205) (213) Derivative financial instruments (1,083) (16,177) (92) Unsecured Notes (1,285,522) (1,209,064) (1,314,173)
(1,286,804) (1,225,446) (1,314,478)
Current liabilities: Bank borrowings (184,466) (174,130) (133,629) Finance leases (358) (344) (357) Derivative financial instruments (18,891) (7,992) (7,902) Unsecured Notes (14,833) (43,748) (15,486)
(218,548) (226,214) (157,374)
Net cash/(debt) excluding cash attributable to assets held for sale
153,429
(274,295)
27,635
Cash and short term deposits attributable to assets held for sale
-
1,467
2,352
Net cash/(debt) including cash attributable to assets held for sale
153,429
(272,828)
29,987
12. Post Employment Benefit Obligations The Group’s defined benefit pension schemes’ assets were measured at fair value at 30 September 2015. The defined benefit pension schemes’ liabilities at 30 September 2015 were updated to reflect material movements in underlying assumptions. The net deficit on the Group’s post employment benefit obligations decreased from £10.230 million at 31 March 2015 to a net asset position of £79,000 at 30 September 2015. The decrease in the deficit was primarily driven by an actuarial gain on liabilities which arose from an increase in the discount rate used to value these liabilities together with contributions in excess of the current service cost. The following actuarial assumptions have been made in determining the Group’s retirement benefit obligation for the six months ended 30 September 2015: Unaudited Unaudited Audited 6 months 6 months year ended ended ended 30 Sept. 30 Sept. 31 March 2015 2014 2015 Discount rate
- Republic of Ireland 2.50% 2.50% 1.50% - UK 4.00% 4.00% 3.35%

28
Notes to the Condensed Financial Statements
for the six months ended 30 September 2015
13. Business Combinations A key strategy of the Group is to create and sustain market leadership positions through acquisitions in markets it currently operates in, together with extending the Group’s footprint into new geographic markets. In line with this strategy, the principal acquisitions completed by the Group during the period, together with percentages acquired, were as follows:
the acquisition in May 2015 of 100% of Computers Unlimited, a consumer technology distributor operating primarily in the UK but also with operations in France and Spain;
the acquisition of 100% of the assets that comprise Esso’s unmanned and motorway retail petrol station network in France (‘Esso Retail France’), completed in June 2015;
the combination of the Group’s Danish oil distribution business with the fuel distribution activities of DLG, a leading Danish agricultural business. The transaction, which completed in July 2015, resulted in DCC Energy owning 60% of the enlarged business;
the consideration for the acquisition of 100% of Butagaz S.A.S. (‘Butagaz’), a leading liquefied petroleum gas business in France, was paid on 2 November 2015.
The carrying amounts of the assets and liabilities acquired (excluding net cash/debt acquired), determined in accordance with IFRS before completion of the business combinations, together with the fair value adjustments made to those carrying values were as follows: Esso Retail
Butagaz France Others Total 2015 2015 2015 2015 £’000 £’000 £’000 £’000 Assets Non-current assets Property, plant and equipment 160,146 70,862 4,735 235,743 Intangible assets - other intangible assets 99,466 10,664 10,323 120,453 Deferred income tax assets 42 - - 42
Total non-current assets 259,654 81,526 15,058 356,238
Current assets Inventories 9,885 18,852 15,683 44,420 Trade and other receivables 68,694 1,193 19,009 88,896
Total current assets 78,579 20,045 34,692 133,316
Equity Non-controlling interests - - (18,542) (18,542)
Total equity - - (18,542) (18,542)
Liabilities
Non-current liabilities
Deferred income tax liabilities (37,797) (4,053) (2,591) (44,441) Provisions for liabilities and charges (172,557) (17,004) (78) (189,639)
Total non-current liabilities (210,354) (21,057) (2,669) (234,080)
Current liabilities Trade and other payables (53,078) (2,612) (19,675) (75,365) Provisions for liabilities and charges (18,328) - - (18,328) Current income tax liability (13,012) - (320) (13,332)
Total current liabilities (84,418) (2,612) (19,995) (107,025)
Identifiable net assets acquired 43,461 77,902 8,544 129,907 Intangible assets - goodwill 189,628 16,050 31,696 237,374
Total consideration 233,089 93,952 40,240 367,281
Satisfied by: Cash - 93,952 40,792 134,744 Cash and cash equivalents acquired (89,777) - (1,652) (91,429)
Net cash (inflow)/outflow (89,777) 93,952 39,140 43,315 Deferred acquisition consideration 322,866 - 1,100 323,966
Total consideration 233,089 93,952 40,240 367,281

29
Notes to the Condensed Financial Statements
for the six months ended 30 September 2015
13. Business Combinations (continued)
The acquisitions of Butagaz and Esso Retail France have been deemed to be substantial transactions and separate disclosure of the fair values of the identifiable assets and liabilities has therefore been made. None of the remaining business combinations completed during the period were considered sufficiently material to warrant separate disclosure of the fair values attributable to those combinations. The carrying amounts of the assets and liabilities acquired, determined in accordance with IFRS, before completion of the combination together with the adjustments made to those carrying values disclosed above were as follows:
Book Fair value Fair value adjustments value Butagaz £’000 £’000 £’000
Non-current assets (excluding goodwill) 291,519 (31,865) 259,654
Current assets 81,456 (2,877) 78,579
Non-current liabilities (249,552) 39,198 (210,354)
Current liabilities (84,418) - (84,418)
Identifiable net assets acquired 39,005 4,456 43,461
Goodwill arising on acquisition 194,084 (4,456) 189,628
Total consideration 233,089 - 233,089
Book Fair value Fair value adjustments value Esso Retail France £’000 £’000 £’000
Non-current assets (excluding goodwill) 70,862 10,664 81,526
Current assets 20,045 - 20,045
Non-current liabilities (17,004) (4,053) (21,057)
Current liabilities (2,612) - (2,612)
Identifiable net assets acquired 71,291 6,611 77,902
Goodwill arising on acquisition 22,661 (6,611) 16,050
Total consideration 93,952 - 93,952
Book Fair value Fair value adjustments value Others £’000 £’000 £’000
Non-current assets (excluding goodwill) 4,735 10,323 15,058
Current assets 34,692 - 34,692
Non-current liabilities and non-controlling interests (18,935) (2,276) (21,211)
Current liabilities (19,995) - (19,995)
Identifiable net assets acquired 497 8,047 8,544
Goodwill arising on acquisition 39,743 (8,047) 31,696
Total consideration 40,240 - 40,240
Book Fair value Fair value adjustments value Total £’000 £’000 £’000
Non-current assets (excluding goodwill) 367,116 (10,878) 356,238
Current assets 136,193 (2,877) 133,316
Non-current liabilities and non-controlling interests (285,491) 32,869 (252,622)
Current liabilities (107,025) - (107,025)
Identifiable net assets acquired 110,793 19,114 129,907
Goodwill arising on acquisition 256,488 (19,114) 237,374
Total consideration 367,281 - 367,281
30
Notes to the Condensed Financial Statements
for the six months ended 30 September 2015
13. Business Combinations (continued)
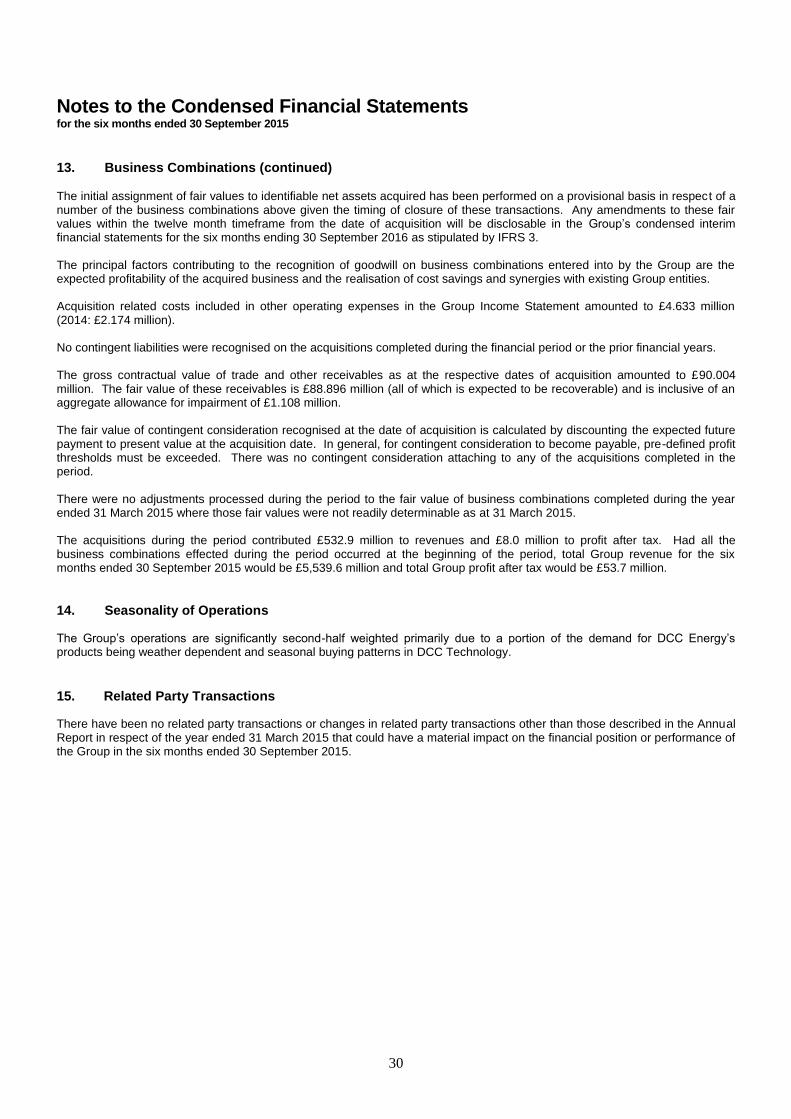
The initial assignment of fair values to identifiable net assets acquired has been performed on a provisional basis in respect of a number of the business combinations above given the timing of closure of these transactions. Any amendments to these fair values within the twelve month timeframe from the date of acquisition will be disclosable in the Group’s condensed interim financial statements for the six months ending 30 September 2016 as stipulated by IFRS 3. The principal factors contributing to the recognition of goodwill on business combinations entered into by the Group are the expected profitability of the acquired business and the realisation of cost savings and synergies with existing Group entities. Acquisition related costs included in other operating expenses in the Group Income Statement amounted to £4.633 million (2014: £2.174 million). No contingent liabilities were recognised on the acquisitions completed during the financial period or the prior financial years. The gross contractual value of trade and other receivables as at the respective dates of acquisition amounted to £90.004 million. The fair value of these receivables is £88.896 million (all of which is expected to be recoverable) and is inclusive of an aggregate allowance for impairment of £1.108 million. The fair value of contingent consideration recognised at the date of acquisition is calculated by discounting the expected future payment to present value at the acquisition date. In general, for contingent consideration to become payable, pre-defined profit thresholds must be exceeded. There was no contingent consideration attaching to any of the acquisitions completed in the period.
There were no adjustments processed during the period to the fair value of business combinations completed during the year ended 31 March 2015 where those fair values were not readily determinable as at 31 March 2015. The acquisitions during the period contributed £532.9 million to revenues and £8.0 million to profit after tax. Had all the business combinations effected during the period occurred at the beginning of the period, total Group revenue for the six months ended 30 September 2015 would be £5,539.6 million and total Group profit after tax would be £53.7 million.
14. Seasonality of Operations
The Group’s operations are significantly second-half weighted primarily due to a portion of the demand for DCC Energy’s products being weather dependent and seasonal buying patterns in DCC Technology.
15. Related Party Transactions
There have been no related party transactions or changes in related party transactions other than those described in the Annual Report in respect of the year ended 31 March 2015 that could have a material impact on the financial position or performance of the Group in the six months ended 30 September 2015.

31
Notes to the Condensed Financial Statements
for the six months ended 30 September 2015
16. Discontinued Operations
The Group’s discontinued operations for the six months ended 30 September 2014 and the year ended 31 March 2015 comprise the results of the Group’s former DCC Food & Beverage segment. The conditions for the businesses disposed of to be classified as discontinued operations were fulfilled in the second half of the year ended 31 March 2015 and, consequently, the results for the six months ended 30 September 2014 have been restated. The following table details the results of discontinued operations included in the Group Income Statement: Unaudited Audited 6 months year ended ended 30 Sept. 31 March 2014 2015 £‘000 £‘000 Revenue 89,024 143,360
Operating profit before amortisation of intangible assets and exceptional items 3,145 6,483 Amortisation of intangible assets (689) (1,288)
Operating profit before exceptional items 2,456 5,195 Net finance costs (116) (194) Share of equity accounted investments’ profit after tax 283 87
Profit before exceptional items and tax 2,623 5,088 Exceptional items 2,224 2,865 Profit on disposal of discontinued operations - 8,214
Profit before tax 4,847 16,167 Income tax expense (536) (404)
Profit from discontinued operations after tax 4,311 15,763
There were no discontinued operations in the six months ended 30 September 2015.
17. Events after the Balance Sheet Date CUC
In October 2015 DCC Technology further expanded its European footprint with its binding offer for the acquisition of CUC, a cabling and connectors distribution business headquartered near Paris. The initial assignment of fair values to identifiable net assets acquired has been performed on a provisional basis given the timing of closure of the transaction. The carrying amounts of the assets and liabilities acquired, determined in accordance with IFRS, before completion of the combination together with the adjustments made to those carrying values were as follows:
Fair value Book value adjustments Fair value £’000 £’000 £’000
Non-current assets (excluding goodwill) 432 2,542 2,974
Current assets 12,384 - 12,384
Non-current liabilities (72) (966) (1,038)
Current liabilities (4,392) - (4,392)
Identifiable net assets acquired 8,352 1,576 9,928
Goodwill arising on acquisition 7,848 (1,576) 6,272
Total consideration (enterprise value) 16,200 - 16,200
18. Board Approval
This report was approved by the Board of Directors of DCC plc on 9 November 2015.
19. Distribution of Interim Report
This report and further information on DCC is available at the Company’s website www.dcc.ie. A printed copy is available to the public at the Company’s registered office at DCC House, Leopardstown Road, Foxrock, Dublin 18, Ireland.

32
Statement of Directors’ Responsibilities We confirm that to the best of our knowledge: 1. the condensed set of interim financial statements have been prepared in accordance with IAS 34 Interim Financial Reporting
as adopted by the EU; 2. the interim management report includes a fair review of the information required by: Regulation 8(2) of the Transparency (Directive 2004/109/EC) Regulations 2007, being an indication of important events that have occurred during the first six months of the financial year and their impact on the condensed set of financial statements; and a description of the principal risks and uncertainties for the remaining six months of the year; and Regulation 8(3) of the Transparency (Directive 2004/109/EC) Regulations 2007, being related party transactions that have taken place in the first six months of the current financial year and that have materially affected the financial position or performance of the entity during that period; and any changes in the related party transactions described in the last annual report that could do so. On behalf of the Board John Moloney Tommy Breen Chairman Chief Executive 9 November 2015