Interim Report as of September 30, 2017 - Home – … Report as of September 30, 2017 Management...
112
Interim Report as of September 30, 2017
Transcript of Interim Report as of September 30, 2017 - Home – … Report as of September 30, 2017 Management...

Interim Report as of September 30, 2017

Deutsche Bank
The Group at a glanceNine months ended
Sep 30, 2017 Sep 30, 2016Key financial informationPost-tax return on average shareholders’ equity 3.5 % 1.0 %Post-tax return on average tangible shareholders’ equity 4.1 % 1.2 %Cost/income ratio1 85.4 % 89.1 %
Compensation ratio2 42.8 % 39.4 %Noncompensation ratio3 42.6 % 49.7 %
Total net revenues, in € m. 20,738 22,946Provision for credit losses, in € m. 396 891Total noninterest expenses, in € m. 17,708 20,450
Adjusted Costs 17,489 18,552Income (loss) before income taxes, in € m. 2,633 1,606Net income (loss), in € m. 1,689 534Basic earnings per share € 0.72 € 0.14Diluted earnings per share € 0.69 € 0.13Share price at period end € 14.63 € 10.33Share price high € 17.82 € 19.72Share price low € 13.11 € 8.83
Sep 30, 2017 Dec 31, 2016CRR/CRD 4 Leverage Ratio (fully loaded) 3.8 % 3.5 %CRR/CRD 4 Leverage Ratio (phase in) 4.2 % 4.1 %Fully loaded CRR/CRD 4 leverage exposure, in € bn. 1,420 1,348Common Equity Tier 1 capital ratio (fully loaded) 13.8 % 11.8 %Common Equity Tier 1 capital ratio (phase in) 14.6 % 13.4 %Risk-weighted assets, in € bn. 355 358Total assets, in € bn. 1,521 1,591Shareholders’ equity, in € bn. 66 60Book value per basic share outstanding € 31.37 € 38.14Tangible book value per basic share outstanding € 27.18 € 32.42Other InformationBranches 2,434 2,656
Thereof: in Germany 1,578 1,776Employees (full-time equivalent) 96,817 99,744
Thereof: in Germany 42,879 44,600Long-term non-preferred senior debt rating
Moody’s Investors Service Baa2 Baa2Standard & Poor’s BBB- BBB+Fitch Ratings BBB+ A-DBRS Ratings A (low) A (low)
1 Total noninterest expenses as a percentage of net interest income before provision for credit losses, plus noninterest income.2 Compensation and benefits as a percentage of total net interest income before provision for credit losses, plus noninterest income.3 Noncompensation noninterest expenses, which is defined as total noninterest expenses less compensation and benefits, as a percentage of total net interest income before
provision for credit losses, plus noninterest income.
Due to rounding, numbers presented throughout this document may not sum precisely to the totals provided and percentages may not precisely reflect the absolute figures.

Content Management Report
Operating and Financial Review – 2Economic Environment – 2Deutsche Bank Performance – 3Consolidated Results of Operations – 3Segment Results of Operations – 6Corporate Divisions – 8Financial Position – 15Related Party Transactions – 17Management and Supervisory Board – 17
Strategy – 18Outlook – 20
The Global Economy – 20The Banking Industry – 20The Deutsche Bank Group – 21Our Business Segments – 22
Risks and Opportunities – 24Risk Report – 26
Introduction – 26Risk and Capital Overview – 28Risk and Capital Performance – 31Leverage Ratio – 40Credit Risk Exposure – 42Asset Quality – 45Market Risk – 48Operational Risk – 50Liquidity Risk – 50
Consolidated Financial Statements
Consolidated Statement of Income – 53Consolidated Statement of Comprehensive Income – 54Consolidated Balance Sheet – 55Consolidated Statement of Changes in Equity – 56Consolidated Statement of Cash Flows – 58
Notes to the Consolidated Financial Statements
Basis of Preparation – 59Impact of Changes in Accounting Principles – 60Segment Information – 64Information on the Consolidated Income Statement – 66Information on the Consolidated Balance Sheet – 69Other Financial Information – 100
Confirmations
Review Report – 103
Other Information
Non-GAAP Financial Measures – 104Fully loaded CRR/CRD 4 Measures – 107Imprint – 109

2
Deutsche Bank 1 – Management ReportInterim Report as of September 30, 2017
Management Report
Operating and Financial Review
Economic Environment
The Global Economy
Economic growth (%)1 Sep 30, 20172 Jun 30, 2017 Main driverGlobal Economy 3.6 % 3.6 % Global economic growth and global trade remained strong. Leading indicators point
towards an ongoing positive growth environment in the third quarter of 2017.Thereof:Industrialized countries 2.1 % 2.0 % European economic growth has positively surprised in the first half of the year, a
trend which continued into the third quarter of 2017, and which together with lesspolitical uncertainty has lifted forecasts.
Emerging markets 4.7 % 4.7 % Emerging countries benefitted from a rebound in energy prices early this year whichboosted investments and global trade in the third quarter of 2017.
Eurozone Economy 2.2 % 1.8 % Several central European countries head towards full employment. The new Frenchgovernment has unleashed a reform process in France. The positive growth envi-ronment has continued well into the third quarter of 2017.
Thereof: German economy 1.9 % 1.6 % Very tight labor market, expansionary monetary policy and additional fiscal stimuliled to growth above trend.
U.S. Economy 2.1 % 2.4 % The robust labor market is close to full employment. Wage growth strengthenedfurther with positive impulses for private consumption. Investments started to risedue to an ongoing dynamic housing market and also higher equipment investment.
Japanese Economy 1.5 % 1.2 % Private capital investment benefits from the rebound in global trade. Monetary policyis still very loose.
Asian Economy3 6.0 % 6.1 % Strengthening intra-Asian trade is growth driver. Emerging Markets Asia remains theglobal powerhouse in terms of GDP growth.
Thereof: Chinese Economy 6.8 % 6.7 % Marginal growth slowdown expected as private credit growth is less expansive toavoid another rise of house prices.
1 Annual Real GDP Growth (% YoY). Sources: National Authorities unless stated otherwise.2 Sources: Deutsche Bank Research Forecasts.3 Including China, India, Indonesia, Republic of Korea, and Taiwan.
Banking Industry
Corporate lending activity in the eurozone faltered in the third quarter of 2017 and continued to stagnate, with outstanding vol-umes down 0.3 % year on year. By contrast, lending to households continued to pick up, with year on year growth of 2.7 %, thebest figure since 2011. This was primarily due to very healthy performance in the mortgage business which increased by 3.2 %year on year. Momentum also remained high for deposit growth with a total increase of 4.2 % for private-sector deposits.
In Germany, corporate lending continued to grow in the third quarter of 2017 and achieved its best result since the financialcrisis with an increase of 4.2 % year on year. Growth in lending to private households also remained robust at 3.2 %, thanks tosimilarly healthy mortgage lending. At 4.5 %, strong year on year growth in private-sector deposits continued unabated despitethe interest rates, which on average were negative for corporates and effectively zero for private clients.
In the U.S., private-sector lending experienced a sharp slowdown at the beginning of the year before stabilizing at a significantlylower rate of growth. Lending to households is currently up only 2.3 % year on year, while the figure for corporate lending in-cluding commercial real estate is 4.1 %. The growth rates had both been double this at the beginning of 2017. On the fundingside, growth in private-sector deposit volumes amounted to a solid 4.4 % year on year.
In Japan, lending saw a moderate increase over the past year and is currently up 3.2 % on the prior year figure. This is stilloutpaced by growth in deposits which increased by 4.7 % year on year. In China, lending continued to expand at an extraordi-nary pace, fuelling fears of a credit bubble. This was particularly true for private households, where lending volumes were up23 % on the prior year figure. Corporate lending activity gathered pace in recent months with an increase of 13 % year on yearand likewise expanded at a faster rate than deposits at banks, which at 9 % grew at roughly the same pace as nominal GDP.Borrowing in China's private sector has doubled in only five years, and at currently 211 % of GDP is higher than in industrializednations such as the U.S., UK, France and Germany.

3
Deutsche Bank Operating and Financial ReviewInterim Report as of September 30, 2017 Consolidated Results of Operations
Deutsche Bank PerformanceThe Bank’s income before income taxes in the third quarter of 2017 improved significantly compared to the respective prior yearquarter. Revenues declined resulting from subdued client activity combined with a persistently low interest rate environment.This was more than offset by lower noninterest expenses, reflecting cost management efforts and lower litigation-related charg-es, lower provision for credit losses, effects from disposals and the benefit from NCOU ceasing to exist from 2017 onwards.Both Capital and Leverage ratio improved significantly year over year following the capital increase of approximately € 8 billionin April 2017 and a decline in Risk-weighted assets.
The table below shows the Financial Key Performance Indicators (KPIs) of the Group for the first nine months: Sep 30, 2017 Sep 30, 2016
Net revenues € 20.7 bn € 22.9 bnIncome (loss) before income taxes € 2.6 bn € 1.6 bnNet income (loss) € 1.7 bn € 0.5 bnPost-tax return on average tangible shareholders’ equity1 4.1 % 1.2 %Post-tax return on average shareholder's equity1 3.5 % 1.0 %Adjusted costs2 € 17.5 bn € 18.6 bnCost/income ratio3 85.4 % 89.1 %CRR/CRD 4 Risk-weighted assets (RWA) (fully loaded) € 355.1 bn € 384.7 bnCRR/CRD 4 Common Equity Tier 1 ratio (fully loaded)4 13.8 % 11.1 %CRR/CRD 4 leverage ratio (phase in)5 4.2 % 4.1 %CRR/CRD 4 leverage ratio (fully loaded)5 3.8 % 3.5 %1 Based on Net Income attributable to Deutsche Bank shareholders and additional equity components. For further information, please refer to “Other Information: Non-GAAP
Financial Measures” of this Interim Report.2 Total noninterest expenses excluding impairment of goodwill and other intangible assets, litigation, policyholder benefits and claims and restructuring and severance. For
further information, please refer to “Other Information: Non-GAAP Financial Measures” of this Interim Report.3 Total noninterest expenses as a percentage of total net interest income before provision for credit losses plus noninterest income.4 The CRR/CRD 4 fully loaded Common Equity Tier 1 ratio represents our calculation of our Common Equity Tier 1 ratio without taking into account the transitional provisions of
CRR/CRD 4. Further detail on the calculation of this ratio is provided in the Risk Report.5 Further detail on the calculation of this ratio is provided in the Risk Report.
Consolidated Results of OperationsThree months ended Nine months ended
in € m.(unless stated otherwise) Sep 30, 2017 Sep 30, 2016
Absolute Change
Changein % Sep 30, 2017 Sep 30, 2016
Absolute Change
Changein %
Net revenues:Thereof:CIB 3,468 4,532 (1,064) (23) 11,494 13,493 (1,999) (15)PCB 2,602 2,520 82 3 7,865 7,885 (21) (0)Deutsche AM 628 821 (193) (24) 1,911 2,216 (306) (14)NCOU 0 (191) 191 N/M 0 (524) 524 N/MC&A 79 (190) 269 N/M (532) (124) (408) N/M
Total net revenues 6,776 7,493 (717) (10) 20,738 22,946 (2,209) (10)Provision for credit losses 184 327 (143) (44) 396 891 (495) (56)Noninterest expenses:Compensation and benefits 2,806 2,894 (88) (3) 8,874 9,047 (173) (2)General and administrative expenses 2,865 3,490 (625) (18) 8,789 10,447 (1,658) (16)Policyholder benefits and claims 0 167 (167) N/M 0 285 (285) N/MImpairment of goodwill and otherintangible assets 0 (49) 49 N/M 6 236 (230) (97)Restructuring activities (12) 45 (57) N/M 39 435 (396) (91)Total noninterest expenses 5,660 6,547 (888) (14) 17,708 20,450 (2,742) (13)Income (loss) before income taxes 933 619 314 51 2,633 1,606 1,028 64Income tax expense (benefit) 284 340 (56) (17) 944 1,071 (127) (12)Net income (loss) 649 278 371 133 1,689 534 1,155 N/MN/M – Not meaningful
2017 to 2016 Three Months Comparison
In the third quarter of 2017 revenues decreased primarily due to low volatility combined with subdued client activity and a per-sistently low interest rate environment partly offset by positive impacts from valuation and timing differences, the sale of sharesin Concardis GmbH and the closure of NCOU. The decrease in revenues was more than offset by a decrease in noninterestexpenses and lower provisions for credit losses.

4
Deutsche Bank 1 – Management ReportInterim Report as of September 30, 2017
Group net revenues in the third quarter of 2017 decreased by € 717 million, or 10 %, to € 6.8 billion. In CIB revenues declined,primarily due to subdued client activity resulting from a low volatility environment across all businesses as compared to the thirdquarter of 2016 which benefitted from higher client activity and market volatility in the aftermath of the UK referendum on Euro-pean Union membership. Net revenues in PCB were essentially flat and included the aforementioned positive impact from thesale of shares in Concardis GmbH and from workout activities in the Sal. Oppenheim franchise, which more than offset theimpacts from the sale of the Private Client Services (PCS) unit in the third quarter of 2016. Revenues in PCB continued to beimpacted by a low interest rate environment, partly offset by higher fee income. Deutsche AM revenues decreased mainly dueto the sale of Abbey Life in the fourth quarter of 2016, but were also impacted by lower Alternatives performance fees. Thedecline in revenues was partly offset by a non-recurring insurance recovery relating to a real estate fund recorded in the thirdquarter of 2017. Revenues in C&A increased driven by valuation and timing differences and included cumulative amortizationincome related to Group Cashflow hedging programs.
Provision for credit losses was € 184 million in the third quarter of 2017, a decrease of € 143 million, or 44 %, compared to thesame period in 2016. This reduction was primarily driven by CIB due to broad-based improved performance, though the ship-ping sector continued to prove challenging. Provision for credit losses also included an impact from changes in estimates relat-ed to the shipping portfolio in the third quarter of 2017.
Noninterest expenses were € 5.7 billion in the third quarter of 2017, a decrease of € 888 million, or 14 % as compared to thethird quarter of 2016. Compensation and benefits amounted to € 2.8 billion, down by € 88 million or 3 %. The impact of head-count reductions was partially offset by higher accruals for current year variable compensation, which were influenced by theplanned return to normal compensation programs after 2016 bonus payments were significantly limited. General and adminis-trative expenses were € 2.9 billion, down by € 625 million or 18 % compared to the third quarter of 2016, mainly due to lowerlitigation-related charges, the effects from disposals and the closure of NCOU, as well as lower professional service fees.Restructuring costs in the third quarter of 2017 were a credit of € 12 million as releases of unused provisions exceeded theadditions.
Income before income taxes was € 933 million in the third quarter of 2017, an increase of € 314 million or 51 % as compared tothe third quarter of 2016. The improvement is mainly attributable to lower noninterest expenses and lower provisions for creditlosses.
Net income in the third quarter of 2017 was € 649 million, compared to € 278 million in the third quarter of 2016. Income taxexpense in the current quarter was € 284 million versus € 340 million in the third quarter of 2016. The effective tax rate was30 % for the current quarter. The prior year’s quarter effective tax rate of 55 % was mainly impacted by non-tax deductiblelitigation charges.
2017 to 2016 Nine Months Comparison
The first nine months of 2017 benefitted from a decrease in noninterest expenses driven by lower litigation-related charges andlower restructuring and severance expenses, as well as lower provisions for credit losses. Partly offsetting were negative effectsrelated to debt valuation adjustments (DVA, which reflects the impact of the Group’s own credit risk in the fair value of derivativecontracts) and the valuation of own debt as well the impacts from a challenging market environment and lower interest rates.
Group net revenues in the first nine months of 2017 decreased by € 2.2 billion, or 10 % to € 20.7 billion. The decrease in reve-nues was primarily due to a negative swing of approximately € 930 million year-on-year, mainly resulting from a narrowing inDeutsche Bank’s credit spreads in the first nine months of 2017, compared with a widening of those credit spreads in the firstnine months of 2016, which impacted both derivative DVA and the bank’s own debt. Additionally, revenues in CIB were impact-ed by low client activity in a low volatility environment and by tightening margins. Net revenues in PCB were essentially flat.Gains from the sale of shares in Concardis GmbH and from workout activities in the Sal. Oppenheim franchise were largelyoffset by a negative impact from the low interest rate environment and the impact from the sale of PCS and VISA Europe Ltd. in2016. The decline in revenues in Deutsche AM, which was primarily due to the nonrecurrence of a one-off gain on the sale ofAsset Management India, a write-up relating to HETA Asset Resolution AG (HETA) recorded in 2016 and the nonrecurrence ofrevenues from Abbey Life due to its sale in the fourth quarter of 2016, were partly offset by a non-recurring insurance recoveryrelating to a real-estate fund recorded in the first nine months of 2017. Revenues in C&A decreased mainly due to realization ofcurrency translation adjustments related to certain Deutsche Bank subsidiaries, a loss recorded on the sale of our Argentinasubsidiary as well as a negative impact from additional liquidity related funding costs.

5
Deutsche Bank Operating and Financial ReviewInterim Report as of September 30, 2017 Consolidated Results of Operations
Provision for credit losses was € 396 million in the first nine months of 2017, a decrease of € 495 million, or 56 % compared tothe same period 2016. The decrease resulted primarily from reductions in CIB, due to broad-based improved credit perfor-mance, though the shipping sector continued to prove challenging. Provision for credit losses also included an impact fromchanges in estimates related to the shipping portfolio in the first nine months of 2017.
Noninterest expenses were € 17.7 billion in the first nine months of 2017, a decrease of € 2.7 billion, or 13 % as compared tothe first nine months of 2016. Compensation and benefits amounted to € 8.9 billion, down by € 173 million or 2 %. The impact ofheadcount reductions and lower severance cost was partially offset by higher accruals for current year variable compensation,which were influenced by the aforementioned return to normal compensation programs. General and administrative expenseswere € 8.8 billion, down by € 1.7 billion or 16 % compared to the first nine months of 2016, mainly due to lower litigation charges,the effects from disposals, the closure of NCOU and lower professional service fees. Significant additional charges related tolitigation and regulatory actions are possible in future periods depending on the development of these matters. Restructuringcosts were € 39 million, a decrease of € 396 million as compared to the first nine months of 2016. However, we expect addi-tional restructuring expenses to be incurred in the fourth quarter of 2017.
Income before income taxes was € 2.6 billion in the first nine months of 2017, an increase of € 1.0 billion or 64 % as comparedto the first nine months of 2016. The improvement is mainly attributable to lower noninterest expenses and lower provisions forcredit losses.
Net income in the first nine months of 2017 was € 1.7 billion, compared to € 534 million in the first nine months of 2016. Incometax expense in the first nine months of 2017 was € 944 million versus € 1.1 billion in the first nine months of 2016. The effectivetax rate was 36 % for the first nine months of 2017. In the first nine months of 2016 the effective tax rate of 67 % was mainlyimpacted by non-tax deductible goodwill impairment, litigation charges and tax effects related to share-based payments.

6
Deutsche Bank 1 – Management ReportInterim Report as of September 30, 2017
Segment Results of OperationsThe following tables present the results of the business segments, including the reconciliation to the consolidated results underIFRS, for the three and nine months ended September 30, 2017 and September 30, 2016. See the “Segment Information” noteto the consolidated financial statements for information regarding changes in the presentation of our segment disclosure.
Three months endedSep 30, 2017
in € m.(unless stated otherwise)
Corporate & Investment
Bank
Private & Commercial
Bank
DeutscheAsset
Management
Non-Core Operations
UnitConsolidation& Adjustments
Total Consolidated
Net revenues 3,468 2,602 628 - 79 6,776Provision for credit losses 94 90 (0) - 0 184Noninterest expenses:Compensation and benefits 912 986 184 - 723 2,806General and administrative expenses 2,103 1,197 250 - (686) 2,865Policyholder benefits and claims 0 0 0 - 0 0Impairment of goodwill and other intangible assets 0 0 0 - 0 0Restructuring activities (5) (5) (2) - (0) (12)Total noninterest expenses 3,011 2,179 433 - 37 5,660Noncontrolling interests 2 1 0 - (3) 0Income (loss) before income taxes 361 332 195 - 44 933Cost/income ratio (in %) 87 84 69 - N/M 84Assets 1,162,026 330,884 11,506 - 17,037 1,521,454Risk-weighted assets (CRD 4 - fully loaded) 241,820 88,656 9,528 - 15,108 355,113CRD 4 leverage exposure measure (spot value at reporting date) 1,049,576 342,146 3,300 - 25,236 1,420,258Average shareholders’ equity 45,938 15,057 4,774 - 0 65,769Post-tax return on average tangible shareholders’ equity (in %)1 2.3 6.8 49.3 - N/M 4.5Post-tax return on average shareholders’ equity (in %)1 2.1 5.9 10.9 - N/M 3.9N/M – Not meaningful1 The post-tax return on average tangible shareholders’ equity and average shareholders’ equity at the Group level reflects the reported effective tax rate for the Group, which
was 30 %. For the post-tax return on average tangible shareholders’ equity and average shareholders’ equity of the segments, the applied tax rate was 33 %.
Three months endedSep 30, 2016
in € m.(unless stated otherwise)
Corporate & Investment
Bank
Private & Commercial
Bank
DeutscheAsset
Management
Non-Core Operations
UnitConsolidation& Adjustments
Total Consolidated
Net revenues 4,532 2,520 821 (191) (190) 7,493Provision for credit losses 208 102 0 17 (0) 327Noninterest expenses:Compensation and benefits 962 1,018 174 13 727 2,894General and administrative expenses 2,330 1,232 253 367 (692) 3,490Policyholder benefits and claims 0 0 167 0 0 167Impairment of goodwill and other intangible assets 0 0 0 (49) 0 (49)Restructuring activities 40 (20) 12 0 12 45Total noninterest expenses 3,333 2,231 606 330 47 6,547Noncontrolling interests 22 0 0 (0) (22) 0Income (loss) before income taxes 969 187 215 (538) (215) 619Cost/income ratio (in %) 74 89 74 N/M N/M 87Assets 1,295,883 337,935 26,367 11,157 17,608 1,688,951Risk-weighted assets (CRD 4 - fully loaded) 246,138 93,495 13,273 17,768 14,027 384,701CRD 4 leverage exposure measure (spot value at reporting date) 970,214 349,038 4,323 15,189 15,484 1,354,248Average shareholders’ equity 40,001 14,375 5,953 1,679 0 62,008Post-tax return on average tangible shareholders’ equity (in %)1 6.8 3.9 52.7 N/M N/M 2.0Post-tax return on average shareholders’ equity (in %)1 6.3 3.4 9.5 N/M N/M 1.6N/M – Not meaningful1 The post-tax return on average tangible shareholders’ equity and average shareholders’ equity at the Group level reflects the reported effective tax rate for the Group, which
was 55 %. For the post-tax return on average tangible shareholders’ equity and average shareholders’ equity of the segments, the applied tax rate was 35 %.

7
Deutsche Bank Operating and Financial ReviewInterim Report as of September 30, 2017 Segment Results of Operations
Nine months endedSep 30, 2017
in € m.(unless stated otherwise)
Corporate & Investment
Bank
Private & Commercial
Bank
DeutscheAsset
Management
Non-Core Operations
UnitConsolidation& Adjustments
Total Consolidated
Net revenues 11,494 7,865 1,911 - (532) 20,738Provision for credit losses 207 190 (1) - (0) 396Noninterest expenses:Compensation and benefits 2,978 2,962 568 - 2,367 8,874General and administrative expenses 6,576 3,729 729 - (2,245) 8,789Policyholder benefits and claims 0 0 0 - 0 0Impairment of goodwill and other intangible assets 6 0 0 - 0 6Restructuring activities 94 (57) 2 - (0) 39Total noninterest expenses 9,653 6,634 1,300 - 122 17,708Noncontrolling interests 25 0 1 - (26) 0Income (loss) before income taxes 1,610 1,041 610 - (627) 2,633Cost/income ratio (in %) 84 84 68 - N/M 85Assets 1,162,026 330,884 11,506 - 17,037 1,521,454Risk-weighted assets (CRD 4 - fully loaded) 241,820 88,656 9,528 - 15,108 355,113CRD 4 leverage exposure measure (spot value at reporting date) 1,049,576 342,146 3,300 - 25,236 1,420,258Average shareholders’ equity 43,759 14,793 4,944 - 127 63,623Post-tax return on average tangible shareholders’ equity (in %)1 3.5 7.3 53.9 - N/M 4.1Post-tax return on average shareholders’ equity (in %)1 3.3 6.3 11.0 - N/M 3.5N/M – Not meaningful1 The post-tax return on average tangible shareholders’ equity and average shareholders’ equity at the Group level reflects the reported effective tax rate for the Group, which
was 36 %. For the post-tax return on average tangible shareholders’ equity and average shareholders’ equity of the segments, the applied tax rate was 33 %.
Nine months endedSep 30, 2016
in € m.(unless stated otherwise)
Corporate & Investment
Bank
Private & Commercial
Bank
DeutscheAsset
Management
Non-Core Operations
UnitConsolidation& Adjustments
Total Consolidated
Net revenues 13,493 7,885 2,216 (524) (124) 22,946Provision for credit losses 513 281 1 96 (0) 891Noninterest expenses:Compensation and benefits 3,071 3,075 535 45 2,322 9,047General and administrative expenses 7,159 3,690 804 1,083 (2,290) 10,447Policyholder benefits and claims 0 0 285 0 0 285Impairment of goodwill and other intangible assets 285 0 0 (49) 0 236Restructuring activities 280 100 44 4 6 435Total noninterest expenses 10,795 6,865 1,669 1,083 39 20,450Noncontrolling interests 47 0 0 (0) (47) 0Income (loss) before income taxes 2,138 739 547 (1,703) (116) 1,606Cost/income ratio (in %) 80 87 75 N/M N/M 89Assets 1,295,883 337,935 26,367 11,157 17,608 1,688,951Risk-weighted assets (CRD 4 - fully loaded) 246,138 93,495 13,273 17,768 14,027 384,701CRD 4 leverage exposure measure (spot value at reporting date) 970,214 349,038 4,323 15,189 15,484 1,354,248Average shareholders’ equity 40,447 13,950 6,078 1,805 13 62,292Post-tax return on average tangible shareholders’ equity (in %)1 4.9 5.4 44.0 N/M N/M 1.2Post-tax return on average shareholders’ equity (in %)1 4.6 4.6 7.8 N/M N/M 1.0N/M – Not meaningful1 The post-tax return on average tangible shareholders’ equity and average shareholders’ equity at the Group level reflects the reported effective tax rate for the Group, which
was 67 %. For the post-tax return on average tangible shareholders’ equity and average shareholders’ equity of the segments, the applied tax rate was 35 %.

8
Deutsche Bank 1 – Management ReportInterim Report as of September 30, 2017
Corporate Divisions
Corporate & Investment Bank (CIB)
Three months ended Nine months endedin € m.(unless stated otherwise) Sep 30, 2017 Sep 30, 2016
Absolute Change
Change in % Sep 30, 2017 Sep 30, 2016
Absolute Change
Change in %
Net revenues:Global Transaction Banking 974 1,130 (156) (14) 2,990 3,335 (346) (10)
Equity Origination 66 88 (22) (25) 333 276 58 21Debt Origination 287 391 (104) (27) 989 1,097 (107) (10)Advisory 122 142 (20) (14) 372 364 8 2
Origination and Advisory 475 621 (146) (24) 1,695 1,736 (42) (2)Financing 610 583 27 5 1,709 1,754 (45) (3)
Sales & Trading (Equity) 525 622 (98) (16) 1,753 2,127 (375) (18)Sales & Trading (FIC) 988 1,540 (552) (36) 3,826 4,311 (485) (11)
Sales & Trading 1,512 2,162 (650) (30) 5,579 6,439 (860) (13)Other (103) 36 (140) N/M (478) 228 (706) N/MTotal net revenues 3,468 4,532 (1,064) (23) 11,494 13,493 (1,999) (15)Provision for credit losses 94 208 (114) (55) 207 513 (306) (60)Noninterest expenses:Compensation and benefits 912 962 (50) (5) 2,978 3,071 (93) (3)General and administrative expenses 2,103 2,330 (227) (10) 6,576 7,159 (583) (8)Policyholder benefits and claims 0 0 0 N/M 0 0 0 N/MImpairment of goodwill and otherintangible assets 0 0 0 N/M 6 285 (279) (98)Restructuring activities (5) 40 (45) N/M 94 280 (187) (67)Total noninterest expenses 3,011 3,333 (322) (10) 9,653 10,795 (1,142) (11)Noncontrolling interests 2 22 (20) (91) 25 47 (22) (47)Income (loss) before income taxes 361 969 (608) (63) 1,610 2,138 (528) (25)N/M – Not meaningful
2017 to 2016 Three Months Comparison
CIB net revenues for the third quarter of 2017 were € 3.5 billion, a decrease of € 1.1 billion or 23 % year-on-year. Financialmarkets continued to experience very low volatility during the third quarter of 2017 and combined with subdued client activity,this negatively impacted revenues. Primary capital markets activity has continued to slow, compared to a strong prior yearquarter.
Global Transaction Banking net revenues were € 974 million, a decrease of € 156 million or 14 %. Revenues were impacted bytighter margins including a change in funding costs allocation methodology. Cash Management revenues were lower as a resultof client and product perimeter adjustments in 2016 and securitization-related reimbursements in the prior year quarter. Traderevenues were lower driven by lower volumes and continued pressure on margins in a competitive environment. Trust, Agencyand Securities Services revenues were essentially flat, with strong performance in the U.S. supported by interest rate increasespartly offset by lower revenues in APAC.
Origination and Advisory generated net revenues of € 475 million in the third quarter of 2017, a decrease of € 146 million, or24 %. Equity Origination revenues were 25 % lower, partly due to lower market volumes compared to the prior year quarter.Debt Origination revenues were 27 % lower compared to the prior year quarter with significantly lower market volumes acrossleveraged loans and investment grade bonds. Revenues in Advisory were 14 % lower compared to a strong prior year quarter.
Financing net revenues were € 610 million, an increase of € 27 million or 5 % compared to the third quarter of 2016. There wasgood performance across asset based lending and commercial real estate, where balance sheet deployment has been steadyand revenues were slightly higher. This was partially offset by lower revenues from our investment grade lending business.
Sales & Trading (FIC) net revenues were € 988 million, a decrease of € 552 million or 36 %. Credit revenues were significantlylower due to a less active environment and less favorable trading conditions for flow businesses. In the prior year quarter thebusiness also recorded higher revenues from Chinese onshore investments. Rates revenues were lower compared to a verystrong third quarter of 2016 as low volatility impacted client volumes. Foreign Exchange revenues were lower compared to theprior year quarter which benefitted from high client activity and volatility levels following the UK referendum on EU membership.Revenues in Emerging Markets were significantly lower and Foreign Exchange and Rates Asia Pacific revenues were lowerwith continued low volatility impacting client flow across both businesses.
9
Deutsche Bank Operating and Financial ReviewInterim Report as of September 30, 2017 Corporate Divisions
Sales & Trading (Equity) generated net revenues of € 525 million, a decrease of € 98 million, or 16 %. Prime Finance revenueswere lower compared to the prior year due to reduced margins and lower average balances during the quarter. Cash Equityrevenues were significantly higher driven by strong performance in the U.S. and an asset sale, while Equity Derivatives reve-nues were significantly lower due to lower client activity and lower volatility.
Other revenues incurred a loss of € 103 million, compared to a gain of € 36 million in 2016. This included a loss of € 7 million(2016: a gain of € 47 million) relating to the impact of DVA on certain derivative liabilities. Other revenues also include a nega-tive impact related to the valuation of the legacy RMBS portfolio.
Provision for credit losses decreased by € 114 million or 55 %.The reduction was attributable to broad based improved perfor-mance despite continued challenges in shipping. Provision for credit losses in the third quarter of 2017 was largely driven by animpact from changes in estimates related to the shipping portfolio.
Noninterest expenses were € 3.0 billion, a decrease of € 322 million or 10 % compared to the prior year quarter. This was main-ly driven by reduced litigation provisions, in addition to lower restructuring and severance charges. The year-on-year develop-ment of noninterest expenses also benefitted from favorable currency movements.
Income before income taxes was € 361 million (2016: income € 969 million). The year-on-year reduction in revenues was onlypartially offset by reduced noninterest expenses and lower credit loss provisions.
2017 to 2016 Nine Months Comparison
Revenues in the first nine months of 2017 were € 11.5 billion, down € 2.0 billion or 15 % on the prior year. The impact of a DVAloss of € 329 million on certain derivative liabilities (2016: a gain of € 239 million), including the impact of a methodology changein the first quarter of 2017 was a significant driver of this development. In addition the first nine months of 2017 include addition-al liquidity-related funding costs, including a change in allocation methodology. The first half of 2016 included gains reportedunder Sales & Trading related to the tender offer to re-purchase senior unsecured debt securities.
Global Transaction Banking net revenues were € 3.0 billion, a decrease of € 346 million or 10 %, impacted by tightened mar-gins including a change in the funding allocation methodology. Cash Management revenues were lower, as interest rate in-creases in the U.S. and growth within its FX business in the first half of the year only partly offset the negative impact of clientand product perimeter reductions in 2016. Trade revenues were lower driven by active balance sheet and risk managementefforts and continued margin pressure. Trust, Agency and Securities Services revenues were essentially flat, as lower transac-tion volumes due to client and country exits were offset by interest rate increases in the U.S.
Origination and Advisory revenues were € 1.7 billion, a € 42 million or 2 % decrease compared to the prior year. Equity Origina-tion revenues were 21 % higher, benefitting from increased issuance volumes, particularly within the first quarter of 2017. DebtOrigination revenues were 10 % lower, with a strong first quarter of 2017 supported by high inflows into the Leveraged Loanmarket, offset by reduced revenues in the second and third quarters of 2017 amid lower client activity and issuance volumes.Advisory revenues were essentially flat to the prior year period.
Financing net revenues were € 1.7 billion, a decrease of € 45 million or 3 % with steady balance sheet deployment and goodrevenue performance across asset based lending and commercial real estate offset by lower revenues from our investmentgrade lending business.
Sales & Trading (FIC) net revenues were € 3.8 billion, a decrease of € 485 million or 11 %. Credit revenues were essentially flatsupported by strong performance in distressed products in the first half of 2017, offset by less favorable trading conditions forflow businesses in the third quarter of 2017. Rates revenues were essentially flat to the prior year with lower market activity,particularly in the third quarter of 2017. Foreign Exchange revenues were lower as a persistently low volatility environmentimpacted client flows. Foreign exchange and rates Asia Pacific revenues were lower with a strong first quarter of 2017 offset bylower client activity in the second and third quarters of the year. Emerging Markets revenues were lower across the coveredregions.
Sales & Trading (Equity) generated net revenues of € 1.8 billion, a decrease of € 375 million, or 18 %. Revenues in Prime Fi-nance were significantly lower reflecting reduced margins and lower average balances during the year. Equity Derivatives reve-nues were slightly lower with a challenging third quarter of 2017, whilst Cash Equities revenues were slightly higher.
Other revenues incurred a loss of € 478 million, compared to a gain of € 228 million in 2016, and included a loss of € 329 million(2016: a gain of € 239 million) relating to the impact of DVA on certain derivative liabilities. € 136 million of this loss was due to achange in the creditor hierarchy in the event of a bank insolvency which was introduced by the German Resolution MechanismAct (Abwicklungsmechanismusgesetz), effective January 1, 2017. This hierarchical change results in derivative counterpartiesreceiving greater protection as they would be satisfied prior to senior unsecured debt holders in the creditor waterfall structure.This greater protection increases the value of the derivative assets for the counterparty, thereby increasing the value of deriva-
10
Deutsche Bank 1 – Management ReportInterim Report as of September 30, 2017
tive liabilities on our balance sheet, resulting in the loss. Revenues associated with assets identified as not consistent with ourCIB strategy are reported under ‘other’ as of the second quarter of 2017 as well. Other revenues also include a negative impactrelated to the valuation of the legacy RMBS portfolio.
Provision for credit losses decreased by € 306 million or 60 %. The reduction was attributable to broad based improved perfor-mance despite continued challenges in shipping.
Noninterest expenses of € 9.7 billion, were € 1.1 billion or 11 % lower than in 2016. Reduced litigation provisions, materiallylower Goodwill impairment and lower severance and restructuring all positively impacted the comparison versus the prior year.In addition noninterest expenses were lower compared to the prior year due to favorable currency movements, while compen-sation and benefits also declined driven by reduced headcount.
Income before income taxes of € 1.6 billion was 25 % lower than in the previous year. The period-over-period reduction inrevenues was only partially offset by reduced noninterest expenses and lower credit loss provisions.
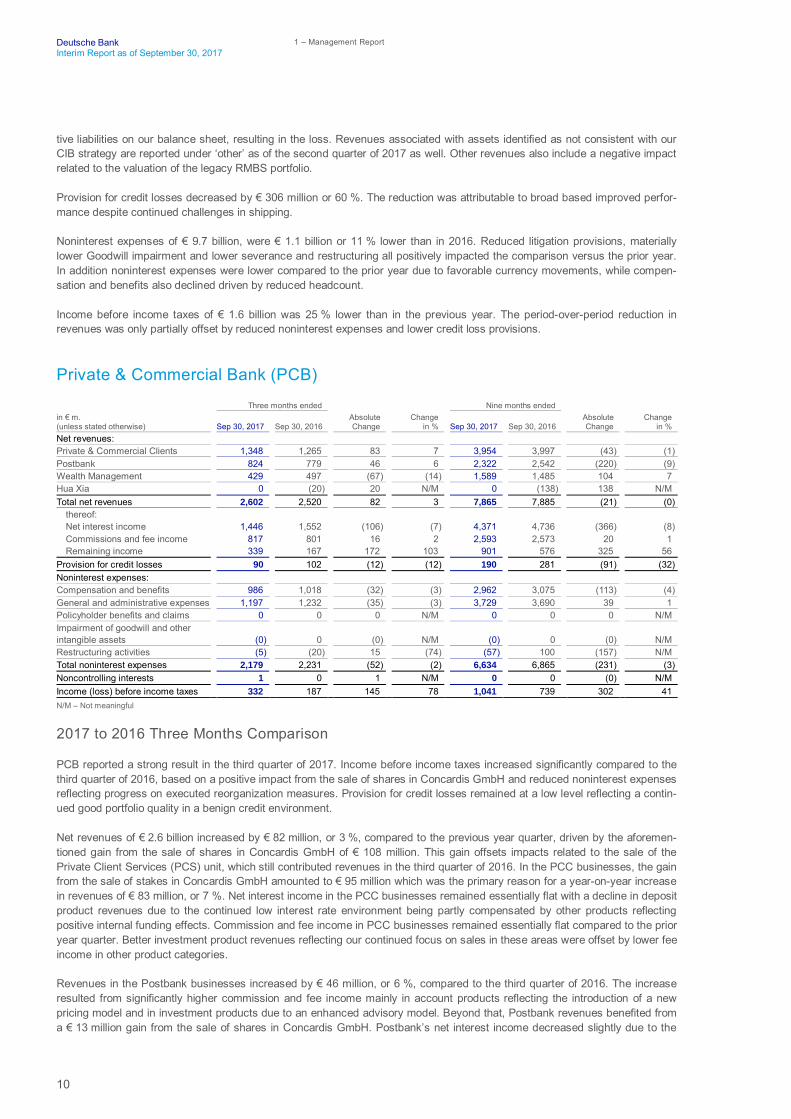
Private & Commercial Bank (PCB)
Three months ended Nine months endedin € m.(unless stated otherwise) Sep 30, 2017 Sep 30, 2016
AbsoluteChange
Changein % Sep 30, 2017 Sep 30, 2016
AbsoluteChange
Changein %
Net revenues:Private & Commercial Clients 1,348 1,265 83 7 3,954 3,997 (43) (1)Postbank 824 779 46 6 2,322 2,542 (220) (9)Wealth Management 429 497 (67) (14) 1,589 1,485 104 7Hua Xia 0 (20) 20 N/M 0 (138) 138 N/MTotal net revenues 2,602 2,520 82 3 7,865 7,885 (21) (0)
thereof:Net interest income 1,446 1,552 (106) (7) 4,371 4,736 (366) (8)Commissions and fee income 817 801 16 2 2,593 2,573 20 1Remaining income 339 167 172 103 901 576 325 56
Provision for credit losses 90 102 (12) (12) 190 281 (91) (32)Noninterest expenses:Compensation and benefits 986 1,018 (32) (3) 2,962 3,075 (113) (4)General and administrative expenses 1,197 1,232 (35) (3) 3,729 3,690 39 1Policyholder benefits and claims 0 0 0 N/M 0 0 0 N/MImpairment of goodwill and otherintangible assets (0) 0 (0) N/M (0) 0 (0) N/MRestructuring activities (5) (20) 15 (74) (57) 100 (157) N/MTotal noninterest expenses 2,179 2,231 (52) (2) 6,634 6,865 (231) (3)Noncontrolling interests 1 0 1 N/M 0 0 (0) N/MIncome (loss) before income taxes 332 187 145 78 1,041 739 302 41N/M – Not meaningful
2017 to 2016 Three Months Comparison
PCB reported a strong result in the third quarter of 2017. Income before income taxes increased significantly compared to thethird quarter of 2016, based on a positive impact from the sale of shares in Concardis GmbH and reduced noninterest expensesreflecting progress on executed reorganization measures. Provision for credit losses remained at a low level reflecting a contin-ued good portfolio quality in a benign credit environment.
Net revenues of € 2.6 billion increased by € 82 million, or 3 %, compared to the previous year quarter, driven by the aforemen-tioned gain from the sale of shares in Concardis GmbH of € 108 million. This gain offsets impacts related to the sale of thePrivate Client Services (PCS) unit, which still contributed revenues in the third quarter of 2016. In the PCC businesses, the gainfrom the sale of stakes in Concardis GmbH amounted to € 95 million which was the primary reason for a year-on-year increasein revenues of € 83 million, or 7 %. Net interest income in the PCC businesses remained essentially flat with a decline in depositproduct revenues due to the continued low interest rate environment being partly compensated by other products reflectingpositive internal funding effects. Commission and fee income in PCC businesses remained essentially flat compared to the prioryear quarter. Better investment product revenues reflecting our continued focus on sales in these areas were offset by lower feeincome in other product categories.
Revenues in the Postbank businesses increased by € 46 million, or 6 %, compared to the third quarter of 2016. The increaseresulted from significantly higher commission and fee income mainly in account products reflecting the introduction of a newpricing model and in investment products due to an enhanced advisory model. Beyond that, Postbank revenues benefited froma € 13 million gain from the sale of shares in Concardis GmbH. Postbank’s net interest income decreased slightly due to the

11
Deutsche Bank Operating and Financial ReviewInterim Report as of September 30, 2017 Corporate Divisions
impact of the low interest rate environment on deposit revenues, which was partly mitigated by higher loan revenues reflectinggrowth in lending volumes.
Revenues in the Wealth Management (WM) businesses decreased by € 67 million, or 14 %, driven by the disposed PrivateClient Services (PCS) unit, which contributed revenues of € 81 million in the third quarter of 2016 as well as negative impactsfrom foreign exchange translation. These effects were partly compensated by positive impacts from continued workout activitiesin the Sal. Oppenheim franchise in the current quarter. Excluding these factors, WM’s net interest revenues declined comparedto the previous year due to selective loan book reductions in the Americas and a lower deposit base. Commission and feeincome in the WM businesses was essentially flat year-over-year.
Provision for credit losses of € 90 million decreased by € 12 million, or 12 %, compared to the prior year period reflecting thecontinued good portfolio quality in a benign economic environment.
Noninterest expenses of € 2.2 billion declined by € 52 million, or 2 %, compared to the third quarter of 2016. Noninterest ex-penses relating to continued investments in digitization and regulatory initiatives as well as higher performance-related com-pensation expenses were more than offset by the benefits of executed reorganization measures, the sale of the PCS unit andother cost containment measures.
Income before income taxes of € 332 million increased by € 145 million compared to the third quarter of 2016. The increasewas driven by the gain from the sale of shares in Concardis GmbH and the aforementioned reduction in noninterest expenses.
PCB’s Invested Assets of € 505 billion increased by € 1 billion compared to June 30, 2017, driven by € 5 billion market appreci-ation partly offset by negative impacts of € 4 billion from foreign exchange translation.
2017 to 2016 Nine Months Comparison
PCB’s result improved significantly compared to the first nine months of last year. Revenues were negatively impacted by thecontinued low interest rate environment and included a lower revenue base after the disposal of the Private Client Services(PCS) unit. This was mitigated by several specific revenue factors including positive impacts from workout activities in the Sal.Oppenheim franchise and a growth in commission and fee income. Provision for credit losses were on lower levels compared toprior year, in part benefitting from a release in Postbank in the second quarter 2017. Noninterest expenses decreased signifi-cantly, driven by lower impacts from restructuring charges and also reflecting savings from executed restructuring measures.
Net revenues of € 7.9 billion remained essentially flat compared to the prior year period. Revenues in 2016 included a negativevaluation impact of € 138 million related to the stake in Hua Xia Bank Co. Ltd..
In the Private & Commercial Client (PCC) businesses, revenues decreased by € 43 million, or 1 %, compared to the first ninemonths of 2016. Both periods included gains on sales on a comparable level: 2016 included a gain of € 97 million from the saleof the stake in VISA Europe Limited, and 2017 included a gain of € 95 million from the sale of shares in Concardis GmbH. Netinterest income decreased slightly compared to the first nine months of 2016, which was attributable to the ongoing low interestrate environment in combination with the nonrecurrence of a special dividend payment of € 50 million received in 2016 from oneof PCC’s shareholdings. Commission and fee income remained essentially flat year-on-year with better investment productrevenues reflecting our sales focus in these areas.
Revenues in the Postbank businesses decreased by € 220 million, or 9 %, compared to the first nine months of 2016 primarilydriven by two specific factors. The termination of a legacy trust preferred security had a negative impact of € 118 million onrevenues in 2017 whereas revenues in 2016 included gains of € 104 million from the sale of a stake in VISA Europe Limited.Postbank’s net interest income declined due to the impact of the low interest rate environment on deposit revenues which waspartly mitigated by higher loan revenues as a result of growth in lending volumes. Commission and fee income increased signif-icantly mainly in current accounts reflecting the introduction of a new pricing model and in investment products due to an en-hanced advisory model.
Revenues in the Wealth Management (WM) businesses increased by € 104 million, or 7 %. This was mainly caused by positiveimpacts from workout activities in the Sal. Oppenheim franchise, which more than compensated the impact of a lower revenuebase after the disposal of the Private Client Services (PCS) unit in September 2016. Excluding these specific factors, WM’s netinterest revenues declined compared to the previous year driven by loan book reductions mainly in the Americas region and alower deposit base. Commission and fee income were slightly lower compared to the prior year period.

12
Deutsche Bank 1 – Management ReportInterim Report as of September 30, 2017
Provision for credit losses of € 190 million decreased by € 91 million, or 32 %, compared to the prior year period benefiting froma provision release in Postbank and a continued benign economic environment. Both periods included positive impacts fromselective portfolio sales.
Noninterest expenses of € 6.6 billion declined by € 231 million, or 3 %, compared to the first nine months of 2016. The declinereflected lower impacts from restructuring activities as well as savings after the execution of these measures. The first ninemonths of 2016 included net restructuring charges of € 100 million whereas the first nine months of 2017 benefited from a netrelease of restructuring provisions of € 57 million as a result of the execution of the reorganization measures in the PCC busi-ness in Germany. Noninterest expenses in the first nine months of 2017 were also positively impacted by the reduced cost baseafter the disposal of the PCS unit. These cost-reducing effects were partly offset by higher infrastructure and investment ex-penditures for digitalization, regulatory projects and other initiatives as well as by higher accruals for performance-related com-pensation.
Income before income taxes of € 1.0 billion increased by € 302 million compared to the first nine months of 2016. The increasewas driven by the aforementioned specific factors and also reflected a solid operating performance in a continued difficult inter-est rate environment.
PCB’s Invested Assets of € 505 billion increased by € 5 billion compared to December 31, 2016. Negative impacts from foreignexchange translation were more than compensated by market appreciation and by net inflows of € 5 billion (€ 2 billion in WM,€ 4 billion in PCC businesses). These net inflows mainly occurred in deposit products, in part reflecting the successful win-backof mandates after outflows in the third and fourth quarter last year.
Deutsche Asset Management (Deutsche AM)
Three months ended Nine months endedin € m.(unless stated otherwise) Sep 30, 2017 Sep 30, 2016
AbsoluteChange
Changein % Sep 30, 2017 Sep 30, 2016
AbsoluteChange
Changein %
Net revenues:Management Fees 545 541 4 1 1,669 1,604 65 4Performance and transaction fees 29 44 (15) (34) 134 92 42 46Other revenues 54 41 13 31 108 212 (104) (49)Mark-to-market movements onpolicyholder positions in Abbey Life 0 195 (195) N/M 0 309 (309) N/MTotal net revenues 628 821 (193) (24) 1,911 2,216 (306) (14)Provision for credit losses (0) 0 (0) N/M (1) 1 (1) N/MTotal noninterest expenses:Compensation and benefits 184 174 10 6 568 535 33 6General and administrative expenses 250 253 (3) (1) 729 804 (75) (9)Policyholder benefits and claims 0 167 (167) N/M 0 285 (285) N/MImpairment of goodwill and otherintangible assets 0 0 0 N/M 0 0 0 N/MRestructuring activities (2) 12 (14) N/M 2 44 (42) (95)Total noninterest expenses 433 606 (173) (29) 1,300 1,669 (369) (22)Noncontrolling interests 0 0 0 N/M 1 0 1 N/MIncome (loss) before income taxes 195 215 (20) (9) 610 547 63 11N/M – Not meaningful
2017 to 2016 Three Months Comparison
Deutsche AM reported lower income before income taxes in the third quarter 2017, compared to a strong prior year quarterwhich benefited from several non-recurring items including positive effects related to Abbey Life and a write-up relating to HETAAsset Resolution AG (HETA) exposure. Net new assets saw consecutive quarterly inflows led by Cash and Fixed Income.
Net revenues were € 628 million, a decrease of € 193 million, or 24 %. Management fees were essentially flat compared to prioryear quarter. Performance and transaction fees decreased significantly by € 15 million, or 34 %, due to lower fund performancefees from Alternatives. Other revenues increased significantly by € 13 million, or 31 % due to a non-recurring insurance recov-ery relating to a real-estate fund, partly offset by prior year non-recurring items including Abbey Life excluding mark-to-marketrevenues and a write-up relating to HETA. Following the sale of Abbey Life in the fourth quarter 2016, no mark-to-marketmovements on policyholder positions were recorded in 2017, compared to € 195 million, in the third quarter 2016.
Noninterest expenses of € 433 million decreased significantly by € 173 million, or 29 %, due to the non-recurrence of costsrelating to Abbey Life and lower restructuring costs. Compensation and benefits were slightly higher, and general and adminis-trative expenses were essentially flat compared to prior year quarter.

13
Deutsche Bank Operating and Financial ReviewInterim Report as of September 30, 2017 Corporate Divisions
Income before income taxes of € 195 million decreased by € 20 million, or 9 %, driven by significantly lower revenues due toaforementioned prior year non-recurring items including mark-to-market movements on policyholder positions in Abbey Life andwrite up relating to HETA, partly offset by the aforementioned non-recurring revenues related to a real-estate fund and lowerrestructuring costs.
Invested assets were € 711 billion as of September 30, 2017, flat compared to € 711 billion as of June 30, 2017, driven by netasset inflows of € 4 billion and favorable market development of € 7 billion, offset by unfavorable foreign currency movements of€ 10 billion.
in € bn. Alternatives Cash Equity Fixed Income Multi Asset Total Invested
AssetsBalance as of June 30, 2017 85 56 184 299 87 711
Inflows 3 9 13 21 5 51Outflows (4) (5) (14) (19) (5) (47)
Net Flows (1) 4 (1) 2 0 4FX impact (1) (1) (2) (5) 0 (10)Market Development 1 0 5 2 0 7Other (1) 0 0 0 1 0Balance as of September 30, 2017 82 59 185 297 88 711Average fee rate (in bps) 54 6 52 14 39 31
2017 to 2016 Nine Months Comparison
During the first nine months of 2017, Deutsche AM reported higher Income before taxes compared to the prior year. 2017 alsosaw a positive turnaround with € 14 billion net asset inflows led by the Germany, EMEA and APAC regions compared to the netasset outflows reported in the prior year.
Net revenues in the first nine months of 2017 were € 1.9 billion, a decrease of € 306 million, or 14 %. Management fees in-creased slightly by € 65 million, or 4 %, driven by Active reflecting favorable market movements and Alternatives equalizationfees reported this year. Performance and transaction fees increased significantly by € 42 million, or 46 %, due to higher fundperformance fees from Alternatives during the second quarter. Other revenues decreased significantly by € 104 million, or 49 %compared to the prior year which included non-recurring revenues from Abbey Life excluding mark-to-market revenues, pro-ceeds of the sale of Asset Management India and the write-up relating to HETA, partly offset by a non-recurring insurancerecovery relating to a real-estate fund. Following the sale of Abbey Life in the fourth quarter 2016, no mark-to-market move-ments on policyholder positions were recorded in 2017, compared to € 309 million reported in the first nine months of 2016.
Noninterest expenses of € 1.3 billion decreased by € 369 million, or 22 %, compared to the first nine months of 2016, driven bythe non-recurrence of costs relating to Abbey Life, lower General and administrative expenses and significantly lower restructur-ing costs.
Income before income taxes was € 610 million, an increase of € 63 million, or 11 % compared to the first nine months of 2016,driven by the aforementioned lower noninterest expenses, partly offset by lower revenues due to several non-recurring items inthe prior year including Abbey life, the sale of Asset Management India, and the write-up relating to HETA.
Invested assets were € 711 billion as of September 30, 2017, an increase of € 5 billion versus December 31, 2016, driven byfavorable market development of € 23 billion and net asset inflows of € 14 billion, partly offset by unfavorable foreign currencymovements of € 32 billion.
in € bn. Alternatives Cash Equity Fixed Income Multi Asset Total Invested
AssetsBalance as of December 31, 2016 84 63 174 305 80 706
Inflows 13 9 35 60 23 140Outflows (12) (10) (34) (55) (15) (125)
Net Flows 1 0 1 4 8 14FX impact (5) (3) (8) (16) (1) (32)Market Development 2 (1) 17 4 1 23Other (1) 0 1 0 0 0Balance as of September 30, 2017 82 59 185 297 88 711Average fee rate (in bps) 54 6 52 14 39 31

14
Deutsche Bank 1 – Management ReportInterim Report as of September 30, 2017
Non-Core Operations Unit (NCOU)
Three months ended Nine months endedin € m.(unless stated otherwise) Sep 30, 2017 Sep 30, 2016
AbsoluteChange
Changein % Sep 30, 2017 Sep 30, 2016
AbsoluteChange
Changein %
Net revenues - (191) 191 N/M - (524) 524 N/MProvision for credit losses - 17 (17) N/M - 96 (96) N/MNoninterest expenses:Compensation and benefits - 13 (13) N/M - 45 (45) N/MGeneral and administrative expenses - 367 (367) N/M - 1,083 (1,083) N/MPolicyholder benefits and claims - 0 0 N/M - 0 0 N/MImpairment of goodwill and otherintangible assets - (49) 49 N/M - (49) 49 N/MRestructuring activities - 0 (0) N/M - 4 (4) N/MTotal noninterest expenses - 330 (330) N/M - 1,083 (1,083) N/MNoncontrolling interests - (0) 0 N/M - (0) 0 N/MIncome (loss) before income taxes - (538) 538 N/M - (1,703) 1,703 N/MN/M – Not meaningful
2017 to 2016 Three / Nine Months Comparison
From 2017 onwards, Non-Core Operations Unit (NCOU) ceased to exist as a standalone division. The remaining legacy assetsas of December 31, 2016 are now managed by the corresponding operating segments, predominately Corporate & InvestmentBank and Private & Commercial Bank.
Consolidation & Adjustments (C&A)
Three months ended Nine months endedin € m.(unless stated otherwise) Sep 30, 2017 Sep 30, 2016
AbsoluteChange
Changein % Sep 30, 2017 Sep 30, 2016
AbsoluteChange
Changein %
Net revenues 79 (190) 269 N/M (532) (124) (408) N/MProvision for credit losses 0 (0) 0 N/M (0) (0) (0) N/MNoninterest expenses:Compensation and benefits 723 727 (4) (1) 2,367 2,322 45 2General and administrative expenses (686) (692) 7 (1) (2,245) (2,290) 45 (2)Policyholder benefits and claims 0 0 0 N/M 0 0 0 N/MImpairment of goodwill and otherintangible assets 0 0 0 N/M 0 0 0 N/MRestructuring activities (0) 12 (13) N/M (0) 6 (6) N/MTotal noninterest expenses 37 47 (10) (21) 122 39 83 N/MNoncontrolling interests (3) (22) 19 (86) (26) (47) 21 (44)Income (loss) before income taxes 44 (215) 260 N/M (627) (116) (511) N/MN/M – Not meaningful
2017 to 2016 Three Months Comparison
Income before income taxes in C&A was € 44 million in the third quarter of 2017, compared to a loss of € 215 million in the prioryear quarter. This increase included a positive impact of € 186 million from valuation and timing differences, primarily driven bycumulative amortization income related to Group Cash Flow Hedging programs, compared to negative € 153 million in prioryear period. Additionally, revenues in third quarter of 2017 included negative € 25 million (third quarter 2016: negative€ 26 million) from municipal bonds taxable equivalent, which is reported by the business segment and balanced out via C&A,and negative € 14 million pertaining to realization of currency translation adjustments from an UK entity as a part of DeutscheBank’s strategy to reduce the number of entities. Noninterest expenses include negative € 34 million from litigation.
2017 to 2016 Nine Months Comparison
Loss before income taxes in C&A was € 627 million in the first nine months of 2017, compared to a loss of € 116 million in theprior year period. This decrease was mainly due to negative € 182 million resulting from the realization of currency translationadjustments related to Deutsche Bank’s subsidiaries in Argentina, Uruguay and United Kingdom and the loss on sale of theArgentina subsidiary. The decrease also included negative € 117 million related to maintaining funding and liquidity buffers inexcess of business-based liquidity requirements. Additionally, the result in the first nine months of 2017 included negative€ 85 million from municipal bonds taxable equivalent (nine months 2016: negative € 93 million), which is reported by the busi-ness segment and balanced out via C&A, negative €37 million from litigation and negative € 29 million as a result of a hedgerelated to the sale of Hua Xia Bank stake. In the first nine months of 2017, negative € 190 million in valuation and timing differ-ences in the first half of 2017 resulting from a narrowing of our own credit spread was offset by positive impact of € 186 million

15
Deutsche Bank Operating and Financial ReviewInterim Report as of September 30, 2017 Financial Position
from valuation and timing differences in the third quarter of 2017, primarily driven by cumulative amortization income related toGroup Cash Flow Hedging programs.
Financial Positionin € m.(unless stated otherwise) Sep 30, 2017 Dec 31, 2016
AbsoluteChange
Changein %
Cash and central bank balances 204,390 181,364 23,026 13Interbank balances (w/o central banks) 10,727 11,606 (879) (8)Central bank funds sold, securities purchased under resale agreements andsecurities borrowed 34,560 36,368 (1,808) (5)Trading assets 186,716 171,044 15,672 9Positive market values from derivative financial instruments 372,019 485,150 (113,131) (23)Financial assets designated at fair value through profit or loss 96,183 87,587 8,596 10
Thereof:Securities purchased under resale agreements 63,643 47,404 16,239 34Securities borrowed 18,168 21,136 (2,968) (14)
Loans 396,237 408,909 (12,672) (3)Securities held to maturity 3,179 3,206 (27) (1)Brokerage and securities related receivables 125,582 105,100 20,482 19Remaining assets 91,862 100,213 (8,351) (8)Total assets 1,521,454 1,590,546 (69,092) (4)Deposits 574,691 550,204 24,487 4Central bank funds purchased, securities sold under repurchase agreementsand securities loaned 23,007 29,338 (6,331) (22)Trading liabilities 74,201 57,029 17,172 30Negative market values from derivative financial instruments 348,346 463,858 (115,512) (25)Financial liabilities designated at fair value through profit or loss 49,758 60,492 (10,734) (18)
Thereof:Securities sold under repurchase agreements 38,967 50,397 (11,430) (23)Securities loaned 1,220 1,298 (78) (6)
Other short-term borrowings 18,279 17,295 984 6Long-term debt 159,091 172,316 (13,225) (8)Brokerage and securities related payables 158,763 122,019 36,744 30Remaining liabilities 44,708 53,176 (8,468) (16)Total liabilities 1,450,844 1,525,727 (74,883) (5)Total equity 70,609 64,819 5,790 9
Movements in Assets
As of September 30, 2017, total assets decreased by € 69.1 billion (or 4 %) compared to year-end 2016.
The overall decrease was primarily driven by a € 113.1 billion decrease in positive market values from derivative financial in-struments, mainly attributable to foreign exchange rate products primarily driven by lower volatility and decline in customer flows,as well as interest rate products as changes in interest rate curves were inversely correlated to changes in the mark-to-marketvalues.
A € 12.7 billion reduction in loans also contributed to the overall decrease, mainly driven by FX rate movements.
These decreases were partly offset by an increase in cash and central bank balances by € 23.0 billion, mostly driven by thereduction in loans, increase in deposits and proceeds from our capital raise.
Brokerage and securities related receivables increased by € 20.5 billion, mainly driven by higher receivables from unsettledregular way trades following the seasonality pattern we typically observe of lower year-end levels versus higher volumes overthe course of the year, partially offset by lower collateral requirements corresponding to the decrease in negative market valuesfrom derivative financial instruments.
Trading assets increased by € 15.7 billion primarily driven by debt securities mainly due to increased bond positions in EU &U.S. rates business and increased client activity.
Central bank funds sold, securities purchased under resale agreements and securities borrowed, under both accrual and fairvalue accounting, increased by € 11.5 billion, mainly driven by short coverage needs.

16
Deutsche Bank 1 – Management ReportInterim Report as of September 30, 2017
The overall movement of the balance sheet included a decrease of € 67.7 billion due to foreign exchange rate movementsmainly driven by strengthening of the Euro versus the U.S. Dollar. The effects from foreign exchange rate movements are alsoreflected in the development of the balance sheet line items discussed in this section.
Movements in Liabilities
As of September 30, 2017, total liabilities decreased by € 74.9 billion (or 5 %) compared to year-end 2016.
The overall reduction was primarily driven by a € 115.5 billion decrease in negative market values from derivative financialinstruments primarily due to the same factors as the movements in positive market values from derivative financial instrumentsas discussed above.
Central bank funds purchased, securities sold under repurchase agreements and securities loaned, under both accrual and fairvalue accounting decreased by € 17.8 billion, primarily driven by lower firm financing needs.
A € 13.2 billion decrease in long term debt also contributed to the overall decrease due to higher outflows compared to newissuances in aggregate and FX impacts.
These decreases were partly offset by a € 36.7 billion increase in brokerage and securities related payables, primarily due tothe same factors as the movements in brokerage and securities related receivables as discussed above.
Deposits increased by € 24.5 billion during the period, mainly as a result of campaigns in our Private and Commercial Bank aswell as cash management initiatives in our transaction bank, partially offset by a reduction in wholesale deposits.
Trading liabilities increased by € 17.2 billion, mainly attributable increased trading activities in EU & U.S. rates business.
Similar to total assets, the impact of foreign exchange rate movements during the period is already embedded in the overallmovements in liabilities as discussed in this section.
Liquidity
Liquidity reserves amounted to € 279 billion as of September 30, 2017 (compared to € 219 billion as of December 31, 2016).We maintained a positive internal liquidity stress result as of September 30, 2017 (under the combined scenario), and our Li-quidity Coverage Ratio for September 30, 2017 was 141 % (compared to 128 % as of December 31, 2016).
Equity
Total equity as of September 30, 2017 increased by € 5.8 billion compared to December 31, 2016. The main factor contributingto this development was a capital increase of € 8.0 billion from the issuance of 687.5 million new common shares in April 2017.Further contributing to the increase was net income attributable to Deutsche Bank shareholders and additional equity compo-nents of € 1.7 billion. Partly offsetting was a net loss from exchange rate changes of € 2.3 billion (relating especially to the U.S.dollar) as well as other items which reduced total equity, such as: cash dividends paid to Deutsche Bank shareholders of€ 392 million, the reduction of unrealized gains (losses) of both financial assets available for sale and derivatives hedging thevariability of cash flows, net of tax of € 315 million, coupons paid on additional equity components of € 288 million net of tax, anet change in share awards of € 245 million, remeasurement losses related to defined benefit plans, net of tax of € 184 millionas well as costs of the capital increase, net of tax of € 135 million.
Regulatory Capital
Our Common Equity Tier 1 (CET 1) capital according to CRR/CRD 4 as of September 30, 2017 increased in the first threequarters of 2017 by € 3.9 billion to € 51.6 billion. Risk-weighted assets (RWA) according to CRR/CRD 4 were € 354.2 billion asof September 30, 2017, compared with € 356.2 billion at the end of 2016. The increase in CRR/CRD 4 CET 1 capital resulted ina CRR/CRD 4 CET 1 capital ratio of 14.6 % as of September 30, 2017, compared with 13.4 % at the end of 2016.

17
Deutsche Bank Operating and Financial ReviewInterim Report as of September 30, 2017 Management and Supervisory Board
Our fully loaded CRR/CRD 4 CET 1 capital as of September 30, 2017 amounted to € 49.1 billion, € 6.8 billion higher comparedto € 42.3 billion as of December 31, 2016. RWA according to CRR/CRD 4 fully loaded were € 355.1 billion as of Septem-ber 30, 2017 compared with € 357.5 billion at the end of 2016. Due to the increase in CET 1 capital our fully loadedCRR/CRD 4 CET 1 capital ratio as of September 30, 2017 increased to 13.8 % as compared to 11.8 % at year-end 2016.
Further details on the development of Regulatory Capital and RWA can be found in the section “Risk Report” of this reportunder chapter “Regulatory Capital”.
Related Party TransactionsWe have business relationships with several companies in which we own significant equity interests. We also have businessrelationships with a number of companies where members of our Management Board hold positions on boards of directors ornon-executive boards. Our business relationships with these companies cover many of the financial services we provide to ourclients generally. For more detailed information, please refer to the section “Other Financial Information” of this Interim Report.
Management and Supervisory Board
Management Board
On March 5, 2017, the Supervisory Board decided to appoint Marcus Schenck and Christian Sewing as Presidents of DeutscheBank AG with immediate effect.
At his own request, Jeffrey Urwin left the Bank's Management Board effective March 31, 2017.
In addition to his position as CEO, John Cryan has assumed responsibility for the Bank’s Americas business.
On April 28, 2017, the Supervisory Board appointed James von Moltke as a member of the Management Board of DeutscheBank AG with effect from July 1, 2017, until June 30, 2020. He will succeed Dr. Marcus Schenck as Chief Financial Officer. Dr.Marcus Schenck will be responsible for the Corporate & Investment Bank (CIB) together with Garth Ritchie as of July 1, 2017.
On August 22, 2017, the Supervisory Board appointed Frank Strauß as a member of the Management Board of Deutsche BankAG with effect from September 1, 2017, until August 31, 2020. He is Co-Head of the Private & Commercial Bank together withChristian Sewing.
Supervisory Board
Peter Löscher and Professor Dr. Klaus Rüdiger Trützschler left the Supervisory Board of Deutsche Bank AG with effect fromthe end of the Annual General Meeting on May 18, 2017.
At the conclusion of the Annual General Meeting on May 18, 2017, Dr. Paul Achleitner’s period of office as member and Chair-man of the Supervisory Board ended as scheduled. He was re-elected member of the Supervisory Board as of May 18, 2017for a period of five years.
Gerhard Eschelbeck, Vice President Security & Privacy Engineering, Google Inc., and Professor Dr. Stefan Simon, self-employed attorney-at-law with his own law firm (SIMON GmbH), who had been appointed member of the Bank’s SupervisoryBoard by the court with effect from August 23, 2016, were also elected members of the Supervisory Board of Deutsche BankAG by the Annual General Meeting on May 18, 2017, for a period of five years.
Gerd Alexander Schütz, founder and member of the Management Board of C-QUADRAT Investment AG, was elected memberof the Supervisory Board of Deutsche Bank by the Annual General Meeting on May 18, 2017, for a period of one year.
At its subsequent meeting, the Supervisory Board elected Dr. Paul Achleitner as its Chairman.

18
Deutsche Bank 1 – Management ReportInterim Report as of September 30, 2017
Strategy
Our core business model is based on that of a global bank with a strong home base in Germany. We serve the real economyneeds of our corporate, institutional, asset management and private clients, providing services in transaction banking, corporatefinance and capital markets, asset management, wealth management and retail banking. This business model remains thefoundation of our strength and long-term growth prospects.
To further strengthen the bank and reposition for growth, we announced a number of strategic measures. Decisions agreed bythe Management Board and Supervisory Board and announced on March 5, 2017 aim to reinforce the bank’s roots in its homemarket of Germany and its position as a leading European bank with global reach:
having capital at sufficient levels which are beyond question,having a leading CIB franchise with the scale and strength to successfully compete and grow globally,occupying the number one private and commercial banking position in our home market of Germany,giving our world class Deutsche AM division operational segregation that can support accelerated growth,reducing the size of our corporate center and cost base in part through more front to back alignment and shifting large por-tions of infrastructure functions to the business divisions, andshifting our earnings and business mix more towards stable businesses.
Geographically, Germany will remain our anchor – our home market where we intend not only to maintain, but to further expandour leading position in all three of our business divisions. Fundamentally, we intend to retain our global capabilities, but plan tofocus those capabilities where our management believes our franchise is the strongest, the growth potential the largest, and thepotential risk adjusted returns the highest.
PCB will be primarily focused in Germany, with wealth management businesses around the world.Given the global nature of our core corporate clients, we intend to retain CIB capabilities across Germany and EMEA (ex-Germany), the U. S. and Canada, and in Asia Pacific (APAC). While we intend to have a global institutional client footprint,we expect to be focused primarily on Germany and EMEA (ex-Germany) where our competitive franchise is the strongest.We also intend to maintain a strong, but more focused U. S. footprint.Deutsche AM will continue to provide a full suite of investment management services in Germany and the wider EMEAregion, while enhancing its specialist capabilities in the U.S. and APAC.
As part of our strategy announcement in March 2017 we have adopted new financial targets. The new targets are:
Adjusted costs of € 22 billion in 2018, and € 21 billion by 2021, which includes the adjusted costs of PostbankPost-tax Return on Average Tangible Equity of approximately 10 % in a normalized operating environmentCRR/CRD 4 Common Equity Tier 1 capital ratio (fully loaded) of comfortably above 13 %CRR/CRD 4 leverage ratio according to transitional rules (phase-in) of 4.5 %, andTargeting a competitive dividend payout ratio for the financial year 2018 and thereafter
Progress against strategic goals and targets
Within the Corporate and Investment Bank (CIB) division, we continue to focus on the key initiatives announced in March 2017.The portfolio of legacy assets, which we have identified within the division, continues to roll-off as planned. We are focused onreinvigorating our client-led franchise through more effective coverage and have made progress in selectively hiring to capturekey strategic opportunities. In the quarter we continued to make progress towards better front-to-back alignment of certaininfrastructure functions, in particular business aligned technology functions.
Our Private and Commercial Bank (PCB) aims to become the leading advisory driven, omni-channel proposition for private andcommercial clients with a superior product offering. To achieve this goal, digital investments remain the core strategic pillar tobroaden our client base and to drive growth, efficiency, and new (platform) business.
In Germany, PCB has now virtually completed its target to close 188 retail branches in Germany (187 branches closed in PCCGermany as of the end of September 2017). Further investments are planned for the continuous digital transformation of ourcore businesses as well as for new products and services, including beyond banking propositions. In addition, a direct bank willbe launched in 2018 to cater for new client segments.

19
Deutsche Bank StrategyInterim Report as of September 30, 2017
We are continuing to make progress on the integration of Postbank. We have developed concepts for our Target Business,Operating and Financial models and have substantiated key integration cornerstones to realize our planned € 900 million insynergies. We aim to be the leading Private Sector Bank in Germany with two strong brands by capturing market opportunitiesand leveraging joint product strengths. The legal entity merger is on track for the second quarter of 2018. This will lay the basisfor establishing an integrated steering and governance with one head office, management team and IT platform, single productmanagement and harmonized regional coverage across Germany. Furthermore, we have reached an upfront in-principleagreement with the workers union on key integration items. We will commence the detailing and implementation of these mod-els in the last quarter of 2017.
Within Wealth Management (WM), where we aim to build our business around clients’ needs to become a top 10 global wealthmanager, further investments have been made in the third quarter into the digital modernization and we have hired selectively inAsia. Furthermore, we have announced our plans to integrate Sal. Oppenheim’s business activities in order to combine ourWealth Management competencies in Germany, reduce complexity and take advantage of synergies by combining service andinfrastructure functions. This step will allow us to provide our WM clients with the benefits of our holistic wealth managementapproach by offering comprehensive services combined with the advantages of our global capital markets and investmentexpertise. In this context Sal Oppenheim’s successful Quantitative Investment business will be legally and operationally inte-grated into our Deutsche Asset Management (Deutsche AM) segment. By integrating these business activities into ourDeutsche AM service and distribution platform we aim to benefit from the growth potential for this business on a global scale.
We are progressing well in the preparation of the planned partial initial public offering of Deutsche Asset Management(Deutsche AM) and our announced timeline is on track (completion within 24 months since announcement in March 2017)assuming market conditions are favorable. Our pre-IPO alignment measures are progressing well: large parts of client facing,asset management-related business activities, as well as essential infrastructure functions have already been aligned toDeutsche AM. We have made good progress formalizing service arrangements between Deutsche Bank Group parent and itsfuture Deutsche AM subsidiary. In early October, we aligned our organizational structure more closely by bringing our Active,Passive and Alternatives capabilities into one globally integrated investment platform and created a single global CoverageGroup. This is in response to clients who increasingly seek our advice across asset classes and require more multi-asset andsolutions oriented investment capabilities. Completion of operational and legal separation is subject to regulatory approvals.
At the Group level, we are progressing with our program of business disposals and have completed and signed a number oftransactions in 2017. In certain cases, we have re-evaluated disposal decisions due to a number of considerations such asmore or less favorable market conditions, legal and financial terms, or regulatory or other approval requirements. Progress hasalso been made on expense management. Noninterest expenses of € 5.7 billion in the third quarter of 2017 were 14 % lowercompared to the third quarter of 2016. The impact of headcount reductions was partially offset by higher accruals for currentyear variable compensation, driven by the planned return to normal compensation programs after 2016 bonus payments weresignificantly limited.

20
Deutsche Bank 1 – Management ReportInterim Report as of September 30, 2017
Outlook
The following section should be read in conjunction with the Outlook section in the Management Report provided in the AnnualReport 2016.
The Global EconomyGlobal economic growth is expected to continue to improve in the remainder of 2017, a trend that already started in the first halfof 2017. We expect global economic growth to rise moderately to 3.6 % in 2017, after a growth rate of 3.1 % in 2016. Globalinflation rate is expected to accelerate to 5.9 % in 2017, mainly due to increases in commodity prices and a very high inflationrate in Venezuela. For industrialized countries, we expect an economic growth rate of 2.1 %, and an increase in consumerprices of 1.7 % in 2017. We expect economic growth in emerging markets to rise to 4.7 % in 2017, with inflation at 8.8 %.
The economic outlook in the eurozone is expected to improve by 2.2 % despite structural challenges in 2017. However, theCatalonia pro-independence movement could pose a significant risk to the eurozone. On the assumption that such political riskswill not materialize, the favorable environment should help to strengthen economic resilience against potential downside risks.By the end of 2017, the fiscal easing and the accommodating monetary policy of the European Central Bank (ECB) should stillsupport economic growth. We expect the ECB to announce further steps towards the normalization of their monetary policy.This depends, however, on whether consumer prices remain on track to meet the ECB's targets. We expect consumer pricesin the eurozone to rise by 1.5 % in 2017. GDP in Germany is estimated to grow by 1.9 % in 2017, driven by strong domesticdemand.
In the U.S., we expect economic growth to accelerate to 2.1 % in 2017. Investment and sound consumer spending shouldstimulate the economy on the back of a strong labor market. The tax plan announced in September 2017 was well received bythe markets which subsequently began to factor in potential material tax reductions in the future. However, since the plan didnot contain any significant details, the impact on economic growth remains uncertain. We expect consumer prices to rise by2.2 %. Despite the growth pickup, the Federal Reserve's (Fed) monetary policy should remain accommodative. We expect thatthe Fed will increase its policy rate once to 1.375 % by year-end 2017.
We expect the Japanese economy to grow at a robust 1.5 % in 2017. We believe this is above the potential of the economy,which we estimate at about 1 %. The recovery of capital investment and the recovery in the use of durable goods underpin thisdevelopment. A forced reduction in working hours through government reforms could dampen further growth. We anticipate theBank of Japan’s monetary policy to remain accommodative and continue to manage yields. We expect inflation to remain lowat 0.3 %.
We project economic growth in the emerging markets to rise to 4.7 % in 2017, and in Asia (excluding Japan) to remain broadlyflat at 6.0 % with inflation at 2.3 %. We expect the Chinese economy to expand by 6.7 % in 2017, with inflation rising to 1.7 %.The overheated real estate sector remains an important economic challenge while the capital flows slow down in 2017. ThePeople's Bank of China could expand loan volumes to strengthen the real estate sector.
The Banking IndustryIn Europe, business in the banking industry is expected to benefit broadly from the healthy economy in the next months. It islikely that lending will recover slightly, with moderate growth in the allowance for credit losses from the currently very low level.The pressure on interest margins will likely persist despite any potential shifts in monetary policy, and the banks will need tocontinue observing systematic cost discipline to improve their profit situation. Business development notwithstanding, a range ofissues are expected to set the tone for the banking industry in the next months: the progress in the Brexit negotiations betweenthe UK and EU, the effects of the ECB's slowly emerging shift in interest rates, further development of the regulatory environ-ment, from Basel III to the European banking union and a potential financial transaction tax, and the ongoing transition towardsincreasingly digital business models.
German banks are expected to continue benefiting from a very healthy macroeconomic environment, with stronger lendinggrowth and better credit quality than in the eurozone as a whole. However, we expect their average profitability will remain farbelow the European average due to what is expected to be a continued slow pace of structural change.
For banks in the U.S., a lot will depend on whether and to what extent they are set to benefit from tax cuts and deregulation.This could have a considerable impact on both growth and earnings in the industry. The gradual normalization of monetarypolicy has had a positive effect to date, at least on interest margins in the banking system. That said, macroeconomic growth
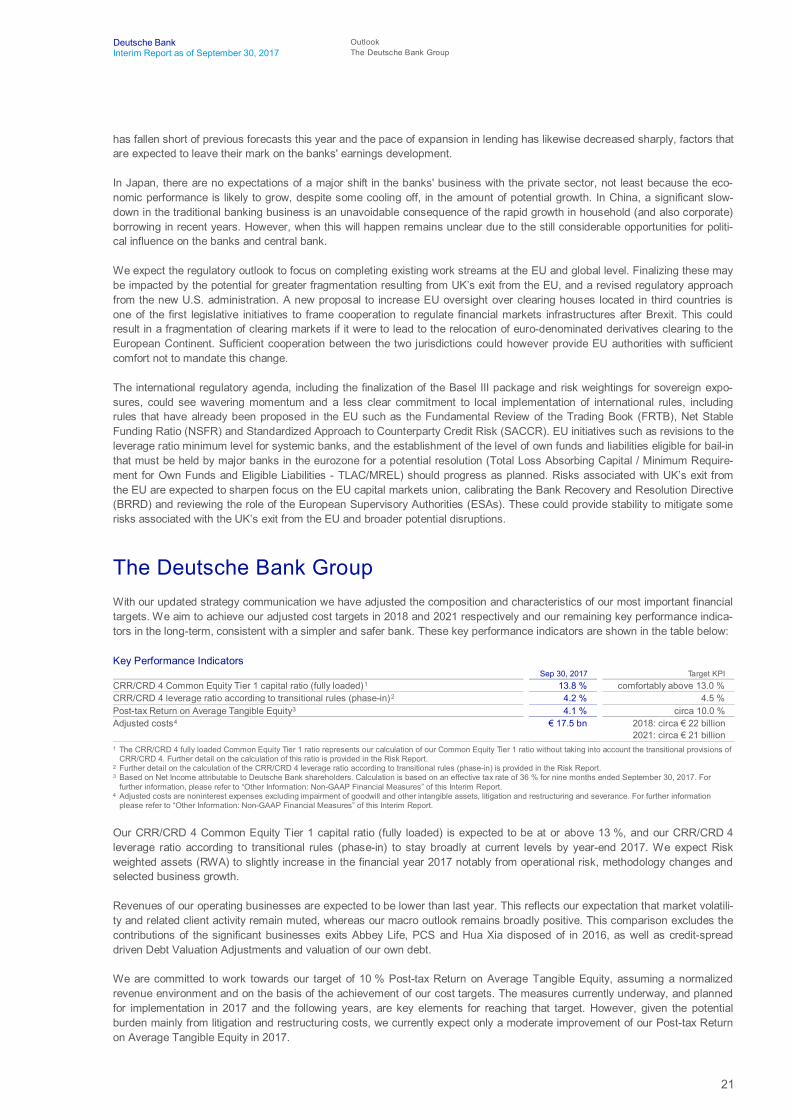
21
Deutsche Bank OutlookInterim Report as of September 30, 2017 The Deutsche Bank Group
has fallen short of previous forecasts this year and the pace of expansion in lending has likewise decreased sharply, factors thatare expected to leave their mark on the banks' earnings development.
In Japan, there are no expectations of a major shift in the banks' business with the private sector, not least because the eco-nomic performance is likely to grow, despite some cooling off, in the amount of potential growth. In China, a significant slow-down in the traditional banking business is an unavoidable consequence of the rapid growth in household (and also corporate)borrowing in recent years. However, when this will happen remains unclear due to the still considerable opportunities for politi-cal influence on the banks and central bank.
We expect the regulatory outlook to focus on completing existing work streams at the EU and global level. Finalizing these maybe impacted by the potential for greater fragmentation resulting from UK’s exit from the EU, and a revised regulatory approachfrom the new U.S. administration. A new proposal to increase EU oversight over clearing houses located in third countries isone of the first legislative initiatives to frame cooperation to regulate financial markets infrastructures after Brexit. This couldresult in a fragmentation of clearing markets if it were to lead to the relocation of euro-denominated derivatives clearing to theEuropean Continent. Sufficient cooperation between the two jurisdictions could however provide EU authorities with sufficientcomfort not to mandate this change.
The international regulatory agenda, including the finalization of the Basel III package and risk weightings for sovereign expo-sures, could see wavering momentum and a less clear commitment to local implementation of international rules, includingrules that have already been proposed in the EU such as the Fundamental Review of the Trading Book (FRTB), Net StableFunding Ratio (NSFR) and Standardized Approach to Counterparty Credit Risk (SACCR). EU initiatives such as revisions to theleverage ratio minimum level for systemic banks, and the establishment of the level of own funds and liabilities eligible for bail-inthat must be held by major banks in the eurozone for a potential resolution (Total Loss Absorbing Capital / Minimum Require-ment for Own Funds and Eligible Liabilities - TLAC/MREL) should progress as planned. Risks associated with UK’s exit fromthe EU are expected to sharpen focus on the EU capital markets union, calibrating the Bank Recovery and Resolution Directive(BRRD) and reviewing the role of the European Supervisory Authorities (ESAs). These could provide stability to mitigate somerisks associated with the UK’s exit from the EU and broader potential disruptions.
The Deutsche Bank GroupWith our updated strategy communication we have adjusted the composition and characteristics of our most important financialtargets. We aim to achieve our adjusted cost targets in 2018 and 2021 respectively and our remaining key performance indica-tors in the long-term, consistent with a simpler and safer bank. These key performance indicators are shown in the table below:
Key Performance Indicators Sep 30, 2017 Target KPI
CRR/CRD 4 Common Equity Tier 1 capital ratio (fully loaded)1 13.8 % comfortably above 13.0 %CRR/CRD 4 leverage ratio according to transitional rules (phase-in)2 4.2 % 4.5 %Post-tax Return on Average Tangible Equity3 4.1 % circa 10.0 %Adjusted costs4 € 17.5 bn 2018: circa € 22 billion
2021: circa € 21 billion1 The CRR/CRD 4 fully loaded Common Equity Tier 1 ratio represents our calculation of our Common Equity Tier 1 ratio without taking into account the transitional provisions of
CRR/CRD 4. Further detail on the calculation of this ratio is provided in the Risk Report.2 Further detail on the calculation of the CRR/CRD 4 leverage ratio according to transitional rules (phase-in) is provided in the Risk Report.3 Based on Net Income attributable to Deutsche Bank shareholders. Calculation is based on an effective tax rate of 36 % for nine months ended September 30, 2017. For
further information, please refer to “Other Information: Non-GAAP Financial Measures” of this Interim Report.4 Adjusted costs are noninterest expenses excluding impairment of goodwill and other intangible assets, litigation and restructuring and severance. For further information
please refer to “Other Information: Non-GAAP Financial Measures” of this Interim Report.
Our CRR/CRD 4 Common Equity Tier 1 capital ratio (fully loaded) is expected to be at or above 13 %, and our CRR/CRD 4leverage ratio according to transitional rules (phase-in) to stay broadly at current levels by year-end 2017. We expect Riskweighted assets (RWA) to slightly increase in the financial year 2017 notably from operational risk, methodology changes andselected business growth.
Revenues of our operating businesses are expected to be lower than last year. This reflects our expectation that market volatili-ty and related client activity remain muted, whereas our macro outlook remains broadly positive. This comparison excludes thecontributions of the significant businesses exits Abbey Life, PCS and Hua Xia disposed of in 2016, as well as credit-spreaddriven Debt Valuation Adjustments and valuation of our own debt.
We are committed to work towards our target of 10 % Post-tax Return on Average Tangible Equity, assuming a normalizedrevenue environment and on the basis of the achievement of our cost targets. The measures currently underway, and plannedfor implementation in 2017 and the following years, are key elements for reaching that target. However, given the potentialburden mainly from litigation and restructuring costs, we currently expect only a moderate improvement of our Post-tax Returnon Average Tangible Equity in 2017.

22
Deutsche Bank 1 – Management ReportInterim Report as of September 30, 2017
Our Group-wide cost reduction program targets the optimization of our branch network, the delivery of efficiencies throughdigitalization of processes and the streamlining of infrastructure functions. In parallel, we intend to continue our investments instrengthening the control functions and the supporting infrastructure environment. We are targeting approximately € 22 billion inadjusted costs in 2018, which includes Postbank’s adjusted costs. We target a further reduction in adjusted costs to approxi-mately € 21 billion by 2021. In 2017, we expect to see net cost reductions flow through from investments made last year, as wellas from the impact of expected headcount reductions, and the successful completion of our NCOU disposals. We plan to returnto our normal compensation programs in 2017 after the Management Board decided for 2016 to substantially limit bonus pay-ments. Overall, we expect our adjusted costs to be slightly lower in 2017 compared to 2016.
We target a competitive dividend payout ratio for the financial year 2018 and thereafter. If we report sufficient levels of distribut-able profits under our stand-alone financial statements in accordance with German accounting rules (HGB) for the fiscal year2017, we expect to recommend a dividend payment of € 0.11 per share for the fiscal year 2017.
By the nature of our business, we are involved in litigation, arbitration and regulatory proceedings and investigations in Germa-ny and in a number of jurisdictions outside Germany, especially in the U.S. Such matters are subject to many uncertainties.While we have resolved a number of important legal matters and made progress on others, we expect the litigation and en-forcement environment to continue to be challenging. Although in the first three quarters of 2017 we recorded only a smallamount of litigation expenses, we anticipate these expenses to be higher in the last quarter of 2017.
Our Business Segments
Corporate & Investment Bank (CIB)
For full year 2017, we expect Corporate & Investment Bank revenues to be lower compared to full year 2016.
We expect Sales & Trading FIC revenues to be lower in 2017 compared to the full year 2016. The challenging market environ-ment in the third quarter could continue into the fourth quarter of 2017, with low levels of volatility resulting in lower client activityimpacting flow revenues. Additionally, the business continues to incur higher funding charges in the current year. We expectSales & Trading Equity revenues to be lower year on year for the full year 2017 from a slowdown in client activity due to thecontinued low volatility environment and the impact of higher funding charges in 2017. Client balances in Prime Finance, whichhad been lost in the last quarter of 2016, have fully recovered.
We expect Financing revenues to be slightly lower year-on-year driven by lower revenues from investment grade lending, whilstrevenues from Commercial Real Estate and asset based financing are expected to be flat.
We expect Origination & Advisory revenues to be essentially flat year-on-year. For the full year 2017, revenues from Equityorigination are expected to be slightly higher as industry volumes recovered from a difficult full year 2016. We expect this to bepartly offset by slightly lower Debt origination revenues, whilst Advisory revenues are expected to stay essentially flat.
In Global Transaction Banking, higher funding charge allocations, a persistently low interest rate environment in Europe and thestrategic rationalization of our perimeter are expected to continue to weigh on revenues. For full year 2017, we expect these tobe lower compared to the prior year.
We remain committed to reduce costs across CIB and drive platform efficiency while enhancing regulatory compliance, controland conduct. Our adjusted cost base (excluding litigation, impairment of goodwill and other intangibles, severance and restruc-turing) is expected to remain essentially flat for the full year 2017. In the near term we expect to continue to face pressure onour returns due to slightly higher RWA, mainly driven by Operational Risk RWA and methodology changes. We will maintain ourfocus on regulatory compliance, know-your-client (KYC) and client on-boarding process enhancement, system stability andcontrol and conduct.
Risks to the outlook include the implementation of Markets in Financial Instruments Directive 2 (MiFID2) in 2018 and the poten-tial impact on our business model of the exit process of the UK from the European Union. Uncertainty around central bankpolicies and ongoing regulatory developments also pose a risk, while challenges such as event risks and a slow-down in clientactivity may also impact financial markets. Despite this, we believe that continued execution on the announced strategic priori-ties will position us favorably to face potential challenges and capitalize on future opportunities.

23
Deutsche Bank OutlookInterim Report as of September 30, 2017 Our Business Segments
Private & Commercial Bank (PCB)
Our objective in this division with nearly 25 million clients is to provide a seamless client coverage while continuing our invest-ments in digitalization, to broaden the client base and to drive efficiencies. In Germany, we are targeting to be the leading Ger-man private and commercial bank by integrating the Private & Commercial Clients Germany and Postbank businesses. Theimprovement of our technology platform in Italy is one of the current targets in our Private & Commercial Clients Internationalbusiness. In Wealth Management, we will continue to follow our strategy which includes investing in key growth markets likeAsia, Americas and EMEA as well as selected de-risking and transformation initiatives.
We expect PCB’s revenues to be slightly lower in 2017 compared to 2016. However, excluding specific items described in thefollowing section, we expect PCB’s total net revenues to remain essentially flat in 2017 despite the challenging environment.
In our PCC businesses, we expect a similar decline in net interest income for the full year 2017 as occurred in 2016, driven bylower deposit revenues, which continue to suffer from the low interest rate environment. PCC’s commission and fee income isanticipated to be slightly higher in 2017 after it had been negatively impacted by a turbulent market environment with low clientactivity in 2016. Excluding specific items like the sale of VISA Europe in 2016, we expect total revenues in the PCC businessesto remain essentially flat. In our Postbank business, we expect that the impact of lower interest rates on deposit revenues willbe partially compensated by growth in loan revenues in line with our strategy to selectively expand our loan book. Overall,Postbank’s net interest income is expected to be slightly lower than in 2016 while we expect commission and fee income will behigher in 2017 in light of our strengthened advisory approach and the revised pricing model for accounts. Remaining income inPostbank is expected to be significantly lower compared to 2016 mainly due to reduced asset disposal activities and the nega-tive impact of the termination of a legacy Trust Preferred Security in the second quarter of 2017. Excluding these specific items,we expect Postbank’s total revenues to remain essentially flat compared to 2016 levels despite the negative impact of the lowinterest rate environment. In our Wealth Management business, we expect that the impact of the lower revenue base after thesale of the Private Client Services (PCS) unit in 2016 will be more than compensated by gains from workout activities in theSal. Oppenheim franchise. Excluding these specific items, we expect Wealth Management’s total revenues to be slightly lowerthan in 2016.
For PCB, we expect higher net new assets in 2017, in part reflecting the successful win-back of mandates after outflows in thethird and fourth quarter of 2016. We anticipate that RWA will be slightly higher compared to year-end 2016 levels.
In 2017, we expect loan loss provisions to be lower than in 2016. This includes a specific release in Postbank in the secondquarter of 2017 and also reflects a trend which started already in 2016, mainly driven by a benign market environment andselected portfolio sales.
In line with our strategy and our objectives of standardization and simplification, we plan to continue to optimize our branchnetworks and to improve our efficiency, and thus we expect the number of employees to further decline in 2017. The resultingdecrease in compensation expenses combined with the deconsolidation impact from the sale of the PCS business in 2016 isexpected to reduce our cost base. Inflation rate effects as well as continued investment spending (e.g., in digitalization) andhigher performance-related compensation will partly counteract this, so that we expect our noninterest expenses to be essen-tially flat compared to last year. Our noninterest expenses will also continue to be influenced by further transformation andintegration measures, including measures which will be taken for the foreseen integration of our German retail operations.
Deutsche Asset Management (Deutsche AM)
In Deutsche Asset Management, our outlook centers around the solid growth momentum with economic recoveries acrossdeveloped and emerging markets despite persistent geopolitical uncertainties following recent elections in Germany, ongoingBrexit negotiations and policy developments in the U.S., as well as recent currency fluctuations and market speculation aroundpossible rate hikes by the central banks. Throughout this period of cautious optimism for investors, Deutsche AM remains fo-cused on delivering as a trusted partner and solutions provider to our clients.
As announced in March 2017, we are making considerable progress in preparing Deutsche AM for a partial initial public offeringwithin 24 months of announcement, in order to unlock the intrinsic value of the business. We continue to view longer term in-dustry growth trends as favoring our capabilities in beta (passive) products, alternative investments and active multi-asset solu-tions, areas where we believe we can grow market share, both in our home market and abroad. With the net new asset growthreported in the first nine months of 2017, clarity around the future structure of Deutsche AM, and also the improved capitaloutlook for Deutsche Bank Group, we see client confidence remaining positive and are cautiously optimistic about asset devel-opment for the remainder of 2017. In the medium term, for the industry as a whole, we expect assets to grow, albeit at a lowerorganic rate than in prior years, and profit pools to be challenged by fee compression, rising costs of regulation, and competitivedynamics. In the face of this challenge, we intend to balance growth through product and coverage expansion, digital invest-ments and initiatives to ensure an efficient cost base and operating platform.

24
Deutsche Bank 1 – Management ReportInterim Report as of September 30, 2017
In 2017, we expect Deutsche AM’s revenues to be lower compared to 2016. However, excluding items not expected to recur,such as the insurance recovery relating to a real-estate fund in 2017 and the proceeds from the sale of Asset ManagementIndia, the write up relating to HETA exposure and Abbey Life revenues in 2016, we expect full year 2017 revenues to be essen-tially flat year-on-year. This is primarily driven by significantly higher Other revenues led by positive effects this year comparedto the negative effects in 2016 both related to fair value of guaranteed products, partly offset by lower performance fees. Follow-ing the sale of Abbey Life in the fourth quarter of 2016, noninterest expenses are expected to be significantly lower as policy-holder, benefits and claims ceased following the sale and we do not anticipate a repeat of material impairments incurred in 2016.For full year 2017, we expect net new asset inflows to increase significantly following the net new asset outflows reported in theprior year.
Risks to our outlook include the pace of net new assets growth, the exposure to global macroeconomic growth and the politicaldevelopments including Brexit negotiations and policy developments in the U.S.
Risks and Opportunities
We have reflected in our Outlook risks and opportunities that we believe are likely to occur. The following section focuses onfuture trends or events that may result in downside risk or upside potential from what we have anticipated in our Outlook.
Our aspirations are subject to various external and internal factors. In particular, timely and complete achievement of our strate-gic aspirations may be adversely impacted by the reduced revenue-generating capacities of some of our core businesses in thecurrent challenging macro-economic and market environment, the ongoing headwinds posed by regulatory reforms and/or theeffects on us of our legal and regulatory proceedings.
Depending on whether the economic and market conditions worsen or improve compared to forecasted levels, this could eitheradversely affect or positively impact our business, results of operations or strategic plans.
Continued elevated levels of political uncertainty could have unpredictable consequences for the financial system and thegreater economy and could contribute to an unwinding of European integration, potentially leading to declines in business levels,write-downs of assets and losses across our businesses. Our ability to protect ourselves against these risks is limited.
The overall macro-economic impact of the United Kingdom’s decision to leave the European Union, which will depend on Eu-rope’s political response to Brexit, is difficult to predict. In general, we expect a prolonged period of uncertainty regarding theUK’s future status with the EU. Therefore, weaker investment and thereby slower economic growth are expected to persistduring the UK exit negotiations. As a consequence, we will closely monitor the developments and their impact on our businessand operating model. This may potentially require taking impairments on assets.
Our ability to achieve our adjusted cost target depends in part on whether we are able to execute our planned business dispos-als successfully and within the planned timeframes. Such planned disposals may, however, be delayed, or the scope of theassets being divested may change or their execution may be rendered impracticable due to market conditions, negotiations withinterested parties and discussions with local regulators.
The direct costs and related business impacts described in this section and in our Outlook, should they be significantly greaterthan we currently expect, would impact the “available distributable items” (ADI) calculation for Deutsche Bank AG, which formsthe basis for payment capacity on our Additional Tier 1 (AT1) securities. If Deutsche Bank AG’s stand-alone HGB results do notprovide sufficient ADI, this could impact our ability to make distributions on our AT1 instruments. This could lead to higher fund-ing costs for us and adversely affect market perceptions of us, with potential adverse effects on our results of operations andfinancial condition. Such impacts may also put increasing pressure on our capital, liquidity and other regulatory ratios. Also, ifwe do not report sufficient levels of distributable profits under our stand-alone financial statements in accordance with Germanaccounting rules according to the German Commercial Code (Handelsgesetzbuch, HGB), this would impact our ability to paydividends.
A downgrade in our credit rating could affect our funding costs and business activities, although we are unable to predictwhether this would be the case or the extent of any such effect.
The regulatory reforms enacted and proposed in response to weaknesses in the financial sector together with the increasedregulatory scrutiny and discretion will impose material costs on us, create significant uncertainty for us and may adversely affectour business plans as well as our ability to execute our strategic plans. In addition, regulatory reforms in respect of resolvabilityor resolution measures may also impact our shareholders and creditors.

25
Deutsche Bank Risks and OpportunitiesInterim Report as of September 30, 2017 Our Business Segments
Regulators can also impose capital surcharges, for example, as result of the annual Supervisory Review and Evaluation Pro-cess (SREP), to reflect the additional risks posed by deficiencies in our control environment. In extreme cases, they can evensuspend our permission to operate within their jurisdictions. Furthermore, implementing enhanced controls may result in higherregulatory compliance costs that could offset or exceed efficiency gains. The evolving interpretations of the European BankingAuthority (EBA) on the Capital Requirements Regulation can also negatively impact our regulatory capital, leverage or liquidityratios. For example, the EBA has recently published new interpretative guidance on the treatment of guaranteed fund productswhich, if determined to be applicable to the full range of guaranteed funds and guaranteed fund saving schemes including themain government sponsored private pension scheme in Germany, could have a material impact on our regulatory capital andleverage ratio if this guidance would have to be applied.
Tax administrations have been focusing on the eligibility of taxpayers for reduced withholding taxes on dividends in connectionwith certain cross-border lending or derivative transactions, with the German Federal Ministry of Finance recently having issuedadministrative guidance in this area. In addition, we are subject to a number of legal proceedings, tax examinations and regula-tory investigations, whose outcome is difficult to estimate and which may substantially and adversely affect our planned resultsof operations, financial condition and reputation. If these matters are resolved on terms that are more adverse to us than weexpect, in terms of their costs or necessary changes to our businesses, or if related negative perceptions concerning our busi-ness and prospects and related business impacts increase, we may not be able to achieve our strategic objectives or we maybe required to change them.
Although we have devoted significant resources to develop our risk management policies, procedures and methods, includingwith respect to market, credit, liquidity and operational risk, they may not be fully effective in mitigating our risk exposures in alleconomic market environments or against all types of risks, including risk that we fail to identify or anticipate.

26
Deutsche Bank 1 – Management ReportInterim Report as of September 30, 2017
Risk Report
IntroductionThe following Risk Report provides qualitative and quantitative disclosures about credit, market and other risks as per the prin-ciples of the International Financial Reporting Standard (IFRS 7). Consequently, the reporting is generally based on IFRS prin-ciples of valuation and consolidation. However, for dedicated regulatory disclosures the regulatory principles of consolidationare relevant which differ from those applied for our financial statements.
CRR/CRD 4 Capital Framework
In the European Union, the Basel 3 capital framework was implemented by the “Regulation (EU) No 575/2013 on prudentialrequirements for credit institutions and investment firms” (Capital Requirements Regulation, or “CRR”) published on June 27,2013, and the “Directive 2013/36/EU on access to the activity of credit institutions and the prudential supervision of credit institu-tions and investment firms” (Capital Requirements Directive 4, or “CRD 4”) published on June 27, 2013. The new regulatoryframework became effective on January 1, 2014, subject to transitional rules. When referring to Deutsche Bank results accord-ing to transitional rules we use the term “CRR/CRD 4”. When referring to results according to full application of the final frame-work (without consideration of applicable transitional methodology) we use the term “CRR/CRD 4 fully loaded”. In some cases,CRR/CRD 4 maintains transitional rules that had been adopted in earlier capital adequacy frameworks through Basel 2 orBasel 2.5.
Details on our regulatory exposures as well as applicable ratios are provided further below in this report, and additionally, in ourPillar 3 report as of June 30, 2017.
ICAAP/ILAAP and SREP
The lnternal Capital Adequacy Assessment Process (“ICAAP”) as stipulated in Pillar 2 of Basel 3 requires banks to identify andassess risks, maintain sufficient capital to face these risks and apply appropriate risk management techniques to maintain ade-quate capitalization. The Internal Liquidity Adequacy Assessment Process (“ILAAP”) focuses on maintaining sufficient liquidityrisk management. The Supervisory Review and Evaluation Process (“SREP”) refers to the common methodology and stand-ards used by the European Central Bank (ECB) in its role under the Single Supervisory Mechanism (SSM). In accordance withArticle 97 of the Capital Requirements Directive (CRD 4), supervisors regularly review the arrangement, strategies, process andmechanisms implemented by banks and evaluate: (a) the risks to which the institution might be exposed; (b) the risks the insti-tution might pose to the financial system in general; and (c) the risks revealed by stress testing.
MREL and TLAC
Both the total loss-absorbing capacity (“TLAC”) requirement for global systemically important banks (“G-SIBs) and the Europe-an minimum requirement for own funds and eligible liabilities (“MREL”) are specifically designed to require banks to maintain asufficient amount of instruments which are eligible to absorb losses in resolution without recourse to taxpayers’ money. OnNovember 23, 2016, the European Commission (“EC”) proposed a revision of the Capital Requirement Regulation (“CRR”) aswell as amendments to the Single Resolution Mechanism (“SRM”) Regulation and the Bank Recovery and Resolution Directive(“BRRD”) in order to implement TLAC into EU legislation. The instruments which qualify under TLAC are Common Equity Tier 1,Additional Tier 1 and Tier 2 instruments as well as certain eligible unsecured liabilities. The TLAC term sheet introduces a min-imum requirement of 16 % of Risk-Weighted Assets (“RWAs”) or 6 % of leverage exposure by January 1, 2019; and 18 % ofRWAs and 6.75 % of leverage exposure by 2022. If deemed necessary, the resolution authority would be able to request a firm-specific add-on.
Risk Management Framework
The diversity of our business model requires us to identify, assess, measure, aggregate, manage our risks and to allocatecapital to our businesses consistently. Risk and capital are both managed via a common framework of principles, organizationalstructures and measurement and monitoring processes, that are closely aligned to the activities of the divisions and businessunits. Further details can be found in our Annual Report 2016 sections “Risk Management Principles and Governance” and“Risk Governance”.

27
Deutsche Bank Risk ReportInterim Report as of September 30, 2017 Introduction
Risk Management Governance Structure of the Deutsche Bank Group
Risk Identification and Assessment
In line with our risk management principles, our risk inventory was updated by running a risk identification and materialityassessment process. Material risks include credit, market, operational, liquidity, business, reputational and cross risk. Eachof the aforementioned risk types contain sub-risks, which were reviewed based on updated taxonomy principles. These princi-ples improve the differentiation between the risks and ensure a clear management ownership. No new risks were identified asmaterial. Cross risk (e.g. country and industry concentration risk) is now shown on its own to highlight the overarching aspectsof this risk.
Concerning the key risks “Credit Risk”, “Market Risk”, “Operational Risk” and “Liquidity Risk” and their developments within thethird quarter 2017, further details can be found in the specific sections of this Risk Report dedicated to the respective risks.Further information concerning the management framework for all our material risks above can be found in chapter “Risk andCapital Management” of our Annual Report 2016.
All risks assessed as material are covered by the Internal Capital Adequacy Assessment Process as described in the section“Internal Capital Adequacy” of this report. Modelling and measurement approaches for quantifying capital and demand areimplemented across major risk classes. Our material non-standard risks (i.e. reputational risk) are implicitly covered in oureconomic capital framework, primarily within operational and strategic risk.

28
Deutsche Bank 1 – Management ReportInterim Report as of September 30, 2017
Risk and Capital Overview
Key Risk Metrics
The following selected key risk ratios and corresponding metrics form part of our holistic risk management across individual risktypes. The Common Equity Tier 1 Ratio (CET 1), Internal Capital Adequacy Ratio (ICA), Leverage Ratio (LR), Liquidity Cover-age Ratio (LCR), and Stressed Net Liquidity Position (SNLP) serve as group-level metrics. They are fully integrated into the riskappetite framework, stress testing (except LCR), risk and capital planning, and recovery and resolution planning practices,which are reviewed and approved by our Management Board at least annually. The CET 1, LR, Leverage Exposure, LCR andRisk-Weighted Assets ratios and metrics, which are defined by regulation, are based on the fully loaded rules under the Regula-tion (EU) No 575/2013 on prudential requirements for credit institutions and investment firms (Capital Requirements Regulationor “CRR”) and the Directive 2013/36/EU on access to the activity of credit institutions and the prudential supervision of creditinstitutions and investment firms (Capital Requirements Directive 4 or “CRD 4”). ICA, Economic Capital and SNLP areDeutsche Bank specific internal risk metrics used in addition to the above described regulatory metrics.
Common Equity Tier 1 Ratio Total Risk-Weighted Assets30.9.2017 13.8 % 30.9.2017 € 355.1 bn31.12.2016 11.8 % 31.12.2016 € 357.5 bn
Internal Capital Adequacy Ratio Total Economic Capital30.9.2017 172 % 30.9.2017 € 37.3 bn31.12.2016 162 % 31.12.2016 € 35.4 bn
Leverage Ratio1 Leverage Exposure30.9.2017 3.8 % 30.9.2017 € 1,420 bn31.12.2016 3.5 % 31.12.2016 € 1,348 bn
Liquidity Coverage Ratio Stressed Net Liquidity Position (sNLP)30.9.2017 141 % 30.9.2017 € 27.7 bn2
31.12.2016 128 % 31.12.2016 € 36.1 bn
1 The CRR/CRD 4 leverage ratio on a phase-in basis was 4.2 % as of September 30, 2017 resp. 4.1 % as of December 31, 2016.2 Preliminary amount.
For further details please refer to this report under sections “Risk Profile”, “Internal Capital Adequacy”, “Capital Instruments”,“Development of Regulatory Capital (for phase-in and fully loaded CET 1 and Risk-Weighted Assets figures)”, “Development ofRisk-Weighted Assets”, “Leverage Ratio (for phase-in and fully loaded Leverage Ratio)” and our Annual Report 2016 undersections “Risk Appetite and Capacity”, “Recovery and Resolution Planning”, “Stress Testing” and “Internal Capital AdequacyAssessment Process”.
Overall Risk Assessment
Key risk categories include 1) financial risks such as credit risk, market risk, liquidity risk, business risk, cross risks, and 2) non-financial risks (NFRs) including reputational risk and operational risk. We manage the identification, assessment and mitigationof top and emerging risks through an internal governance process and the use of risk management tools and processes. Ourapproach to identification and impact assessment aims to ensure that we mitigate the impact of these risks on our financialresults, long term strategic goals and reputation. Please refer to our Annual Report 2016 under section "Risk and Capital Man-agement" for detailed information on the management of our material risks.
As part of our regular analysis, sensitivities of key portfolio risks are reviewed using a bottom-up risk assessment, complement-ed by a top-down macro-economic and political scenario analysis. This two-pronged approach allows us to capture both thoserisks that have an impact across our risk portfolios and business divisions as well as those relevant to specific portfolios.
Against an improving global economic backdrop, particularly in the Eurozone, (geo) political and policy risks remain a key driverof sentiment. Heightened tensions between the U.S. and North Korea remain in focus in the wake of further missile and nucleartests although markets have remained relatively resilient to date. Populism continues to present downside risks to the Eurozone,including the stand-off between Catalonia’s independence movement and the Spanish government following the disputed refer-endum vote, and the slow progress of UK/EU Brexit negotiations. The Federal Reserve is expected to hike rates in Decemberand the Bank of England has also moved to a more hawkish stance in the third quarter, driving FX and rates higher. A surpriseincrease in inflation and/or interest rates could drive large volatility in FX and rates markets.

29
Deutsche Bank Risk ReportInterim Report as of September 30, 2017 Risk and Capital Overview
The assessment of the potential impacts of these risks is integrated into our group-wide stress tests which assess our ability toabsorb these events should they occur. The results of these tests showed that the currently available capital and liquidity re-serves, in combination with available mitigation measures, allow to absorb the impact of these risks if they were to materialize inline with the tests’ parameters.
The third quarter of 2017 has seen a nascent shift in the trend towards increasing global regulation of the financial servicesindustry amid growing pressure on U.S. regulators from the executive branch to potentially modify some of the more stringentpost-crisis measures. It is not yet clear if substantial changes will result, either to the U.S. regulatory framework or more broadly.We are focused on identifying potential political and regulatory changes and assessing the possible impact on our businessmodel and processes. Our material litigation and regulatory enforcement matters are presented in the note “Provisions” of thisreport.
The overall focus of Risk and Capital Management is maintaining our risk profile in line with our risk strategy, increasing ourcapital base and supporting our strategic management initiatives with a focus on balance sheet optimization.
Risk Profile
The table below shows our overall risk position as measured by the economic capital usage calculated for credit, market, opera-tional and business risk for the dates specified. To determine our overall (non-regulatory) risk position, we generally considerdiversification benefits across risk types.
Overall risk position as measured by economic capital usage by risk type2017 increase (decrease)
from 2016in € m.(unless stated otherwise) Sep 30, 2017 Dec 31, 2016 in € m. in %Credit risk 13,212 13,105 107 1Market risk 14,184 14,593 (409) (3)
Trading market risk 4,679 4,229 450 11Nontrading market risk 9,505 10,364 (859) (8)
Operational risk 11,511 10,488 1,023 10Business risk 6,797 5,098 1,699 33Diversification benefit1 (8,440) (7,846) (594) 8Total economic capital usage 37,264 35,438 1,826 51 Diversification benefit across credit, market, operational and strategic risk (largest part of business risk).
As of September 30, 2017, our economic capital usage amounted to € 37.3 billion, which was € 1.8 billion or 5 %, higher than€ 35.4 billion economic capital usage as of December 31, 2016.
The economic capital usage for credit risk was € 107 million or 1 % higher as of September 30, 2017 compared to year-end2016 mainly due to a higher counterparty credit risk component.
The economic capital usage for trading market risk totaled € 4.7 billion as of September 30, 2017, which was € 450 million or11 % higher than at year-end 2016. The increase was primarily driven by traded default risk component. The nontrading marketrisk economic capital usage decreased by € 859 million or 8 % compared to December 31, 2016, mainly driven by a lowerstructural foreign exchange risk exposure and Treasury Liquidity.
The operational risk economic capital usage totaled € 11.5 billion as of September 30, 2017, which was € 1.0 billion or 10 %higher than the € 10.5 billion economic capital usage as of December 31, 2016. The increase was mainly driven by a modelchange regarding an enhanced scoring mechanism for the Self-Assessment results in conjunction with the replacement of theexisting Self-Assessment process by our enhanced Risk and Control Assessment process.
Our business risk economic capital methodology captures tax risk as well as strategic risk, which also implicitly includes ele-ments of non-standard risks such as refinancing or reputational risk. The business risk increased by € 1.7 billion compared toDecember 31, 2016, to € 6.8 billion as of September 30, 2017. This increase reflected a higher economic capital usage for thestrategic risk component driven by an updated 12-month earnings outlook and scope extension of tax risk component.
The inter-risk diversification effect of the economic capital usage for credit, market, operational and strategic risk increased by€ 594 million mainly due to overall higher economic capital usage across all risk types.
Our mix of various business activities results in diverse risk taking by our business divisions. We also measure the key risksinherent in their respective business models through the undiversified total economic capital (EC) metric, which mirrors eachbusiness division’s risk profile before taking into account cross-risk effects at the Group level.

30
Deutsche Bank 1 – Management ReportInterim Report as of September 30, 2017
Risk profile of our business divisions as measured by economic capitalSep 30, 2017
in € m.(unless stated otherwise)
Corporate & Investment
Bank
Private & Commercial
Bank
DeutscheAsset
Management
Non-Core Operations
Unit
Consoli-dation &
Adjustments and Other Total
Total(in %)
Credit Risk 8,135 4,305 69 0 703 13,212 35Market Risk 5,674 1,384 1,849 0 5,277 14,184 38Operational Risk 9,365 1,501 644 0 0 11,511 31Business Risk 6,292 136 282 0 87 6,797 18Diversification Benefit1 (6,487) (1,115) (492) 0 (345) (8,440) (23)Total EC 22,978 6,210 2,353 0 5,722 37,263 100Total EC (in %) 62 17 6 0 15 100 N/MN/M – Not meaningful1 Diversification benefit across credit, market, operational and strategic risk (largest part of business risk).
Dec 31, 20161
in € m.(unless stated otherwise)
Corporate & Investment
Bank
Private & Commercial
Bank
DeutscheAsset
Management
Non-Core Operations
Unit
Consoli-dation &
Adjustments and Other Total
Total(in %)
Credit Risk 8,185 4,308 62 108 442 13,105 37Market Risk 5,341 1,712 2,197 332 5,009 14,593 41Operational Risk 8,330 1,437 561 160 0 10,488 30Business Risk 4,753 32 100 245 (32) 5,098 14Diversification Benefit2 (6,008) (1,039) (441) (110) (248) (7,846) (22)Total EC 20,601 6,450 2,479 735 5,171 35,438 100Total EC (in %) 58 18 7 2 15 100 N/MN/M – Not meaningful1 Amounts allocated to the business segments have been restated to reflect comparatives according to the structure as of September 30, 2017.2 Diversification benefit across credit, market, operational and strategic risk (largest part of business risk).
Corporate & Investment Bank’s (CIB) risk profile is dominated by its trading in support of origination, structuring and marketmaking activities, which gives rise to market risk and credit risk. The vast majority of its risk relates to credit risk in the TradeFinance and Corporate Finance businesses, while other businesses attract low to no credit risk. The share of the operationalrisk in CIB’s risk profile reflects a high loss profile in the industry combined with internal losses and has increased compared tothe year-end 2016. The remainder of CIB’s risk profile is derived from business risk reflecting earnings volatility risk. Market riskmainly results from modelling of client deposits and trading. The economic capital usage for business risk increased in the firstnine months mainly due to a higher economic capital usage for the strategic risk component.
Private & Commercial Bank’s (PCB) risk profile comprises credit risk from retail, small and medium-sized enterprises (SMEs)lending and wealth management (WM) activities as well as nontrading market risk from investment risk, modelling of clientdeposits and credit spread risk. The economic capital usage for market risk decreased in the first nine months mainly due to alower nontrading market risk component.
The main risk driver of Deutsche Asset Management’s (Deutsche AM) business are guarantees on investment funds, which wereport as nontrading market risk. Otherwise Deutsche AM’s advisory and commission focused business attracts primarily opera-tional risk. The economic capital usage for market risk decreased compared to the year-end 2016 mainly due to a lower non-trading market risk component.
The Non-Core Operations Unit (NCOU) portfolio included activities that are non-core to the Bank’s future strategy, assets ear-marked for de-risking, assets suitable for separation, assets with significant capital absorption but low returns, and assets ex-posed to legal risks. NCOU’s risk profile covered risks across the entire range of our operations. The economic capital usageacross all risk types decreased throughout 2016 mainly due to general wind-down of non-strategic assets. The NCOU wasdissolved as of the beginning of 2017 and its assets were reallocated to the other segments.
Consolidation & Adjustments (C&A) mainly comprises nontrading market risk for structural foreign exchange risk, pension riskand equity compensation risk. The economic capital usage for market risk increased compared to the year-end 2016.
31
Deutsche Bank Risk ReportInterim Report as of September 30, 2017 Risk and Capital Performance
Risk and Capital Performance
Regulatory Capital
Capital Adequacy
The calculation of our regulatory capital incorporates the capital requirements following the “Regulation (EU) No 575/2013 onprudential requirements for credit institutions and investment firms” (Capital Requirements Regulation or “CRR”) and the “Di-rective 2013/36/EU on access to the activity of credit institutions and the prudential supervision of credit institutions and invest-ment firms” (Capital Requirements Directive 4 or “CRD 4”) as implemented into German law. The information in this section aswell as in the section “Development of risk-weighted Assets” is based on the regulatory principles of consolidation.
When referring to results according to full application of the final CRR/CRD 4 framework (without consideration of applicabletransitional methodology) we use the term “CRR/CRD 4 fully loaded”. In some cases, CRR/CRD 4 maintains transitional rulesthat had been adopted in earlier capital adequacy frameworks through Basel 2 or Basel 2.5. These relate, e.g., to the riskweighting of certain categories of assets and include rules permitting the grandfathering of equity investments at a risk-weightof 100 %. In this regard, we assume in our CRR/CRD 4 fully loaded methodology for a limited subset of equity positions that theimpact of the expiration of these transitional rules will be mitigated through sales of the underlying assets or other measuresprior to the expiration of the grandfathering provisions by the end of 2017. Starting in the fourth quarter 2017 we will apply a riskweight between 190 % and 370 % determined based on Article 155 CRR under the CRR/CRD 4 fully loaded rules to all ourequity positions.
Capital Instruments
Our Management Board received approval from the 2016 Annual General Meeting to buy back up to 137.9 million shares be-fore the end of April 2021. Thereof 69.0 million shares can be purchased by using derivatives. These authorizations substitutethe authorizations of the previous year. We have received approval from the ECB for share buybacks for 2016 and 2017 ac-cording to CRR/CRD 4 rules. During the period from the 2016 Annual General Meeting until the 2017 Annual General Meeting(May 18, 2017), 14.8 million shares have been purchased, of which 0.2 million shares through exercise of call options. Theshares purchased were used for equity compensation purposes in the same period or are to be used in the upcoming period sothat the number of shares held in Treasury from buybacks was 1.2 million as of the 2017 Annual General Meeting. In the sec-ond quarter prior to the 2017 Annual General Meeting we purchased under the 2016 AGM authorization 27.5 million call optionson Deutsche Bank shares to hedge the risk of a rising share price for upcoming equity compensation liabilities. All options had amaturity of more than 18 months.
The 2017 Annual General Meeting granted our Management Board the approval to buy back up to 206.7 million shares beforethe end of April 2022. Thereof 103.3 million shares can be purchased by using derivatives, this includes 41.3 million derivativeswith a maturity exceeding 18 months. These authorizations substitute the authorizations of the previous year. During the periodfrom the 2017 Annual General Meeting until September 30, 2017, 14.1 million shares were purchased. The shares purchasedwere used for equity compensation purposes in the same period or were to be used in the upcoming period so that the numberof shares held in Treasury from buybacks was 0.4 million as of September 30, 2017.
On March 3, 2017, Deutsche Bank announced a capital increase of up to 687.5 million new shares with subscription rights toexisting shareholders and with the same dividend rights as all other outstanding shares, and completed the capital increase onApril 7, 2017. With the capital increase, the number of common shares of Deutsche Bank AG increased by 687.5 million, from1,379.3 million to 2,066.8 million in early April. The gross proceeds amounted to € 8.0 billion and the net proceeds amounted to€ 7.9 billion. The recognition of the gross proceeds was formally approved by the ECB on July 26, 2017.
Since the 2017 Annual General Meeting, and as of September 30, 2017, authorized capital available to the Management Boardis € 2,560 million (1,000.0 million shares). As of September 30, 2017, the conditional capital against cash stands at€ 512 million (200 million shares). Additional conditional capital for equity compensation amounts to € 51.2 million (20 millionshares).

32
Deutsche Bank 1 – Management ReportInterim Report as of September 30, 2017
Our legacy Hybrid Tier 1 capital instruments (substantially all noncumulative trust preferred securities) are not recognized underfully loaded CRR/CRD 4 rules as Additional Tier 1 capital, mainly because they have no write-down or equity conversion feature.However, they are to a large extent recognized as Additional Tier 1 capital under CRR/CRD 4 transitional provisions and canstill be partially recognized as Tier 2 capital under the fully loaded CRR/CRD 4 rules. During the transitional phase-out periodthe maximum recognizable amount of Additional Tier 1 instruments from Basel 2.5 compliant issuances as of Decem-ber 31, 2012 will be reduced at the beginning of each financial year by 10 % or € 1.3 billion, through 2022. For September 30,2017, this resulted in eligible Additional Tier 1 instruments of € 10.3 billion (i.e. € 4.7 billion newly issued AT1 Notes plus€ 5.6 billion of legacy Hybrid Tier 1 instruments recognizable during the transition period). One legacy Hybrid Tier 1 instrumentwith a notional of € 0.5 billion and an eligible equivalent amount of € 0.5 billion has been called since year-end 2016.€ 5.6 billion of the legacy Hybrid Tier 1 instruments can still be recognized as Tier 2 capital under the fully loaded CRR/CRD 4rules. Additional Tier 1 instruments recognized under fully loaded CRR/CRD 4 rules amounted to € 4.6 billion as of Septem-ber 30, 2017.
The total of our Tier 2 capital instruments as of September 30, 2017 recognized during the transition period under CRR/CRD 4was € 6.0 billion. As of September 30, 2017, there are no further legacy Hybrid Tier 1 instruments that are counted as Tier 2capital under transitional rules. The gross notional value of the Tier 2 capital instruments was € 7.6 billion. No Tier 2 capitalinstrument had been called in the third quarter 2017. Tier 2 instruments recognized under fully loaded CRR/CRD 4 rulesamounted to € 11.6 billion as of September 30, 2017 (including the € 5.6 billion legacy Hybrid Tier 1 capital instruments onlyrecognizable as Additional Tier 1 capital during the transitional period).
Minimum capital requirements and additional capital buffers
The Pillar 1 CET 1 minimum capital requirement applicable to the Group is 4.50 % of risk-weighted assets (RWA). The Pillar 1total capital requirement of 8.00 % demands further resources that may be met with up to 1.50 % Additional Tier 1 capital andup to 2.00 % Tier 2 capital.
In addition to these minimum capital requirements, the following combined capital buffer requirements were phased in starting2016 and will become fully effective from 2019 onwards. The G-SII (“global systemically important institution”) buffer require-ment of 2.00 % CET 1 capital of RWA in 2019 was phased in with 1.00 % in 2017. The capital conservation buffer requirementof 2.50 % CET 1 capital of RWA in 2019 implemented in Section 10c German Banking Act, based on Article 129 CRD 4, wasphased in with 1.25 % in 2017. The institution-specific countercyclical buffer that applies to Deutsche Bank is the weightedaverage of the countercyclical capital buffers that apply in the jurisdictions where our relevant credit exposures are located. Asof September 30, 2017, the countercyclical capital buffer rate was at 0.02 %.
Additionally, Deutsche Bank AG has been classified by BaFin as an “other systemically important institution” (O-SII) with anadditional buffer requirement of 2.00 % that has to be met on a consolidated level. For Deutsche Bank, the O-SII buffer wasintroduced in a first step of 0.66 % in 2017. Unless certain exceptions apply, only the higher of the systemic risk buffer (currentlynot applicable), G-SII buffer and O-SII buffer must be applied. Accordingly, the O-SII buffer requirement was not applicable asper September 30, 2017.
On December 8, 2016, Deutsche Bank was informed by the ECB of its decision regarding prudential minimum capital require-ments for 2017, following the results of the Pillar 2 Supervisory Review and Evaluation Process (SREP) in 2016. The decisionrequires Deutsche Bank to maintain a phase-in CET 1 ratio of at least 9.52 % on a consolidated basis, beginning on January 1,2017. This CET 1 capital requirement comprises the Pillar 1 minimum capital requirement of 4.50 %, the Pillar 2 requirement(SREP Add-on) of 2.75 %, the phase-in capital conservation buffer of 1.25 %, the counter-cyclical buffer (0.02 % as per Sep-tember 30, 2017) and the phase-in G-SII buffer of 1.00 %.
Further information about minimum capital requirements, additional capital buffers as well as Pillar 2 requirements (SREP)applicable to us can be found in our Annual Report 2016.

33
Deutsche Bank Risk ReportInterim Report as of September 30, 2017 Risk and Capital Performance
Development of regulatory capital
Our CRR/CRD 4 Tier 1 capital as of September 30, 2017 amounted to € 60.2 billion, consisting of a Common Equity Tier 1(CET 1) capital of € 51.6 billion and Additional Tier 1 (AT1) capital of € 8.6 billion. The CRR/CRD 4 Tier 1 capital was € 4.7 bil-lion higher than at the end of 2016, driven by an increase in CET 1 capital of € 3.9 billion and an increase in AT1 capital of€ 0.9 billion since year end 2016.
The € 3.9 billion increase of CRR/CRD 4 CET 1 capital was largely the result of the capital raise completed in early April 2017with net proceeds of € 7.9 billion and the reversal of 10 % threshold-related deductions of € 0.4 billion due to the higher capitalbase. These positive effects were then reduced by increased regulatory adjustments due to the higher phase-in rate of 80 % in2017 compared to 60 % in 2016 and negative effects from Currency Translation Adjustments of € 2.3 billion with partially posi-tive foreign exchange counter-effects in capital deduction items. Our positive net income of € 1.7 billion was completely offsetby our dividend and AT1 coupon accrual of € 1.7 billion for the first three quarters of 2017 which is in line with the ECB Decision(EU) (2015/4) on the recognition of interim or year-end profits in CET 1 capital.
The € 0.9 billion increase in CRR/CRD 4 AT1 capital was mainly the result of reduced regulatory adjustments (€ 1.8 billion lowerthan at year end 2016) that were phased out from AT1 capital. These deductions reflect the residual amount of certain CET 1deductions that are subtracted from CET 1 capital under fully loaded rules, but are allowed to reduce AT1 capital during thetransitional period. The phase-in rate for these deductions on the level of CET 1 capital increased to 80 % in 2017 (60 % in2016) and decreased correspondingly on the level of AT1 capital to 20 % in 2017 (40 % in 2016). Our Legacy Hybrid Tier 1instruments recognizable during the transition period were € 0.9 billion lower compared to year end 2016 due to foreign ex-change effects and the call of instruments.
Our fully loaded CRR/CRD 4 Tier 1 capital as of September 30, 2017 was € 53.7 billion, compared to € 46.8 billion at the endof 2016. Our fully loaded CRR/CRD 4 CET 1 capital amounted to € 49.1 billion as of September 30, 2017, compared to€ 42.3 billion as of December 31, 2016. Our fully loaded CRR/CRD 4 Additional Tier 1 capital amounted to € 4.6 billion as perend of September 2017, unchanged compared to year end 2016.
The increase of our fully loaded CET 1 capital of € 6.8 billion compared to year end 2016 capital was largely the result of the€ 7.9 billion net proceeds from the capital raise and the reversal of 10 % threshold-related deductions of € 0.6 billion due to thehigher capital base. Further positive effects of € 0.6 billion resulted from regulatory adjustments from prudential filters (DebtValuation Adjustments and Fair Value Options). These positive effects were partially offset by negative effects from CurrencyTranslation Adjustments of € 2.3 billion with partially positive foreign exchange counter-effects in capital deduction items.

34
Deutsche Bank 1 – Management ReportInterim Report as of September 30, 2017
Transitional template for Regulatory Capital, RWA and Capital Ratios (unaudited)Sep 30, 2017 Dec 31, 2016
in € m. CRR/CRD 4 fully loaded CRR/CRD 4
CRR/CRD 4 fully loaded CRR/CRD 4
Common Equity Tier 1 (CET 1) capital: instruments and reservesCapital instruments and the related share premium accounts 44,981 44,981 37,290 37,290Retained earnings 17,897 17,897 20,113 20,113Accumulated other comprehensive income (loss), net of tax 1,065 1,032 3,708 3,645Independently reviewed interim profits net of any foreseeable charge or dividend1 0 0 (2,023) (2,023)Other 0 36 0 79
Common Equity Tier 1 (CET 1) capital before regulatory adjustments 63,943 63,946 59,088 59,104
Common Equity Tier 1 (CET 1) capital: regulatory adjustmentsAdditional value adjustments (negative amount) (1,182) (1,182) (1,398) (1,398)Other prudential filters (other than additional value adjustments) 88 120 (639) (428)Goodwill and other intangible assets (net of related tax liabilities) (negative amount) (8,219) (6,575) (8,436) (5,062)Deferred tax assets that rely on future profitability excluding those arising from temporarydifferences (net of related tax liabilities where the conditions in Art. 38 (3) CRR are met)(negative amount) (3,774) (3,019) (3,854) (2,312)Negative amounts resulting from the calculation of expected loss amounts (396) (322) (297) (188)Defined benefit pension fund assets (negative amount) (786) (629) (945) (567)Direct, indirect and synthetic holdings by an institution of own CET 1 instruments(negative amount) (51) (43) (59) (41)Direct, indirect and synthetic holdings by the institution of the CET 1 instruments of financialsector entities where the institution has a significant investment in those entities (amountabove the 10 %/15 % thresholds and net of eligible short positions) (negative amount) 0 0 0 0Deferred tax assets arising from temporary differences (net of related tax liabilities wherethe conditions in Art. 38 (3) CRR are met) (amount above the 10 %/15 % thresholds) (nega-tive amount) 0 0 (590) (354)Other regulatory adjustments2 (496) (646) (591) (971)
Total regulatory adjustments to Common Equity Tier 1 (CET 1) capital (14,815) (12,297) (16,810) (11,321)Common Equity Tier 1 (CET 1) capital 49,128 51,650 42,279 47,782
Additional Tier 1 (AT1) capital: instrumentsCapital instruments and the related share premium accounts 4,676 4,676 4,676 4,676Amount of qualifying items referred to in Art. 484 (4) CRR and the related share premiumaccounts subject to phase out from AT1 N/M 5,600 N/M 6,516
Additional Tier 1 (AT1) capital before regulatory adjustments 4,676 10,275 4,676 11,191
Additional Tier 1 (AT1) capital: regulatory adjustmentsDirect, indirect and synthetic holdings by an institution of own AT1 instruments(negative amount) (55) (19) (125) (51)Residual amounts deducted from AT1 capital with regard to deduction from CET 1 capitalduring the transitional period pursuant to Art. 472 CRR N/M (1,684) N/M (3,437)Other regulatory adjustments 0 0 0 0
Total regulatory adjustments to Additional Tier 1 (AT1) capital (55) (1,703) (125) (3,488)Additional Tier 1 (AT1) capital 4,621 8,572 4,551 7,703Tier 1 capital (T1 = CET 1 + AT1) 53,749 60,222 46,829 55,486
Tier 2 (T2) capital 11,633 6,008 12,673 6,672Total capital (TC = T1 + T2) 65,382 66,230 59,502 62,158Total risk-weighted assets 355,113 354,234 357,518 356,235
Capital ratiosCommon Equity Tier 1 capital ratio (as a percentage of risk-weighted assets) 13.8 14.6 11.8 13.4Tier 1 capital ratio (as a percentage of risk-weighted assets) 15.1 17.0 13.1 15.6Total capital ratio (as a percentage of risk-weighted assets) 18.4 18.7 16.6 17.4N/M – Not meaningful1 No interim profits to be recognized in accordance with the ECB decision (EU) (2015/4).2 Including an additional capital deduction of € 0.3 billion that was imposed on Deutsche Bank effective from October 2016 onwards based on a notification by the ECB pursuant
to Article 16(1)(c), 16(2)(b) and (j) of Regulation (EU) No 1024/2013 as well as the additional filter for funds for home loans and savings protection (“Fonds für bauspartech-nische Absicherung”) of € 0.2 billion.

35
Deutsche Bank Risk ReportInterim Report as of September 30, 2017 Risk and Capital Performance
Reconciliation of shareholders’ equity to regulatory capital Sep 30, 2017 Dec 31, 2016
in € m. CRR/CRD 4 CRR/CRD 4Total shareholders’ equity per accounting balance sheet 65,676 59,833Deconsolidation/Consolidation of entities (68) (123)
Thereof:Additional paid-in capital (7) (6)Retained earnings (225) (276)Accumulated other comprehensive income (loss), net of tax 164 159
Total shareholders’ equity per regulatory balance sheet 65,607 59,710Noncontrolling interest based on transitional rules 36 79Accrual for dividend and AT1 coupons1 (1,664) (621)Reversal of deconsolidation/consolidation of the position accumulated other comprehensive income (loss), net oftax, during transitional period (33) (63)Common Equity Tier 1 (CET 1) capital before regulatory adjustments 63,946 59,104Prudential filters (1,212) (2,206)
Thereof:Additional value adjustments (1,182) (1,398)Any increase in equity that results from securitized assets (2) (5)Fair value reserves related to gains or losses on cash flow hedges and gains or losses on liabilities designated atfair value resulting from changes in own credit standing 122 (423)Regulatory adjustments relating to unrealized gains and losses pursuant to Art. 467 and 468 CRR (151) (380)
Regulatory adjustments (11,085) (9,115)Thereof:Goodwill and other intangible assets (net of related tax liabilities) (6,575) (5,062)Deferred tax assets that rely on future profitability (3,019) (2,666)Negative amounts resulting from the calculation of expected loss amounts (322) (188)Defined benefit pension fund assets (629) (567)Direct, indirect and synthetic holdings by the institution of the CET 1 instruments of financial sector entities wherethe institution has a significant investment in those entities 0 0Securitization positions not included in risk-weighted assets 0 0Other (539) (632)
Common Equity Tier 1 capital 51,650 47,782
Additional Tier 1 capital 8,572 7,703Additional Tier 1 Notes (AT1 Notes) 4,657 4,625
Per balance sheet 4,669 4,669Deconsolidation/Consolidation of entities 0 0Regulatory adjustments to balance sheet position (12) (45)
Hybrid capital securities 5,585 6,500Per balance sheet 5,583 6,373Deconsolidation/Consolidation of entities 269 301Regulatory adjustments to balance sheet position (267) (174)
Thereof:Amount excluded from Additional Tier 1 due to cap 0 0Other (267) (174)
Other regulatory adjustments 15 16Deductions from Additional Tier 1 capital (1,684) (3,437)
Tier 1 capital 60,222 55,486
Tier 2 capital 6,008 6,672Subordinated debt 5,763 6,447
Per balance sheet 7,357 7,762Deconsolidation/Consolidation of entities 0 0Regulatory adjustments to balance sheet position (1,594) (1,315)
Thereof:Amortization according to Art. 64 CRR (1,009) (1,027)Other (585) (288)
Other regulatory adjustments 285 288Thereof:Inclusion of amount excluded from Additional Tier 1 due to cap 0 0Other 285 288
Deductions from Tier 2 capital (40) (63)
Total capital 66,230 62,1581 No interim profits to be recognized in accordance with the ECB decision (EU) (2015/4).

36
Deutsche Bank 1 – Management ReportInterim Report as of September 30, 2017
Development of Risk-weighted Assets
The tables below provide an overview of RWA broken down by risk type and business division. They include the aggregatedeffects of the segmental reallocation of infrastructure related positions, if applicable, as well as reallocations between the seg-ments.
Risk-weighted Assets by Risk Type and Business Division Sep 30, 2017
in € m.
Corporate &Investment
Bank
Private & Commercial
Bank
DeutscheAsset
Management
Non-CoreOperations
Unit
Consolidation & Adjustments
and Other TotalCredit Risk 118,135 75,155 3,731 0 14,891 211,912Settlement Risk 11 0 0 0 0 11Credit Valuation Adjustment (CVA) 6,486 237 160 0 4 6,887Market Risk 35,707 74 0 0 0 35,781Operational Risk 81,069 12,996 5,579 0 0 99,643Total 241,407 88,461 9,470 0 14,895 354,234
Dec 31, 2016
in € m.
Corporate &Investment
Bank
Private & Commercial
Bank
DeutscheAsset
Management
Non-CoreOperations
Unit
Consolidation & Adjustments
and Other TotalCredit Risk 124,274 72,735 3,756 4,075 15,505 220,345Settlement Risk 36 0 0 0 0 36Credit Valuation Adjustment (CVA) 8,886 294 139 90 8 9,416Market Risk 30,198 62 0 3,502 0 33,762Operational Risk 73,610 12,696 4,957 1,413 0 92,675Total 237,003 85,788 8,853 9,079 15,512 356,235
The RWA according to CRR/CRD 4 were € 354.2 billion as of September 30, 2017, compared to € 356.2 billion at the end of2016. The decrease of € 2.0 billion was driven by FX movements of € 9.8 billion as well as € 2.5 billion decrease in CVA RWAfrom the de-risking of the portfolio, which was partly offset by an € 7.0 billion increase in operational risk RWA primarily as aresult of a model update. Furthermore, market risk RWA increased by € 2.0 billion mainly due to higher IRC driven by reducedhedges, higher securitization inventory and counterparty defaults, and credit risk RWA increased by € 0.5 billion excluding theaforementioned FX effect.
RWA according to CRR/CRD 4 fully-loaded were € 355.1 billion as of September 30, 2017 compared with € 357.5 billion at theend of 2016. The decrease was driven by the same movements as outlined for transitional rules. The fully loaded RWA were€ 0.9 billion higher than the risk-weighted assets under the transitional rules due to the below explained application of the equityinvestment grandfathering rule according to Article 495 CRR.
Our portfolio of transactions, for which we will continue to apply the equity investment grandfathering rule until year end 2017,consisted of 9 transactions in 2017 amounting to € 153 million which will receive a 100 % risk weight instead of a risk weightbetween 190 % and 370 % determined based on Article 155 CRR in our CRR/CRD 4 fully loaded RWA number as we expectto sell the underlying assets by the end of 2017. We are closely monitoring the market and potential impacts from illiquidmarkets or other similar difficulties which could delay or make it unfeasible to exit all positions by end of 2017. Starting in thefourth quarter 2017 we will apply a risk weight between 190 % and 370 % determined based on Article 155 CRR under theCRR/CRD 4 fully loaded rules to all our equity positions.
The tables below provide an analysis of key drivers for risk-weighted asset movements observed for credit, market, operationalrisk and the credit valuation adjustment in the reporting period.
Development of Risk-weighted Assets for Credit RiskNine months ended
Sep 30, 2017Twelve months ended
Dec 31, 2016
in € m. Credit risk RWACapital
requirements Credit risk RWACapital
requirementsCredit risk RWA balance as at end of previous reporting period 220,345 17,628 242,019 19,362Book size 2,574 206 (8,085) (647)Book quality (3,019) (242) (3,827) (306)Model updates 1,487 119 2,328 186Methodology and Policy 0 0 (1,280) (102)Acquisition and Disposals 0 0 (12,701) (1,016)Foreign exchange movements (8,970) (718) 350 28Other (505) (40) 1,539 123Credit risk RWA balance as at end of current reporting period 211,912 16,953 220,345 17,628

37
Deutsche Bank Risk ReportInterim Report as of September 30, 2017 Risk and Capital Performance
Thereof: Development of Risk-weighted Assets for Counterparty Credit RiskNine months ended
Sep 30, 2017Twelve months ended
Dec 31, 2016
in € m. Counterparty credit risk RWA
Capital requirements
Counterparty credit risk RWA
Capital requirements
Counterparty credit risk RWA balance as at end of previous reporting period 35,614 2,849 37,276 2,982Book size (3,792) (303) (2,740) (219)Book quality (63) (5) 511 41Model updates 1,487 119 1,439 115Methodology and Policy 0 0 (60) (5)Acquisition and Disposals 0 0 (707) (57)Foreign exchange movements (1,780) (142) (106) (8)Other 0 0 0 0Counterparty credit risk RWA balance as at end of current reporting period 31,466 2,517 35,614 2,849
The classifications of key drivers for the RWA credit risk development table are fully aligned with the recommendations of theEnhanced Disclosure Task Force (EDTF). Organic changes in our portfolio size and composition are considered in the category“book size”. The category “book quality” mainly represents the effects from portfolio rating migrations, loss given default, modelparameter recalibrations as well as collateral coverage activities. “Model updates” include model refinements and advancedmodel roll out. RWA movements resulting from externally, regulatory-driven changes, e.g. applying new regulations, are con-sidered in the “methodology and policy” section. “Acquisition and disposals” is reserved to show significant exposure move-ments which can be clearly assigned to new businesses or disposal-related activities. Changes that cannot be attributed to theabove categories are reflected in the category “other”.
The decrease in RWA for credit risk by 3.8 % or € 8.4 billion since December 31, 2016 is primarily driven by the decrease in thecategory “foreign exchange movements” from the weakening USD. The decrease in the category “book quality” primarily re-flects improvements in our loss given default and probability of default parameters for our loan related portfolio. The increase inthe category “model updates” represents a change in the modelling of our derivatives portfolio slightly offset by a revised treat-ment of specific derivatives portfolios in combination with their period of risk. The material increase in the category “book size”represents predominantly increases in our loan and securities related portfolio partly offset by reductions in our counterpartycredit risk portfolio driven by risk optimization initiatives and process improvements. The slight decrease in the category “Other”reflects mainly the revised treatment of our grandfathered equity related portfolio according to Article 495 CRR.
Development of Risk-weighted Assets for Credit Valuation AdjustmentNine months ended
Sep 30, 2017Twelve months ended
Dec 31, 2016
in € m. CVA RWACapital
requirements CVA RWACapital
requirementsCVA RWA balance as at end of previous reporting period 9,416 753 15,877 1,270Movement in risk levels (2,264) (181) (5,600) (448)Market data changes and recalibrations 0 0 278 22Model updates 0 0 (1,000) (80)Methodology and policy 290 23 0 0Acquisitions and disposals 0 0 0 0Foreign exchange movements (555) (44) (139) (11)CVA RWA balance as at end of current reporting period 6,887 551 9,416 753
Based on the CRR/CRD 4 regulatory framework, we are required to calculate RWA using the CVA which takes into account thecredit quality of our counterparties. RWA for CVA covers the risk of mark-to-market losses on the expected counterparty risk inconnection with OTC derivative exposures. We calculate the majority of the CVA based on our own internal model as approvedby the BaFin. As of September 30, 2017, the RWA for CVA amounted to € 6.9 billion, representing a decrease of € 2.5 billion(27 %) compared with € 9.4 billion for December 31, 2016. The overall reduction was driven by de-risking of the portfolio andcurrency effects with some offset from Methodology changes.

38
Deutsche Bank 1 – Management ReportInterim Report as of September 30, 2017
Development of Risk-weighted Assets for Market RiskNine months ended
Sep 30, 2017
in € m. VaR SVaR IRC CRM Other Total RWA Total capital requirements
Market risk RWA balance as at end of previousreporting period 5,957 14,271 8,662 273 4,599 33,762 2,701
Movement in risk levels (680) 161 3,159 (188) 747 3,199 256Market data changes and recalibrations 194 0 0 0 701 895 72Model updates/changes 207 (599) (1,390) 0 0 (1,782) (143)Methodology and policy 0 0 0 0 0 0 0Acquisitions and disposals 0 0 0 0 0 0 0Foreign exchange movements 0 0 0 0 (294) (294) (24)Other 0 0 0 0 0 0 0
Market risk RWA balance as at end of currentreporting period 5,678 13,833 10,431 86 5,753 35,781 2,862
Twelve months endedDec 31, 2016
in € m. VaR SVaR IRC CRM Other Total RWA Total capital requirements
Market risk RWA balance as at end of previousreporting period 6,931 17,146 11,608 2,378 11,491 49,553 3,964
Movement in risk levels (655) (1,547) (2,716) (3,553) (8,852) (17,323) (1,386)Market data changes and recalibrations 403 0 0 0 2,018 2,421 194Model updates/changes (57) 237 (230) 0 0 (50) (4)Methodology and policy (665) (1,565) 0 1,475 0 (754) (60)Acquisitions and disposals 0 0 0 0 0 0 0Foreign exchange movements 0 0 0 (27) (58) (84) (7)Other 0 0 0 0 0 0 0
Market risk RWA balance as at end of currentreporting period 5,957 14,271 8,662 273 4,599 33,762 2,701
The analysis for market risk covers movements in our internal models for value-at-risk, stressed value-at-risk, incremental riskcharge and comprehensive risk measure as well as results from the market risk standardized approach, which are captured inthe table under the category “Other”. The market risk standardized approach covers trading securitizations and nth-to-defaultderivatives, longevity exposures, relevant Collective Investment Undertakings and market risk RWA from Postbank.
The market risk RWA movements due to changes in market data levels, volatilities, correlations, liquidity and ratings are includ-ed under the “market data changes and recalibrations category”. Changes to our market risk RWA internal models, such asmethodology enhancements or risk scope extensions, are included in the category of “model updates”. In the “methodology andpolicy” category we reflect regulatory driven changes to our market risk RWA models and calculations. Significant new busi-nesses and disposals would be assigned to the line item “Acquisition and disposals”. The impacts of Foreign exchange move-ments are only calculated for the CRM and Standardized approach methods.
As of September 30, 2017, the RWA for market risk was € 35.8 billion which increased by € 2.0 billion (6.0 %) since Decem-ber 31, 2016. The increase was driven by the "Movement in risk levels" category primarily from the incremental risk chargecomponent. The increase was partly offset by a reduction in the "Model updates/changes" category driven by the stressedvalue-at-risk and incremental risk charge components.
Development of Risk-weighted Assets for Operational RiskNine months ended
Sep 30, 2017Twelve months ended
Dec 31, 2016
in € m. Operational risk
RWACapital
requirements Operational risk
RWACapital
requirementsOperational risk RWA balance as at end of previous reporting period 92,675 7,414 89,923 7,194Loss profile changes (internal and external) 3,429 274 7,048 564Expected loss development (223) (18) (1,798) (144)Forward looking risk component (505) (40) (1,140) (91)Model updates 4,267 341 (358) (29)Methodology and policy 0 0 (1,000) (80)Acquisitions and disposals 0 0 0 0Operational risk RWA balance as at end of current reporting period 99,643 7,971 92,675 7,414
Changes to internal and external loss events are reflected in the category “loss profile changes”. The category “expected lossdevelopment” is based on divisional business plans, as well as historical losses, and is deducted from the AMA capital figurewithin certain constraints. The category “forward looking risk component” reflects qualitative adjustments and, as such, theeffectiveness and performance of day-to-day operational risk management activities via, Key Risk Indicators and Self-Assessment scores, focusing on the business environment and internal control factors. The category “model updates” coversmodel refinements such as the implementation of model changes. The category “methodology and policy” represents externally

39
Deutsche Bank Risk ReportInterim Report as of September 30, 2017 Risk and Capital Performance
driven changes such as regulatory add-ons. The category “acquisition and disposals” represents significant exposure move-ments that can be clearly assigned to new or disposed businesses.
The overall RWA increase of € 7.0 billion was driven by a moderate increase in large operational risk events, which are reflect-ed in our AMA model as part of “loss profile changes”, in particular through settlements of regulatory matters by financial institu-tions. In the first quarter 2017, we had also implemented a “model update” regarding an enhanced scoring mechanism for theSelf-Assessment results in conjunction with the replacement of the existing Self-Assessment process by our enhanced Riskand Control Assessment process. This allowed us to decommission the add-on we held for this model change.
Further impacts from the AMA model enhancements on the other operational risk RWA components are expected to material-ize alongside the implementation of the remaining model changes recently approved by our Joint Supervisory Team.
Economic Capital
Internal Capital Adequacy
As the primary measure of our Internal Capital Adequacy Assessment Process (ICAAP) we assess our internal capital adequa-cy based on our “gone concern approach” as the ratio of our total capital supply divided by our total capital demand as shown inthe table below.
Total capital supply and demandin € m.(unless stated otherwise) Sep 30, 2017 Dec 31, 2016Capital Supply
Shareholders’ Equity 65,676 59,833Fair value gains on own debt and debt valuation adjustments, subject to own credit risk1 129 (440)Defined benefit pension fund assets2 (786) (945)Deferred Tax Assets (7,829) (8,666)Additional valuation adjustments3 (1,182) (1,398)Expected Loss Shortfall (396) (297)Home loans and savings protection (150) (231)Holdings of own capital instruments (39) (45)Fair value adjustments for assets where no matched funding is available4 (493) (557)Noncontrolling Interests5 0 0Intangible assets (8,773) (8,982)Hybrid Tier 1 capital instruments 10,288 11,259Tier 2 capital instruments 7,552 8,003
Capital Supply 63,996 57,534
Total economic capital requirementCredit risk 13,212 13,105Market risk 14,184 14,593Operational risk 11,511 10,488Business risk 6,797 5,098Diversification benefit (8,440) (7,846)
Capital Demand 37,263 35,438
Internal Capital Adequacy Ratio in % 172 1621 Includes deduction of fair value gains on own credit-effect relating to own liabilities designated under the fair value option as well as the debt valuation adjustments.2 Reported as net assets (assets minus liabilities) of a defined pension fund, i.e. applicable for overfunded pension plans.3 As applied in the regulatory capital section.4 Includes fair value adjustments for assets reclassified in accordance with IAS 39 and for banking book assets where no matched funding is available. A positive adjustment is
not considered.5 Includes noncontrolling interest up to the economic capital requirement for each subsidiary.
A ratio of more than 100 % signifies that the total capital supply is sufficient to cover the capital demand determined by the riskpositions. This ratio was 172 % as of September 30, 2017, compared with 162 % as of December 31, 2016. The change of theratio was due to an increase in capital supply and increase in capital demand. The Capital Supply increased by € 6.5 billionmainly driven by an increase of Shareholders’ Equity. The increase in capital demand was driven by higher economic capitalusage as explained in the section “Risk Profile”.
The above capital adequacy measures apply to the consolidated Group as a whole (including Postbank) and form an integralpart of our Risk and Capital Management framework.

40
Deutsche Bank 1 – Management ReportInterim Report as of September 30, 2017
Leverage RatioWe manage our balance sheet on a Group level and, where applicable, locally in each region. In the allocation of financialresources we favor business portfolios with the highest positive impact on our profitability and shareholder value. We monitorand analyze balance sheet developments and track certain market-observed balance sheet ratios. Based on this we triggerdiscussion and management action by the Group Risk Committee (GRC). Following the publication of the CRR/CRD 4 frame-work, we established a leverage ratio calculation according to that framework.
Leverage Ratio according to revised CRR/CRD 4 framework
The CRR/CRD 4 framework introduced a non-risk based leverage ratio that is intended to act as a supplementary measure tothe risk based capital requirements. Its objectives are to constrain the build-up of leverage in the banking sector, helping avoiddestabilizing deleveraging processes which can damage the broader financial system and the economy, and to reinforce therisk based requirements with a simple, non-risk based “backstop” measure. While the CRR/CRD 4 framework currently doesnot provide for a mandatory minimum leverage ratio to be complied with by the relevant financial institutions, a legislative pro-posal published by the European Commission on November 23, 2016 suggests introducing a minimum leverage ratio of 3 %.The legislative proposal provides that the leverage ratio would apply two years after the proposal’s entry into force and remainssubject to political discussion among EU institutions.
We calculate our leverage ratio exposure on a fully loaded basis in accordance with Article 429 of the CRR as per DelegatedRegulation (EU) 2015/62 of October 10, 2014 published in the Official Journal of the European Union on January 17, 2015amending Regulation (EU) No 575/2013. In addition we provide the leverage ratio on a phase-in basis as displayed below in thetables.
Our total leverage ratio exposure consists of the components derivatives, securities financing transactions (SFTs), off-balancesheet exposure and other on-balance sheet exposure (excluding derivatives and SFTs).
The leverage exposure for derivatives is calculated by using the regulatory mark-to-market method for derivatives comprisingthe current replacement cost plus a regulatory defined add-on for the potential future exposure. Variation margin received incash from counterparties is deducted from the current replacement cost portion of the leverage ratio exposure measure andvariation margin paid to counterparties is deducted from the leverage ratio exposure measure related to receivables recognizedas an asset on the balance sheet, provided certain conditions are met. Deductions of Receivables for cash variation marginprovided in derivatives transactions are shown under derivative exposure in the table “Leverage ratio common disclosure”below. The effective notional amount of written credit derivatives, i.e., the notional reduced by any negative fair value changesthat have been incorporated in Tier 1 capital is included in the leverage ratio exposure measure; the resulting exposure meas-ure is further reduced by the effective notional amount of a purchased credit derivative on the same reference name providedcertain conditions are met.
The securities financing transaction (SFT) component includes the gross receivables for SFTs, which are netted with SFT pay-ables if specific conditions are met. In addition to the gross exposure a regulatory add-on for the counterparty credit risk isincluded.
The off-balance sheet exposure component follows the credit risk conversion factors (CCF) of the standardized approach forcredit risk (0 %, 20 %, 50 %, or 100 %), which depend on the risk category subject to a floor of 10 %.
The other on-balance sheet exposure component (excluding derivatives and SFTs) reflects the accounting values of the assets(excluding derivatives and SFTs) as well as regulatory adjustments for asset amounts deducted in determining Tier 1 capital.
The following tables show the leverage ratio exposure and the leverage ratio, both on a fully loaded basis, in accordance withthe disclosure tables of the implementing technical standards (ITS) which were adopted by the European Commission viaCommission Implementing Regulation (EU) 2016/200 published in the Official Journal of the European Union on February 16,2016. For additional information, they also contain the phase-in figures.

41
Deutsche Bank Risk ReportInterim Report as of September 30, 2017 Leverage Ratio
Summary reconciliation of accounting assets and leverage ratio exposuresin € bn. Sep 30, 2017 Dec 31, 2016Total assets as per published financial statements 1,521 1,591
Adjustment for entities which are consolidated for accounting purposes but are outside the scope ofregulatory consolidation 1 0Adjustments for derivative financial instruments (180) (276)Adjustment for securities financing transactions (SFTs) 30 20Adjustment for off-balance sheet items (i.e. conversion to credit equivalent amounts of off-balancesheet exposures) 93 102Other adjustments (45) (90)
Leverage ratio total exposure measure (fully loaded) 1,420 1,348
Leverage ratio total exposure measure (phase-in) 1,421 1,350
Leverage ratio common disclosurein € bn.(unless stated otherwise) Sep 30, 2017 Dec 31, 2016Total derivative exposures 175 177Total securities financing transaction exposures 157 135Total off-balance sheet exposures 93 102Other Assets 1,010 948Asset amounts deducted in determining Tier 1 capital1 (14) (15)
Tier 1 capital (fully loaded) 53.7 46.8Leverage ratio total exposure measure (fully loaded) 1,420 1,348Leverage ratio (fully loaded, in %) 3.8 3.5
Tier 1 capital (phase-in) 60.2 55.5Leverage ratio total exposure measure (phase-in) 1,421 1,350Leverage ratio (phase-in, in %) 4.2 4.11 Using a fully loaded definition of Tier 1 capital. The amount using a transitional definition of Tier 1 capital is € (13) billion and € (13) billion as of September 30, 2017 and
December 31, 2016, respectively.
Description of the factors that had an impact on the leverage ratio in the first ninemonths 2017
As of September 30, 2017, our fully loaded CRR/CRD 4 leverage ratio was 3.8 % compared to 3.5 % as of December 31, 2016,taking into account as of September 30, 2017 a fully loaded Tier 1 capital of € 53.7 billion over an applicable exposure measureof € 1,420 billion (€ 46.8 billion and € 1,348 billion as of December 31, 2016, respectively).
Our CRR/CRD 4 leverage ratio according to transitional provisions was 4.2 % as of September 30, 2017 (4.1 % as of Decem-ber 31, 2016), calculated as Tier 1 capital according to transitional rules of € 60.2 billion over an applicable exposure measureof € 1,421 billion (€ 55.5 billion and € 1,350 billion as of December 31, 2016, respectively). The exposure measure under transi-tional rules is € 1 billion (€ 2 billion as of December 31, 2016) higher compared to the fully loaded exposure measure as theasset amounts deducted in determining Tier 1 capital are lower under transitional rules.
Based on recent ECB guidance, we have included pending settlements in the calculation of the leverage exposure since thesecond quarter 2017 based on the asset values as recorded for financial accounting purposes, i.e., for Deutsche Bank Groupunder IFRS, trade date accounting. The application of trade date accounting leads to a temporary increase of the leverageexposure between trade date and settlement date for regular way asset purchases. The size of the reported increase was€ 64 billion at September 30, 2017. It should be noted that under the proposed revision of the Capital Requirement Regulation(“CRR”) as currently drafted this increase would materially reverse out once the revision becomes effective given it allows forthe offsetting of pending settlement cash payables and cash receivables for regular way purchases and sales that are settledon a delivery-versus-payment basis.
In the first nine months of 2017, our leverage ratio exposure increased by € 73 billion to € 1,420 billion. This is primarily drivenby the € 62 billion increase in Other Assets which in addition to the above mentioned pending settlements also reflects thedevelopment on our balance sheet, in particular increases in cash and central bank balances and non-derivative trading assets,partly offset by a decrease in loans. Furthermore, there was an increase of € 22 billion in SFT exposures reflecting the overallgrowth on the balance sheet in the SFT related items (securities purchased under resale agreements and securities borrowed,under accrual and fair value accounting as well as receivables from prime brokerage). Derivative exposures slightly decreasedby € 2 billion. In addition, off-balance sheet exposures decreased by € 9 billion corresponding to lower notional amounts forirrevocable lending commitments and contingent liabilities.

42
Deutsche Bank 1 – Management ReportInterim Report as of September 30, 2017
The increase of the leverage ratio exposure in the first nine months of 2017 includes a negative foreign exchange impact of€ 71 billion mainly due to the appreciation of the Euro against the U.S. dollar.
Our leverage ratio calculated as the ratio of total assets under IFRS to total equity under IFRS was 22 as of September 30, 2017compared to 25 as of December 31, 2016.
For main drivers of the Tier 1 capital development please refer to section “Regulatory Capital” in this report.
Credit Risk Exposure
Credit Exposure Classifications
We classify our credit exposure under two broad headings: corporate credit exposure and consumer credit exposure.
Our consumer credit exposure consists of our smaller-balance standardized homogeneous loans, primarily in Germany, Italyand Spain. It includes personal loans, residential and non-residential mortgage loans, overdrafts and loans to self-employedand small business customers of our private and retail businesses.Our corporate credit exposure consists of all exposures not defined as consumer credit exposure.
Corporate Credit Exposure
Main corporate credit exposure categories according to our internal creditworthiness categories of our counterparties Sep 30, 2017
in € m.Probabilityof default1 Loans
Irrevocablelending
commitments2Contingent
liabilitiesOTC
derivatives3 Debt securities4 TotaliAAA–iAA 0.00–0.04 % 37,999 18,511 5,088 12,581 41,919 116,098iA 0.04–0.11 % 38,423 38,310 12,618 8,513 6,188 104,051iBBB 0.11–0.50 % 56,117 50,243 15,536 5,653 1,935 129,484iBB 0.50–2.27 % 40,514 25,580 7,697 4,087 518 78,396iB 2.27–10.22 % 21,919 17,596 3,730 1,291 34 44,570iCCC and below 10.22–100 % 14,098 3,049 1,821 383 9 19,360Total 209,069 153,288 46,490 32,508 50,604 491,9601 Reflects the probability of default for a one year time horizon.2 Includes irrevocable lending commitments related to consumer credit exposure of € 10.7 billion as of September 30, 2017.3 Includes the effect of netting agreements and cash collateral received where applicable.4 Includes debt securities on financial assets available for sale and held to maturity.
Dec 31, 2016
in € m.Probabilityof default1 Loans
Irrevocablelending
commitments2Contingent
liabilitiesOTC
derivatives3 Debt securities4 TotaliAAA–iAA 0.00–0.04 % 43,149 21,479 5,699 16,408 46,014 132,749iA 0.04–0.11 % 39,734 45,635 13,712 12,566 6,616 118,264iBBB 0.11–0.50 % 57,287 47,480 16,753 8,300 1,696 131,515iBB 0.50–2.27 % 46,496 29,274 9,663 5,333 366 91,132iB 2.27–10.22 % 22,920 18,173 4,477 1,053 9 46,631iCCC and below 10.22–100 % 15,069 4,022 2,038 533 21 21,683Total 224,655 166,063 52,341 44,193 54,722 541,9741 Reflects the probability of default for a one year time horizon.2 Includes irrevocable lending commitments related to consumer credit exposure of € 10.3 billion as of December 31, 2016.3 Includes the effect of netting agreements and cash collateral received where applicable.4 Includes debt securities on financial assets available for sale and held to maturity.
The above table shows an overall decrease of € 50.0 billion or 9 % in our corporate credit exposure in the first nine monthsof 2017. The quality of the corporate credit exposure before risk mitigation remained stable at 71 % of investment-grade ratedexposures.
The decrease in Corporate Credit Exposure from December 2016 to September 2017 is mainly attributable to loans (decreaseof € 15.6 billion or 7 %), Irrevocable lending commitments (decrease of € 12.8 billion or 8 %) and OTC derivatives (decrease of€ 11.7 billion or 26 %). The decrease in loan exposure is mainly driven by FX rate movements, which were also the major driverfor the decrease in irrevocable lending commitments. The decrease in OTC derivatives is mainly attributable to foreign ex-change rate products primarily driven by lower volatility and decline in customer flows, as well as interest rate products aschanges in interest rate curves were inversely correlated to changes in the mark-to-market values.
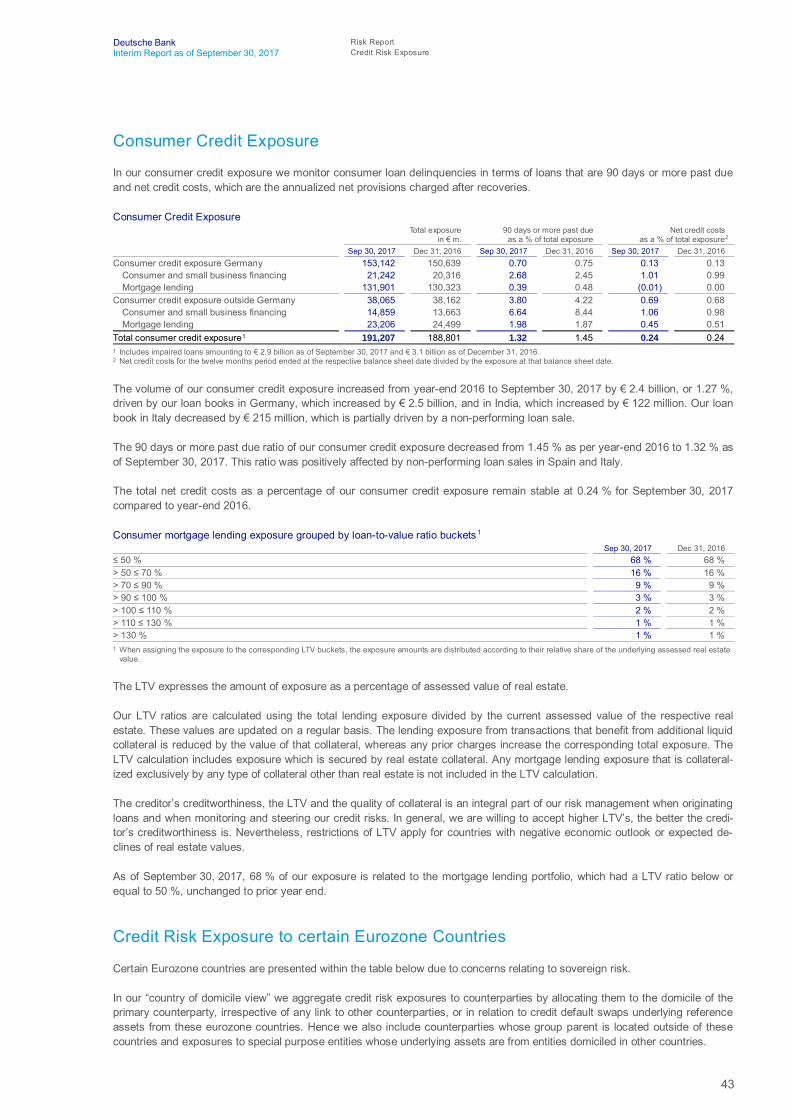
43
Deutsche Bank Risk ReportInterim Report as of September 30, 2017 Credit Risk Exposure
Consumer Credit Exposure
In our consumer credit exposure we monitor consumer loan delinquencies in terms of loans that are 90 days or more past dueand net credit costs, which are the annualized net provisions charged after recoveries.
Consumer Credit ExposureTotal exposure
in € m.90 days or more past due
as a % of total exposureNet credit costs
as a % of total exposure2
Sep 30, 2017 Dec 31, 2016 Sep 30, 2017 Dec 31, 2016 Sep 30, 2017 Dec 31, 2016Consumer credit exposure Germany 153,142 150,639 0.70 0.75 0.13 0.13
Consumer and small business financing 21,242 20,316 2.68 2.45 1.01 0.99Mortgage lending 131,901 130,323 0.39 0.48 (0.01) 0.00
Consumer credit exposure outside Germany 38,065 38,162 3.80 4.22 0.69 0.68Consumer and small business financing 14,859 13,663 6.64 8.44 1.06 0.98Mortgage lending 23,206 24,499 1.98 1.87 0.45 0.51
Total consumer credit exposure1 191,207 188,801 1.32 1.45 0.24 0.241 Includes impaired loans amounting to € 2.9 billion as of September 30, 2017 and € 3.1 billion as of December 31, 2016.2 Net credit costs for the twelve months period ended at the respective balance sheet date divided by the exposure at that balance sheet date.
The volume of our consumer credit exposure increased from year-end 2016 to September 30, 2017 by € 2.4 billion, or 1.27 %,driven by our loan books in Germany, which increased by € 2.5 billion, and in India, which increased by € 122 million. Our loanbook in Italy decreased by € 215 million, which is partially driven by a non-performing loan sale.
The 90 days or more past due ratio of our consumer credit exposure decreased from 1.45 % as per year-end 2016 to 1.32 % asof September 30, 2017. This ratio was positively affected by non-performing loan sales in Spain and Italy.
The total net credit costs as a percentage of our consumer credit exposure remain stable at 0.24 % for September 30, 2017compared to year-end 2016.
Consumer mortgage lending exposure grouped by loan-to-value ratio buckets1
Sep 30, 2017 Dec 31, 2016 50 % 68 % 68 %
> 50 70 % 16 % 16 %> 70 90 % 9 % 9 %> 90 100 % 3 % 3 %> 100 110 % 2 % 2 %> 110 130 % 1 % 1 %> 130 % 1 % 1 %1 When assigning the exposure to the corresponding LTV buckets, the exposure amounts are distributed according to their relative share of the underlying assessed real estate
value.
The LTV expresses the amount of exposure as a percentage of assessed value of real estate.
Our LTV ratios are calculated using the total lending exposure divided by the current assessed value of the respective realestate. These values are updated on a regular basis. The lending exposure from transactions that benefit from additional liquidcollateral is reduced by the value of that collateral, whereas any prior charges increase the corresponding total exposure. TheLTV calculation includes exposure which is secured by real estate collateral. Any mortgage lending exposure that is collateral-ized exclusively by any type of collateral other than real estate is not included in the LTV calculation.
The creditor’s creditworthiness, the LTV and the quality of collateral is an integral part of our risk management when originatingloans and when monitoring and steering our credit risks. In general, we are willing to accept higher LTV’s, the better the credi-tor’s creditworthiness is. Nevertheless, restrictions of LTV apply for countries with negative economic outlook or expected de-clines of real estate values.
As of September 30, 2017, 68 % of our exposure is related to the mortgage lending portfolio, which had a LTV ratio below orequal to 50 %, unchanged to prior year end.
Credit Risk Exposure to certain Eurozone Countries
Certain Eurozone countries are presented within the table below due to concerns relating to sovereign risk.
In our “country of domicile view” we aggregate credit risk exposures to counterparties by allocating them to the domicile of theprimary counterparty, irrespective of any link to other counterparties, or in relation to credit default swaps underlying referenceassets from these eurozone countries. Hence we also include counterparties whose group parent is located outside of thesecountries and exposures to special purpose entities whose underlying assets are from entities domiciled in other countries.

44
Deutsche Bank 1 – Management ReportInterim Report as of September 30, 2017
The following table, which is based on the “country of domicile” view, presents our gross position, the proportion of undrawnexposure and our net exposure to these eurozone countries. The gross exposure reflects our net credit risk exposure grossedup for credit derivatives with underlying reference assets domiciled in one of these countries, guarantees received and collateral.Such collateral is particularly held with respect to our retail portfolio, but also for financial institutions predominantly based onderivative margining arrangements, as well as for corporates. In addition, the amounts also reflect the allowance for credit loss-es. Net credit exposures are presented after effects of collateral held, guarantees received and further risk mitigation, includingnet notional amounts of credit derivatives for protection sold/(bought). The provided gross and net exposures to certain euro-zone countries do not include credit derivative tranches and credit derivatives in relation to our correlation business which, bydesign, is structured to be credit risk neutral. Additionally, the tranche and correlated nature of these positions do not allow ameaningful disaggregated notional presentation by country, e.g., as identical notional exposures represent different levels ofrisk for different tranche levels.
Gross position, included undrawn exposure and net exposure to certain eurozone countries – Country of Domicile View Sovereign Financial Institutions Corporates Retail Other Total
in € m. Sep 30,
2017 Dec 31,
2016 Sep 30,
2017 Dec 31,
2016 Sep 30,
2017 Dec 31,
2016 Sep 30,
2017 Dec 31,
2016 Sep 30,
2017 Dec 31,
2016 Sep 30,
20171 Dec 31,
2016Greece
Gross 68 89 654 743 136 986 5 6 0 0 863 1,824Undrawn 0 0 28 31 3 21 0 0 0 0 32 52
Net 50 83 233 258 31 15 1 1 0 0 316 357Ireland
Gross 860 826 810 908 7,611 9,280 31 31 2,4032 3,2632 11,715 14,308Undrawn 0 0 32 42 1,988 2,000 1 1 1872 1722 2,207 2,214
Net 696 569 371 352 4,788 5,374 6 5 2,4032 3,4592 8,263 9,759Italy
Gross 3,128 2,735 2,961 3,051 11,570 10,591 16,404 17,122 163 358 34,226 33,857Undrawn 14 32 49 74 5,065 4,730 105 208 15 26 5,247 5,069
Net 1,338 438 402 920 8,347 7,514 7,402 7,288 160 344 17,649 16,504Portugal
Gross (107) 61 201 127 1,320 1,424 1,726 1,674 71 65 3,211 3,352Undrawn 0 0 79 12 159 232 18 12 0 0 257 256
Net 5 79 113 73 974 1,205 124 143 71 65 1,287 1,564Spain
Gross 1,414 1,325 1,295 1,947 8,006 8,340 9,565 9,770 74 112 20,354 21,493Undrawn 0 0 227 261 3,921 4,310 256 283 0 3 4,404 4,858
Net 1,412 1,195 540 971 6,176 6,643 2,041 1,935 218 265 10,387 11,009Total gross 5,363 5,037 5,921 6,776 28,643 30,621 27,731 28,603 2,710 3,797 70,369 74,835
Total undrawn 14 33 416 419 11,136 11,292 380 504 202 202 12,147 12,449Total net3 3,502 2,364 1,659 2,574 20,316 20,751 9,574 9,371 2,851 4,133 37,902 39,1941 Approximately 70 % of the overall exposure will mature within the next 5 years.2 Other exposures to Ireland include exposures to counterparties where the domicile of the group parent is located outside of Ireland as well as exposures to special purpose
entities whose underlying assets are from entities domiciled in other countries.3 Total net exposure excludes credit valuation reserves for derivatives amounting to € 110 million as of September 30, 2017 and € 281 million as of December 31, 2016.
Total net exposure to the above selected eurozone countries decreased by € 1.3 billion in the first nine months of 2017 mainlydriven by decrease in Ireland and Spain, partly offset by an increase in Italy.
Sovereign Credit Risk Exposure to certain Eurozone Countries
The amounts below reflect a net “country of domicile view” of our sovereign exposure.
Sovereign credit risk exposure to certain eurozone Countries Sep 30, 2017 Dec 31, 2016
in € m.
Direct Sovereign
exposure1
Net Notionalof CDS
referencingsovereign debt
Net sovereign exposure
Memo Item: Net fair value
of CDS referencingsovereign debt2
Direct Sovereign
exposure1
Net Notionalof CDS
referencingsovereign debt
Net sovereign exposure
Memo Item: Net fair value
of CDS referencingsovereign debt2
Greece 68 (17) 50 1 89 (6) 83 2Ireland 658 38 696 13 569 0 569 74Italy 3,083 (1,745) 1,338 411 2,662 (2,223) 438 398Portugal (107) 112 5 (1) 61 17 79 (8)Spain 1,411 1 1,412 274 1,322 (127) 1,195 279Total 5,112 (1,611) 3,502 698 4,703 (2,339) 2,364 7441 Includes sovereign debt classified as financial assets/liabilities at fair value through profit or loss, available for sale and loans carried at amortized cost.2 The amounts reflect the net fair value in relation to default swaps referencing sovereign debt of the respective country representing the counterparty credit risk.
Net sovereign credit exposure increased by € 1.1 billion compared to year-end 2016. The main increases were in Italy, Spainand Ireland. The increase in direct sovereign exposure in Italy and Ireland is mainly attributable to an increase in the level of

45
Deutsche Bank Risk ReportInterim Report as of September 30, 2017 Asset Quality
debt securities held by us. The negative direct sovereign exposure in Portugal resulted from short selling positions in debtsecurities.
The above represented direct sovereign exposure included the carrying value of loans held at amortized cost to sovereigns,which as of September 30, 2017, amounted to € 260 million for Italy and € 376 million for Spain and as of December 31, 2016amounted to € 261 million for Italy and € 401 million for Spain.
Asset QualityThis section below describes the asset quality of our loans. All loans, where known information about possible credit problemsof borrowers causes our management to have serious doubts as to the collectability of the borrower’s contractual obligations,are included in this section.
Overview of performing, renegotiated, past due and impaired loans by customer groups Sep 30, 2017 Dec 31, 2016
in € m.Corporate
loansConsumer
loans TotalCorporate
loansConsumer
loans TotalLoans neither past due, nor renegotiated orimpaired 203,351 185,027 388,378 219,106 182,760 401,865Past due loans, neither renegotiated norimpaired 1,443 2,816 4,259 882 2,445 3,327Loans renegotiated, but not impaired 495 465 960 357 459 816Impaired loans 3,781 2,899 6,680 4,310 3,137 7,447Total 209,069 191,207 400,277 224,655 188,801 413,455
Statement with regard to Focus Industries
Our loan exposure to the industry “Shipping” accounts for approximately € 5 billion of which € 4.3 billion pertains vesselfinancings. The difference is allocated to other maritime (e.g. port facilities, yards). The vessel financing industry suffered frompersistent low earnings in oversupplied markets over the past few years. Demand is driven by the macroeconomic environmentwhich is affected by geopolitical tensions and oil price moves. Container and dry bulk transportation segments are most severe-ly hit having experienced slightly improved freight rates in early 2017 driven by significant scrapping and moderate new buildingactivity. The tanker segment faced very high levels of scheduled deliveries for 2017 and 2018, which caused freight rates to fallnotably early this year from their healthy 2016 levels and freight rates have now stabilized at these lower levels which we expectto remain for the next months. Overall the outlook remains uncertain given continued fleet overcapacity in all segments andfurther newbuilding activities. Any significant improvement in charter rates and subsequent asset values is not expected in theshort term. A high portion of the portfolio is non-investment-grade rated in reflection of the prolonged challenging market condi-tions over recent years.
Impaired Loans
Credit Risk Management regularly assesses at each balance sheet date whether there is objective evidence that a loan orgroup of loans is impaired. A loan or group of loans is impaired and impairment losses are incurred if:
there is objective evidence of impairment as a result of a loss event that occurred after the initial recognition of the asset andup to the balance sheet date (a “loss event”). When making our assessment we consider information on such events that isreasonably available up to the date the financial statements are authorized for issuance in line with the requirements ofIAS 10;the loss event had an impact on the estimated future cash flows of the financial asset or the group of financial assets, anda reliable estimate of the loss amount can be made at each reporting date.
Credit Risk Management’s loss assessments are subject to regular review in collaboration with Finance.
Impairment Loss and Allowance for Loan Losses
If there is evidence of impairment, the impairment loss is generally calculated on the basis of discounted expected cash flowsusing the original effective interest rate of the loan. If the terms of a loan are renegotiated or otherwise modified because offinancial difficulties of the borrower without qualifying for a derecognition of the loan, the impairment loss is measured using theoriginal effective interest rate before modification of terms. We reduce the carrying amount of the impaired loan by the use of an
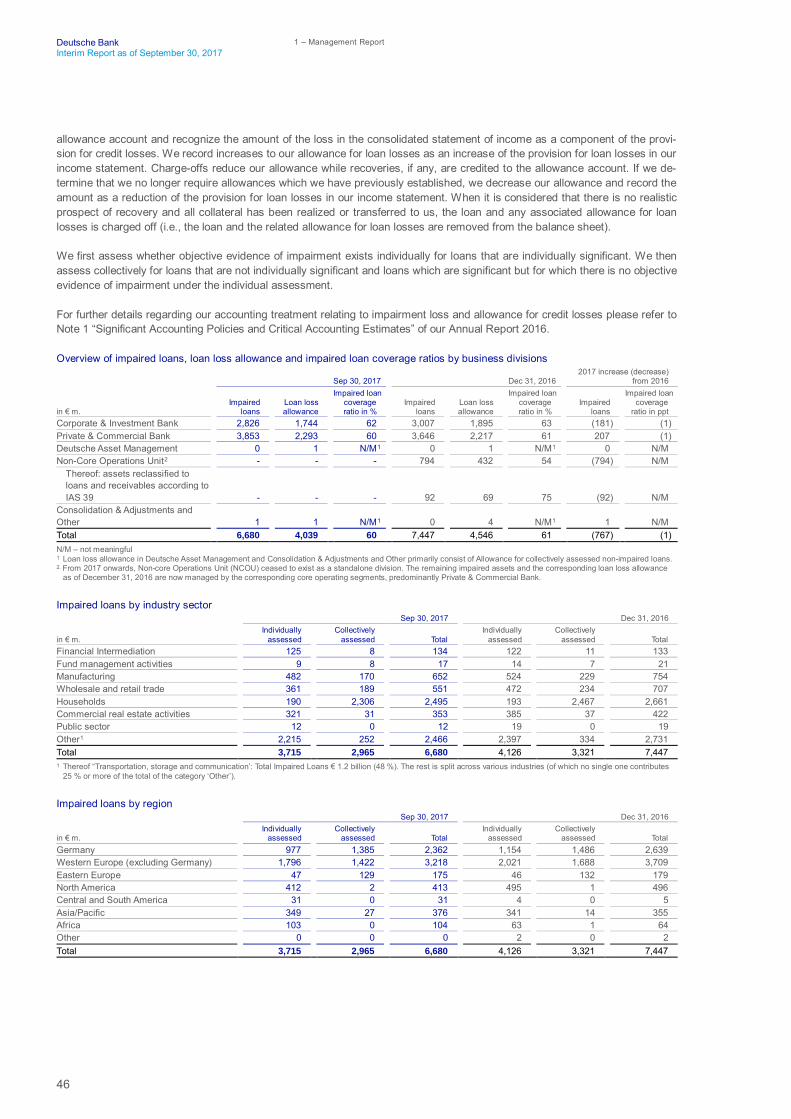
46
Deutsche Bank 1 – Management ReportInterim Report as of September 30, 2017
allowance account and recognize the amount of the loss in the consolidated statement of income as a component of the provi-sion for credit losses. We record increases to our allowance for loan losses as an increase of the provision for loan losses in ourincome statement. Charge-offs reduce our allowance while recoveries, if any, are credited to the allowance account. If we de-termine that we no longer require allowances which we have previously established, we decrease our allowance and record theamount as a reduction of the provision for loan losses in our income statement. When it is considered that there is no realisticprospect of recovery and all collateral has been realized or transferred to us, the loan and any associated allowance for loanlosses is charged off (i.e., the loan and the related allowance for loan losses are removed from the balance sheet).
We first assess whether objective evidence of impairment exists individually for loans that are individually significant. We thenassess collectively for loans that are not individually significant and loans which are significant but for which there is no objectiveevidence of impairment under the individual assessment.
For further details regarding our accounting treatment relating to impairment loss and allowance for credit losses please refer toNote 1 “Significant Accounting Policies and Critical Accounting Estimates” of our Annual Report 2016.
Overview of impaired loans, loan loss allowance and impaired loan coverage ratios by business divisions
Sep 30, 2017 Dec 31, 2016 2017 increase (decrease)
from 2016
in € m. Impaired
loans Loan loss allowance
Impaired loan coverage ratio in %
Impairedloans
Loan loss allowance
Impaired loan coverage ratio in %
Impairedloans
Impaired loan coverage ratio in ppt
Corporate & Investment Bank 2,826 1,744 62 3,007 1,895 63 (181) (1)Private & Commercial Bank 3,853 2,293 60 3,646 2,217 61 207 (1)Deutsche Asset Management 0 1 N/M1 0 1 N/M1 0 N/MNon-Core Operations Unit2 - - - 794 432 54 (794) N/M
Thereof: assets reclassified toloans and receivables according toIAS 39 - - - 92 69 75 (92) N/M
Consolidation & Adjustments andOther 1 1 N/M1 0 4 N/M1 1 N/MTotal 6,680 4,039 60 7,447 4,546 61 (767) (1)N/M – not meaningful1 Loan loss allowance in Deutsche Asset Management and Consolidation & Adjustments and Other primarily consist of Allowance for collectively assessed non-impaired loans.2. From 2017 onwards, Non-core Operations Unit (NCOU) ceased to exist as a standalone division. The remaining impaired assets and the corresponding loan loss allowance
as of December 31, 2016 are now managed by the corresponding core operating segments, predominantly Private & Commercial Bank.
Impaired loans by industry sector Sep 30, 2017 Dec 31, 2016
in € m.Individually
assessedCollectively
assessed TotalIndividually
assessedCollectively
assessed TotalFinancial Intermediation 125 8 134 122 11 133Fund management activities 9 8 17 14 7 21Manufacturing 482 170 652 524 229 754Wholesale and retail trade 361 189 551 472 234 707Households 190 2,306 2,495 193 2,467 2,661Commercial real estate activities 321 31 353 385 37 422Public sector 12 0 12 19 0 19Other1 2,215 252 2,466 2,397 334 2,731Total 3,715 2,965 6,680 4,126 3,321 7,4471 Thereof “Transportation, storage and communication’: Total Impaired Loans € 1.2 billion (48 %). The rest is split across various industries (of which no single one contributes
25 % or more of the total of the category ‘Other’).
Impaired loans by region Sep 30, 2017 Dec 31, 2016
in € m.Individually
assessedCollectively
assessed TotalIndividually
assessedCollectively
assessed TotalGermany 977 1,385 2,362 1,154 1,486 2,639Western Europe (excluding Germany) 1,796 1,422 3,218 2,021 1,688 3,709Eastern Europe 47 129 175 46 132 179North America 412 2 413 495 1 496Central and South America 31 0 31 4 0 5Asia/Pacific 349 27 376 341 14 355Africa 103 0 104 63 1 64Other 0 0 0 2 0 2Total 3,715 2,965 6,680 4,126 3,321 7,447

47
Deutsche Bank Risk ReportInterim Report as of September 30, 2017 Asset Quality
Development of Impaired Loans Nine months ended Sep 30, 2017 Full Year 2016
in € m.Individually
assessedCollectively
assessed TotalIndividually
assessedCollectively
assessed TotalBalance, beginning of year 4,126 3,321 7,447 4,236 3,915 8,151Classified as impaired during the year 1,026 1,006 2,032 2,177 1,291 3,469Transferred to not impaired duringthe year1 (845) (786) (1,631) (1,080) (723) (1,803)Charge-offs (327) (528) (856) (979) (987) (1,966)Disposals of impaired loans (87) (40) (127) (266) (161) (427)Exchange rate and other movements (179) (7) (187) 38 (15) 23Balance, end of period 3,715 2,965 6,680 4,126 3,321 7,4471 Includes repayments.
Our impaired loans decreased in the first nine months of 2017 by € 767 million or 10 % to € 6.7 billion. The reduction in ourindividually assessed portfolio mainly reflects charge-offs in CIB along with de-risking of former NCOU assets, while the reduc-tion in our collectively assessed portfolio was driven by charge-offs related to disposals in PCC International.
The impaired loan coverage ratio (defined as total on-balance sheet allowances for all loans individually impaired or collectivelyassessed divided by IFRS impaired loans (excluding collateral)) decreased from 61 % as of year-end 2016 to 60 % as of Sep-tember 30, 2017.
Movements in the Allowance for Credit Losses
Our allowance for credit losses is comprised of the allowance for loan losses and the allowance for off-balance sheet positions.
Development of allowance for credit lossesNine months ended Sep 30, 2017
Allowance for Loan Losses Allowance for Off-Balance Sheet Positionsin € m.(unless stated otherwise)
Individuallyassessed
Collectivelyassessed Subtotal
Individuallyassessed
Collectivelyassessed Subtotal Total
Balance, beginning of year 2,071 2,475 4,546 162 183 346 4,892Provision for credit losses 259 165 424 (13) (15) (28) 396
Thereof: (Gains)/Losses fromdisposal of impaired loans (1) (20) (21) 0 0 0 (21)
Net charge-offs: (290) (480) (771) 0 0 0 (770)Charge-offs (327) (528) (856) 0 0 0 (856)Recoveries 37 48 85 0 0 0 85
Other changes (121) (40) (161) (3) (14) (17) (178)Balance, end of period 1,919 2,120 4,039 146 155 300 4,339
Changes compared to prior yearProvision for credit losses
In € m. (249) (205) (454) (7) (34) (41) (495)In % (49) (55) (52) 108 (180) (329) (56)
Net charge-offsIn € m. 294 173 467 0 0 0 467In % (50) (26) (38) 0 0 0 (38)
Allowance for credit losses as at September 30, 2017 amounted to € 4.3 billion compared to € 4.9 billion as at end of last year.The reduction was mainly driven by charge-offs, partly compensated by additional provision for credit losses.
Provision for credit losses decreased by € 495 million compared to the first nine months of 2016, driven by a decrease in provi-sion for loan losses of € 454 million and partly by a decrease in provisions for off balance sheet positions of € 41 million. Thedecrease in our individually assessed loan portfolio mainly resulted from CIB, due to broad based improved performance,though the shipping sector continued to prove challenging. Provision for credit losses also included an impact from changes inestimates related to shipping loans in the third quarter 2017 as discussed in section “Basis of Preparation”. A further reductionin Private & Commercial Bank was driven by a release in Postbank. The decrease in provisions for our collectively assessedloan portfolio mainly resulted from the non-recurrence of one-off items related to assets reported under NCOU in prior year.
The decrease in net charge-offs of € 467 million compared to prior years’ nine months was driven the non-recurrence of netcharge-offs related to assets reported under NCOU in prior year as well as in Postbank.

48
Deutsche Bank 1 – Management ReportInterim Report as of September 30, 2017
Nine months ended Sep 30, 2016Allowance for Loan Losses Allowance for Off-Balance Sheet Positions
in € m.(unless stated otherwise)
Individuallyassessed
Collectivelyassessed Subtotal
Individuallyassessed
Collectivelyassessed Subtotal Total
Balance, beginning of year 2,252 2,776 5,028 144 168 312 5,340Provision for credit losses 508 370 878 (6) 19 12 891
Thereof: (Gains)/Losses fromdisposal of impaired loans 3 (16) (13) 0 0 0 (13)
Net charge-offs: (585) (653) (1,238) 0 0 0 (1,238)Charge-offs (613) (740) (1,353) 0 0 0 (1,353)Recoveries 29 86 115 0 0 0 115
Other changes 14 (121) (107) (8) (4) (12) (119)Balance, end of period 2,189 2,372 4,562 129 183 312 4,874
Changes compared to prior yearProvision for credit losses
In € m. 333 33 366 (57) 5 (52) 314In % 190 10 72 (113) 39 (81) 55
Net charge-offsIn € m. (266) (118) (384) 0 0 0 (384)In % 83 22 45 0 0 0 45
Market Risk
Market Risk of Trading Units excluding Postbank
The table below presents the value-at-risk metrics calculated with a 99 % confidence level and a one-day holding period for ourtrading units.
Value-at-Risk of our Trading Units by Risk Type
TotalDiversification
effectInterest rate
riskCredit spread
riskEquity price
risk Foreign exchange
risk1 Commodity price
riskin € m. 2017 2016 2017 2016 2017 2016 2017 2016 2017 2016 2017 2016 2017 2016Average2 31.3 32.0 (29.0) (35.0) 20.9 19.7 21.1 26.6 8.3 9.3 9.0 10.7 0.9 0.7Maximum2 38.4 59.4 (37.6) (57.6) 26.0 29.5 25.1 32.5 11.1 52.4 16.5 16.7 3.0 3.3Minimum2 24.2 20.4 (25.2) (25.6) 17.1 14.8 17.3 22.3 4.4 4.4 4.4 3.6 0.1 0.2Period-end3 27.3 30.1 (28.1) (36.9) 17.4 19.9 19.9 24.3 8.9 10.0 9.0 12.6 0.3 0.21 Includes value-at-risk from gold and other precious metal positions.2 Amounts show the bands within which the values fluctuated during the period January 1 to September 30, 2017 and the full year 2016, respectively.3 Amounts for 2017 as of September 30, 2017 and for 2016 as of December 31, 2016.
The average value-at-risk over the first nine months of 2017 was € 31.3 million, which is a decrease of € 0.7 million comparedwith the full year 2016. The average credit spread value-at-risk decreased due to a reduction in idiosyncratic risk.
The period end value-at-risk reduction was driven by reductions across interest rate, credit spread, equity and foreign exchangeasset classes.
During the first nine months of 2017 our trading units achieved a positive revenue for 96 % of trading days compared with 87 %in the full year 2016.
Regulatory Trading Market Risk Measures
Stressed Value-at-Risk
The following table shows the stressed value-at-risk (with a 99 % confidence level and a one-day holding period) for our tradingunits.

49
Deutsche Bank Risk ReportInterim Report as of September 30, 2017 Market Risk
Stressed Value-at-Risk by Risk Type
TotalDiversification
effectInterest rate
riskCredit spread
riskEquity price
risk Foreign exchange
risk1 Commodity price
riskin € m. 2017 2016 2017 2016 2017 2016 2017 2016 2017 2016 2017 2016 2017 2016Average2 80.1 85.2 (87.7) (78.2) 71.9 51.9 62.2 74.9 18.9 20.6 12.9 14.8 1.9 1.3Maximum2 125.0 143.7 (109.3) (150.0) 92.0 82.5 73.2 99.3 66.8 144.5 28.0 30.4 6.1 3.9Minimum2 50.5 60.4 (73.0) (53.4) 48.7 37.4 54.9 59.0 1.5 2.4 6.9 3.4 0.3 0.4Period-end3 56.9 75.8 (91.8) (91.3) 56.8 51.9 63.3 63.0 15.3 29.6 12.0 22.1 1.3 0.51 Includes stressed value-at-risk from gold and other precious metal positions.2 Amounts show the bands within which the values fluctuated during the period January 1 to September 30, 2017 and the full year 2016, respectively.3 Amounts 2017 as of September 30, 2017 and for 2016 as of December 31, 2016.
The average stressed value-at-risk was € 80.1 million over the first nine months of 2017, a decrease of € 5.1 million comparedwith the full year 2016. The reduction in the average was driven by a decrease in credit spread stressed value-at-risk due to adecrease in idiosyncratic risk as well as a small reduction coming from a model enhancement to the credit spread component.This has been partly offset by an increase in interest rate stressed value-at-risk due to a change in directional exposure onaverage over 2017.
The period end stressed value-at-risk decrease was driven by reductions in the equity and foreign exchange asset classes.
Incremental Risk Charge
For regulatory reporting purposes, the incremental risk charge for the respective reporting dates represents the higher of thespot value at the reporting dates and the value of the preceding 12-week average calculation. The incremental risk chargepresented for the reporting dates below is the spot value and the average, maximum and minimum values calculated for the12-week period preceding these reporting dates.
Incremental Risk Charge of Trading Units (with a 99.9 % confidence level and one-year capital horizon)2,3
TotalNon-Core
Operations UnitGlobal Credit
Trading Core Rates Fixed Income & Currencies APAC
Emerging Markets - Debt Other
in € m. 2017 2016 2017 2016 2017 2016 2017 2016 2017 2016 2017 2016 2017 2016Average1 742.0 840.2 0.0 52.0 455.0 393.0 67.0 200.4 261.0 188.6 54.0 116.8 (95.0) (110.5)Maximum1 834.0 944.4 0.0 57.3 606.0 405.8 156.0 229.6 432.0 243.0 79.0 128.0 (43.0) (65.6)Minimum1 705.0 693.0 0.0 44.5 337.0 368.0 18.0 173.7 122.0 119.6 25.0 111.6 (148.0) (141.8)Period-end2 834.0 693.0 0.0 51.8 606.0 368.0 99.0 173.7 122.0 119.6 50.0 121.8 (43.0) (141.8)1 Amounts show the bands within which the values fluctuated during the 12-weeks preceding September 30, 2017 and December 31, 2016, respectively.2 Business line breakdowns have been updated for 2017 reporting to better reflect the current business structure.3 All liquidity horizons are set to 12 months.
The incremental risk charge as at the end of the third quarter of 2017 was € 834 million, an increase of € 141 million (20 %)compared with year end 2016. The 12-week average incremental risk charge as at the end of the third quarter of 2017 was€ 742 million and thus € 98 million (12 %) lower compared with the average for the 12-week period ended December 31, 2016.The decreased average incremental risk charge is driven by a decrease in credit exposures in core rates and emerging markets- debt when compared to the full year 2016.
Comprehensive Risk Measure
For regulatory reporting purposes, the comprehensive risk measure for the respective reporting dates represents the highest ofthe spot value at the reporting dates, their preceding 12-week average calculation, and the floor, where the floor is equal to 8 %of the equivalent capital charge under the securitization framework.
Comprehensive Risk Measure of Trading Units (with a 99.9 % confidence level and one-year capital horizon)3
in € m. 2017 2016Average1 8.2 31.3Maximum1 10.2 39.8Minimum1 6.8 21.9Period-end2 4.7 17.91 Regulatory comprehensive risk measure calculated for the 12-week period ending September 30, 2017 and December 31, 2016.2 Spot value of internal model comprehensive risk measure at period end.3 All liquidity horizons are set to 12 months.
The internal model comprehensive risk measure as at the end of the first nine months of 2017 was € 4.7 million a decrease of€ 13.2 million (-74 %) compared with year end 2016. The 12-week average of our regulatory comprehensive risk measure as atthe end of the first nine months of 2017 was € 8.2 million and thus € 23.1 million (74 %) lower compared with the average forthe 12-week period ending December 31, 2016. The reduction was due to continued de-risking on this portfolio.

50
Deutsche Bank 1 – Management ReportInterim Report as of September 30, 2017
Market Risk Standardized Approach
As of September 30, 2017, the securitization positions, for which the specific interest rate risk is calculated using the market riskstandardized approach, generated capital requirements of € 364.3 million corresponding to risk weighted-assets of € 4.6 billion.As of December 31, 2016 these positions generated capital requirements of € 278.4 million corresponding to risk weighted-assets of € 3.5 billion.
For nth-to-default credit default swaps the capital requirement decreased to € 3.1 million corresponding to risk weighted-assetsof € 39 million compared with € 6.4 million and € 80 million as of December 31, 2016.
The capital requirement for Collective Investment Undertakings under the market risk standardized approach was € 54 millioncorresponding to risk weighted-assets of € 678 million as of September 30, 2017, compared with € 39 million and € 487 millionas of December 31, 2016.
The capital requirement for longevity risk under the market risk standardized approach was € 36 million corresponding torisk-weighted assets of € 450 million as of September 30, 2017, compared with € 46 million and € 570 million as of Decem-ber 31, 2016.
Market Risk of Trading Book at Postbank
The value-at-risk of Postbank’s trading book calculated with a 99 % confidence level and a one-day holding period amounted tozero as of September 30, 2017 and at year-end 2016. Postbank’s current trading strategy does not allow any new trading activi-ties with regard to the trading book. Therefore, Postbank’s trading book did not contain any positions as of September 30, 2017and at year-end 2016. Nevertheless, Postbank will remain classified as a trading book institution.
Operational RiskIn the first nine months of 2017, our operational risk losses continued to be driven predominantly by losses and provisionsarising from civil litigation and regulatory enforcement actions. While some easing was observed compared to previous years,such losses still accounted for more than 70 % of our operational risk losses in these nine months. For a description of ourcurrent legal and regulatory proceedings, please see section “Provisions - Current Individual Proceedings” of this Interim Report.Our non-legal operational risk losses are moderately higher compared to the first nine months of 2016. The overall balance ofour year-to-date legal and non-legal operational risk has been materially reduced by releases of provisions made for litigationevents.
Our operational risk management fosters a forward-looking approach to monitoring potential profits and losses, focusing onregular review of civil litigations and regulatory enforcement matters, trend analysis based upon available losses and key riskindicator data. The regulatory capital requirement is mainly driven by large external and internal operational risk events as wellas reasonably possible litigation losses, which are reflected through provisions, contingent liabilities and legal forecasts in ourAMA model. For a description of our modelling approach, please see section “Drivers for Operational Risk Capital Development”of our Annual Report 2016.
Liquidity RiskComposition of our external funding sources in euro billion and as a percentage of our total external funding sourcesin € bn.(unless stated otherwise) Sep 30, 2017 Dec 31, 2016Capital Markets and Equity 202 20 % 210 21 %Retail 311 31 % 292 30 %Transaction Banking 219 22 % 200 20 %Other Customers1 63 6 % 53 5 %Unsecured Wholesale 43 4 % 55 6 %Secured Funding and Shorts 165 16 % 165 17 %Financing Vehicles 2 0 % 2 0 %Total external funding 1,006 100 % 977 100 %1 “Other Customers” includes fiduciary, self-funding structures (e.g. X-markets) and margin/prime brokerage cash balances (shown on a net basis).Reference: To reconcile to the total balance sheet, add derivatives & settlement balances € 425.8 billion (€ 503.6 billion), netting effect for margin & prime brokerage cashbalances (shown on a net basis) € 52.3 billion (€ 67.9 billion), and other non-funding liabilities € 37.3 billion (€ 42.2 billion) for September 30, 2017, and December 31, 2016,respectively.

51
Deutsche Bank Risk ReportInterim Report as of September 30, 2017 Liquidity Risk
Capital Markets and Equity decreased by € 7.6 billion, reflecting an Equity increase of € 5.8 billion as a result of the € 7.9 billioncapital raise proceeds which was more than compensated for by FX impacts and a Capital Markets decrease of € 13.4 billiondue to higher outflows than new issuances in aggregate and FX impacts. Retail (including Wealth Management) deposits haveincreased by € 18.7 billion, predominantly due to improved market and customer sentiment since the resolution of a significantlitigation item in December 2016 partially offset by FX impacts. Transaction Banking deposits have increased by € 19.8 billion,of which € 8.4 billion relates to short term deposits received over the end of the third quarter of 2017 that are expected to roll offin the fourth quarter of 2017. Secured funding and shorts were flat over the period, driven by an increase in CIB trading invento-ry which was completely offset by FX impacts. The € 10.8 billion increase in “Other Customers” reflects developments in bal-ances not relied upon as a source of stable funding, predominantly related to net margin payables and prime brokeragebalances, partially offset by FX impacts. Unsecured Wholesale decreased by € 11.5 billion, due to higher maturities than newdeposits in aggregate as well as FX impacts.
During the first nine months of 2017, we raised € 19.3 billion out of a total 2017 funding plan of € 25 billion. The average spreadover 3-months Euribor during the first nine months of 2017 was 79 bps (all non-Euro funding spreads are rebased versus 3-months Euribor), with an average tenor of 6.8 years. The most significant transaction in the third quarter 2017 was a U.S.$ 2.25billion senior unsecured dual-tranche issuance split into a U.S.$ 1.5 billion fixed rate note and a U.S.$ 0.75 billion floating-ratenote, both with a tenor of 3 years. For the remainder of the year we intend to source the rest of our requirements through avariety of channels, including issuance targeted at retail investors, private placements with institutional investors and furtherpublic benchmark issuance.
Regular stress test analyses aim to ensure that we always hold sufficient cash and liquid assets to close a potential funding gapwhich could open under a combined scenario comprising idiosyncratic and market related stress. For this purpose we holdliquidity reserves which comprise available cash and cash equivalents, highly liquid securities (includes government, govern-ment guaranteed and agency securities) as well as other unencumbered central bank eligible assets. The volume of the liquidityreserves is a function of the expected stress result, both at an aggregate level as well as at an individual currency level. To theextent we receive incremental short-term wholesale liabilities which attract a high stress roll-off, we largely keep the proceeds ofsuch liabilities in cash or highly liquid securities as a stress mitigant. As such, the total volume of liquidity reserves will fluctuateaccording to the level of short-term wholesale liabilities held, although this has no material impact on our overall liquidity positionunder stress. Liquidity reserves include only assets that are freely transferable within the group, or can be applied against localentity stress outflows. These reserves are held across major currencies and key locations in which the bank is active. The vastmajority of our liquidity reserves are centrally held at our parent level or at our foreign branches. Size and composition aresubject to regular senior management review. The haircuts applied reflect our assumption of the actual liquidity value that couldbe obtained, primarily through secured funding, and take into account the experience observed in secured funding markets attimes of stress.
Composition of our liquidity reserves by parent company (including branches) and subsidiaries Sep 30, 2017 Dec 31, 2016
in € bn. Carrying Value Liquidity Value Carrying Value Liquidity ValueAvailable cash and cash equivalents (held primarily at central banks) 204 204 178 178
Parent (incl. foreign branches) 175 175 136 136Subsidiaries 29 29 42 42
Highly liquid securities (includes government, government guaranteed andagency securities) 55 43 27 25
Parent (incl. foreign branches) 35 24 25 24Subsidiaries 20 19 2 1
Other unencumbered central bank eligible securities 19 10 14 9Parent (incl. foreign branches) 12 7 9 6Subsidiaries 7 4 5 3
Total liquidity reserves 279 257 219 212Parent (incl. foreign branches) 222 205 171 166Subsidiaries 57 52 48 46
Our liquidity reserves increased by € 59.8 billion or 27.4 % during the first nine months of 2017 in comparison to year-end 2016.
Our stressed net liquidity position (sNLP) represents the surplus of our available Liquidity Reserves and other business inflowsin excess of stressed liquidity demand under our combined liquidity stress scenario, representing a severe market and idiosyn-cratic liquidity stress event. The sNLP is monitored as one of the Bank’s key risk metrics. Our sNLP as of September 30, 2017(preliminary estimate) was € 27.7 billion (December 31, 2016 sNLP of € 36 billion). The sNLP fluctuates according to businessactivities, market events and perceptions, including with respect to us, as well as changes to our internal methodology assump-tions. Our internal risk appetite is to maintain a surplus of at least € 20 billion.

52
Deutsche Bank 1 – Management ReportInterim Report as of September 30, 2017
Liquidity Coverage Ratio
Finalized by the Basel Committee in January 2013, the Liquidity Coverage Ratio LCR is intended to promote the short-termresilience of a bank’s liquidity risk profile over a 30 day stress scenario. The ratio is defined as the amount of High Quality LiquidAssets (“HQLA”) that could be used to raise liquidity, measured against the total volume of net cash outflows, arising from bothactual and contingent exposures, in a stressed scenario.
This requirement has been implemented into European law, via the Commission Delegated Regulation (EU) 2015/61, adoptedin October 2014. Compliance with the LCR was required in the European Union from October 1, 2015.
Our LCR of 141 % as of September 30, 2017 has been calculated in accordance with the Commission Delegated Regulation(EU) 2015/61, (calculated in accordance with the EBA’s Implementing Technical Standard on Supervisory Reporting with re-gard to the LCR). The December 31, 2016 LCR was 128 %.
Liquidity Value (weighted)in € bn. Sep 30, 2017 Dec 31, 2016High quality liquid assets 252 201Gross inflows 102 93Gross outflows 281 250Net outflows 179 158LCR ratio in % 141 % 128 %

53
Deutsche Bank Consolidated Statement of Income (unaudited)Interim Report as of September 30, 2017
Consolidated Statement of Income (unaudited)
Income StatementThree months ended Nine months ended
in € m. Sep 30, 2017 Sep 30, 2016 Sep 30, 2017 Sep 30, 2016Interest and similar income 5,808 6,359 17,575 19,112Interest expense 2,421 2,834 8,014 7,971Net interest income 3,387 3,525 9,561 11,142Provision for credit losses 184 327 396 891Net interest income after provision for credit losses 3,203 3,198 9,166 10,251Commissions and fee income 2,582 3,027 8,356 8,825Net gains (losses) on financial assets/liabilities at fair valuethrough profit or loss 659 390 2,612 2,111Net gains (losses) on financial assets available for sale 59 111 256 476Net income (loss) from equity method investments 21 75 125 427Other income (loss) 68 366 (172) (34)Total noninterest income 3,389 3,968 11,176 11,805Compensation and benefits 2,806 2,894 8,874 9,047General and administrative expenses 2,865 3,490 8,789 10,447Policyholder benefits and claims 0 167 0 285Impairment of goodwill and other intangible assets 0 (49) 6 236Restructuring activities (12) 45 39 435Total noninterest expenses 5,660 6,547 17,708 20,450Income (loss) before income taxes 933 619 2,633 1,606Income tax expense (benefit) 284 340 944 1,071Net income (loss) 649 278 1,689 534Net income (loss) attributable to noncontrolling interests 2 22 25 47Net income (loss) attributable to Deutsche Bank shareholders andadditional equity components 647 256 1,664 488
Earnings per Common ShareThree months ended Nine months ended
Sep 30, 2017 Sep 30, 2016 Sep 30, 2017 Sep 30, 2016Earnings per common share:1,2
Basic € 0.31 € 0.16 € 0.72 € 0.14Diluted € 0.30 € 0.16 € 0.69 € 0.13Number of shares in million:1
Denominator for basic earnings per share – weighted-average sharesoutstanding 2,095.8 1,554.1 1,924.0 1,554.1Denominator for diluted earnings per share – adjusted weighted-averageshares after assumed conversions 2,151.7 1,585.9 1,986.7 1,577.01 The number of average basic and diluted shares outstanding has been adjusted for all periods before April 2017 in order to reflect the effect of the bonus component of
subscription rights issued in April 2017 in connection with the capital increase.2 Earnings for the nine months ended September 30, 2017 and 2016 were adjusted by € 288 million and € 276 million net of tax for the coupons paid on Additional Tier 1 Notes
in April 2017 and April 2016, respectively. The coupons paid on Additional Tier 1 Notes are not attributable to Deutsche Bank shareholders and therefore need to be deductedin the calculation in accordance with IAS 33.

54
Deutsche Bank 2 – Consolidated Financial StatementsInterim Report as of September 30, 2017
Consolidated Statement of Comprehensive Income(unaudited)
Three months ended Nine months endedin € m. Sep 30, 2017 Sep 30, 2016 Sep 30, 2017 Sep 30, 2016Net income (loss) recognized in the income statement 649 278 1,689 534Other comprehensive incomeItems that will not be reclassified to profit or loss
Remeasurement gains (losses) related to defined benefit plans, before tax (340) (405) (229) (977)Total of income tax related to items that will not be reclassified to profit or loss 97 146 46 444Items that are or may be reclassified to profit or loss
Financial assets available for saleUnrealized net gains (losses) arising during the period, before tax (59) 243 44 1,094Realized net (gains) losses arising during the period(reclassified to profit or loss), before tax (77) (82) (284) (407)
Derivatives hedging variability of cash flowsUnrealized net gains (losses) arising during the period, before tax (2) 12 (22) 46Realized net (gains) losses arising during the period(reclassified to profit or loss), before tax (140) (12) (137) (4)
Assets classified as held for saleUnrealized net gains (losses) arising during the period, before tax 0 0 (162) 0Realized net (gains) losses arising during the period(reclassified to profit or loss), before tax 0 0 162 0
Foreign currency translationUnrealized net gains (losses) arising during the period, before tax (675) (307) (2,328) (1,101)Realized net (gains) losses arising during the period(reclassified to profit or loss), before tax 16 (10) (11) (7)
Equity Method InvestmentsNet gains (losses) arising during the period (7) (2) (26) 13
Total of income tax related to items that are or may be reclassified toprofit or loss 50 (85) 87 (241)Other comprehensive income (loss), net of tax (1,137) (502) (2,861) (1,140)Total comprehensive income (loss), net of tax (489) (224) (1,172) (605)Attributable to:
Noncontrolling interests (4) 21 (3) 41Deutsche Bank shareholders and additional equity components (485) (245) (1,169) (647)
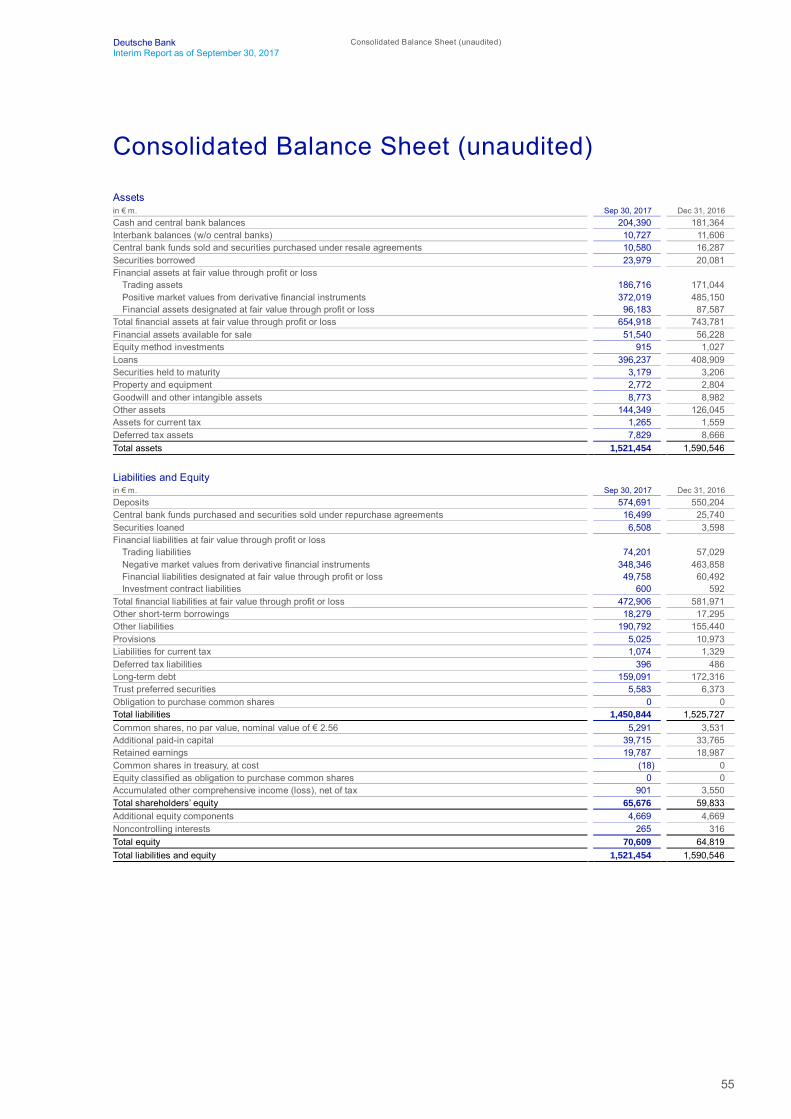
55
Deutsche Bank Consolidated Balance Sheet (unaudited)Interim Report as of September 30, 2017
Consolidated Balance Sheet (unaudited)
Assetsin € m. Sep 30, 2017 Dec 31, 2016Cash and central bank balances 204,390 181,364Interbank balances (w/o central banks) 10,727 11,606Central bank funds sold and securities purchased under resale agreements 10,580 16,287Securities borrowed 23,979 20,081Financial assets at fair value through profit or loss
Trading assets 186,716 171,044Positive market values from derivative financial instruments 372,019 485,150Financial assets designated at fair value through profit or loss 96,183 87,587
Total financial assets at fair value through profit or loss 654,918 743,781Financial assets available for sale 51,540 56,228Equity method investments 915 1,027Loans 396,237 408,909Securities held to maturity 3,179 3,206Property and equipment 2,772 2,804Goodwill and other intangible assets 8,773 8,982Other assets 144,349 126,045Assets for current tax 1,265 1,559Deferred tax assets 7,829 8,666Total assets 1,521,454 1,590,546
Liabilities and Equityin € m. Sep 30, 2017 Dec 31, 2016Deposits 574,691 550,204Central bank funds purchased and securities sold under repurchase agreements 16,499 25,740Securities loaned 6,508 3,598Financial liabilities at fair value through profit or loss
Trading liabilities 74,201 57,029Negative market values from derivative financial instruments 348,346 463,858Financial liabilities designated at fair value through profit or loss 49,758 60,492Investment contract liabilities 600 592
Total financial liabilities at fair value through profit or loss 472,906 581,971Other short-term borrowings 18,279 17,295Other liabilities 190,792 155,440Provisions 5,025 10,973Liabilities for current tax 1,074 1,329Deferred tax liabilities 396 486Long-term debt 159,091 172,316Trust preferred securities 5,583 6,373Obligation to purchase common shares 0 0Total liabilities 1,450,844 1,525,727Common shares, no par value, nominal value of € 2.56 5,291 3,531Additional paid-in capital 39,715 33,765Retained earnings 19,787 18,987Common shares in treasury, at cost (18) 0Equity classified as obligation to purchase common shares 0 0Accumulated other comprehensive income (loss), net of tax 901 3,550Total shareholders’ equity 65,676 59,833Additional equity components 4,669 4,669Noncontrolling interests 265 316Total equity 70,609 64,819Total liabilities and equity 1,521,454 1,590,546

56
Deutsche Bank 2 – Consolidated Financial StatementsInterim Report as of September 30, 2017
Consolidated Statement of Changes in Equity(unaudited)
in € m.
Commonshares
(no par value)Additional
paid-in capitalRetainedearnings
Commonshares
in treasury,at cost
Equity classified as obligation to
purchasecommon
shares
Unrealized net gains (losses) on financialassets available for sale, net of applicable tax and other1
Balance as of December 31, 2015 3,531 33,572 21,182 (10) 0 1,384Total comprehensive income (loss), net of tax2 0 0 488 0 0 427Common shares issued 0 0 0 0 0 0Cash dividends paid 0 0 0 0 0 0Coupon on additional equity components, net of tax 0 0 (276) 0 0 0Remeasurement gains (losses) related to definedbenefit plans, net of tax 0 0 (533) 0 0 0Net change in share awards in the reporting period 0 (142) 0 0 0 0Treasury shares distributed under share-basedcompensation plans 0 0 0 237 0 0Tax benefits related to share-based compensationplans 0 0 0 0 0 0Additions to Equity classified as obligation topurchase common shares 0 0 0 0 0 0Deductions from Equity classified as obligation topurchase common shares 0 0 0 0 0 0Option premiums and other effects from options oncommon shares 0 (129) 0 0 0 0Purchases of treasury shares 0 0 0 (3,750) 0 0Sale of treasury shares 0 0 0 3,503 0 0Net gains (losses) on treasury shares sold 0 10 0 0 0 0Other 0 286 0 0 0 0Balance as of September 30, 2016 3,531 33,597 20,860 (21) 0 1,811
Balance as of December 31, 2016 3,531 33,765 18,987 0 0 912Total comprehensive income (loss), net of tax2 0 0 1,664 0 0 (200)Common shares issued 1,760 6,277 0 0 0 0Cash dividends paid 0 0 (392) 0 0 0Coupon on additional equity components, net of tax 0 0 (288) 0 0 0Remeasurement gains (losses) related to definedbenefit plans, net of tax 0 0 (184) 0 0 0Net change in share awards in the reporting period 0 (245) 0 0 0 0Treasury shares distributed under share-basedcompensation plans 0 0 0 436 0 0Tax benefits related to share-based compensationplans 0 0 0 0 0 0Additions to Equity classified as obligation topurchase common shares 0 0 0 0 0 0Deductions from Equity classified as obligation topurchase common shares 0 0 0 0 0 0Option premiums and other effects from options oncommon shares 0 (104) 0 0 0 0Purchases of treasury shares 0 0 0 (7,135) 0 0Sale of treasury shares 0 0 0 6,681 0 0Net gains (losses) on treasury shares sold 0 12 0 0 0 0Other 0 10 0 0 0 0Balance as of September 30, 2017 5,291 39,715 19,787 (18) 0 7121 Excluding unrealized net gains (losses) from equity method investments.2 Excluding remeasurement gains (losses) related to defined benefit plans, net of tax.

57
Deutsche Bank Consolidated Statement of Changes in Equity (unaudited)Interim Report as of September 30, 2017
Unrealized netgains (losses)on derivatives
hedgingvariability
of cash flows,net of tax1
Unrealized net gains (losses)
on assets classified as held for sale,
net of tax1
Foreigncurrency
translation,net of tax1
Unrealized net gains (losses) from equity
method investments
Accumulatedother
compre-hensive
income (loss),net of tax2
Total shareholders’
equity
Additionalequity
components3Noncontrolling
interests Total equity97 662 2,196 66 4,404 62,678 4,675 270 67,62428 0 (1,069) 13 (601) (113) 0 41 (72)0 0 0 0 0 0 0 0 00 0 0 0 0 0 0 (11) (11)0 0 0 0 0 (276) 0 0 (276)
0 0 0 0 0 (533) 0 0 (533)0 0 0 0 0 (142) 0 0 (142)
0 0 0 0 0 237 0 0 237
0 0 0 0 0 0 0 0 0
0 0 0 0 0 0 0 0 0
0 0 0 0 0 0 0 0 0
0 0 0 0 0 (129) 0 0 (129)0 0 0 0 0 (3,750) 0 0 (3,750)0 0 0 0 0 3,503 0 0 3,5030 0 0 0 0 10 0 0 100 0 0 0 0 286 (2)4 (17) 267
125 662 1,126 79 3,803 61,770 4,673 284 66,727
143 0 2,418 77 3,550 59,833 4,669 316 64,819(115) 0 (2,308) (26) (2,649) (985) 0 (3) (988)
0 0 0 0 0 8,037 0 0 8,0370 0 0 0 0 (392) 0 (11) (403)0 0 0 0 0 (288) 0 0 (288)
0 0 0 0 0 (184) 0 0 (184)0 0 0 0 0 (245) 0 0 (245)
0 0 0 0 0 436 0 0 436
0 0 0 0 0 0 0 0 0
0 0 0 0 0 0 0 0 0
0 0 0 0 0 0 0 0 0
0 0 0 0 0 (104) 0 0 (104)0 0 0 0 0 (7,135) 0 0 (7,135)0 0 0 0 0 6,681 0 0 6,6810 0 0 0 0 12 0 0 120 0 0 0 0 10 04 (38) (28)
28 0 110 50 901 65,676 4,669 265 70,6093 Includes Additional Tier 1 Notes, which constitute unsecured and subordinated notes of Deutsche Bank and are classified as equity in accordance with IFRS.4 Includes net proceeds from purchase and sale of additional equity components.

58
Deutsche Bank 2 – Consolidated Financial StatementsInterim Report as of September 30, 2017
Consolidated Statement of Cash Flows (unaudited)Nine months ended
in € m. Sep 30, 2017 Sep 30, 2016Net income (loss) 1,689 534Cash flows from operating activities:Adjustments to reconcile net income to net cash provided by (used in) operating activities:
Provision for credit losses 396 891Restructuring activities 39 435Gain on sale of financial assets available for sale, equity method investments, and other (330) (713)Deferred income taxes, net 344 384Impairment, depreciation and other amortization, and accretion 1,506 1,521Share of net income (loss) from equity method investments (124) (176)
Income (loss) adjusted for noncash charges, credits and other items 3,520 2,876Adjustments for net change in operating assets and liabilities:
Interest-earning time deposits with central banks and banks (294) (1,054)Central bank funds sold, securities purchased under resale agreements, securities borrowed 943 4,115Financial assets designated at fair value through profit or loss (10,929) (8,776)Loans 9,283 3,505Other assets (20,203) (47,033)Deposits 27,428 (24,875)Financial liabilities designated at fair value through profit or loss and investment contract liabilities 1 (9,066) 10,449Central bank funds purchased, securities sold under repurchase agreements and securities loaned (5,379) 10,159Other short-term borrowings 1,012 (5,601)Other liabilities 34,565 36,043Senior long-term debt2 (12,674) 2,427Trading assets and liabilities, positive and negative market values from derivative financial instruments, net (2,504) 32,357Other, net 3,885 (5,671)
Net cash provided by (used in) operating activities 19,587 8,921Cash flows from investing activities:Proceeds from:
Sale of financial assets available for sale 7,490 14,407Maturities of financial assets available for sale 5,796 4,649Maturities of securities held to maturity 0 0Sale of equity method investments 39 36Sale of property and equipment 60 217
Purchase of:Financial assets available for sale (11,156) (16,996)Securities held to maturity 0 0Equity method investments (8) (17)Property and equipment (421) (435)
Net cash received in (paid for) business combinations/divestitures 93 239Other, net (891) (1,031)Net cash provided by (used in) investing activities 1,002 1,069Cash flows from financing activities:Issuances of subordinated long-term debt 52 784Repayments and extinguishments of subordinated long-term debt (134) (1,001)Issuances of trust preferred securities 3 98Repayments and extinguishments of trust preferred securities (401) (838)Common shares issued 8,037 0Purchases of treasury shares (7,135) (3,750)Sale of treasury shares 6,678 3,470Additional Equity Components (AT1) issued 0 0Purchases of Additional Equity Components (AT1) (145) (145)Sale of Additional Equity Components (AT1) 147 145Coupon on additional equity components, pre tax (335) (333)Dividends paid to noncontrolling interests (11) (11)Net change in noncontrolling interests (38) (17)Cash dividends paid to Deutsche Bank shareholders (392) 0Net cash provided by (used in) financing activities 6,326 (1,598)Net effect of exchange rate changes on cash and cash equivalents (4,538) (395)Net increase (decrease) in cash and cash equivalents 22,377 7,997Cash and cash equivalents at beginning of period 185,649 105,478Cash and cash equivalents at end of period 208,028 113,473Net cash provided by (used in) operating activities including
Income taxes paid (received), net 540 1,126Interest paid 8,185 8,270Interest received 15,986 16,648Dividends received 1,669 2,672
Cash and cash equivalents compriseCash and central bank balances (not included Interest-earning time deposits with central banks) 201,291 106,166Interbank balances (w/o central banks) (not included: time deposits of € 7,205 million as of September 30, 2017,and € 5,385 million as of September 30, 2016) 6,737 7,307
Total 208,028 113,4731 Included are senior long-term debt issuances of € 3,693 million and € 4,810 million and repayments and extinguishments of € 3,104 million and € 5,372 million through
September 30, 2017 and September 30, 2016, respectively.2 Included are issuances of € 26,831 million and € 36,492 million and repayments and extinguishments of € 35,755 million and € 34,846 million through September 30, 2017
and September 30, 2016, respectively.
59
Deutsche Bank Basis of Preparation (unaudited)Interim Report as of September 30, 2017
Basis of Preparation (unaudited)
The accompanying condensed consolidated interim financial statements, which include Deutsche Bank AG and its subsidiaries(collectively the “Group”), are stated in euros, the presentation currency of the Group. They are presented in accordance withthe requirements of IAS 34, “Interim Financial Reporting”, and have been prepared in accordance with International FinancialReporting Standards (“IFRS”) as issued by the International Accounting Standards Board (“IASB”) and endorsed by the Euro-pean Union (“EU”). The Group’s application of IFRS results in no differences between IFRS as issued by the IASB and IFRS asendorsed by the EU.
Some IFRS disclosures incorporated in the Management Report are an integral part of the consolidated interim financial state-ments. These include the Segmental Results of Operations of the Segmental Information note which is presented in the Operat-ing and Financial Review: Segmental Results of the Management Report. The presentation of this information is in compliancewith IAS 34 and IFRS 8, “Operating Segments”.
Deutsche Bank’s condensed consolidated interim financial statements are unaudited and include supplementary disclosures onsegment information, income statement, balance sheet and other financial information. They should be read in conjunction withthe audited consolidated financial statements of Deutsche Bank for 2016, for which the same accounting policies and criticalaccounting estimates have been applied with the exception of the newly adopted accounting pronouncements outlined in sec-tion “Impact of Changes in Accounting Principles”.
The preparation of financial statements under IFRS requires management to make estimates and assumptions for certaincategories of assets and liabilities.
These estimates and assumptions affect the reported amounts of assets and liabilities and disclosure of contingent assets andliabilities at the balance sheet date, and the reported amounts of revenue and expenses during the reporting period. Actualresults could differ from management’s estimates and the results reported should not be regarded as necessarily indicative ofresults that may be expected for the entire year.
In the third quarter of 2017, the Group has adjusted the parameters for shipping loans being assessed for impairment under agoing concern or gone concern scenario. This change in parameters resulted in an increase in the estimated impairment chargeof € 70 million. The Group also revised its general sale value adjustment applied to shipping loans with gone concern expo-sures, which also resulted in a change in estimate of € 36 million additional impairment. These changes in estimates are re-flected in the allowance for credit losses.

60
Deutsche Bank 3 – Notes to the Consolidated Financial StatementsInterim Report as of September 30, 2017
Impact of Changes in Accounting Principles(unaudited)
New Accounting PronouncementsThe following accounting pronouncements which are relevant to the Group were not effective as of September 30, 2017 andtherefore have not been applied in preparing these condensed consolidated interim financial statements.
IFRS 2 Share-based Payments
In June 2016, the IASB issued narrow-scope amendments to IFRS 2, “Share-based Payment” which clarify the accounting forcertain types of share-based payment transactions. The amendments which were developed through the IFRS InterpretationsCommittee clarify the accounting for cash-settled share-based payment transactions that include a performance condition, theclassification of share-based payment transactions with net settlement features and the accounting for modifications of share-based payment transactions from cash-settled to equity-settled. They are effective for annual periods beginning on or afterJanuary 1, 2018. The Group is currently assessing the impact of the clarifications to IFRS 2. The amendments have yet to beendorsed by the EU.
IFRS 9 Financial Instruments
In July 2014, the IASB issued IFRS 9 “Financial Instruments”, which replaces IAS 39, “Financial Instruments: Recognition andMeasurement”. IFRS 9 introduces new requirements on how an entity should classify and measure financial assets, requireschanges to the reporting of ‘own credit’ with respect to issued debt liabilities that are designated at fair value, replaces the cur-rent rules for impairment of financial assets and amends the requirements for hedge accounting. The standard also requiresentities to provide users of financial statements with more informative and relevant disclosures. IFRS 9 is effective for annualperiods beginning on or after January 1, 2018. The standard has been endorsed by the EU. Following the Group’s parallel runusing June 30, 2017 data and the current implementation status of IFRS 9 as described in further detail below, the Group esti-mates the adoption of IFRS 9 to lead to an overall reduction in the Group’s total shareholders’ equity of approximately€ 1.4 billion before tax. Roughly 80 % of the impact is driven by the new impairment requirements of IFRS 9. Changes to theGroup’s previously reported estimate are driven mainly by refinements to the impairment methodology and updates related tobusiness model assessments and fair value option elections under the classification and measurement element of IFRS 9,although some outstanding decisions remain. These numbers are still estimates and can change due to final decisions onclassification and measurement, market movements and final parameter calibrations as the Group completes its IFRS 9 imple-mentation program.
Implementation program
The Group has a centrally managed IFRS 9 program sponsored by the Group’s chief financial officer and includes subjectmatter experts on methodology, data sourcing and modelling, IT processing and reporting. The Group’s work to date has cov-ered performing an assessment of the population of financial instruments impacted by the classification and measurementrequirements of IFRS 9 and developing an impairment methodology to support the calculation of the Expected Credit Lossallowance. Specifically, during 2016 the Group developed its approach for assessing significant increase in credit risk, incorpo-rating forward looking information, including macro-economic factors (implemented in 2017) and preparing the required ITsystems and process architecture. The Group has performed a full end to end parallel run based on June 30, 2017 data toassess procedural readiness.
Overall governance of the program’s implementation is through the IFRS 9 Steering Committee and includes representationfrom Finance, Risk and IT. Guidance and training on IFRS 9 across the Group is delivered across businesses and functions aspart of the Group’s internal control systems. The Group is in the process of enhancing its governance framework to implementappropriate validations and controls over new key processes and significant areas of judgment. Governance over the ExpectedCredit Loss calculation process is split across Risk and Finance functions.

61
Deutsche Bank Impact of Changes in Accounting Principles (unaudited)Interim Report as of September 30, 2017 New Accounting Pronouncements
Classification and Measurement of Financial Assets and Liabilities
IFRS 9 requires that an entity’s business model and a financial instrument’s contractual cash flows will determine its classifica-tion and measurement in the financial statements. Upon initial recognition each financial asset will be classified as either fairvalue through profit or loss (‘FVTPL’), amortized cost, or fair value through Other Comprehensive Income (‘FVOCI’). As therequirements under IFRS 9 are different than the assessments under the existing IAS 39 rules, some differences to the classifi-cation and measurement of financial assets under IAS 39 are expected, including whether to elect the fair value option on cer-tain assets. The classification and measurement of financial liabilities remain largely unchanged under IFRS 9 from currentrequirements.
In 2016, the Group made an initial determination of business models and assessed the contractual cash flow characteristics ofthe financial assets to determine the potential classification and measurement changes as a result of IFRS 9. As a result of theanalysis performed thus far, the Group has identified a population of financial assets which are expected to be measured ateither amortized cost or fair value through other comprehensive income, which will be subject to the IFRS 9 impairment rules.The Group has updated its business model assessments in 2017 and the impact is reflected in the revised disclosures above.However, the actual impact that IFRS 9 classification and measurement will have on the Group will be dependent on the inven-tory of financial assets which exist as of 1 January 2018 and any remaining decisions to be finalized prior to adoption of IFRS 9.
Where issued debt liabilities are designated at fair value, the fair value movements attributable to an entity’s own credit risk willbe recognized in Other Comprehensive Income rather than in the Statement of Income. The standard also allows the Group theoption to elect to apply early the presentation of fair value movements of an entity’s credit risk in Other Comprehensive Incomeprior to adopting IFRS 9 in full. The Group has not early adopted this requirement.
Impairment of Financial Assets
The impairment requirements of IFRS 9 apply to financial assets that are measured at amortized cost or FVOCI, and off bal-ance sheet lending commitments such as loan commitments and financial guarantees (hereafter collectively referred to in thisnote as financial assets).
The determination of impairment losses and allowance will move from an incurred credit loss model whereby credit losses arerecognized when a defined loss event occurs under IAS 39, to an expected loss model under IFRS 9, where provisions aretaken upon initial recognition of the financial asset (or the date that the Group becomes a party to the loan commitment or fi-nancial guarantee), based on expectations of potential credit losses at that time under IFRS 9. Currently, the Group first evalu-ates individually whether objective evidence of impairment exists for loans that are individually significant. It then collectivelyassesses loans that are not individually significant and loans which are significant but for which there is no objective evidence ofimpairment available under the individual assessment.
Under IFRS 9 for financial assets originated or purchased, the Group will recognize a loss allowance at an amount equal to12-month expected credit losses, if the credit risk at the reporting date has not increased significantly since initial recognition(Stage 1). This amount represents the expected credit losses resulting from default events that are possible within the next12 months. The interest revenue is calculated on the gross carrying amount for financial assets in Stage 1.
IFRS 9 requires the recognition of credit losses over the remaining life of the financial assets (‘lifetime expected losses’) whichare considered to have experienced a significant increase in credit risk (Stage 2) and for financial assets that are credit impairedat the reporting date (Stage 3). The lifetime expected credit losses represent all possible default events over the expected life ofa financial instrument. The Group leverages existing risk management indicators (e.g. watch list and forbearance trigger), creditrating changes and taking into consideration reasonable and supportable information which allows the Group to identify whetherthe credit risk of financial assets has significantly increased. This process includes considering forward-looking information,including macro-economic factors. Furthermore, financial assets will be transferred to Stage 2 if 30 days past due. The interestrevenue is calculated on the gross carrying amount for financial assets in Stage 2.
As the primary definition for credit impaired financial assets moving to Stage 3, the Group will apply the default definition as laidout in CRR Article 178. Interest revenues are calculated on the net carrying amount for these financial assets only. Forward-looking information, including macro-economic factors must be taken into account to measure IFRS 9 compliant expected creditlosses.

62
Deutsche Bank 3 – Notes to the Consolidated Financial StatementsInterim Report as of September 30, 2017
IFRS 9 does not distinguish between individually significant or not individually significant financial instruments. Therefore, theGroup decided to measure the allowance for credit losses on an individual transaction basis. Similarly, the assessment fortransferring financial assets between Stages 1, 2 and 3 will also be made on an individual transaction basis. For detailed infor-mation on the current impairment approach under IAS 39 please refer to Note 1 “Significant Accounting Policies and CriticalAccounting Estimates”.
The Group uses three main components to measure expected credit losses which are a probability of default (‘PD’), a lossgiven default (‘LGD’) and the exposure at default (‘EAD’). Therefore, the Group will leverage the existing parameters of theregulatory framework and risk management practices as much as possible on transaction level. For the purpose of IFRS 9 theallowance for credit losses is affected by a variety of key characteristics, such as, but not limited to the expected balance atdefault and the related amortization profile as well as the expected life of the financial asset. As a consequence, the allowancefor credit losses for Stage 2 financial assets will increase with the expected lifetime or the expected EAD. Incorporating fore-casts of future economic conditions into the measurement of expected credit losses will additionally cause an impact on theallowance for credit losses for each stage. In order to calculate lifetime expected credit losses, the Group’s calculation includesderiving the corresponding lifetime PDs from migration matrices that reflect the economic forecasts. To determine whether afinancial asset is credit impaired and thus must be classified as Stage 3, one or more events must be identified that have adetrimental impact on the estimated future cash flows.
As a result of IFRS 9, there will be an increase in subjectivity as the allowance for credit losses will be based on reasonable andsupportable forward-looking information which take into consideration future macro-economic scenarios as provided byDeutsche Bank Research. These macro-economic scenarios are continuously monitored and in addition to being used for theGroup’s expected credit loss calculation, this information also forms the basis for performing the Group’s capital planning andstress-testing. This information provided by Deutsche Bank Research is used to generate possible future scenarios by utilizingthe Group’s stress testing infrastructure with appropriate modifications to align with IFRS 9 requirements. The Group has identi-fied certain synergies with the capital forecasting and stress-testing processes and will continue to consider opportunities thatmay exist. The transition impact and effects resulting from the continuous application of IFRS 9 are reflected in the Group’scapital planning for 2018 and onwards. The general use of forward-looking information, including macro-economic factors aswell as adjustments taking into account extraordinary factors, will be monitored by a governance framework.
IFRS 9 will result in an increase in the overall level of allowances for credit losses as noted above. This estimated increase isdriven by the requirement to record an allowance equal to 12 months expected credit losses on those instruments whose creditrisk has not significantly increased since initial recognition and driven by the larger population of financial assets to which life-time expected losses must be applied.
Hedge accounting
IFRS 9 also incorporates new hedge accounting rules that intend to align hedge accounting with risk management practices.Generally, some restrictions under current rules have been removed and a greater variety of hedging instruments and hedgeditems become available for hedge accounting. IFRS 9 includes an accounting policy choice to defer the adoption of IFRS 9hedge accounting and to continue with IAS 39 hedge accounting. The Group has decided to exercise this accounting policychoice and therefore will not adopt IFRS 9 hedge accounting as of the effective date of IFRS 9. However, the Group will imple-ment the revised hedge accounting disclosures that are required by the IFRS 9 related amendments to IFRS 7 “Financial In-struments: Disclosures”’.
Amendments to IFRS 9 “Prepayment Features with Negative Compensation”
In October 2017, the IASB issued an amendment to IFRS 9 “Financial Instruments”, which allows to measure particular pre-payable financial assets with so-called negative compensation (also known as two way break clauses) at amortized cost or atfair value through other comprehensive income if the prepayment amount substantially represents unpaid principal and interestand reasonable compensation. Reasonable compensation may be positive or negative. Prior to this amendment financial as-sets with this negative compensation feature would have failed the solely payments of principal and interest test and be manda-torily measured at fair value through profit or loss. The amendment will be effective for annual periods beginning on or afterJanuary 1, 2019, with early adoption permitted. The Group expects to early adopt this amendment from January 1, 2018 whichis the transition date to IFRS 9. The amendment will not have a material impact on the Group’s consolidated financial state-ments. The amendments have yet to be endorsed by the EU.

63
Deutsche Bank Impact of Changes in Accounting Principles (unaudited)Interim Report as of September 30, 2017 New Accounting Pronouncements
IFRS 15 Revenue from Contracts with Customers
In May 2014, the IASB issued IFRS 15, “Revenue from Contracts with Customers”, which specifies how and when revenue isrecognized, but does not impact income recognition related to financial instruments in scope of IAS 39/IFRS 9. IFRS 15 replac-es several other IFRS standards and interpretations that currently govern revenue recognition under IFRS and provides a single,principles-based five-step model to be applied to all contracts with customers. The standard also requires entities to provideusers of financial statements with more informative and relevant disclosures. IFRS 15 is effective for annual periods beginningon or after January 1, 2018. IFRS 15 will not have a material impact on the Group’s consolidated financial statements. Thestandard has been endorsed by the EU.
IFRS 16 Leases
In January 2016, the IASB issued IFRS 16, “Leases”, which introduces a single lessee accounting model and requires a lesseeto recognize assets and liabilities for all leases with a term of more than 12 months, unless the underlying asset is of low value.A lessee is required to recognize a right-of-use asset representing its right to use the underlying leased asset and a lease liabil-ity representing its obligation to make lease payments. There will be only minor changes to the current accounting for lessors.The standard also requires entities to provide users of financial statements with more informative and relevant disclosures.IFRS 16 is effective for annual periods beginning on or after January 1, 2019. The Group is currently assessing the impact ofIFRS 16. The standard has yet to be endorsed by the EU.
IFRS 17 Insurance Contracts
In May 2017, the IASB issued IFRS 17, “Insurance Contracts”, which establishes the principles for the recognition, measure-ment, presentation and disclosure of insurance contracts within the scope of the standard. IFRS 17 replaces IFRS 4 which hasgiven companies dispensation to carry on accounting for insurance contracts using national accounting standards, resulting in amultitude of different approaches. IFRS 17 solves the comparison problems created by IFRS 4 by requiring all insurance con-tracts to be accounted for in a consistent manner, benefiting both investors and insurance companies. Insurance obligations willbe accounted for using current values – instead of historical cost. The information will be updated regularly, providing moreuseful information to users of financial statements. IFRS 17 is effective for annual periods beginning on or after January 1, 2021.Based on the Group’s current business activities it is initially estimated that IFRS 17 will not have a material impact on theGroup’s consolidated financial statements. The standard has yet to be endorsed by the EU.

64
Deutsche Bank 3 – Notes to the Consolidated Financial StatementsInterim Report as of September 30, 2017
Segment Information (unaudited)
The following segment information has been prepared in accordance with the “management approach”, which requires presen-tation of the segments on the basis of the internal management reports of the entity which are regularly reviewed by the chiefoperating decision maker, which is the Deutsche Bank Management Board, in order to allocate resources to a segment and toassess its financial performance.
Business SegmentsThe Group’s segment reporting follows the organizational structure as reflected in its internal management reporting systems,which are the basis for assessing the financial performance of the business segments and for allocating resources to the busi-ness segments. Generally, restatements due to changes in the organizational structure were implemented in the presentation ofprior period comparables if they were considered in the Group’s management reporting systems.
Beginning of the second quarter of 2017, in accordance with our strategy announcement on March 5, 2017, our business oper-ations are reorganized under a new divisional structure comprising the following divisions:
Corporate & Investment Bank (“CIB”), Private & Commercial Bank (“PCB”), Deutsche Asset Management (“Deutsche AM”)
The key changes compared to Deutsche Bank’s previously reported segmental information are outlined below.
Corporate & Investment Bank (CIB) - The new corporate division “Corporate & Investment Bank” combines the former seg-ments “Global Markets” and “Corporate & Investment Banking”. It comprises the bank’s Corporate Finance, Global Markets andGlobal Transaction Banking businesses.
Private & Commercial Bank (PCB) - The corporate division “Private & Commercial Bank” combines the businesses with privateand commercial clients of Deutsche Bank and Postbank, which formerly had been reported separately, and the wealth man-agement activities for wealthy clients, foundations and family offices.
Deutsche Asset Management (Deutsche AM) - The corporate division Deutsche Asset Management remains materially un-changed and contains the asset management activities of Deutsche Bank. It focuses on providing investment solutions to indi-vidual investors and institutions that serve them.
Certain Infrastructure functions previously reported under Consolidation & Adjustments, reflected in our business segments onan allocated basis, have been integrated more closely into our business divisions.
From 2017 onwards, Non-Core Operations Unit (NCOU) ceased to exist as a standalone division. The remaining legacy assetsas of December 31, 2016 are now managed by the corresponding operating segments, predominately in Corporate & Invest-ment Bank and Private and Commercial Bank.
In the third quarter 2017 Invested Assets related to Postbank were revised. Prior periods have been restated accordingly.
Capital Expenditures and Divestitures
During the first nine months of 2017, the Group has made the following capital expenditures or divestitures:
Early in October 2017, Deutsche Bank Group signed a binding agreement to sell its Alternative Fund Services business, a unitof the Global Transaction Banking division, to Apex Group Limited. The transaction supports the Group’s announced strategicpriorities.
In March 2017, Deutsche Bank Group has signed a definitive agreement to sell its share in Concardis GmbH, a leading Ger-man payment service provider established in form of a joint venture of the German banking sector, to a consortium of AdventInternational and Bain Capital Private Equity. In July 2017, the transaction was successfully completed.

65
Deutsche Bank Segment Information (unaudited)Interim Report as of September 30, 2017 Segmental Results of Operations
In August 2016, Deutsche Bank Group entered into an agreement to sell Deutsche Bank S.A., its subsidiary in Argentina, toBanco Comafi S.A. The transaction is part the Group’s plan to rationalize its global footprint. In June 2017, the transaction wassuccessfully completed.
On December 28, 2015, Deutsche Bank Group agreed to sell its entire 19.99 % stake in Hua Xia Bank Company Limited (“HuaXia”) to PICC Property and Casualty Company Limited (“PICC Property & Casualty”). The completion of the transaction wassubject to customary closing conditions and regulatory approvals, including that of the China Banking Regulatory Commission.Regulatory approvals for PICC Property and Casualty to acquire Deutsche Bank’s stake in Hua Xia were granted and the sharetransfer was completed in the fourth quarter 2016. All remaining closing formalities were completed in the first quarter of 2017.
Allocation of Average Shareholders’ EquityStarting 2017, the Group has refined its capital allocation methodology. Shareholders’ equity is now fully allocated to theGroup’s segments based on the regulatory capital demand of each segment and is no longer capped at the amount of share-holders’ equity required to meet the externally communicated targets for the Group’s Common Equity Tier 1 ratio and theGroup’s Leverage ratio. Regulatory capital demand reflects the combined contribution of each segment to the Group’s CommonEquity Tier 1 ratio, the Group’s Leverage ratio and the Group’s Capital Loss under Stress. Contributions in each of the threedimensions are weighted to reflect their relative importance and level of constraint for the Group. Contributions to the CommonEquity Tier 1 ratio and the Leverage ratio are measured though Risk-Weighted Assets (RWA) and Leverage Ratio Exposure(LRE) assuming full implementation of CRR/CRD 4 rules. The Group’s Capital Loss under Stress is a measure of the Group’soverall economic risk exposure under a defined stress scenario. Goodwill and other intangible assets continue to be directlyattributed to the Group’s segments in order to allow the determination of allocated tangible shareholders’ equity and the respec-tive returns. Shareholders’ equity and tangible shareholders’ equity is allocated on a monthly basis and averaged across quar-ters and for the full year. All reported periods in 2016 have been restated.
The difference between the spot values of the segments and the average Group amount is captured in C&A.
For purposes of the 2017 average shareholders’ equity allocation the Non-Core Operations Unit (NCOU) balances from year-end 2016 have been allocated to Consolidation & Adjustments (C&A) as the Non-Core Operations Unit (NCOU) has ceased toexist as a separate corporate division from 2017 onwards.
Segmental Results of OperationsFor the results of the business segments, including the reconciliation to the consolidated results of operations under IFRS,please see “Management Report: Operating and Financial Review: Results of Operations: Segment Results of Operations” ofthis Interim Report.

66
Deutsche Bank 3 – Notes to the Consolidated Financial StatementsInterim Report as of September 30, 2017
Information on the Consolidated Income Statement(unaudited)
Net Interest Income and Net Gains (Losses) on FinancialAssets/Liabilities at Fair Value through Profit or Loss
Three months ended Nine months endedin € m. Sep 30, 2017 Sep 30, 2016 Sep 30, 2017 Sep 30, 2016Net interest income 3,387 3,525 9,561 11,142
Trading income1 481 435 2,995 836Net gains (losses) on financial assets/liabilities designated at fair valuethrough profit or loss 177 (45) (383) 1,275
Total net gains (losses) on financial assets/liabilities at fair value through profitor loss 659 390 2,612 2,111Total net interest income and net gains (losses) on financial assets/liabilitiesat fair value through profit or loss 4,045 3,915 12,173 13,253
Sales & Trading (Equity) 406 490 1,354 1,574Sales & Trading (FIC) 1,075 1,404 4,054 4,229
Total Sales & Trading 1,481 1,894 5,408 5,803Financing 457 403 1,269 1,211Global Transaction Banking 498 522 1,475 1,571Remaining Products (153) (48) (626) (9)
Corporate & Investment Bank 2,284 2,771 7,526 8,576Private & Commercial Bank 1,515 1,446 4,581 5,157Deutsche Asset Management (14) 205 15 333Non-Core Operations Unit 0 (359) 0 (1,198)Consolidation & Adjustments 261 (148) 51 385Total net interest income and net gains (losses) on financial assets/liabilitiesat fair value through profit or loss 4,045 3,915 12,173 13,2531 Trading income includes gains and losses from derivatives not qualifying for hedge accounting.
Commissions and Fee IncomeThree months ended Nine months ended
in € m. Sep 30, 2017 Sep 30, 2016 Sep 30, 2017 Sep 30, 2016Commissions and fees from fiduciary activities 1,060 1,095 3,237 3,148Commissions, brokers’ fees, mark-ups on securities underwriting andother securities activities 632 815 2,281 2,591Fees for other customer services 890 1,116 2,838 3,086Total commissions and fee income 2,582 3,027 8,356 8,825
Pensions and Other Post-Employment BenefitsThree months ended Nine months ended
in € m. Sep 30, 2017 Sep 30, 2016 Sep 30, 2017 Sep 30, 2016Service cost 81 62 252 217Net interest cost (income) 2 (2) 7 (8)Total expenses defined benefit plans 83 60 259 209Total expenses for defined contribution plans 107 101 338 334Total expenses for post-employment benefits 190 161 597 543
Employer contributions to mandatory German social security pension plan 57 62 179 178
The Group expects to pay approximately € 300 million in regular contributions to its retirement benefit plans in 2017. It is notexpected that any plan assets will be returned to the Group during the year ending December 31, 2017.

67
Deutsche Bank Information on the Consolidated Income Statement (unaudited)Interim Report as of September 30, 2017 Restructuring
Discount rate to determine defined benefit obligationin % Sep 30, 2017 Dec 31, 2016Germany 1.8 1.7UK 2.6 2.6U.S. 3.7 4.0
General and Administrative ExpensesThree months ended Nine months ended
in € m. Sep 30, 2017 Sep 30, 2016 Sep 30, 2017 Sep 30, 2016IT costs 938 932 2,799 2,853Occupancy, furniture and equipment expenses 447 484 1,345 1,391Professional service fees 410 511 1,260 1,633Communication and data services 166 185 523 568Travel and representation expenses 90 105 284 337Banking and transaction charges 190 170 544 487Marketing expenses 74 51 200 177Consolidated investments 0 89 0 258Other expenses1 549 964 1,835 2,743Total general and administrative expenses 2,865 3,490 8,789 10,4471 Includes net litigation related expenses of € 140 million for the three months ended September 30, 2017 and € 501 million for the three months ended September 30, 2016.
Litigation related expenses were € 82 million for the nine months ended September 30, 2017 and € 809 million for nine months ended September 30, 2016. Also included onaccount of the bank levy are expenses of € 24 million for the three months ended September 30, 2017 and € 6 million for the same period in 2016 and bank levy expenses of€ 585 million and € 531 million for the nine months ended September 30, 2017 and nine months ended September 30, 2016 respectively.
RestructuringRestructuring forms part of the Group’s multi-year strategy outlined in October 2015, as well as our new strategic measures andtargets announced in March 2017. These new actions include initiatives to reorganize our businesses into three divisions, repo-sition Deutsche AM through a minority IPO and extension of our cost restructuring program - with the aim of strengthening ourbusinesses to achieve growth and reduce adjusted costs to approximately € 22 billion in 2018, which includes Postbank’s ad-justed costs, and approximately € 21 billion by 2021.
Restructuring expense is comprised of termination benefits, additional expenses covering the acceleration of deferred compen-sation awards not yet amortized due to the discontinuation of employment and contract termination costs related to real estate.
Net restructuring expense by divisionThree months ended Nine months ended
in € m. Sep 30, 2017 Sep 30, 2016 Sep 30, 2017 Sep 30, 2016Corporate & Investment Bank 5 (39) (94) (274)Private & Commercial Bank 5 7 57 (113)Deutsche Asset Management 2 (12) (2) (44)Non-Core Operations Unit 0 0 0 (4)Total Net Restructuring Charges 12 (45) (39) (435)
Net restructuring expense by typeThree months ended Nine months ended
in € m. Sep 30, 2017 Sep 30, 2016 Sep 30, 2017 Sep 30, 2016Restructuring – Staff related 13 (46) (42) (444)
Thereof:Termination Payments 16 (27) (22) (395)Retention Acceleration (3) (18) (19) (45)Social Security (0) (1) (1) (4)
Restructuring – Non Staff related1 (1) 0 3 9Total net restructuring Charges 12 (45) (39) (435)1 Contract costs, mainly related to real estate and technology.
Provisions for restructuring amounted to € 382 million and € 741 million as of September 30, 2017 and December 31, 2016,respectively. The majority of the current provisions for restructuring should be utilized in the next two years.

68
Deutsche Bank 3 – Notes to the Consolidated Financial StatementsInterim Report as of September 30, 2017
During the three months ended September 30, 2017, 399 full-time equivalent staff were reduced as part of our restructuringprogram. These reductions were identified within:
Three monthsended
Sep 30, 2017Corporate & Investment Bank 45Private & Commercial Bank 266Deutsche Asset Management 6Infrastructure/Regional Management 83Total full-time equivalent staff 399
Effective Tax Rate
2017 to 2016 Three Months Comparison
Income tax expense in the current quarter was € 284 million (third quarter of 2016: € 340 million). The effective tax rate was30 %. The prior year’s quarter effective tax rate of 55 % was mainly impacted by non-tax deductible litigation charges.
2017 to 2016 Nine Months Comparison
Income tax expense in the first nine months of 2017 was € 944 million (first nine months of 2016: € 1.1 billion). The effective taxrate was 36 %. In the first nine months of 2016 the effective tax rate of 67 % was mainly impacted by non-tax deductible good-will impairment, litigation charges and tax effects related to share based payments.

69
Deutsche Bank Information on the Consolidated Balance Sheet (unaudited)Interim Report as of September 30, 2017 Securities Held to Maturity
Information on the Consolidated Balance Sheet(unaudited)
Financial Assets/Liabilities at Fair Value through Profit or Lossin € m. Sep 30, 2017 Dec 31, 2016Financial assets classified as held for trading:
Trading assets:Trading securities 173,347 156,926Other trading assets1 13,370 14,117
Total trading assets 186,716 171,044Positive market values from derivative financial instruments 372,019 485,150
Total financial assets classified as held for trading 558,735 656,194Financial assets designated at fair value through profit or loss:
Securities purchased under resale agreements 63,643 47,404Securities borrowed 18,168 21,136Loans 5,803 7,505Other financial assets designated at fair value through profit or loss 8,569 11,541
Total financial assets designated at fair value through profit or loss 96,183 87,587Total financial assets at fair value through profit or loss 654,918 743,7811 Includes traded loans of € 12.3 billion and € 13.2 billion at September 30, 2017 and December 31, 2016, respectively.
in € m. Sep 30, 2017 Dec 31, 2016Financial liabilities classified as held for trading:
Trading liabilities:Trading securities 73,789 56,592Other trading liabilities 412 437
Total trading liabilities 74,201 57,029Negative market values from derivative financial instruments 348,346 463,858
Total financial liabilities classified as held for trading 422,548 520,887Financial liabilities designated at fair value through profit or loss:
Securities sold under repurchase agreements 38,967 50,397Loan commitments 13 40Long-term debt 6,878 6,473Other financial liabilities designated at fair value through profit or loss 3,900 3,582
Total financial liabilities designated at fair value through profit or loss 49,758 60,492Investment contract liabilities1 600 592Total financial liabilities at fair value through profit or loss 472,906 581,9711 These are investment contracts where the policy terms and conditions result in their redemption values equaling fair values.
Financial Assets Available for Salein € m. Sep 30, 2017 Dec 31, 2016Debt securities 47,425 51,516Equity securities 978 1,149Other equity interests 656 804Loans 2,481 2,759Total financial assets available for sale 51,540 56,228
Securities Held to MaturityIn the first quarter of 2016, the Group began to use the Held to Maturity category to more appropriately present income andcapital volatility in the firm’s banking book. In addition to managing the firm’s existing banking book exposure to interest rates,this accounting classification will support certain of the Group’s asset liability management objectives, e.g. maturity transfor-mation.

70
Deutsche Bank 3 – Notes to the Consolidated Financial StatementsInterim Report as of September 30, 2017
The Group reclassified € 3.2 billion of securities held Available for Sale to Held to Maturity investments effective January 4, 2016.All reclassified assets are high quality Government, supranational and agency bonds and are managed by Group Treasury aspart of the Group’s Strategic Liquidity Reserve.
Carrying values and fair values of financial assets reclassified from Available for Sale to Held to Maturity Sep 30, 2017 Dec 31, 2016
in € m.Carrying
value (CV)Fair
Value (FV)Carrying
value (CV)Fair
Value (FV)Debt securities reclassified:
G7 Government bonds 424 437 428 446Other Government, supranational and agency bonds 2,755 2,814 2,778 2,859
Total financial assets reclassified to Held-to-Maturity 3,179 3,251 3,206 3,305
Financial Instruments carried at Fair Value
Fair Value Hierarchy
The financial instruments carried at fair value have been categorized under the three levels of the IFRS fair value hierarchy asfollows:
Level 1 – Instruments valued using quoted prices in active markets are instruments where the fair value can be determineddirectly from prices which are quoted in active, liquid markets and where the instrument observed in the market is representa-tive of that being priced in the Group’s inventory.
These include: government bonds, exchange-traded derivatives and equity securities traded on active, liquid exchanges.
Level 2 – Instruments valued with valuation techniques using observable market data are instruments where the fair valuecan be determined by reference to similar instruments trading in active markets, or where a technique is used to derive thevaluation but where all inputs to that technique are observable.
These include: many OTC derivatives; many investment-grade listed credit bonds; some CDS; many collateralized debt obliga-tions (CDO); and many less-liquid equities.
Level 3 – Instruments valued using valuation techniques using market data which is not directly observable are instru-ments where the fair value cannot be determined directly by reference to market-observable information, and some other pric-ing technique must be employed. Instruments classified in this category have an element which is unobservable and which hasa significant impact on the fair value.
These include: more-complex OTC derivatives; distressed debt; highly-structured bonds; illiquid asset-backed securities (ABS);illiquid CDO’s (cash and synthetic); monoline exposures; some private equity placements; many commercial real estate (CRE)loans; illiquid loans; and some municipal bonds.
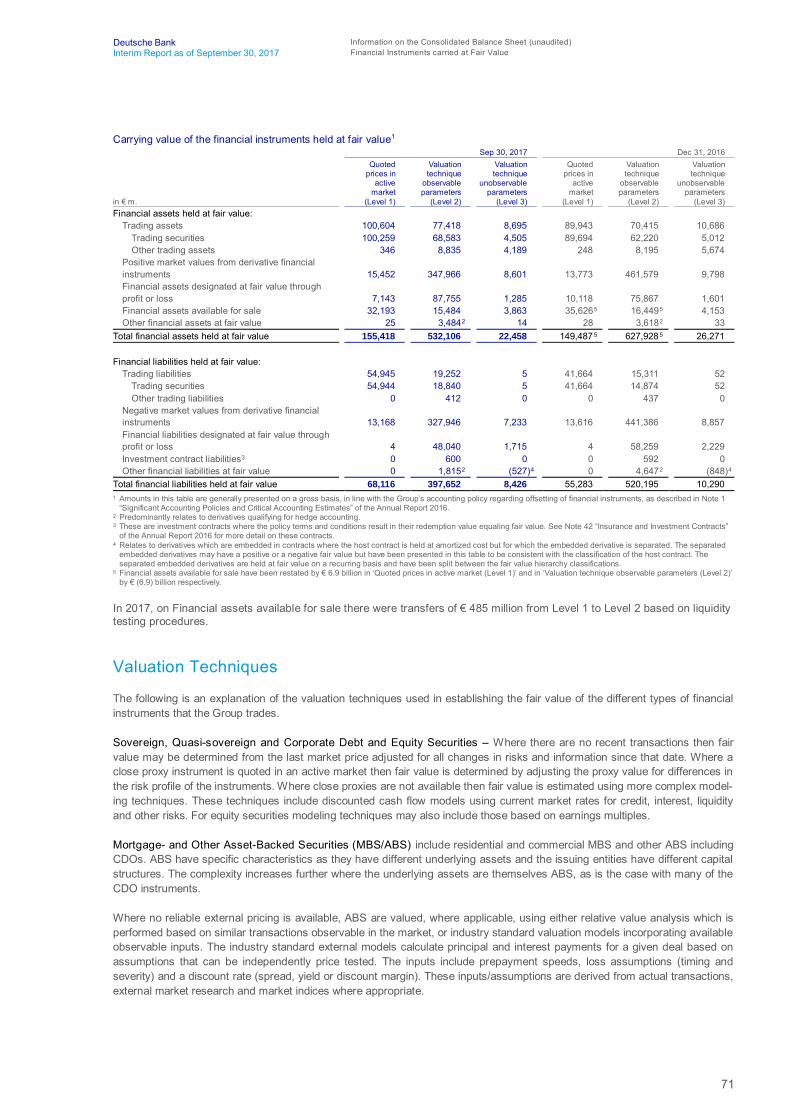
71
Deutsche Bank Information on the Consolidated Balance Sheet (unaudited)Interim Report as of September 30, 2017 Financial Instruments carried at Fair Value
Carrying value of the financial instruments held at fair value1
Sep 30, 2017 Dec 31, 2016
in € m.
Quotedprices in
activemarket
(Level 1)
Valuationtechnique
observable parameters
(Level 2)
Valuationtechnique
unobservable parameters
(Level 3)
Quotedprices in
activemarket
(Level 1)
Valuationtechnique
observable parameters
(Level 2)
Valuationtechnique
unobservable parameters
(Level 3)Financial assets held at fair value:
Trading assets 100,604 77,418 8,695 89,943 70,415 10,686Trading securities 100,259 68,583 4,505 89,694 62,220 5,012Other trading assets 346 8,835 4,189 248 8,195 5,674
Positive market values from derivative financialinstruments 15,452 347,966 8,601 13,773 461,579 9,798Financial assets designated at fair value throughprofit or loss 7,143 87,755 1,285 10,118 75,867 1,601Financial assets available for sale 32,193 15,484 3,863 35,6265 16,4495 4,153Other financial assets at fair value 25 3,4842 14 28 3,6182 33
Total financial assets held at fair value 155,418 532,106 22,458 149,4875 627,9285 26,271
Financial liabilities held at fair value:Trading liabilities 54,945 19,252 5 41,664 15,311 52
Trading securities 54,944 18,840 5 41,664 14,874 52Other trading liabilities 0 412 0 0 437 0
Negative market values from derivative financialinstruments 13,168 327,946 7,233 13,616 441,386 8,857Financial liabilities designated at fair value throughprofit or loss 4 48,040 1,715 4 58,259 2,229Investment contract liabilities3 0 600 0 0 592 0Other financial liabilities at fair value 0 1,8152 (527)4 0 4,6472 (848)4
Total financial liabilities held at fair value 68,116 397,652 8,426 55,283 520,195 10,2901 Amounts in this table are generally presented on a gross basis, in line with the Group’s accounting policy regarding offsetting of financial instruments, as described in Note 1
“Significant Accounting Policies and Critical Accounting Estimates” of the Annual Report 2016.2 Predominantly relates to derivatives qualifying for hedge accounting.3 These are investment contracts where the policy terms and conditions result in their redemption value equaling fair value. See Note 42 “Insurance and Investment Contracts”
of the Annual Report 2016 for more detail on these contracts.4 Relates to derivatives which are embedded in contracts where the host contract is held at amortized cost but for which the embedded derivative is separated. The separated
embedded derivatives may have a positive or a negative fair value but have been presented in this table to be consistent with the classification of the host contract. Theseparated embedded derivatives are held at fair value on a recurring basis and have been split between the fair value hierarchy classifications.
5 Financial assets available for sale have been restated by € 6.9 billion in ‘Quoted prices in active market (Level 1)’ and in ‘Valuation technique observable parameters (Level 2)’by € (6.9) billion respectively.
In 2017, on Financial assets available for sale there were transfers of € 485 million from Level 1 to Level 2 based on liquiditytesting procedures.
Valuation Techniques
The following is an explanation of the valuation techniques used in establishing the fair value of the different types of financialinstruments that the Group trades.
Sovereign, Quasi-sovereign and Corporate Debt and Equity Securities – Where there are no recent transactions then fairvalue may be determined from the last market price adjusted for all changes in risks and information since that date. Where aclose proxy instrument is quoted in an active market then fair value is determined by adjusting the proxy value for differences inthe risk profile of the instruments. Where close proxies are not available then fair value is estimated using more complex model-ing techniques. These techniques include discounted cash flow models using current market rates for credit, interest, liquidityand other risks. For equity securities modeling techniques may also include those based on earnings multiples.
Mortgage- and Other Asset-Backed Securities (MBS/ABS) include residential and commercial MBS and other ABS includingCDOs. ABS have specific characteristics as they have different underlying assets and the issuing entities have different capitalstructures. The complexity increases further where the underlying assets are themselves ABS, as is the case with many of theCDO instruments.
Where no reliable external pricing is available, ABS are valued, where applicable, using either relative value analysis which isperformed based on similar transactions observable in the market, or industry standard valuation models incorporating availableobservable inputs. The industry standard external models calculate principal and interest payments for a given deal based onassumptions that can be independently price tested. The inputs include prepayment speeds, loss assumptions (timing andseverity) and a discount rate (spread, yield or discount margin). These inputs/assumptions are derived from actual transactions,external market research and market indices where appropriate.
72
Deutsche Bank 3 – Notes to the Consolidated Financial StatementsInterim Report as of September 30, 2017
Loans – For certain loans fair value may be determined from the market price on a recently occurring transaction adjusted forall changes in risks and information since that transaction date. Where there are no recent market transactions then brokerquotes, consensus pricing, proxy instruments or discounted cash flow models are used to determine fair value. Discountedcash flow models incorporate parameter inputs for credit risk, interest rate risk, foreign exchange risk, loss given default esti-mates and amounts utilized given default, as appropriate. Credit risk, loss given default and utilization given default parametersare determined using information from the loan or CDS markets, where available and appropriate.
Leveraged loans can have transaction-specific characteristics which can limit the relevance of market-observed transactions.Where similar transactions exist for which observable quotes are available from external pricing services then this information isused with appropriate adjustments to reflect the transaction differences. When no similar transactions exist, a discounted cashflow valuation technique is used with credit spreads derived from the appropriate leveraged loan index, incorporating the indus-try classification, subordination of the loan, and any other relevant information on the loan and loan counterparty.
Over-The-Counter Derivative Financial Instruments – Market standard transactions in liquid trading markets, such as interestrate swaps, foreign exchange forward and option contracts in G7 currencies, and equity swap and option contracts on listedsecurities or indices are valued using market standard models and quoted parameter inputs. Parameter inputs are obtainedfrom pricing services, consensus pricing services and recently occurring transactions in active markets wherever possible.
More complex instruments are modeled using more sophisticated modeling techniques specific for the instrument and arecalibrated to available market prices. Where the model output value does not calibrate to a relevant market reference thenvaluation adjustments are made to the model output value to adjust for any difference. In less active markets, data is obtainedfrom less frequent market transactions, broker quotes and through extrapolation and interpolation techniques. Where observa-ble prices or inputs are not available, management judgment is required to determine fair values by assessing other relevantsources of information such as historical data, fundamental analysis of the economics of the transaction and proxy informationfrom similar transactions.
Financial Liabilities Designated at Fair Value through Profit or Loss under the Fair Value Option – The fair value of finan-cial liabilities designated at fair value through profit or loss under the fair value option incorporates all market risk factors includ-ing a measure of the Group’s credit risk relevant for that financial liability. The financial liabilities include structured noteissuances, structured deposits, and other structured securities issued by consolidated vehicles, which may not be quoted in anactive market. The fair value of these financial liabilities is determined by discounting the contractual cash flows using the rele-vant credit-adjusted yield curve. The market risk parameters are valued consistently to similar instruments held as assets, forexample, any derivatives embedded within the structured notes are valued using the same methodology discussed in the“Over-The-Counter Derivative Financial Instruments” section above.
Where the financial liabilities designated at fair value through profit or loss under the fair value option are collateralized, such assecurities loaned and securities sold under repurchase agreements, the credit enhancement is factored into the fair valuation ofthe liability.
Investment Contract Liabilities – Assets which are linked to the investment contract liabilities are owned by the Group. Theinvestment contract obliges the Group to use these assets to settle these liabilities. Therefore, the fair value of investment con-tract liabilities is determined by the fair value of the underlying assets (i.e., amount payable on surrender of the policies).
Analysis of Financial Instruments with Fair Value Derived from ValuationTechniques Containing Significant Unobservable Parameters (Level 3)
Some of the instruments in level 3 of the fair value hierarchy have identical or similar offsetting exposures to the unobservableinput. However, according to IFRS they are required to be presented as gross assets and liabilities.
Trading Securities – Certain illiquid emerging market corporate bonds and illiquid highly structured corporate bonds are includ-ed in this level of the hierarchy. In addition, some of the holdings of notes issued by securitization entities, commercial andresidential MBS, collateralized debt obligation securities and other ABS are reported here. The decrease in the period wasmainly due to losses, sales and settlements offset by transfers between levels 2 and 3 and purchases.
Positive and Negative Market Values from Derivative Instruments categorized in this level of the fair value hierarchy arevalued based on one or more significant unobservable parameters. The unobservable parameters may include certain correla-tions, certain longer-term volatilities, certain prepayment rates, credit spreads and other transaction-specific parameters.

73
Deutsche Bank Information on the Consolidated Balance Sheet (unaudited)Interim Report as of September 30, 2017 Financial Instruments carried at Fair Value
Level 3 derivatives include certain options where the volatility is unobservable; certain basket options in which the correlationsbetween the referenced underlying assets are unobservable; longer-term interest rate option derivatives; multi-currency foreignexchange derivatives; and certain credit default swaps for which the credit spread is not observable. The decrease in the periodis driven by settlements, losses and transfers between level 2 and 3.
Other Trading Instruments classified in level 3 of the fair value hierarchy mainly consist of traded loans valued using valuationmodels based on one or more significant unobservable parameters. Level 3 loans comprise illiquid leveraged loans and illiquidresidential and commercial mortgage loans. The decrease in the period refers to sales and settlements and losses offset bypurchases, issuances and transfers between level 2 and 3.
Financial Assets/Liabilities designated at Fair Value through Profit or Loss – Certain corporate loans and structured liabili-ties which were designated at fair value through profit or loss under the fair value option are categorized in this level of the fairvalue hierarchy. The corporate loans are valued using valuation techniques which incorporate observable credit spreads, re-covery rates and unobservable utilization parameters. Revolving loan facilities are reported in the third level of the hierarchybecause the utilization in the event of the default parameter is significant and unobservable.
In addition, certain hybrid debt issuances designated at fair value through profit or loss containing embedded derivatives arevalued based on significant unobservable parameters. These unobservable parameters include single stock volatility correla-tions. The decrease in assets during the period is primarily due to sales, settlements, transfers between levels 2 and 3 andlosses partially offset by purchases and issuance. Liabilities decreased due transfers between levels 2 and 3 settlements andgains partially offset by issuance.
Financial Assets Available for Sale include non-performing loan portfolios where there is no trading intent and unlisted equityinstruments where there is no close proxy and the market is very illiquid. Assets decreased due to sales and settlements offsetby gains, purchases and transfers between levels 2 and 3.

74
Deutsche Bank 3 – Notes to the Consolidated Financial StatementsInterim Report as of September 30, 2017
Reconciliation of financial instruments classified in Level 3Sep 30, 2017
in € m.
Balance, beginning of year
Changes in the group of consoli-dated com-
panies
Totalgains/losses1 Purchases Sales
Issu-ances2
Settle-ments3
Transfersinto
Level 34
Transfersout of
Level 34
Balance,end ofperiod
Financial assetsheld at fair value:
Trading securities 5,012 (1) (137) 1,474 (1,481) 0 (396) 696 (662) 4,505Positive marketvalues fromderivative finan-cial instruments 9,798 0 (209) 0 0 0 (799) 2,306 (2,495) 8,601Other tradingassets 5,674 (7) (245) 1,370 (2,268) 344 (1,078) 1,090 (691) 4,189Financial assetsdesignated at fairvalue throughprofit or loss 1,601 0 (89) 473 (79) 6 (435) 45 (237) 1,285Financial assetsavailable for sale 4,153 (37) 565 452 (164) 0 (750) 187 (34) 3,863Other financialassets at fair value 33 0 2 0 0 0 (21) 0 0 14
Total financial assetsheld at fair value 26,271 (45)
(622)6,7 3,768 (3,991) 350 (3,480) 4,324 (4,118) 22,458
Financial liabilitiesheld at fair value:
Trading securities 52 0 (5) 0 0 0 (43) 1 0 5Negative marketvalues fromderivative financialinstruments 8,857 (5) (229) 0 0 0 (129) 951 (2,211) 7,233Other tradingliabilities 0 0 (0) 0 0 0 0 0 0 0Financial liabilitiesdesignated at fairvalue throughprofit or loss 2,229 (7) (109) 0 0 135 (153) 100 (481) 1,715Other financialliabilities at fair val-ue (848) 0 212 0 0 0 66 (28) 72 (527)
Total financialliabilities held atfair value 10,290 (12)
(132)6,7 0 0 135 (258) 1,024 (2,621) 8,426
1 Total gains and losses predominantly relate to net gains (losses) on financial assets/liabilities at fair value through profit or loss reported in the consolidated statement ofincome. The balance also includes net gains (losses) on financial assets available for sale reported in the consolidated statement of income and unrealized net gains (losses)on financial assets available for sale and exchange rate changes reported in other comprehensive income, net of tax. Further, certain instruments are hedged with instrumentsin level 1 or level 2 but the table above does not include the gains and losses on these hedging instruments. Additionally, both observable and unobservable parameters maybe used to determine the fair value of an instrument classified within level 3 of the fair value hierarchy; the gains and losses presented below are attributable to movements inboth the observable and unobservable parameters.
2 Issuances relate to the cash amount received on the issuance of a liability and the cash amount paid on the primary issuance of a loan to a borrower.3 Settlements represent cash flows to settle the asset or liability. For debt and loan instruments this includes principal on maturity, principal amortizations and principal
repayments. For derivatives all cash flows are presented in settlements.4 Transfers in and transfers out of level 3 are related to changes in observability of input parameters. During the period they are recorded at their fair value at the beginning of
year. For instruments transferred into level 3 the table shows the gains and losses and cash flows on the instruments as if they had been transferred at the beginning of theyear. Similarly for instruments transferred out of level 3 the table does not show any gains or losses or cash flows on the instruments during the period since the table ispresented as if they have been transferred out at the beginning of the year.
5 Total gains and losses on financial assets available for sale include a gain of € 38 million recognized in other comprehensive income, net of tax, and a gain of € 10 millionrecognized in the income statement presented in net gains (losses) on financial assets available for sale.
6 This amount includes the effect of exchange rate changes. For total financial assets held at fair value this effect is a loss of € 489 million and for total financial liabilities held atfair value this is a gain of € 108 million. The effect of exchange rate changes is reported in accumulated other comprehensive income, net of tax.
7 For assets, positive balances represent gains, negative balances represent losses. For liabilities, positive balances represent losses, negative balances represent gains.

75
Deutsche Bank Information on the Consolidated Balance Sheet (unaudited)Interim Report as of September 30, 2017 Financial Instruments carried at Fair Value
Sep 30, 2016
in € m.
Balance, beginning of year
Changes in the group of consoli-dated com-
panies
Totalgains/losses1 Purchases Sales
Issu-ances2
Settle-ments3
Transfersinto
Level 34
Transfersout of
Level 34
Balance,end ofperiod
Financial assetsheld at fair value:
Trading securities 6,669 (0) 68 1,441 (2,896) 0 (884) 1,923 (836) 5,485Positive marketvalues fromderivative finan-cial instruments 9,445 0 (159) 0 0 0 (1,009) 1,160 (1,912) 7,525Other tradingassets 6,082 0 (146) 1,682 (2,393) 428 (1,090) 1,903 (739) 5,727Financial assetsdesignated at fairvalue throughprofit or loss 4,478 0 (52) 26 (90) 64 (603) 48 (1,217) 2,656Financial assetsavailable for sale 4,874 (0) 735 738 (411) 0 (1,047) 215 (36) 4,407Other financialassets at fair value 0 0 0 0 0 0 0 6 0 6
Total financial assetsheld at fair value 31,549 (0)
(215)6,7 3,887 (5,789) 492 (4,633) 5,254 (4,740) 25,806
Financial liabilitiesheld at fair value:
Trading securities 18 0 (1) 0 0 0 8 0 0 26Negative marketvalues fromderivative financialinstruments 7,879 0 (436) 0 0 0 (742) 1,626 (1,153) 7,174Other tradingliabilities 0 0 0 0 0 0 0 0 0 0Financial liabilitiesdesignated at fairvalue throughprofit or loss 3,053 0 (41) 0 0 806 (610) 409 (384) 3,234Other financialliabilities atfair value (1,146) 0 53 0 0 0 10 (41) 169 (955)
Total financialliabilities held atfair value 9,805 0
(425)6,7 0 0 806 (1,334) 1,995 (1,367) 9,479
1 Total gains and losses predominantly relate to net gains (losses) on financial assets/liabilities at fair value through profit or loss reported in the consolidated statement ofincome. The balance also includes net gains (losses) on financial assets available for sale reported in the consolidated statement of income and unrealized net gains (losses)on financial assets available for sale and exchange rate changes reported in other comprehensive income, net of tax. Further, certain instruments are hedged with instrumentsin level 1 or level 2 but the table above does not include the gains and losses on these hedging instruments. Additionally, both observable and unobservable parameters maybe used to determine the fair value of an instrument classified within level 3 of the fair value hierarchy; the gains and losses presented below are attributable to movements inboth the observable and unobservable parameters.
2 Issuances relate to the cash amount received on the issuance of a liability and the cash amount paid on the primary issuance of a loan to a borrower.3 Settlements represent cash flows to settle the asset or liability. For debt and loan instruments this includes principal on maturity, principal amortizations and principal
repayments. For derivatives all cash flows are presented in settlements.4 Transfers in and transfers out of level 3 are related to changes in observability of input parameters. During the period they are recorded at their fair value at the beginning of
year. For instruments transferred into level 3 the table shows the gains and losses and cash flows on the instruments as if they had been transferred at the beginning of theyear. Similarly for instruments transferred out of level 3 the table does not show any gains or losses or cash flows on the instruments during the period since the table ispresented as if they have been transferred out at the beginning of the year.
5 Total gains and losses on financial assets available for sale include a loss of € 27 million recognized in other comprehensive income, net of tax, and a gain of € 127 millionrecognized in the income statement presented in net gains (losses) on financial assets available for sale.
6 This amount includes the effect of exchange rate changes. For total financial assets held at fair value this effect is a loss of € 199 million and for total financial liabilities held atfair value this is a gain of € 143 million. The effect of exchange rate changes is reported in accumulated other comprehensive income, net of tax.
7 For assets, positive balances represent gains, negative balances represent losses. For liabilities, positive balances represent losses, negative balances represent gains.
76
Deutsche Bank 3 – Notes to the Consolidated Financial StatementsInterim Report as of September 30, 2017
Sensitivity Analysis of Unobservable Parameters
Where the value of financial instruments is dependent on unobservable parameter inputs, the precise level for these parame-ters at the balance sheet date might be drawn from a range of reasonably possible alternatives. In preparing the financialstatements, appropriate levels for these unobservable input parameters are chosen so that they are consistent with prevailingmarket evidence and in line with the Group’s approach to valuation control detailed above. Were the Group to have marked thefinancial instruments concerned using parameter values drawn from the extremes of the ranges of reasonably possible alterna-tives, then as of September 30, 2017 it could have increased fair value by as much as € 1.5 billion or decreased fair value by asmuch as € 940 million. As of December 31, 2016 it could have increased fair value by as much as € 1.8 billion or decreased fairvalue by as much as € 1.0 billion.
The changes in sensitive amounts from December 31, 2016 to September 30, 2017 show material reductions to both the posi-tive fair value movement and to the negative fair value movement from using reasonable possible alternatives. Both thesemoves are primarily a result of the reduction in the Level 3 population in the same period (e.g. Group Level 3 assets down from€ 26.3 billion at the end of 2016 to € 22.5 billion at the end of third quarter of 2017, Group Level 3 liabilities reduced from€ 10.3 billion at the end of 2016 to € 8.4 billion at the end of third quarter 2017), with this largely the result of de-risking/assetsales. The reduction in positive fair value movement of € 223 million (or 13 %), and the reduction in negative fair value move-ment of € 100 million (or 10 %) largely moved in line with the overall L3 balance (e.g. gross L3 Assets and Liabilities reduced by15 % in the period). The reduction in positive fair value movement is proportionally greater than the reduction in negative fairvalue movement due to idiosyncratic factors across a number of trades.
Our sensitivity calculation of unobservable parameters for Level 3 aligns to the approach used to assess valuation uncertaintyfor Prudent Valuation purposes. Prudent Valuation is a capital requirement for assets held at fair value. It provides a mechanismfor quantifying and capitalizing valuation uncertainty in accordance with the European Commission Delegated Regulation (EU)2016/101, which supplements Article 34 of Regulation (EU) No. 575/2013 (CRR), requiring institutions to apply a deductionfrom CET1 the amount of any additional value adjustments on all assets measured at fair value calculated in accordance withArticle 105(14). This utilizes exit price analysis performed for the relevant as-sets and liabilities in the Prudent Valuation as-sessment. The downside sensitivity may be limited in some cases where the fair value is already demonstrably prudent.
This disclosure is intended to illustrate the potential impact of the relative uncertainty in the fair value of financial instruments forwhich valuation is dependent on unobservable input parameters. However, it is unlikely in practice that all unobservable param-eters would be simultaneously at the extremes of their ranges of reasonably possible alternatives. Hence, the estimates dis-closed above are likely to be greater than the true uncertainty in fair value at the balance sheet date. Furthermore, thedisclosure is neither predictive nor indicative of future movements in fair value.
For many of the financial instruments considered here, in particular derivatives, unobservable input parameters represent only asubset of the parameters required to price the financial instrument, the remainder being observable. Hence for these instru-ments the overall impact of moving the unobservable input parameters to the extremes of their ranges might be relatively smallcompared with the total fair value of the financial instrument. For other instruments, fair value is determined based on the priceof the entire instrument, for example, by adjusting the fair value of a reasonable proxy instrument. In addition, all financial in-struments are already carried at fair values which are inclusive of valuation adjustments for the cost to close out that instrumentand hence already factor in uncertainty as it reflects itself in market pricing. Any negative impact of uncertainty calculated withinthis disclosure, then, will be over and above that already included in the fair value contained in the financial statements.

77
Deutsche Bank Information on the Consolidated Balance Sheet (unaudited)Interim Report as of September 30, 2017 Financial Instruments carried at Fair Value
Breakdown of the sensitivity analysis by type of instrument1
Sep 30, 2017 Dec 31, 2016
in € m.
Positive fair valuemovement from using reasonable possible
alternatives
Negative fair valuemovement from using reasonable possible
alternatives
Positive fair valuemovement from using reasonable possible
alternatives
Negative fair valuemovement from using reasonable possible
alternativesSecurities:
Debt securities 159 83 213 137Commercial mortgage-backed securities 8 6 13 12Mortgage and other asset-backed securities 34 26 46 40Corporate, sovereign and other debt securities 118 51 154 85
Equity securities 70 47 116 68Derivatives:
Credit 165 135 238 158Equity 181 155 209 150Interest related 338 183 429 187Foreign exchange 26 16 32 21Other 106 74 143 92
Loans:Loans 489 246 377 227Loan commitments 0 0 0 0
Other 0 0 0 0Total 1,535 940 1,758 1,0401 Where the exposure to an unobservable parameter is offset across different instruments then only the net impact is disclosed in the table.
Quantitative Information about the Sensitivity of Significant Unobservable Inputs
The behavior of the unobservable parameters on Level 3 fair value measurement is not necessarily independent, and dynamicrelationships often exist between the other unobservable parameters and the observable parameters. Such relationships, wherematerial to the fair value of a given instrument, are explicitly captured via correlation parameters, or are otherwise controlled viapricing models or valuation techniques. Frequently, where a valuation technique utilizes more than one input, the choice of acertain input will bound the range of possible values for other inputs. In addition, broader market factors (such as interest rates,equity, credit or commodity indices or foreign exchange rates) can also have effects.
The range of values shown below represents the highest and lowest inputs used to value the significant exposures within Lev-el 3. The diversity of financial instruments that make up the disclosure is significant and therefore the ranges of certain parame-ters can be large. For example, the range of credit spreads on mortgage backed securities represents performing, more liquidpositions with lower spreads than the less liquid, non-performing positions which will have higher credit spreads. As Level 3contains the less liquid fair value instruments, the wide ranges of parameters seen is to be expected, as there is a high degreeof pricing differentiation within each exposure type to capture the relevant market dynamics. There follows a brief description ofeach of the principle parameter types, along with a commentary on significant interrelationships between them.
Credit Parameters are used to assess the creditworthiness of an exposure, by enabling the probability of default and resultinglosses of a default to be represented. The credit spread is the primary reflection of creditworthiness, and represents the premi-um or yield return above the benchmark reference instrument (typically LIBOR, or relevant Treasury Instrument, dependingupon the asset being assessed), that a bond holder would require to allow for the credit quality difference between that entityand the reference benchmark. Higher credit spreads will indicate lower credit quality, and lead to a lower value for a given bond,or other loan-asset that is to be repaid to the Bank by the borrower. Recovery Rates represent an estimate of the amount alender would receive in the case of a default of a loan, or a bond holder would receive in the case of default of the bond. Higherrecovery rates will give a higher valuation for a given bond position, if other parameters are held constant. Constant DefaultRate (CDR) and Constant Prepayment Rate (CPR) allow more complex loan and debt assets to be assessed, as these param-eters estimate the ongoing defaults arising on scheduled repayments and coupons, or whether the borrower is making addi-tional (usually voluntary) prepayments. These parameters are particularly relevant when forming a fair value opinion formortgage or other types of lending, where repayments are delivered by the borrower through time, or where the borrower maypre-pay the loan (seen for example in some residential mortgages). Higher CDR will lead to lower valuation of a given loan ormortgage as the lender will ultimately receive less cash.
Interest rates, credit spreads, inflation rates, foreign exchange rates and equity prices are referenced in some option instru-ments, or other complex derivatives, where the payoff a holder of the derivative will receive is dependent upon the behavior ofthese underlying references through time. Volatility parameters describe key attributes of option behavior by enabling the varia-bility of returns of the underlying instrument to be assessed. This volatility is a measure of probability, with higher volatilitiesdenoting higher probabilities of a particular outcome occurring. The underlying references (interest rates, credit spreads etc.)have an effect on the valuation of options, by describing the size of the return that can be expected from the option. Thereforethe value of a given option is dependent upon the value of the underlying instrument, and the volatility of that instrument, repre-senting the size of the payoff, and the probability of that payoff occurring. Where volatilities are high, the option holder will see a

78
Deutsche Bank 3 – Notes to the Consolidated Financial StatementsInterim Report as of September 30, 2017
higher option value as there is greater probability of positive returns. A higher option value will also occur where the payoffdescribed by the option is significant.
Correlations are used to describe influential relationships between underlying references where a derivative or other instrumenthas more than one underlying reference. Behind some of these relationships, for example commodity correlation and interestrate-foreign exchange correlations, typically lie macroeconomic factors such as the impact of global demand on groups ofcommodities, or the pricing parity effect of interest rates on foreign exchange rates. More specific relationships can exist be-tween credit references or equity stocks in the case of credit derivatives and equity basket derivatives, for example. Creditcorrelations are used to estimate the relationship between the credit performance of a range of credit names, and stock correla-tions are used to estimate the relationship between the returns of a range of equities. A derivative with a correlation exposurewill be either long- or short-correlation. A high correlation suggests a strong relationship between the underlying references is inforce, and this will lead to an increase in value of a long-correlation derivative. Negative correlations suggest that the relation-ship between underlying references is opposing, i.e., an increase in price of one underlying reference will lead to a reduction inthe price of the other.
An EBITDA (‘earnings before interest, tax, depreciation and amortization’) multiple approach can be used in the valuation ofless liquid securities. Under this approach the enterprise value (‘EV’) of an entity can be estimated via identifying the ratio of theEV to EBITDA of a comparable observable entity and applying this ratio to the EBITDA of the entity for which a valuation isbeing estimated. Under this approach a liquidity adjustment is often applied due to the difference in liquidity between the gener-ally listed comparable used and the company under valuation. A higher EV/EBITDA multiple will result in a higher fair value.
Financial instruments classified in Level 3 and quantitative information about unobservable inputsSep 30, 2017
Fair valuein € m.(unless stated otherwise) Assets Liabilities Valuation technique(s)1
Significant unobservableinput(s) (Level 3) Range
Financial instruments held at fair value –held for trading, designated at fair valueand available-for-sale:Mortgage- and other asset-backedsecurities held for trading:
Commercial mortgage-backedsecurities 126 0 Price based Price 0 % 102 %
Discounted cash flow Credit spread (bps) 130 2,176Mortgage- and other asset-backedsecurities 684 0 Price based Price 0 % 102 %
Discounted cash flow Credit spread (bps) 42 2,000Recovery rate 0 % 100 %Constant default rate 0 % 27 %Constant prepayment rate 0 % 30 %
Total mortgage- and other asset-backedsecurities 810 0Debt securities and other debtobligations 3,749 1,480 Price based Price 0 % 215 %
Held for trading 3,441 5 Discounted cash flow Credit spread (bps) 1 400Corporate, sovereign and otherdebt securities 3,441
Available-for-sale 262Designated at fair value 47 1,475
Equity securities 943 0 Market approach Price per net asset value 60 % 100 %
Held for trading 254 0Enterprise value/EBITDA(multiple) 1 16
Available-for-sale 533 Discounted cash flow Weighted average cost capital 8 % 13 %Designated at fair value 155
Loans 5,389 0 Price based Price 0 % 160 %Held for trading 2,988 0 Discounted cash flow Credit spread (bps) 190 1,616Designated at fair value 384 Constant default rate 0 % 0 %Available-for-sale 2,017 Recovery rate 0 % 40 %
Loan commitments 0 13 Discounted cash flow Credit spread (bps) 8 335Recovery rate 37 % 75 %
Loan pricing model Utilization 0 % 100 %Other financial instruments 2,9672 2273 Discounted cash flow IRR 3 % 46 %
Repo rate (bps.) 144 209Total non-derivative financialinstruments held at fair value 13,857 1,7201 Valuation technique(s) and subsequently the significant unobservable input(s) relate to the respective total position.2 Other financial assets include € 1.2 billion of other trading assets, € 700 million of other financial assets designated at fair value and € 1.1 billion other financial assets
available for sale.3 Other financial liabilities include € 227 million of securities sold under repurchase agreements designated at fair value.

79
Deutsche Bank Information on the Consolidated Balance Sheet (unaudited)Interim Report as of September 30, 2017 Financial Instruments carried at Fair Value
Dec 31, 2016Fair value
in € m.(unless stated otherwise) Assets Liabilities Valuation technique(s)1
Significant unobservableinput(s) (Level 3) Range
Financial instruments held at fair value –held for trading, designated at fair valueand available-for-sale:Mortgage- and other asset-backedsecurities held for trading:
Commercial mortgage-backedsecurities 294 0 Price based Price 0 % 103 %
Discounted cash flow Credit spread (bps) 119 2,000Mortgage- and other asset-backedsecurities 1,071 0 Price based Price 0 % 110 %
Discounted cash flow Credit spread (bps) 105 2,000Recovery rate 0 % 100 %Constant default rate 0 % 18 %Constant prepayment rate 0 % 29 %
Total mortgage- and other asset-backedsecurities 1,365 0Debt securities and other debtobligations 3,626 1,757 Price based Price 0 % 169 %
Held for trading 3,373 52 Discounted cash flow Credit spread (bps) 26 882Corporate, sovereign and otherdebt securities 3,373
Available-for-sale 253Designated at fair value 0 1,705
Equity securities 937 0 Market approach Price per net asset value 60 % 100 %
Held for trading 274 0Enterprise value/EBITDA(multiple) 1 12
Available-for-sale 633 Discounted cash flow Weighted average cost capital 8 % 22 %Designated at fair value 30
Loans 7,571 0 Price based Price 0 % 180 %Held for trading 4,105 0 Discounted cash flow Credit spread (bps) 180 4,612Designated at fair value 980 Constant default rate 0 % 24 %Available-for-sale 2,486 Recovery rate 25 % 80 %
Loan commitments 0 40 Discounted cash flow Credit spread (bps) 0 481Recovery rate 30 % 99 %
Loan pricing model Utilization 0 % 100 %Other financial instruments 2,9742 4853 Discounted cash flow IRR 3 % 24 %
Repo rate (bps) 178 214Total non-derivative financialinstruments held at fair value 16,474 2,2821 Valuation technique(s) and subsequently the significant unobservable input(s) relate to the respective total position.2 Other financial assets include € 1.6 billion of other trading assets, € 592 million of other financial assets designated at fair value and € 780 million other financial assets
available for sale.3 Other financial liabilities include € 444 million of securities sold under repurchase agreements designated at fair value and € 41 million of other financial liabilities designated at
fair value.

80
Deutsche Bank 3 – Notes to the Consolidated Financial StatementsInterim Report as of September 30, 2017
Sep 30, 2017Fair value
in € m.(unless stated otherwise) Assets Liabilities Valuation technique(s)
Significant unobservableinput(s) (Level 3) Range
Financial instruments held at fair value:Market values from derivative financialinstruments:
Interest rate derivatives 4,206 2,317 Discounted cash flow Swap rate (bps) (71) 982Inflation swap rate (2) % 9 %
0 0 Constant default rate 0 % 15 %0 0 Constant prepayment rate 0 % 31 %
Option pricing model Inflation volatility 0 % 3 %Interest rate volatility 0 % 109 %IR - IR correlation (25) % 100 %Hybrid correlation (85) % 90 %
Credit derivatives 1,007 1,130 Discounted cash flow Credit spread (bps) 0 14,737Recovery rate 0 % 97 %
Correlation pricingmodel Credit correlation 30 % 90 %
Equity derivatives 1,612 2,573 Option pricing model Stock volatility 5 % 87 %Index volatility 5 % 37 %Index - index correlation 73 % 89 %Stock - stock correlation 3 % 84 %Stock Forwards 0 % 6 %Index Forwards 0 % 96 %
FX derivatives 1,374 887 Option pricing model Volatility (6) % 31 %Other derivatives 401 (202)1 Discounted cash flow Credit spread (bps) - -
Option pricing model Index volatility 0 % 71 %Commodity correlation 10 % 75 %
Total market values from derivativefinancial instruments 8,601 6,7061 Includes derivatives which are embedded in contracts where the host contract is held at amortized cost but for which the embedded derivative is separated.
Dec 31, 2016Fair value
in € m.(unless stated otherwise) Assets Liabilities Valuation technique(s)
Significant unobservableinput(s) (Level 3) Range
Financial instruments held at fair value:Market values from derivative financialinstruments:
Interest rate derivatives 5,587 3,446 Discounted cash flow Swap rate (bps) (0) 2,309Inflation swap rate (1) % 16 %
0 0 Constant default rate 0 % 15 %0 0 Constant prepayment rate 0 % 19 %
Option pricing model Inflation volatility 0 % 5 %Interest rate volatility 0 % 123 %IR - IR correlation (12) % 99 %Hybrid correlation (50) % 93 %
Credit derivatives 829 1,126 Discounted cash flow Credit spread (bps) 0 8,427Recovery rate 0 % 100 %
Correlation pricingmodel Credit correlation 13 % 85 %
Equity derivatives 1,142 2,098 Option pricing model Stock volatility 10 % 67 %Index volatility 10 % 44 %Index - index correlation 73 % 88 %Stock - stock correlation 8 % 88 %Stock Forwards 0 % 8 %Index Forwards 0 % 20 %
FX derivatives 1,654 1,780 Option pricing model Volatility (8) % 39 %Other derivatives 586 (441)1 Discounted cash flow Credit spread (bps) - -
Option pricing model Index volatility 5 % 110 %Commodity correlation (21) % 85 %
Total market values from derivativefinancial instruments 9,798 8,0081 Includes derivatives which are embedded in contracts where the host contract is held at amortized cost but for which the embedded derivative is separated.

81
Deutsche Bank Information on the Consolidated Balance Sheet (unaudited)Interim Report as of September 30, 2017 Financial Instruments carried at Fair Value
Unrealized Gains or Losses on Level 3 Instruments held or in Issue at theReporting Date
The unrealized gains or losses on Level 3 Instruments are not due solely to unobservable parameters. Many of the parameterinputs to the valuation of instruments in this level of the hierarchy are observable and the gain or loss is partly due to move-ments in these observable parameters over the period. Many of the positions in this level of the hierarchy are economicallyhedged by instruments which are categorized in other levels of the fair value hierarchy. The offsetting gains and losses thathave been recorded on all such hedges are not included in the table below, which only shows the gains and losses related tothe level 3 classified instruments themselves held at the reporting date in accordance with IFRS 13. The unrealized gains andlosses on level 3 instruments are included in both net interest income and net gains on financial assets/liabilities at fair valuethrough profit or loss in the consolidated income statement.
Nine months endedin € m. Sep 30, 2017 Sep 30, 2016Financial assets held at fair value:
Trading securities 55 69Positive market values from derivative financial instruments 271 1,130Other trading assets 49 (85)Financial assets designated at fair value through profit or loss (55) 70Financial assets available for sale 53 8Other financial assets at fair value 2 0
Total financial assets held at fair value 375 1,192Financial liabilities held at fair value:
Trading securities 1 0Negative market values from derivative financial instruments (446) (42)Other trading liabilities 0 0Financial liabilities designated at fair value through profit or loss 14 (44)Other financial liabilities at fair value (218) (62)
Total financial liabilities held at fair value (649) (147)Total (274) 1,044
Recognition of Trade Date Profit
If there are significant unobservable inputs used in a valuation technique, the financial instrument is recognized at the transac-tion price and any trade date profit is deferred. The table below presents the year-to-year movement of the trade date profitsdeferred due to significant unobservable parameters for financial instruments classified at fair value through profit or loss. Thebalance is predominantly related to derivative instruments.
in € m. Sep 30, 2017 Sep 30, 2016Balance, beginning of year 916 955New trades during the period 168 241Amortization (228) (236)Matured trades (103) (159)Subsequent move to observability (79) (81)Exchange rate changes (5) (4)Balance, end of period 670 717

82
Deutsche Bank 3 – Notes to the Consolidated Financial StatementsInterim Report as of September 30, 2017
Fair Value of Financial Instruments not carried at Fair ValueThis section should be read in conjunction with Note 15 “Fair Value of Financial Instruments not carried at Fair Value” of theGroup’s Annual Report 2016.
The valuation techniques used to establish fair value for the Group’s financial instruments which are not carried at fair value inthe balance sheet are consistent with those outlined in Note 14 “Financial Instruments carried at Fair Value” of the Group’sAnnual Report 2016.
Other financial instruments not carried at fair value are not managed on a fair value basis, for example, retail loans and depositsand credit facilities extended to corporate clients. For these instruments fair values are calculated for disclosure purposes onlyand do not impact the balance sheet or income statement. Additionally, since the instruments generally do not trade there issignificant management judgment required to determine these fair values.
Estimated fair value of financial instruments not carried at fair value on the balance sheet1
Sep 30, 2017 Dec 31, 2016in € m. Carrying value Fair value Carrying value Fair valueFinancial assets:
Cash and central bank balances 204,390 204,390 181,364 181,364Interbank deposits (w/o central banks) 10,727 10,727 11,606 11,606Central bank funds sold and securities purchased under resale agreements 10,580 10,582 16,287 16,287Securities borrowed 23,979 23,979 20,081 20,081Loans 396,237 398,014 408,909 407,834Securities held to maturity 3,179 3,251 3,206 3,305Other financial assets 131,886 131,885 112,479 112,468
Financial liabilities:Deposits 574,691 574,880 550,204 550,402Central bank funds purchased and securities sold under repurchaseagreements 16,499 16,495 25,740 25,739Securities loaned 6,508 6,508 3,598 3,598Other short-term borrowings 18,279 18,287 17,295 17,289Other financial liabilities 171,563 171,563 135,273 135,273Long-term debt 159,091 161,652 172,316 171,178Trust preferred securities 5,583 6,013 6,373 6,519
1 Amounts generally presented on a gross basis, in line with the Group’s accounting policy regarding offsetting of financial instruments as described in Note 1 “SignificantAccounting Policies and Critical Accounting Estimates” of the Group’s Annual Report 2016.
Offsetting Financial Assets and Financial LiabilitiesThe Group is eligible to present certain financial assets and financial liabilities on a net basis on the balance sheet pursuant tocriteria described in Note 1 “Significant Accounting Policies and Critical Accounting Estimates: Offsetting Financial Instruments”of the Group’s Annual Report 2016.
The following tables provide information on the impact of offsetting on the consolidated balance sheet, as well as the financialimpact of netting for instruments subject to an enforceable master netting arrangement or similar agreement as well as availablecash and financial instrument collateral.

83
Deutsche Bank Information on the Consolidated Balance Sheet (unaudited)Interim Report as of September 30, 2017 Offsetting Financial Assets and Financial Liabilities
AssetsSep 30, 2017
Amounts not set off on the balance sheet
in € m.
Grossamounts
of financialassets
Grossamounts
set off on the balance
sheet
Net amounts of financial assets pre-sented on thebalance sheet
Impact ofMasterNetting
AgreementsCash
collateral
Financial instrument collateral1 Net amount
Central bank funds sold and securities purchasedunder resale agreements (enforceable) 7,890 (345) 7,545 0 0 (7,539) 6Central bank funds sold and securities purchasedunder resale agreements (non-enforceable) 3,035 0 3,035 0 0 (3,035) 0Securities borrowed (enforceable) 21,266 0 21,266 0 0 (20,478) 788Securities borrowed (non-enforceable) 2,713 0 2,713 0 0 (2,639) 74Financial assets at fair value through profit or loss
Trading assets 187,180 (464) 186,716 0 (98) (100) 186,518Positive market values from derivative financialinstruments (enforceable) 461,187 (104,431) 356,756 (293,591) (43,584) (7,235) 12,345Positive market values from derivative financialinstruments (non-enforceable) 15,263 0 15,263 0 (1,689) (1,185) 12,389Financial assets designated at fair value throughprofit or loss (enforceable) 123,790 (53,437) 70,354 (1,484) (802) (63,341) 4,726Financial assets designated at fair value throughprofit or loss (non-enforceable) 25,830 0 25,830 0 0 (20,487) 5,343
Total financial assets at fair value throughprofit or loss 813,249 (158,331) 654,918 (295,075) (46,174) (92,349) 221,321Loans 396,237 0 396,237 0 (13,244) (39,580) 343,414Other assets 169,284 (24,935) 144,349 (27,274) (616) (92) 116,367
Thereof: Positive market values from derivativesqualifying for hedge accounting (enforceable) 7,993 (4,644) 3,349 (2,590) (615) (92) 52
Remaining assets not subject to netting 291,389 0 291,389 0 (365) (220) 290,804Total assets 1,705,065 (183,611) 1,521,454 (322,349) (60,399) (165,932) 972,7751 Excludes real estate and other non-financial instrument collateral.
LiabilitiesSep 30, 2017
Amounts not set off on the balance sheet
in € m.
Grossamounts
of financialliabilities
Grossamounts
set off on thebalance
sheet
Net amounts of financial liabilities pre-sented on thebalance sheet
Impact ofMasterNetting
AgreementsCash
collateral
Financial instrument collateral Net amount
Deposit 574,691 0 574,691 0 0 0 574,691Central bank funds purchased and securities soldunder repurchase agreements (enforceable) 11,468 (345) 11,123 0 0 (11,123) 0Central bank funds purchased and securities soldunder repurchase agreements (non-enforceable) 5,376 0 5,376 0 0 (4,788) 588Securities loaned (enforceable) 6,406 0 6,406 0 0 (6,406) 0Securities loaned (non-enforceable) 101 0 101 0 0 (31) 71Financial liabilities at fair value through profit orloss
Trading liabilities 74,863 (662) 74,201 0 0 0 74,201Negative market values from derivative financialinstruments (enforceable) 435,914 (101,702) 334,212 (294,619) (22,788) (7,328) 9,477Negative market values from derivative financialinstruments (non-enforceable) 14,135 0 14,135 0 (1,896) (963) 11,276Financial liabilities designated at fair valuethrough profit or loss (enforceable) 85,727 (52,775) 32,952 (1,484) 0 (31,468) 0Financial liabilities designated at fair valuethrough profit or loss (non-enforceable) 17,406 0 17,406 0 2,918 (10,721) 9,604
Total financial liabilities at fair value throughprofit or loss 628,044 (155,138) 472,906 (296,103) (21,765) (50,480) 104,558Other liabilities 218,920 (28,128) 190,792 (46,835) (113) (101) 143,743
Thereof: Negative market values from derivativesqualifying for hedge accounting (enforceable) 2,743 (949) 1,794 (1,562) (111) (101) 20
Remaining liabilities not subject to netting 189,448 0 189,448 0 0 0 189,448Total liabilities 1,634,455 (183,611) 1,450,844 (342,938) (21,878) (72,929) 1,013,099

84
Deutsche Bank 3 – Notes to the Consolidated Financial StatementsInterim Report as of September 30, 2017
AssetsDec 31, 2016
Amounts not set off on the balance sheet
in € m.
Grossamounts
of financialassets
Grossamounts
set off on thebalance
sheet
Net amounts of financial assets pre-sented on thebalance sheet
Impact ofMasterNetting
AgreementsCash
collateral
Financial instrument collateral1 Net amount
Central bank funds sold and securities purchasedunder resale agreements (enforceable) 17,755 (4,020) 13,735 0 0 (13,719) 16Central bank funds sold and securities purchasedunder resale agreements (non-enforceable) 2,552 0 2,552 0 0 (2,225) 327Securities borrowed (enforceable) 18,470 0 18,470 0 0 (17,637) 832Securities borrowed (non-enforceable) 1,611 0 1,611 0 0 (1,555) 56Financial assets at fair value through profit or loss
Trading assets 171,520 (477) 171,044 0 (101) (884) 170,059Positive market values from derivative financialinstruments (enforceable) 592,048 (126,523) 465,525 (386,727) (51,790) (9,349) 17,658Positive market values from derivative financialinstruments (non-enforceable) 19,625 0 19,625 0 (2,055) (1,244) 16,327Financial assets designated at fair value throughprofit or loss (enforceable) 95,802 (40,998) 54,804 (2,748) (928) (46,670) 4,457Financial assets designated at fair value throughprofit or loss (non-enforceable) 32,783 0 32,783 0 0 (21,074) 11,709
Total financial assets at fair value throughprofit or loss 911,778 (167,998) 743,781 (389,475) (54,874) (79,221) 220,211Loans 408,909 0 408,909 0 (13,039) (47,703) 348,167Other assets 153,732 (27,686) 126,045 (39,567) (589) (104) 85,786
Thereof: Positive market values from derivativesqualifying for hedge accounting (enforceable) 8,830 (5,314) 3,516 (2,719) (589) (104) 104
Remaining assets not subject to netting 275,442 0 275,442 0 (423) (307) 274,712Total assets 1,790,249 (199,704) 1,590,546 (429,042) (68,925) (162,473) 930,1061 Excludes real estate and other non-financial instrument collateral.
LiabilitiesDec 31, 2016
Amounts not set off on the balance sheet
in € m.
Grossamounts
of financialliabilities
Grossamounts
set off on thebalance
sheet
Net amounts of financial liabilities pre-sented on thebalance sheet
Impact ofMasterNetting
AgreementsCash
collateral
Financial instrument collateral Net amount
Deposit 550,204 0 550,204 0 0 0 550,204Central bank funds purchased and securities soldunder repurchase agreements (enforceable) 21,209 (4,020) 17,189 0 0 (17,189) 0Central bank funds purchased and securities soldunder repurchase agreements (non-enforceable) 8,551 0 8,551 0 0 (8,403) 149Securities loaned (enforceable) 3,524 0 3,524 0 0 (3,524) 0Securities loaned (non-enforceable) 75 0 75 0 0 (50) 25Financial liabilities at fair value through profit orloss
Trading liabilities 57,902 (873) 57,029 0 0 0 57,029Negative market values from derivative financialinstruments (enforceable) 569,064 (124,325) 444,739 (386,612) (35,124) (9,325) 13,678Negative market values from derivative financialinstruments (non-enforceable) 19,119 0 19,119 0 (1,721) (897) 16,501Financial liabilities designated at fair valuethrough profit or loss (enforceable) 82,421 (39,031) 43,390 (2,748) 0 (40,642) 0Financial liabilities designated at fair valuethrough profit or loss (non-enforceable) 17,694 0 17,694 0 (7,910) (7,664) 2,120
Total financial liabilities at fair value throughprofit or loss 746,200 (164,228) 581,971 (389,360) (44,755) (58,528) 89,328Other liabilities 186,896 (31,456) 155,440 (56,679) (1,298) 0 97,463
Thereof: Negative market values from derivativesqualifying for hedge accounting (enforceable) 5,793 (1,200) 4,593 (2,834) (1,297) 0 463
Remaining liabilities not subject to netting 208,773 0 208,773 0 0 0 208,773Total liabilities 1,725,431 (199,704) 1,525,727 (446,039) (46,053) (87,693) 945,942
Detailed information of what is presented in the individual columns are described in Note 19 “Offsetting Financial Assets andFinancial Liabilities” of the Group’s Annual Report 2016.

85
Deutsche Bank Information on the Consolidated Balance Sheet (unaudited)Interim Report as of September 30, 2017
Allowance for Credit LossesNine months ended Sep 30, 2017
Allowance for Loan Losses Allowance for Off-Balance Sheet Positionsin € m.(unless stated otherwise)
Individuallyassessed
Collectivelyassessed Subtotal
Individuallyassessed
Collectivelyassessed Subtotal Total
Balance, beginning of year 2,071 2,475 4,546 162 183 346 4,892Provision for credit losses 259 165 424 (13) (15) (28) 396
Thereof: (Gains)/Losses fromdisposal of impaired loans (1) (20) (21) 0 0 0 (21)
Net charge-offs: (290) (480) (771) 0 0 0 (770)Charge-offs (327) (528) (856) 0 0 0 (856)Recoveries 37 48 85 0 0 0 85
Other changes (121) (40) (161) (3) (14) (17) (178)Balance, end of period 1,919 2,120 4,039 146 155 300 4,339
Changes compared to prior yearProvision for credit losses
In € m. (249) (205) (454) (7) (34) (41) (495)In % (49) (55) (52) 108 (180) (329) (56)
Net charge-offsIn € m. 294 173 467 0 0 0 467In % (50) (26) (38) 0 0 0 (38)
Nine months ended Sep 30, 2016Allowance for Loan Losses Allowance for Off-Balance Sheet Positions
in € m.(unless stated otherwise)
Individuallyassessed
Collectivelyassessed Subtotal
Individuallyassessed
Collectivelyassessed Subtotal Total
Balance, beginning of year 2,252 2,776 5,028 144 168 312 5,340Provision for credit losses 508 370 878 (6) 19 12 891
Thereof: (Gains)/Losses fromdisposal of impaired loans 3 (16) (13) 0 0 0 (13)
Net charge-offs: (585) (653) (1,238) 0 0 0 (1,238)Charge-offs (613) (740) (1,353) 0 0 0 (1,353)Recoveries 29 86 115 0 0 0 115
Other changes 14 (121) (107) (8) (4) (12) (119)Balance, end of period 2,189 2,372 4,562 129 183 312 4,874
Changes compared to prior yearProvision for credit losses
In € m. 333 33 366 (57) 5 (52) 314In % 190 10 72 (113) 39 (81) 55
Net charge-offsIn € m. (266) (118) (384) 0 0 0 (384)In % 83 22 45 0 0 0 45

86
Deutsche Bank 3 – Notes to the Consolidated Financial StatementsInterim Report as of September 30, 2017
Other Assets and Other LiabilitiesOther Assetsin € m. Sep 30, 2017 Dec 31, 2016Brokerage and securities related receivables
Cash/margin receivables 41,847 57,924Receivables from prime brokerage 10,409 9,859Pending securities transactions past settlement date 6,783 6,409Receivables from unsettled regular way trades 66,543 30,908
Total brokerage and securities related receivables 125,582 105,100Accrued interest receivable 2,315 2,433Assets held for sale 456 563Other 15,997 17,950Total other assets 144,349 126,045
Other Liabilitiesin € m. Sep 30, 2017 Dec 31, 2016Brokerage and securities related payables
Cash/margin payables 60,639 70,706Payables from prime brokerage 25,286 20,155Pending securities transactions past settlement date 4,802 2,668Payables from unsettled regular way trades 68,036 28,490
Total brokerage and securities related payables 158,763 122,019Accrued interest payable 2,490 2,712Liabilities held for sale 780 701Other 28,758 30,008Total other liabilities 190,792 155,440
Depositsin € m. Sep 30, 2017 Dec 31, 2016Noninterest-bearing demand deposits 224,230 200,122Interest-bearing deposits
Demand deposits 125,596 129,654Time deposits 137,042 130,299Savings deposits 87,823 90,129
Total interest-bearing deposits 350,460 350,082Total deposits 574,691 550,204
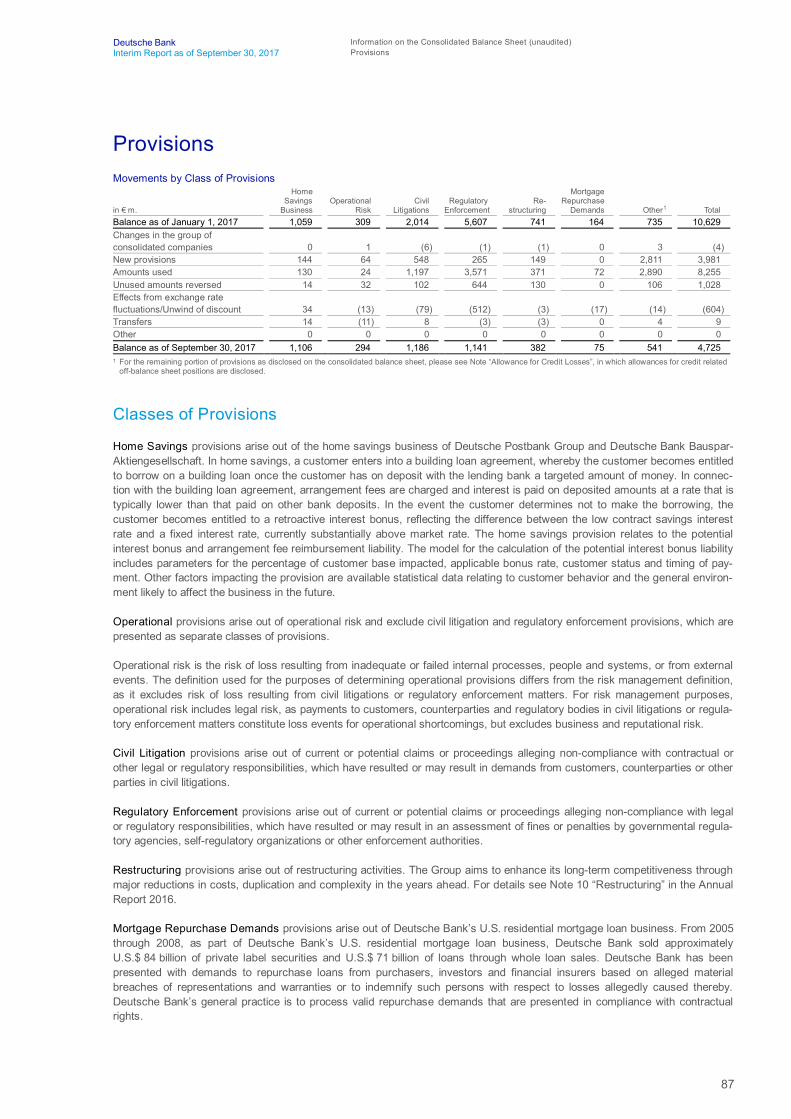
87
Deutsche Bank Information on the Consolidated Balance Sheet (unaudited)Interim Report as of September 30, 2017 Provisions
ProvisionsMovements by Class of Provisions
in € m.
Home Savings Business
OperationalRisk
Civil Litigations
RegulatoryEnforcement
Re- structuring
Mortgage Repurchase Demands Other1 Total
Balance as of January 1, 2017 1,059 309 2,014 5,607 741 164 735 10,629Changes in the group ofconsolidated companies 0 1 (6) (1) (1) 0 3 (4)New provisions 144 64 548 265 149 0 2,811 3,981Amounts used 130 24 1,197 3,571 371 72 2,890 8,255Unused amounts reversed 14 32 102 644 130 0 106 1,028Effects from exchange ratefluctuations/Unwind of discount 34 (13) (79) (512) (3) (17) (14) (604)Transfers 14 (11) 8 (3) (3) 0 4 9Other 0 0 0 0 0 0 0 0Balance as of September 30, 2017 1,106 294 1,186 1,141 382 75 541 4,7251 For the remaining portion of provisions as disclosed on the consolidated balance sheet, please see Note “Allowance for Credit Losses”, in which allowances for credit related
off-balance sheet positions are disclosed.
Classes of Provisions
Home Savings provisions arise out of the home savings business of Deutsche Postbank Group and Deutsche Bank Bauspar-Aktiengesellschaft. In home savings, a customer enters into a building loan agreement, whereby the customer becomes entitledto borrow on a building loan once the customer has on deposit with the lending bank a targeted amount of money. In connec-tion with the building loan agreement, arrangement fees are charged and interest is paid on deposited amounts at a rate that istypically lower than that paid on other bank deposits. In the event the customer determines not to make the borrowing, thecustomer becomes entitled to a retroactive interest bonus, reflecting the difference between the low contract savings interestrate and a fixed interest rate, currently substantially above market rate. The home savings provision relates to the potentialinterest bonus and arrangement fee reimbursement liability. The model for the calculation of the potential interest bonus liabilityincludes parameters for the percentage of customer base impacted, applicable bonus rate, customer status and timing of pay-ment. Other factors impacting the provision are available statistical data relating to customer behavior and the general environ-ment likely to affect the business in the future.
Operational provisions arise out of operational risk and exclude civil litigation and regulatory enforcement provisions, which arepresented as separate classes of provisions.
Operational risk is the risk of loss resulting from inadequate or failed internal processes, people and systems, or from externalevents. The definition used for the purposes of determining operational provisions differs from the risk management definition,as it excludes risk of loss resulting from civil litigations or regulatory enforcement matters. For risk management purposes,operational risk includes legal risk, as payments to customers, counterparties and regulatory bodies in civil litigations or regula-tory enforcement matters constitute loss events for operational shortcomings, but excludes business and reputational risk.
Civil Litigation provisions arise out of current or potential claims or proceedings alleging non-compliance with contractual orother legal or regulatory responsibilities, which have resulted or may result in demands from customers, counterparties or otherparties in civil litigations.
Regulatory Enforcement provisions arise out of current or potential claims or proceedings alleging non-compliance with legalor regulatory responsibilities, which have resulted or may result in an assessment of fines or penalties by governmental regula-tory agencies, self-regulatory organizations or other enforcement authorities.
Restructuring provisions arise out of restructuring activities. The Group aims to enhance its long-term competitiveness throughmajor reductions in costs, duplication and complexity in the years ahead. For details see Note 10 “Restructuring” in the AnnualReport 2016.
Mortgage Repurchase Demands provisions arise out of Deutsche Bank’s U.S. residential mortgage loan business. From 2005through 2008, as part of Deutsche Bank’s U.S. residential mortgage loan business, Deutsche Bank sold approximatelyU.S.$ 84 billion of private label securities and U.S.$ 71 billion of loans through whole loan sales. Deutsche Bank has beenpresented with demands to repurchase loans from purchasers, investors and financial insurers based on alleged materialbreaches of representations and warranties or to indemnify such persons with respect to losses allegedly caused thereby.Deutsche Bank’s general practice is to process valid repurchase demands that are presented in compliance with contractualrights.

88
Deutsche Bank 3 – Notes to the Consolidated Financial StatementsInterim Report as of September 30, 2017
As of September 30, 2017, Deutsche Bank has approximately U.S.$ 485 million of mortgage repurchase demands outstandingand not subject to agreements to rescind (based on original principal balance of the loans). These demands consist primarily ofdemands made in respect of private label securitizations by the trustees or servicers thereof. Against these outstanding de-mands, Deutsche Bank recorded provisions of U.S.$ 88 million (€ 75 million) as of September 30, 2017. Deutsche Bank is thebeneficiary of indemnity agreements from the originators or sellers of certain of the mortgage loans subject to these demands,with respect to which Deutsche Bank has recognized receivables of U.S.$ 64 million (€ 54 million) as of September 30, 2017.The net provisions against these demands following deduction of such receivables were U.S.$ 24 million (€ 21 million) as ofSeptember 30, 2017.
As of September 30, 2017, Deutsche Bank has completed repurchases, obtained agreements to rescind, settled or rejected asuntimely claims on loans with an original principal balance of approximately U.S.$ 9.2 billion. In connection with those repur-chases, agreements and settlements, Deutsche Bank has obtained releases for potential claims on approximatelyU.S.$ 98.4 billion of loans sold by Deutsche Bank as described above.
Additional mortgage repurchase demands may be made in respect of mortgage loans that Deutsche Bank has sold, butDeutsche Bank cannot reliably estimate their timing or amount. On June 11, 2015, the New York Court of Appeals issued aruling affirming dismissal of mortgage repurchase claims asserted in litigation relating to a residential mortgage-backed securityissued by Deutsche Bank on the grounds that the action was not timely commenced. The Court held that the repurchase claims,which alleged breaches of contractual representations and warranties pertaining to the loans at issue, accrued as of the closingdate of the securitization and, thus, were time-barred under New York’s six-year statute of limitations. This and related deci-sions could impact the extent to which future repurchase demands are made to Deutsche Bank and the likelihood of success ofany such claims.
Deutsche Bank did not act as servicer for the loans sold to third parties as whole loans (which constitute almost half of all U.S.residential mortgage loans sold from 2005 through 2008) and, once sold, Deutsche Bank ceased to have access to informationabout their performance. While loan performance is publicly available on the mortgage loans that Deutsche Bank securitized,no direct correlation has been observed between their performance and repurchase demands received. Demands have beenreceived on loans that have defaulted, as well as loans that are current and loans that have been repaid in full.
Other provisions include several specific items arising from a variety of different circumstances, including the provision for thereimbursement of loan processing fees, deferred sales commissions and provisions for bank levies.
Provisions and Contingent Liabilities
The Group recognizes a provision for potential loss only when there is a present obligation arising from a past event that isprobable to result in an economic outflow that can be reliably estimated. Where a reliable estimate cannot be made for such anobligation, no provision is recognized and the obligation is deemed a contingent liability. Contingent liabilities also include pos-sible obligations for which the possibility of future economic outflow is more than remote but less than probable. Where a provi-sion has been taken for a particular claim, no contingent liability is recorded; for matters or sets of matters consisting of morethan one claim, however, provisions may be recorded for some claims, and contingent liabilities (or neither a provision nor acontingent liability) may be recorded for others.
The Group operates in a legal and regulatory environment that exposes it to significant litigation risks. As a result, the Group isinvolved in litigation, arbitration and regulatory proceedings and investigations in Germany and in a number of jurisdictionsoutside Germany, including the United States. In recent years, regulation and supervision in a number of areas have increased,and regulators, governmental bodies and others have sought to subject financial services providers to increasing oversight andscrutiny, which in turn has led to additional regulatory investigations and enforcement actions which are often followed by civillitigation. This trend has accelerated markedly as a result of the global financial crisis.
In determining for which of the claims the possibility of a loss is probable, or less than probable but more than remote, and thenestimating the possible loss for those claims, the Group takes into consideration a number of factors, including but not limited tothe nature of the claim and its underlying facts, the procedural posture and litigation history of each case, rulings by the courtsor tribunals, the Group’s experience and the experience of others in similar cases (to the extent this is known to the Group),prior settlement discussions, settlements by others in similar cases (to the extent this is known to the Group), available indemni-ties and the opinions and views of legal counsel and other experts.
The provisions the Group has recognized for civil litigation and regulatory enforcement matters as of September 30, 2017 andJanuary 1, 2017 are set forth in the table above. For some matters for which the Group believes an outflow of funds is probable,no provisions were recognized as the Group could not reliably estimate the amount of the potential outflow.
For the matters for which a reliable estimate can be made, the Group currently estimates that, as of September 30, 2017, theaggregate future loss of which the possibility is more than remote but less than probable is approximately € 1.4 billion for civil

89
Deutsche Bank Information on the Consolidated Balance Sheet (unaudited)Interim Report as of September 30, 2017 Provisions
litigation matters (December 31, 2016: € 1.5 billion) and € 0.3 billion for regulatory enforcement matters (December 31, 2016:€ 0.8 billion). These figures include matters where the Group’s potential liability is joint and several and where the Group ex-pects any such liability to be paid by a third party. For other significant civil litigation and regulatory enforcement matters, theGroup believes the possibility of an outflow of funds is more than remote but less than probable but the amount is not reliablyestimable, and accordingly such matters are not included in the contingent liability estimates. For still other significant civil litiga-tion and regulatory enforcement matters, the Group believes the possibility of an outflow of funds is remote and therefore hasneither recognized a provision nor included them in the contingent liability estimates.
This estimated possible loss, as well as any provisions taken, is based upon currently available information and is subject tosignificant judgment and a variety of assumptions, variables and known and unknown uncertainties. These uncertainties mayinclude inaccuracies in or incompleteness of the information available to the Group, particularly at the preliminary stages ofmatters, and assumptions by the Group as to future rulings of courts or other tribunals or the likely actions or positions taken byregulators or adversaries may prove incorrect. Moreover, estimates of possible loss for these matters are often not amenable tothe use of statistical or other quantitative analytical tools frequently used in making judgments and estimates, and are subject toeven greater degrees of uncertainty than in many other areas where the Group must exercise judgment and make estimates.The estimated possible loss, as well as any provisions taken, can be and often are substantially less than the amount initiallyrequested by regulators or adversaries or the maximum potential loss that could be incurred were the matters to result in a finaladjudication adverse to the Group. Moreover, in several regions in which the Group operates, an adversary often is not requiredto set forth the amount it is seeking, and where it is, the amount may not be subject to the same requirements that generallyapply to pleading factual allegations or legal claims.
The matters for which the Group determines that the possibility of a future loss is more than remote will change from time totime, as will the matters as to which a reliable estimate can be made and the estimated possible loss for such matters. Actualresults may prove to be significantly higher or lower than the estimate of possible loss in those matters where such an estimatewas made. In addition, loss may be incurred in matters with respect to which the Group believed the likelihood of loss wasremote. In particular, the estimated aggregate possible loss does not represent the Group’s potential maximum loss exposurefor those matters.
The Group may settle litigation or regulatory proceedings or investigations prior to a final judgment or determination of liability. Itmay do so to avoid the cost, management efforts or negative business, regulatory or reputational consequences of continuingto contest liability, even when the Group believes it has valid defenses to liability. It may also do so when the potential conse-quences of failing to prevail would be disproportionate to the costs of settlement. Furthermore, the Group may, for similar rea-sons, reimburse counterparties for their losses even in situations where it does not believe that it is legally compelled to do so.
Current Individual Proceedings
Set forth below are descriptions of civil litigation and regulatory enforcement matters or groups of matters for which the Grouphas taken material provisions, or for which there are material contingent liabilities that are more than remote, or for which thereis the possibility of material business or reputational risk; similar matters are grouped together and some matters consist of anumber of proceedings or claims. The disclosed matters include matters for which the possibility of a loss is more than remotebut for which the Group cannot reliably estimate the possible loss.
Esch Funds Litigation. Sal. Oppenheim jr. & Cie. AG & Co. KGaA (“Sal. Oppenheim”) was prior to its acquisition by DeutscheBank in 2010 involved in the marketing and financing of participations in closed end real estate funds. These funds were struc-tured as Civil Law Partnerships under German law. Usually, Josef Esch Fonds-Projekt GmbH performed the planning andproject development. Sal. Oppenheim held an indirect interest in this company via a joint-venture. In relation to this business anumber of civil claims have been filed against Sal. Oppenheim. Some but not all of these claims are also directed against for-mer managing partners of Sal. Oppenheim and other individuals. The claims brought against Sal. Oppenheim relate to invest-ments of originally approximately € 1.1 billion. After certain claims have either been dismissed or settled, claims relating toinvestments of originally approximately € 140 million are still pending. Currently, the aggregate amounts claimed in the pendingproceedings are approximately € 190 million. The investors are seeking to unwind their fund participation and to be indemnifiedagainst potential losses and debt related to the investment. The claims are based in part on an alleged failure of Sal. Oppen-heim to provide adequate information on related risks and other material aspects important for the investors’ investment deci-sion. Based on the facts of the individual cases, some courts have decided in favor and some against Sal. Oppenheim. Appealsare pending. The Group has recorded provisions and contingent liabilities with respect to these cases but has not disclosed theamounts thereof because it has concluded that such disclosure can be expected to prejudice seriously their outcome.
FX Investigations and Litigations. Deutsche Bank has received requests for information from certain regulatory and law en-forcement agencies globally who are investigating trading in, and various other aspects of, the foreign exchange market.Deutsche Bank is cooperating with these investigations. Relatedly, Deutsche Bank has conducted its own internal global reviewof foreign exchange trading and other aspects of its foreign exchange business.
90
Deutsche Bank 3 – Notes to the Consolidated Financial StatementsInterim Report as of September 30, 2017
On October 19, 2016, the U.S. Commodity Futures Trading Commission, Division of Enforcement (“CFTC”) issued a letter(“CFTC Letter”) notifying Deutsche Bank that the CFTC “is not taking any further action at this time and has closed the foreignexchange investigation of Deutsche Bank.” As is customary, the CFTC Letter states that the CFTC “maintains the discretion todecide to reopen the investigation at any time in the future.” The CFTC Letter has no binding impact on other regulatory and lawenforcement agency investigations regarding Deutsche Bank’s foreign exchange trading and practices, which remain pending.
On December 7, 2016, it was announced that Deutsche Bank reached an agreement with CADE, the Brazilian antitrust en-forcement agency, to settle an investigation into conduct by a former Brazil-based Deutsche Bank trader. As part of that settle-ment, Deutsche Bank paid a fine of BRL 51 million and agreed to continue to comply with the CADE’s administrative processuntil it is concluded. This resolves CADE’s administrative process as it relates to Deutsche Bank, subject to Deutsche Bank’scontinued compliance with the settlement terms.
On February 13, 2017, the United States Department of Justice (“DOJ”), Criminal Division, Fraud Section, issued a letter (“DOJLetter”) notifying Deutsche Bank that the DOJ has closed its criminal inquiry “concerning possible violations of federal criminallaw in connection with the foreign exchange markets.” As is customary, the DOJ Letter states that the DOJ may reopen itsinquiry if it obtains additional information or evidence regarding the inquiry. The DOJ Letter has no binding impact on otherregulatory and law enforcement agency investigations regarding Deutsche Bank’s foreign exchange trading and practices,which remain pending.
On April 20, 2017, it was announced that Deutsche Bank AG, DB USA Corporation and Deutsche Bank AG New York Branchreached an agreement with the Board of Governors of the Federal Reserve System to settle an investigation into DeutscheBank’s foreign exchange trading and practices. Under the terms of the settlement, Deutsche Bank entered into a cease-and-desist order, and agreed to pay a civil monetary penalty of U.S.$ 137 million. In addition, the Federal Reserve ordered DeutscheBank to “continue to implement additional improvements in its oversight, internal controls, compliance, risk management andaudit programs” for its foreign exchange business and other similar products, and to periodically report to the Federal Reserveon its progress.
Investigations conducted by certain other regulatory agencies are ongoing and Deutsche Bank is cooperating with these inves-tigations.
Additionally, there are currently four U.S. putative class actions pending against Deutsche Bank relating to alleged manipulationof foreign exchange rates. The first pending action is a consolidated action brought on behalf of a putative class of over-the-counter traders and a putative class of central-exchange traders, who are domiciled in or traded in the United States or its terri-tories, and alleges illegal agreements to restrain competition with respect to and to manipulate both benchmark rates and spotrates, particularly the spreads quoted on those spot rates; the complaint further alleges that those supposed conspiracies, inturn, resulted in artificial prices on centralized exchanges for foreign exchange futures and options. Deutsche Bank’s motion todismiss the consolidated action was granted in part and denied in part on September 20, 2016. On September 29, 2017, plain-tiffs filed a motion seeking preliminary approval of a settlement with Deutsche Bank in the amount of U.S.$ 190 million, whichthe court preliminarily approved on the same day. A final fairness hearing for all settlements in this action, including DeutscheBank’s, is currently scheduled for May 23, 2018. A second action tracks the allegations in the consolidated action and assertsthat such purported conduct gave rise to, and resulted in a breach of, defendants’ fiduciary duties under the U.S. EmploymentRetirement Income Security Act of 1974 (ERISA). On August 24, 2016, the court granted defendants’ motion to dismiss. Plain-tiffs in that action have filed a notice of appeal in the United States Court of Appeals for the Second Circuit. The third putativeclass action was filed in the same court on December 21, 2015, by Axiom Investment Advisors, LLC alleging that DeutscheBank rejected FX orders placed over electronic trading platforms through the application of a function referred to as “Last Look”and that these orders were later filled at prices less favorable to putative class members. Plaintiff has asserted claims for breachof contract, quasi-contractual claims, and claims under New York statutory law. On February 13, 2017, Deutsche Bank’s motionto dismiss was granted in part and denied in part. Discovery has commenced in the Last Look action. The fourth putative classaction (the “Indirect Purchasers” action), which was filed on September 26, 2016, amended on March 24, 2017, and later con-solidated with a similar action that was filed on April 28, 2017, tracks the allegations in the consolidated action and asserts thatsuch purported conduct injured “indirect purchasers” of FX instruments. These claims are brought pursuant to the Sherman Actand various states’ consumer protection statutes. Plaintiffs filed an amended complaint on March 24, 2017. Deutsche Bank’smotion to dismiss this action is pending. Discovery has not yet commenced in the Indirect Purchasers action.
Deutsche Bank also has been named as a defendant in two Canadian class proceedings brought in the provinces of Ontarioand Quebec. Filed on September 10, 2015, these class actions assert factual allegations similar to those made in the consoli-dated action in the United States and seek damages pursuant to the Canadian Competition Act as well as other causes ofaction.
The Group has not disclosed whether it has established a provision or contingent liability with respect to these matters becauseit has concluded that such disclosure can be expected to prejudice seriously their outcome.

91
Deutsche Bank Information on the Consolidated Balance Sheet (unaudited)Interim Report as of September 30, 2017 Provisions
Interbank Offered Rates Matters. Regulatory and Law Enforcement Matters. Deutsche Bank has received requests for infor-mation from various regulatory and law enforcement agencies, including various U.S. state attorneys general, in connectionwith industry-wide investigations concerning the setting of the London Interbank Offered Rate (LIBOR), Euro Interbank OfferedRate (EURIBOR), Tokyo Interbank Offered Rate (TIBOR) and other interbank offered rates. Deutsche Bank is cooperating withthese investigations.
As previously reported, Deutsche Bank reached a settlement with the European Commission on December 4, 2013 as part of acollective settlement to resolve the European Commission’s investigations in relation to anticompetitive conduct in the trading ofEuro interest rate derivatives and Yen interest rate derivatives. Under the terms of the settlement agreement, Deutsche Bankagreed to pay € 725 million in total. This fine has been paid in full and does not form part of the Bank’s provisions.
Also as previously reported, on April 23, 2015, Deutsche Bank entered into separate settlements with the U.S. Department ofJustice (DOJ), the U.S. Commodity Futures Trading Commission (CFTC), the UK Financial Conduct Authority (FCA), and theNew York State Department of Financial Services (DFS) to resolve investigations into misconduct concerning the settingof LIBOR, EURIBOR, and TIBOR. Under the terms of these agreements, Deutsche Bank agreed to pay penalties ofU.S.$ 2.175 billion to the DOJ, CFTC and DFS and GBP 226.8 million to the FCA. As part of the resolution with the DOJ, DBGroup Services (UK) Ltd. (an indirectly-held, wholly-owned subsidiary of Deutsche Bank) pled guilty to one count of wire fraudin the U.S. District Court for the District of Connecticut and Deutsche Bank entered into a Deferred Prosecution Agreement witha three year term pursuant to which it agreed (among other things) to the filing of an Information in the U.S. District Court for theDistrict of Connecticut charging Deutsche Bank with one count of wire fraud and one count of price fixing in violation of theSherman Act. The fines referred to above, which include a U.S.$ 150 million fine paid in April 2017 following the March 28, 2017sentencing of DB Group Services (UK) Ltd., have been paid in full and do not form part of the Bank’s provisions.
On November 29, 2016, the U.S. Securities and Exchange Commission staff informed Deutsche Bank that it has concluded itsIBOR investigation and that it does not intend to recommend an enforcement action by the Commission.
On December 21, 2016, the Swiss Competition Commission, WEKO, formally announced its IBOR-related settlement decisionsaddressing various banks, including Deutsche Bank AG, relating to EURIBOR and Yen LIBOR. On March 20, 2017, DeutscheBank paid a fine of CHF 5.0 million with respect to Yen LIBOR and approximately CHF 0.4 million for WEKO’s fees. DeutscheBank received full immunity from fines for EURIBOR in return for being the first party to notify such conduct to WEKO. Thesettlement amount was already fully reflected in the existing litigation provisions.
On October 25, 2017, Deutsche Bank entered into a settlement with a working group of U.S. state attorneys general resolvingtheir interbank offered rate investigation. Among other conditions, Deutsche Bank is required to make a settlement payment ofU.S.$ 220 million. The settlement amount was already fully reflected in the existing litigation provisions and no additional provi-sion was taken for this settlement.
Other investigations of Deutsche Bank concerning the setting of various interbank offered rates remain ongoing, and DeutscheBank remains exposed to further action.
The Group has not disclosed whether it has established a provision or contingent liability with respect to the remaining investi-gations because it has concluded that such disclosure can be expected to seriously prejudice their outcome.
Overview of Civil Litigations. Deutsche Bank is party to 45 U.S. civil actions concerning alleged manipulation relating to thesetting of various Interbank Offered Rates which are described in the following paragraphs, as well as one action pending in theUK. Most of the civil actions, including putative class actions, are pending in the U.S. District Court for the Southern District ofNew York (SDNY), against Deutsche Bank and numerous other defendants. All but six of the U.S. civil actions were filed onbehalf of parties who allege losses as a result of manipulation relating to the setting of U.S. dollar LIBOR. The six civil actionspending against Deutsche Bank that do not relate to U.S. dollar LIBOR are also pending in the SDNY, and include two actionsconcerning Yen LIBOR and Euroyen TIBOR, one action concerning EURIBOR, one consolidated action concerning PoundSterling (GBP) LIBOR, one action concerning Swiss franc (CHF) LIBOR, and one action concerning two Singapore Dollar (SGD)benchmark rates, the Singapore Interbank Offered Rate (SIBOR) and the Swap Offer Rate (SOR).
Claims for damages for all 45 of the U.S. civil actions discussed have been asserted under various legal theories, includingviolations of the U.S. Commodity Exchange Act (CEA), federal and state antitrust laws, the U.S. Racketeer Influenced andCorrupt Organizations Act (RICO), and other federal and state laws. In all but five cases, the amount of damages has not beenformally articulated by the plaintiffs. The five cases that allege a specific amount of damages are individual actions consolidatedin the U.S. dollar LIBOR multidistrict litigation and seek a minimum of more than U.S.$ 1.25 billion in damages in the aggregatefrom all defendants including Deutsche Bank. The Group has not disclosed whether it has established a provision or contingentliability with respect to these matters because it has concluded that such disclosure can be expected to prejudice seriously theiroutcome.

92
Deutsche Bank 3 – Notes to the Consolidated Financial StatementsInterim Report as of September 30, 2017
U.S. dollar LIBOR. With one exception, all of the U.S. civil actions concerning U.S. dollar LIBOR are being coordinated as partof a multidistrict litigation (the “U.S. dollar LIBOR MDL”) in the SDNY. (Another, previously pending non-MDL U.S. dollar LIBORaction concluded after its dismissal became final, as described below.) In light of the large number of individual cases pendingagainst Deutsche Bank and their similarity, the civil actions included in the U.S. dollar LIBOR MDL are now subsumed underthe following general description of the litigation pertaining to all such actions, without disclosure of individual actions exceptwhen the circumstances or the resolution of an individual case is material to Deutsche Bank.
Following a series of decisions in the U.S. dollar LIBOR MDL between March 2013 and December 2016 narrowing their claims,plaintiffs are currently asserting antitrust claims, CEA claims and state law fraud, contract, unjust enrichment and other tortclaims. The court has also issued decisions dismissing certain plaintiffs’ claims for lack of personal jurisdiction and on statute oflimitations grounds.
On December 20, 2016, the district court issued a ruling dismissing certain antitrust claims while allowing others to proceed.Multiple plaintiffs have filed appeals of the district court’s December 20, 2016 ruling to the Second Circuit, and those appealsare proceeding in parallel with the ongoing proceedings in the district court. Those appeals are in their early stages.
Discovery is underway in several of the cases, and motions for class certification are scheduled to be fully briefed in Novem-ber 2017.
On January 10, 2017, Deutsche Bank entered into a preliminary agreement with plaintiffs to settle a putative class action pend-ing as part of the U.S. dollar LIBOR MDL asserting claims based on alleged transactions in Eurodollar futures and optionstraded on the Chicago Mercantile Exchange (FTC Capital GmbH v. Credit Suisse Group AG). The settlement agreement wasexecuted on July 13, 2017, and it was submitted to the court for preliminary approval on October 11, 2017. The settlementamount is already fully reflected in existing litigation provisions and no additional provisions have been taken for this settlement.The settlement agreement is subject to further review and approval by the court.
Finally, one of the actions in the U.S. dollar LIBOR MDL has been dismissed in its entirety, including (as to Deutsche Bank andother foreign defendants) on personal jurisdiction grounds, and plaintiffs have filed an appeal to the Second Circuit. The appealhas been fully briefed, and oral argument was held on September 25, 2017.
Plaintiffs in the non-MDL case proceeding in the SDNY have moved to amend their complaint following a dismissal of theirclaims, and a decision on that motion to amend is pending. The dismissal of another non-MDL case, which was proceeding inthe U.S. District Court for the Central District of California, was affirmed by the Ninth Circuit in December 2016 and time to filefurther appeals has expired.
There is a further civil action regarding U.S. dollar LIBOR, which was served on Deutsche Bank in the UK in July 2017, in whicha claim for damages has been asserted pursuant to Article 101 of The Treaty on the Functioning of the European Union, Sec-tion 2 of Chapter 1 of the UK Competition Act 1998 and U.S. state laws. Deutsche Bank intends to defend this action.
Yen LIBOR and Euroyen TIBOR. On January 24, 2017, Deutsche Bank entered into a preliminary agreement with plaintiffs tosettle two putative class actions pending in the SDNY alleging manipulation of Yen LIBOR and Euroyen TIBOR (Laydon v.Mizuho Bank, Ltd. and Sonterra Capital Master Fund Ltd. v. UBS AG). On July 21, 2017, Deutsche Bank and plaintiffs executeda settlement agreement in the amount of U.S.$ 77 million and submitted the agreement to the court for preliminary approval.The settlement amount, which Deutsche Bank paid on August 1, 2017, is no longer reflected in Deutsche Bank’s litigation pro-visions. On August 13, 2017, the court granted preliminary approval of the settlement. The settlement agreement is subject tofurther review and approval by the court. The final approval hearing is scheduled for December 7, 2017.
EURIBOR. On January 24, 2017, Deutsche Bank entered into a preliminary agreement with plaintiffs to settle a putative classaction pending in the SDNY alleging manipulation of EURIBOR (Sullivan v. Barclays PLC). On May 10, 2017, Deutsche Bankand plaintiffs executed a settlement agreement in the amount of U.S.$ 170 million, which was submitted to the court for prelimi-nary approval on June 12, 2017. The court granted preliminary approval on July 7, 2017. The settlement agreement is subjectto further review and final approval by the court. Under the terms of the settlement, Deutsche Bank has paid U.S.$ 170 million,and is no longer reflecting that amount in its litigation provisions.
GBP LIBOR. A putative class action alleging manipulation of the Pound Sterling (GBP) LIBOR remains pending in the SDNY. Itis the subject of a fully briefed motion to dismiss. The court held argument on August 4, 2017.
CHF LIBOR. On September 25, 2017, the court in the SDNY dismissed the plaintiffs’ putative class action alleging manipulationof the Swiss Franc (CHF) LIBOR in full, but gave plaintiffs an opportunity to file an amended complaint. Plaintiffs’ amendedcomplaint is to be filed by November 6, 2017, and defendants’ motion to dismiss the amended complaint is due onDecember 7, 2017.
93
Deutsche Bank Information on the Consolidated Balance Sheet (unaudited)Interim Report as of September 30, 2017 Provisions
SIBOR and SOR. On August 18, 2017, the court in the SDNY dismissed the plaintiffs’ putative class action alleging manipula-tion of the Singapore Interbank Offered Rate (SIBOR) and Swap Offer Rate (SOR) in part, but gave plaintiffs an opportunity tofile an amended complaint. Plaintiffs filed their amended complaint on September 18, 2017, and defendants filed a motion todismiss the amended complaint on October 18, 2017.
Bank Bill Swap Rate Claims. On August 16, 2016, a putative class action was filed in the U.S. District Court for the SouthernDistrict of New York against Deutsche Bank and other defendants, bringing claims based on alleged collusion and manipulationin connection with the Australian Bank Bill Swap Rate (“BBSW”). The complaint alleges that the defendants, among other things,engaged in money market transactions intended to influence the BBSW fixing, made false BBSW submissions, and used theircontrol over BBSW rules to further the alleged misconduct. Plaintiffs bring suit on behalf of persons and entities that engaged inU.S.-based transactions in BBSW-linked financial instruments from 2003 through the present. An amended complaint was filedon December 16, 2016, and is the subject of fully briefed motions to dismiss.
Investigations Into Referral Hiring Practices and Certain Business Relationships. Certain regulators and law enforcementauthorities in various jurisdictions, including the U.S. Securities and Exchange Commission and the U.S. Department of Justice,are investigating, among other things, Deutsche Bank’s compliance with the U.S. Foreign Corrupt Practices Act and other lawswith respect to the Bank’s hiring practices related to candidates referred by clients, potential clients and government officials,and its engagement of finders and consultants. Deutsche Bank is responding to and continuing to cooperate with these investi-gations. Certain regulators in other jurisdictions have also been briefed on these investigations. The Group has recorded aprovision with respect to certain of these regulatory investigations. The Group has not disclosed the amount of this provisionbecause it has concluded that such disclosure can be expected to prejudice seriously the outcome of these regulatory investi-gations. Based on the facts currently known, it is not practicable at this time for the Bank to predict the timing of a resolution.
Kirch. The public prosecutor’s office in Munich (Staatsanwaltschaft München I) has conducted and is currently conductingcriminal investigations in connection with the Kirch case inter alia with regard to former Deutsche Bank Management Boardmembers. The Kirch case involved several civil proceedings between Deutsche Bank AG and Dr. Leo Kirch as well as mediacompanies controlled by him. The key issue was whether an interview given by Dr. Rolf Breuer, then Spokesman of DeutscheBank’s Management Board, in 2002 with Bloomberg television, during which Dr. Breuer commented on Dr. Kirch’s (and hiscompanies’) inability to obtain financing, caused the insolvency of the Kirch companies. In February 2014, Deutsche Bank andthe Kirch heirs reached a comprehensive settlement, which has ended all legal disputes between them.
The allegations of the public prosecutor are that the relevant former Management Board members failed to correct in a timelymanner factual statements made by Deutsche Bank’s litigation counsel in submissions filed in one of the civil cases betweenKirch and Deutsche Bank AG before the Munich Higher Regional Court and the Federal Court of Justice, after allegedly havingbecome aware that such statements were not correct, and/or made incorrect statements in such proceedings, respectively.
On April 25, 2016, following the trial before the Munich District Court regarding the main investigation involving Jürgen Fitschenand four other former Management Board members, the Munich District Court acquitted all of the accused, as well as the Bank,which was a secondary participant in such proceedings. On April 26, 2016, the public prosecutor filed an appeal. An appeal islimited to a review of legal errors rather than facts. On October 18, 2016, a few weeks after the written judgment was served,the public prosecutor provided notice that it will uphold its appeal only with respect to former Management Board membersJürgen Fitschen, Dr. Rolf Breuer and Dr. Josef Ackermann and that it will withdraw its appeal with respect to former Manage-ment Board members Dr. Clemens Börsig and Dr. Tessen von Heydebreck for whom the acquittal thereby becomes binding.
The other investigations by the public prosecutor (which also deal with attempted litigation fraud in the Kirch civil proceedings)are ongoing. Deutsche Bank is fully cooperating with the Munich public prosecutor’s office.
The Group does not expect these proceedings to have significant economic consequences for it and has not recorded a provi-sion or contingent liability with respect thereto.
KOSPI Index Unwind Matters. Following the decline of the Korea Composite Stock Price Index 200 (the “KOSPI 200”) in theclosing auction on November 11, 2010 by approximately 2.7 %, the Korean Financial Supervisory Service (“FSS”) commencedan investigation and expressed concerns that the fall in the KOSPI 200 was attributable to a sale by Deutsche Bank of a basketof stocks, worth approximately € 1.6 billion, that was held as part of an index arbitrage position on the KOSPI 200. On Febru-ary 23, 2011, the Korean Financial Services Commission, which oversees the work of the FSS, reviewed the FSS’ findings andrecommendations and resolved to take the following actions: (i) to file a criminal complaint to the Korean Prosecutor’s Office foralleged market manipulation against five employees of the Deutsche Bank group and Deutsche Bank’s subsidiary DeutscheSecurities Korea Co. (DSK) for vicarious corporate criminal liability; and (ii) to impose a suspension of six months, commencingApril 1, 2011 and ending September 30, 2011, of DSK’s business for proprietary trading of cash equities and listed derivativesand DMA (direct market access) cash equities trading, and the requirement that DSK suspend the employment of one namedemployee for six months. There was an exemption to the business suspension which permitted DSK to continue acting asliquidity provider for existing derivatives linked securities. On August 19, 2011, the Korean Prosecutor’s Office announced itsdecision to indict DSK and four employees of the Deutsche Bank group on charges of spot/futures linked market manipulation.

94
Deutsche Bank 3 – Notes to the Consolidated Financial StatementsInterim Report as of September 30, 2017
The criminal trial commenced in January 2012. On January 25, 2016, the Seoul Central District Court rendered a guilty verdictagainst a DSK trader and a guilty verdict against DSK. A criminal fine of KRW 1.5 billion (less than € 2.0 million) was imposedon DSK. The Court also ordered forfeiture of the profits generated on the underlying trading activity. The Group disgorged theprofits on the underlying trading activity in 2011. The criminal trial verdict has been appealed by both the prosecutor and thedefendants.
In addition, a number of civil actions have been filed in Korean courts against Deutsche Bank and DSK by certain parties whoallege they incurred losses as a consequence of the fall in the KOSPI 200 on November 11, 2010. First instance court decisionswere rendered against the Bank and DSK in some of these cases starting in the fourth quarter of 2015. The outstanding knownclaims have an aggregate claim amount of less than € 50 million (at present exchange rates). The Group has recorded a provi-sion with respect to these outstanding civil matters. The Group has not disclosed the amount of this provision because it hasconcluded that such disclosure can be expected to prejudice seriously the outcome of these matters.
Mortgage-Related and Asset-Backed Securities Matters and Investigation. Regulatory and Governmental Matters.Deutsche Bank, along with certain affiliates (collectively referred in these paragraphs to as “Deutsche Bank”), have receivedsubpoenas and requests for information from certain regulators and government entities, including members of the ResidentialMortgage-Backed Securities Working Group of the U.S. Financial Fraud Enforcement Task Force, concerning its activitiesregarding the origination, purchase, securitization, sale, valuation and/or trading of mortgage loans, residential mortgage-backed securities (RMBS), commercial mortgage-backed securities (CMBS), collateralized debt obligations (CDOs), otherasset-backed securities and credit derivatives. Deutsche Bank is cooperating fully in response to those subpoenas and re-quests for information.
Discussions with the U.S. Department of Justice (DOJ) concerning a settlement of potential claims that the DOJ was consider-ing bringing based on its investigation of Deutsche Bank’s RMBS origination and securitization activities began with an initialdemand of U.S.$ 14 billion on September 12, 2016. On December 23, 2016, Deutsche Bank announced that it reached a set-tlement-in-principle with the DOJ to resolve potential claims related to its RMBS business conducted from 2005 to 2007. Thesettlement became final and was announced by the DOJ on January 17, 2017. Under the settlement, Deutsche Bank paid acivil monetary penalty of U.S.$ 3.1 billion and agreed to provide U.S.$ 4.1 billion in consumer relief.
In September 2016, Deutsche Bank received administrative subpoenas from the Maryland Attorney General seeking infor-mation concerning Deutsche Bank’s RMBS and CDO businesses from 2002 to 2009. On June 1, 2017, Deutsche Bank and theMaryland Attorney General reached a settlement to resolve the matter for U.S.$ 15 million in cash and U.S.$ 80 million in con-sumer relief (to be allocated from the overall U.S.$ 4.1 billion consumer relief obligation agreed to as part of Deutsche Bank’ssettlement with the DOJ).
The Group has recorded provisions with respect to some of the outstanding regulatory investigations but not others. The Grouphas not disclosed the amount of these provisions because it has concluded that such disclosure can be expected to prejudiceseriously the resolution of these regulatory investigations.
Issuer and Underwriter Civil Litigation. Deutsche Bank has been named as defendant in numerous civil litigations brought byprivate parties in connection with its various roles, including issuer or underwriter, in offerings of RMBS and other asset-backedsecurities. These cases, described below, allege that the offering documents contained material misrepresentations and omis-sions, including with regard to the underwriting standards pursuant to which the underlying mortgage loans were issued, orassert that various representations or warranties relating to the loans were breached at the time of origination. The Group hasrecorded provisions with respect to several of these civil cases, but has not recorded provisions with respect to all of thesematters. The Group has not disclosed the amount of these provisions because it has concluded that such disclosure can beexpected to prejudice seriously the resolution of these matters.
Deutsche Bank is a defendant in a class action relating to its role as one of the underwriters of six RMBS offerings issued byNovastar Mortgage Corporation. No specific damages are alleged in the complaint. The lawsuit was brought by plaintiffs repre-senting a class of investors who purchased certificates in those offerings. The parties reached a settlement to resolve the mat-ter for a total of U.S.$ 165 million, a portion of which was paid by the Bank. The settlement is subject to final court approval. OnAugust 30, 2017, FHFA/Freddie Mac filed an objection to the settlement.
Deutsche Bank is a defendant in three actions related to RMBS offerings brought by the Federal Deposit Insurance Corporation(FDIC) as receiver for: (a) Colonial Bank (alleging no less than U.S.$ 189 million in damages against all defendants), (b) Guar-anty Bank (alleging no less than U.S.$ 901 million in damages against all defendants), and (c) Citizens National Bank andStrategic Capital Bank (alleging no less than U.S.$ 66 million in damages against all defendants). In each of these actions, theappellate courts have reinstated claims previously dismissed on statute of limitations grounds. In the case concerning ColonialBank, petitions for rehearing and certiorari to the U.S. Supreme Court were denied, and on June 21, 2017, the FDIC filed asecond amended complaint, which defendants moved to dismiss on September 7, 2017. In the case concerning Guaranty Bank,petitions for rehearing and certiorari to the U.S. Supreme Court were denied, fact discovery is almost complete, and expert workis ongoing. Also, on September 14, 2017, the court granted in part Deutsche Bank’s motion for summary judgment regarding

95
Deutsche Bank Information on the Consolidated Balance Sheet (unaudited)Interim Report as of September 30, 2017 Provisions
the proper method of calculating pre-judgment interest. In the case concerning Citizens National Bank and Strategic CapitalBank, a petition for rehearing was denied, and on June 26, 2017, defendants filed a petition for certiorari to the U.S. SupremeCourt.
Deutsche Bank reached a settlement to resolve claims brought by the Federal Home Loan Bank of San Francisco on two rese-curitizations of RMBS certificates for an amount not material to the Bank. Following this settlement and two other previouspartial settlements of claims, Deutsche Bank remained a defendant with respect to one RMBS offering, for which DeutscheBank, as an underwriter, was provided contractual indemnification. On January 23, 2017, a settlement agreement was executedto resolve the claims relating to that RMBS offering, and the matter has been dismissed.
Deutsche Bank is a defendant in an action brought by Royal Park Investments (as purported assignee of claims of a special-purpose vehicle created to acquire certain assets of Fortis Bank) alleging common law claims related to the purchase of RMBS.The complaint did not specify the amount of damages sought. On April 17, 2017, the court dismissed the complaint, and theplaintiff has appealed.
In June 2014, HSBC, as trustee, brought an action in New York state court against Deutsche Bank to revive a prior action,alleging that Deutsche Bank failed to repurchase mortgage loans in the ACE Securities Corp. 2006-SL2 RMBS offering. Therevival action was stayed during the pendency of an appeal of the dismissal of a separate action wherein HSBC, as trustee,brought an action against Deutsche Bank alleging breaches of representations and warranties made by Deutsche Bank con-cerning the mortgage loans in the same offering. On March 29, 2016, the court dismissed the revival action, and on April 29,2016, plaintiff filed a notice of appeal. Plaintiff’s appeal has been adjourned in light of a case pending in the New York Court ofAppeals involving similar legal issues.
On February 3, 2016, Lehman Brothers Holding, Inc. (Lehman) instituted an adversary proceeding in United States BankruptcyCourt for the Southern District of New York against, among others, MortgageIT, Inc. (MIT) and Deutsche Bank AG, as allegedsuccessor to MIT, asserting breaches of representations and warranties set forth in certain 2003 and 2004 loan purchaseagreements concerning 63 mortgage loans that MIT sold to Lehman, which Lehman in turn sold to the Federal National Mort-gage Association (Fannie Mae) and the Federal Home Loan Mortgage Corporation (Freddie Mac). The complaint seeks indem-nification for losses incurred by Lehman in connection with settlements entered into with Fannie Mae and Freddie Mac as partof the Lehman bankruptcy proceedings to resolve claims concerning those loans. On December 29, 2016, Lehman filed itssecond amended complaint against DB Structured Products, Inc. and MIT alleging damages of approximatelyU.S.$ 10.3 million. Defendants filed a motion to dismiss the second amended complaint on March 31, 2017.
In the actions against Deutsche Bank solely as an underwriter of other issuers’ RMBS offerings, Deutsche Bank has contractualrights to indemnification from the issuers, but those indemnity rights may in whole or in part prove effectively unenforceablewhere the issuers are now or may in the future be in bankruptcy or otherwise defunct.
Trustee Civil Litigation. Deutsche Bank is a defendant in eight separate civil lawsuits brought by various groups of investorsconcerning its role as trustee of certain RMBS trusts. The actions generally allege claims for breach of contract, breach of fidu-ciary duty, breach of the duty to avoid conflicts of interest, negligence and/or violations of the Trust Indenture Act of 1939, basedon the trustees’ alleged failure to perform adequately certain obligations and/or duties as trustee for the trusts. The eight actionsinclude two putative class actions brought by a group of investors, including funds managed by BlackRock Advisors, LLC,PIMCO-Advisors, L.P., and others (the BlackRock Class Actions), two putative class actions brought by Royal Park InvestmentsSA/NV, and four individual lawsuits. One of the BlackRock Class Actions is pending in the U.S. District Court for the SouthernDistrict of New York in relation to 62 trusts, which allegedly suffered total realized collateral losses of U.S.$ 9.8 billion, althoughthe complaint does not specify a damage amount. On January 23, 2017, the Court granted in part and denied in part the trus-tees’ motion to dismiss. On February 3, 2017, the Court entered an order dismissing plaintiffs’ representations and warrantiesclaims as to 21 trusts whose originators or sponsors had entered bankruptcy. The only claims that remain are for violation of theTrust Indenture Act of 1939 as to some trusts, and breach of contract. On March 27, 2017, the trustees filed an answer to thecomplaint. Discovery is ongoing. The second BlackRock Class Action is pending in the Superior Court of California in relation to465 trusts, which allegedly suffered total realized collateral losses of U.S.$ 75.7 billion, although the complaint does not specifya damage amount. The trustees filed a demurrer seeking to dismiss the tort claims asserted by plaintiffs and a motion to strikecertain elements of the breach of contract claim, and on October 18, 2016, the court sustained the trustees’ demurrer, dismiss-ing the tort claims, but denied the motion to strike. On December 19, 2016, the trustees filed an answer to the complaint. Dis-covery is ongoing. The putative class action brought by Royal Park Investments SA/NV is pending in the U.S. District Court forthe Southern District of New York and concerns ten trusts, which allegedly suffered total realized collateral losses of more thanU.S.$ 3.1 billion, although the complaint does not specify a damage amount. Royal Park filed a renewed motion for class certifi-cation on May 1, 2017, and the motion is pending. Discovery is ongoing. On August 4, 2017, Royal Park filed a separate, addi-tional class action complaint against the trustee in the same court asserting claims for breach of contract, unjust enrichment,conversion, breach of trust, equitable accounting and declaratory and injunctive relief arising out of the payment from trust fundsof the trustee’s legal fees and expenses in the other, ongoing Royal Park litigation. On October 10, 2017, the trustee filed amotion to dismiss that complaint.

96
Deutsche Bank 3 – Notes to the Consolidated Financial StatementsInterim Report as of September 30, 2017
The four individual lawsuits include actions by (a) the National Credit Union Administration Board (“NCUA”), as an investor in 97trusts, which allegedly suffered total realized collateral losses of U.S.$ 17.2 billion, although the complaint does not specify adamage amount; (b) certain CDOs (collectively, “Phoenix Light”) that hold RMBS certificates issued by 43 RMBS trusts, andseeking “hundreds of millions of dollars in damages”; (c) Commerzbank AG, as an investor in 50 RMBS trusts, seeking recov-ery for alleged “hundreds of millions of dollars in losses;” and (d) IKB International, S.A. in Liquidation and IKB Deutsche Indus-triebank AG (collectively, “IKB”), as an investor in 30 RMBS trusts, seeking more than U.S.$ 268 million of damages. In theNCUA case, the trustee’s motion to dismiss for failure to state a claim is pending and discovery is stayed. In the Phoenix Lightcase, the plaintiffs filed an amended complaint on September 27, 2017, and discovery is ongoing. In the Commerzbank case,the trustee’s motion to dismiss for failure to state a claim was granted in part and denied in part on February 10, 2017, and thetrustee filed its answer on May 1, 2017; discovery is ongoing as to the 50 trusts in the case. In the IKB case, the court heardoral argument on the trustee’s motion to dismiss on May 3, 2017, but has not yet issued a decision. On June 20, 2017, the IKBplaintiffs stipulated to the dismissal with prejudice of all claims asserted against Deutsche Bank concerning four trusts. Discov-ery is ongoing. Deutsche Bank was also a defendant in a lawsuit brought by the Western and Southern Life Insurance Compa-ny and five related entities, but on September 28, 2017, plaintiffs filed a notice of voluntary dismissal of their claims, withoutprejudice.
The Group believes a contingent liability exists with respect to these eight cases, but at present the amount of the contingentliability is not reliably estimable.
Postbank Voluntary Public Takeover Offer. On September 12, 2010, Deutsche Bank announced the decision to make avoluntary takeover offer for the acquisition of all shares in Deutsche Postbank AG (Postbank). On October 7, 2010, the Bankpublished the official offer document. In its takeover offer, Deutsche Bank offered Postbank shareholders consideration of € 25for each Postbank share. The takeover offer was accepted for a total of approximately 48.2 million Postbank shares.
In November 2010, a former shareholder of Postbank, Effecten-Spiegel AG, which had accepted the takeover offer, brought aclaim against Deutsche Bank alleging that the offer price was too low and was not determined in accordance with the applicablelaw of the Federal Republic of Germany. The plaintiff alleges that Deutsche Bank had been obliged to make a mandatory take-over offer for all shares in Postbank, at the latest, in 2009. The plaintiff avers that, at the latest in 2009, the voting rights ofDeutsche Post AG in Postbank had to be attributed to Deutsche Bank AG pursuant to Section 30 of the German Takeover Act.Based thereon, the plaintiff alleges that the consideration offered by Deutsche Bank AG for the shares in Postbank in the 2010voluntary takeover offer needed to be raised to € 57.25 per share.
The Cologne District Court dismissed the claim in 2011 and the Cologne appellate court dismissed the appeal in 2012. TheFederal Court set aside the Cologne appellate court’s judgment and referred the case back to the appellate court. In its judg-ment, the Federal Court stated that the appellate court had not sufficiently considered the plaintiff’s allegation that DeutscheBank AG and Deutsche Post AG “acted in concert” in 2009. The Cologne appellate court has scheduled a further hearing forNovember 8, 2017.
Starting in 2014, additional former shareholders of Postbank, who accepted the 2010 tender offer, brought similar claims asEffecten-Spiegel AG against Deutsche Bank which are pending with the Cologne District Court. After some of these plaintiffsapplied for model case proceedings (Musterverfahren) under the German Capital Markets Model Case Act, Deutsche Bankdecided to support the initiation of model case proceedings and filed motions for this with the Cologne District Court.
After the Cologne District Court dismissed the motions for the initiation of model case proceedings, the Cologne District Courthanded down a decision on October 20, 2017 granting the claims in a total of 14 cases which were combined in one proceeding.The Cologne District Court took the view that the appropriate consideration to be offered in the takeover offer should have been€ 57.25 per share. Taking the consideration paid into account, the additional consideration per share owed to shareholderswhich have accepted the takeover offer would thus amount to € 32.25. Deutsche Bank will appeal this decision.
In September 2015, former shareholders of Postbank filed in the Cologne District Court shareholder actions against Postbankto set aside the squeeze-out resolution taken in the shareholders meeting of Postbank in August 2015. Among other things, theplaintiffs allege that Deutsche Bank was subject to a suspension of voting rights with respect to its shares in Postbank based onthe allegation that Deutsche Bank failed to make a mandatory takeover offer at a higher price in 2009. The squeeze out is finaland the proceeding itself has no reversal effect, but may result in damage payments. The claimants in this proceeding refer tolegal arguments similar to those asserted in the Effecten-Spiegel proceeding described above. In a decision on October 20,2017, the Cologne District Court declared the squeeze-out resolution to be void. The court, however, did not rely on a suspen-sion of voting rights due to an alleged failure of Deutsche Bank to make a mandatory takeover offer, but argued that Postbankviolated information rights of Postbank shareholders in Postbank's shareholders meeting in August 2015.
The legal question whether Deutsche Bank had been obliged to make a mandatory takeover offer for all Postbank shares priorto its 2010 voluntary takeover may also impact two pending appraisal proceedings (Spruchverfahren). These proceedings wereinitiated by former Postbank shareholders with the aim to increase the cash compensation offered in connection with thesqueeze-out of Postbank shareholders in 2015 and the cash compensation offered and annual guaranteed dividend paid in
97
Deutsche Bank Information on the Consolidated Balance Sheet (unaudited)Interim Report as of September 30, 2017 Provisions
connection with the execution of a domination and profit and loss transfer agreement (Beherrschungs- und Gewinnabführungs-vertrag) between DB Finanz-Holding AG (now DB Beteiligungs-Holding GmbH) and Postbank in 2012. The Cologne DistrictCourt issued resolutions indicating that it is inclined to consider a potential obligation of Deutsche Bank to make a mandatorytakeover offer for Postbank at an offer price of € 57.25 when determining the adequate cash compensation in the appraisalproceedings. The cash compensation paid in connection with the domination and profit and loss transfer agreement was€ 25.18 and was accepted for approximately 0.5 million shares. The squeeze-out compensation paid in 2015 was € 35.05 andapproximately 7 million shares were squeezed-out.
The Group has not disclosed whether it has established a provision or contingent liability with respect to these matters becauseit has concluded that such disclosure can be expected to prejudice seriously their outcome.
Precious Metals Investigations and Litigations. Deutsche Bank has received inquiries from certain regulatory and law en-forcement authorities, including requests for information and documents, pertaining to investigations of precious metals tradingand related conduct. Deutsche Bank is cooperating with these investigations, and engaging with relevant authorities, as appro-priate. Relatedly, Deutsche Bank has been conducting its own internal review of Deutsche Bank’s historic participation in theprecious metals benchmarks and other aspects of its precious metals trading and precious metals business.
Deutsche Bank is a defendant in two consolidated class action lawsuits pending in the U.S. District Court for the SouthernDistrict of New York. The suits allege violations of U.S. antitrust law, the U.S. Commodity Exchange Act and related state lawarising out of the alleged manipulation of gold and silver prices through participation in the Gold and Silver Fixes, but do notspecify the damages sought. Deutsche Bank has reached agreements to settle both actions, the financial terms of which arenot material to Deutsche Bank. The agreements remain subject to final court approval.
In addition, Deutsche Bank is a defendant in Canadian class action proceedings in the provinces of Ontario and Quebec con-cerning gold and silver. Each of the proceedings seeks damages for alleged violations of the Canadian Competition Act andother causes of action.
The Group has recorded provisions with respect to certain of these matters. The Group has not disclosed the amount of theseprovisions, nor has it disclosed whether it has established provisions with respect to other matters referred above or any contin-gent liability with respect to any of those matters, because it has concluded that such disclosure can be expected to prejudiceseriously their outcome.
Russia/UK Equities Trading Investigation. Deutsche Bank has investigated the circumstances around equity trades enteredinto by certain clients with Deutsche Bank in Moscow and London that offset one another. The total volume of transactionsreviewed is significant. Deutsche Bank's internal investigation of potential violations of law, regulation and policy and into therelated internal control environment has concluded, and Deutsche Bank is assessing the findings identified during the investiga-tion; to date it has identified certain violations of Deutsche Bank’s policies and deficiencies in Deutsche Bank's control environ-ment. Deutsche Bank has advised regulators and law enforcement authorities in several jurisdictions (including Germany,Russia, the UK and U.S.) of this investigation. Deutsche Bank has taken disciplinary measures with regards to certain individu-als in this matter and will continue to do so with respect to others as warranted.
On January 30 and 31, 2017, the New York State Department of Financial Services (DFS) and UK Financial Conduct Authority(FCA) announced settlements with the Bank related to their investigations into this matter. The settlements conclude the DFSand the FCA’s investigations into the bank’s anti-money laundering (AML) control function in its investment banking division,including in relation to the equity trading described above. Under the terms of the settlement agreement with the DFS, DeutscheBank entered into a Consent Order, and agreed to pay civil monetary penalties of U.S.$ 425 million and to engage an inde-pendent monitor for a term of up to two years. Under the terms of the settlement agreement with the FCA, Deutsche Bankagreed to pay civil monetary penalties of approximately GBP 163 million. On May 30, 2017, the Federal Reserve announced itssettlement with the Bank resolving this matter as well as additional AML issues identified by the Federal Reserve. DeutscheBank paid a penalty of U.S.$ 41 million. Deutsche Bank also agreed to retain independent third parties to assess its Bank Se-crecy Act/AML program and review certain foreign correspondent banking activity of its subsidiary Deutsche Bank Trust Com-pany Americas. The Bank is also required to submit written remediation plans and programs. The DFS, FCA and FederalReserve settlement amounts were already materially reflected in existing litigation provisions.
Deutsche Bank continues to cooperate with regulators and law enforcement authorities, including the DOJ, which has its ownongoing investigation into these securities trades. The Group has recorded a provision with respect to the remaining investiga-tion. The Group has not disclosed the amount of this provision because it has concluded that such disclosure can be expectedto prejudice seriously the outcome of this matter.
Sovereign, Supranational and Agency Bonds (SSA) Investigations and Litigations. Deutsche Bank has received inquiriesfrom certain regulatory and law enforcement authorities, including requests for information and documents, pertaining to SSAbond trading. Deutsche Bank is cooperating with these investigations.

98
Deutsche Bank 3 – Notes to the Consolidated Financial StatementsInterim Report as of September 30, 2017
Deutsche Bank is a defendant in several putative class action complaints filed in the U.S. District Court for the Southern Districtof New York alleging violations of U.S. antitrust law and common law related to alleged manipulation of the secondary tradingmarket for SSA bonds. Deutsche Bank has reached an agreement to settle the actions for the amount of U.S.$ 48.5 million. Thesettlement is subject to court approval.
The Group has not disclosed whether it has established provisions with respect to other matters referred to above or contingentliability with respect to those matters because it has concluded that such disclosure can be expected to prejudice seriously theiroutcome.
Trust Preferred Securities Litigation. Deutsche Bank and certain of its affiliates and former officers are the subject of a consol-idated putative class action, filed in the United States District Court for the Southern District of New York, asserting claims underthe federal securities laws on behalf of persons who purchased certain trust preferred securities issued by Deutsche Bank andits affiliates between October 2006 and May 2008. In a series of opinions, the court dismissed all claims as to four of the sixofferings at issue, but allowed certain alleged omissions claims relating to the November 2007 and February 2008 offerings toproceed. On November 17, 2016, plaintiffs moved for class certification as to the November 2007 offering. On January 20, 2017,plaintiffs amended their motion for class certification to include the February 2008 offering and seek to add an additional indi-vidual as a proposed class representative. The court stayed all proceedings pending a decision by the Supreme Court of theUnited States in California Public Employees’ Retirement System v. ANZ Securities in which the Supreme Court was expectedto consider whether the filing of a putative class action serves to toll the three-year time limitation in Section 13 of the SecuritiesAct with respect to the claims of putative class members. This related to claims relating to the February 2008 offering. On June26, 2017, the Supreme Court issued its opinion, holding that the three year provision in Section 13 is a statute of repose and isnot subject to equitable tolling. On October 16, 2017, the court struck plaintiffs’ motion for class action certification, holding thatclaims by the additional individual proposed as a class representative were barred by the statute of repose. The Court alsoruled that the original plaintiffs had standing to prosecute claims on both the November 2007 and February 2008 offerings.
The Group has not disclosed whether it has established a provision or contingent liability with respect to this matter because ithas concluded that such disclosure can be expected to seriously prejudice its outcome.
U.S. Embargoes-Related Matters. Deutsche Bank has received requests for information from certain U.S. regulatory and lawenforcement agencies concerning its historical processing of U.S. dollar payment orders through U.S. financial institutions forparties from countries subject to U.S. embargo laws in connection with investigations into whether such processing compliedwith U.S. federal and state laws. In 2006, Deutsche Bank voluntarily decided that it would not engage in new U.S. dollar busi-ness with counterparties in Iran, Sudan, North Korea and Cuba and with certain Syrian banks, and to exit existing U.S. dollarbusiness with such counterparties to the extent legally possible. In 2007, Deutsche Bank decided that it would not engage inany new business, in any currency, with counterparties in Iran, Syria, Sudan and North Korea and to exit existing business, inany currency, with such counterparties to the extent legally possible; it also decided to limit its non-U.S. dollar business withcounterparties in Cuba. On November 3, 2015, Deutsche Bank entered into agreements with the New York State Departmentof Financial Services and the Federal Reserve Bank of New York to resolve their investigations of Deutsche Bank. DeutscheBank paid the two agencies U.S.$ 200 million and U.S.$ 58 million, respectively, and agreed not to rehire certain former em-ployees. In addition, the New York State Department of Financial Services ordered Deutsche Bank to terminate certain employ-ees and Deutsche Bank agreed to retain an independent monitor for one year, and the Federal Reserve Bank of New Yorkordered certain remedial measures including ensuring an effective OFAC compliance program and an annual review of suchprogram by an independent party until the Federal Reserve Bank of New York is satisfied as to its effectiveness.
The Group has not disclosed whether it has established a provision or contingent liability with respect to this matter because ithas concluded that such disclosure can be expected to prejudice seriously its outcome.
U.S. Treasury Securities Investigations and Litigations. Deutsche Bank has received inquiries from certain regulatory andlaw enforcement authorities, including requests for information and documents, pertaining to U.S. Treasuries auctions, trading,and related market activity. Deutsche Bank is cooperating with these investigations.
Deutsche Bank is a defendant in several putative class actions alleging violations of U.S. antitrust law, the U.S. CommodityExchange Act and common law related to the alleged manipulation of the U.S. Treasury securities market. These cases are intheir early stages and have been consolidated in the Southern District of New York.
The Group has not disclosed whether it has established a provision or contingent liability with respect to these matters becauseit has concluded that such disclosure can be expected to prejudice seriously their outcome.

99
Deutsche Bank Information on the Consolidated Balance Sheet (unaudited)Interim Report as of September 30, 2017 Shares Issued and Outstanding
Long-Term Debtin € m. Sep 30, 2017 Dec 31, 2016Senior debt:Bonds and notes
Fixed rate 75,023 84,924Floating rate 30,104 37,082
Subordinated debt:Bonds and notes
Fixed rate 4,709 4,882Floating rate 1,770 1,906
Other 47,485 43,523Total long-term debt 159,091 172,316
Shares Issued and OutstandingOn April 7, 2017, Deutsche Bank AG completed a capital increase from authorized capital against cash contributions through apublic offering with subscription rights. In total, 687.5 million new common shares were issued, resulting in total proceeds of€ 8.0 billion. The new shares were issued with the same dividend rights as the existing shares. 98.92 % of the subscriptionrights were exercised and thus 680.1 million new shares were issued at the subscription price of € 11.65 per share. The remain-ing 7.4 million new shares were sold in the market at an average price of € 15.50 per share.
The transaction costs related to the capital increase that were directly recorded in equity amounted to € 0.1 billion after tax.
in million Sep 30, 2017 Dec 31, 2016Shares issued 2,066.8 1,379.3Shares in treasury 0.6 0.2
Thereof:Buyback 0.4 0.0Other 0.2 0.2
Shares outstanding 2,066.2 1,379.1

100
Deutsche Bank 3 – Notes to the Consolidated Financial StatementsInterim Report as of September 30, 2017
Other Financial Information (unaudited)
Credit related Commitments and Contingent Liabilities
Irrevocable lending commitments and lending related contingent liabilities
In the normal course of business the Group regularly enters into irrevocable lending commitments, including fronting commit-ments as well as contingent liabilities consisting of financial and performance guarantees, standby letters of credit and indemni-ty agreements on behalf of its customers. Under these contracts the Group is required to perform under an obligationagreement or to make payments to the beneficiary based on third party’s failure to meet its obligations. For these instruments itis not known to the Group in detail if, when and to what extent claims will be made. In the event that the Group has to pay outcash in respect of its fronting commitments, the Group would immediately seek reimbursement from the other syndicate lenders.The Group considers all the above instruments in monitoring the credit exposure and may require collateral to mitigate inherentcredit risk. If the credit risk monitoring provides sufficient perception about a loss from an expected claim, a provision is estab-lished and recorded on the balance sheet.
The following table shows the Group’s irrevocable lending commitments and lending related contingent liabilities without con-sidering collateral or provisions. It shows the maximum potential utilization of the Group in case all these liabilities entered intomust be fulfilled. The table therefore does not show the expected future cash flows from these liabilities as many of them willexpire without being drawn and arising claims will be honored by the customers or can be recovered from proceeds of arrangedcollateral.
in € m. Sep 30, 2017 Dec 31, 2016Irrevocable lending commitments 153,288 166,063Contingent liabilities 46,490 52,341Total 199,779 218,404
Irrevocable payment commitments with regard to levies
Irrevocable payment commitments related to bank levy according to Bank Recovery and Resolution Directive (BRRD), theSingle Resolution Fund (SRF) and the German statutory deposit protection amounted to € 412 million as of September 30, 2017and to € 280 million as of December 31, 2016.
Related Party TransactionsParties are considered to be related if one party has the ability to directly or indirectly control the other party or exercise signifi-cant influence over the other party in making financial or operational decisions. The Group’s related parties include:
key management personnel, close family members of key management personnel and entities which are controlled, signifi-cantly influenced by, or for which significant voting power is held by key management personnel or their close family mem-bers,subsidiaries, joint ventures and associates and their respective subsidiaries, andpost-employment benefit plans for the benefit of Deutsche Bank employees.
Transactions with Key Management Personnel
Key management personnel are those persons having authority and responsibility for planning, directing and controlling theactivities of Deutsche Bank Group, directly or indirectly. The Group considers the members of the Management Board as cur-rently mandated and the Supervisory Board of the parent company to constitute key management personnel for purposes ofIAS 24. Among the Group’s transactions with key management personnel as of September 30, 2017, were loans and commit-ments of € 52 million and deposits of € 10 million. As of December 31, 2016, there were loans and commitments of € 49 millionand deposits of € 7 million among the Group’s transactions with key management personnel. In addition, the Group providesbanking services, such as payment and account services as well as investment advice, to key management personnel and theirclose family members.
101
Deutsche Bank Other Financial Information (unaudited)Interim Report as of September 30, 2017 Related Party Transactions
Transactions with Subsidiaries, Associates and Joint Ventures
Transactions between Deutsche Bank AG and its subsidiaries meet the definition of related party transactions. If these transac-tions are eliminated on consolidation, they are not disclosed as related party transactions. Transactions between the Group andits associated companies and joint ventures and their respective subsidiaries also qualify as related party transactions.
Transactions for subsidiaries, joint ventures and associates are presented combined in below table as these are not materialindividually.
Loans issued and guarantees grantedAssociated companies and
other related partiesin € m. Sep 30, 2017 Dec 31, 2016Loans outstanding, beginning of period 297 396Movement in loans during the period1 (3) (86)Changes in the group of consolidated companies 0 0Exchange rate changes/other (10) (13)Loans outstanding, end of period2 284 297
Other credit risk related transactions:Allowance for loan losses 0 0Provision for loan losses 1 0Guarantees and commitments 45 621 Net impact of loans issued and loans repayment during the year is shown as “Movement in loans during the period”.2 Loans past due were € 0 million as of September 30, 2017 and € 7 million as of December 31, 2016. For the above loans, the Group held collateral of € 14 million and
€ 22 million as of September 30, 2017 and December 31, 2016, respectively.
Deposits receivedAssociated companies and
other related partiesin € m. Sep 30, 2017 Dec 31, 2016Deposits, beginning of period 87 162Movement in deposits during the period1 (17) (74)Changes in the group of consolidated companies (0) 0Exchange rate changes/other (4) (1)Deposits, end of period 65 871 Net impact of deposits received and deposits repaid during the year is shown as “Movement in deposits during the period”.
Other Transactions
Trading assets and positive market values from derivative financial transactions with associated companies amounted to€ 6 million as of September 30, 2017, and € 8 million as of December 31, 2016. Trading liabilities and negative market valuesfrom derivative financial transactions with associated companies were € 0 million as of September 30, 2017, and € 0 million asof December 31, 2016.
Transactions with Pension Plans
The Group has business relationships with a number of its pension plans pursuant to which it provides financial services tothese plans, including investment management. Pension funds may hold or trade Deutsche Bank AG shares or securities. As ofSeptember 30, 2017, transactions with these plans were not material for the Group.

102
Deutsche Bank 3 – Notes to the Consolidated Financial StatementsInterim Report as of September 30, 2017
Non-Current Assets and Disposal Groups Held for SaleWithin the balance sheet, non-current assets and disposal groups held for sale are reported in Other assets and Other liabilities.This note provides further explanation on the nature and the financial impact of the non-current assets and disposal groups heldfor sale as of September 30, 2017.
Non-Current Assets and Disposal Groups Held for Sale at the Reporting Date
Total assets held for sale amounted to € 456 million as of September 30, 2017 (December 31, 2016: € 563 million) and thedisposal groups included liabilities of € 780 million as of September 30, 2017 (December 31, 2016: € 701 million).
As of September 30, 2017, there were no unrealized net gains or losses (December 31, 2016: € 0 million) relating to non-current assets and disposal groups classified as held for sale recognized directly in accumulated other comprehensiveincome (loss).
Sale of Argentine subsidiary Deutsche Bank S.A.
On June 5, 2017, the Group announced the completion of the sale of its Argentine subsidiary Deutsche Bank S.A. to BancoComafi S.A. With outstanding substantial regulatory approvals received in May 2017, the entity had been classified as a dis-posal group held for sale prior to its disposal in June. The disposal resulted in a pre-tax loss on sale of € 190 million, includingthe realization of a currency translation adjustment, which was recorded in the second quarter 2017 and mainly included in C&A.
Events after the Reporting PeriodAfter the reporting date no material events occurred which had a significant impact on our results of operations, financial posi-tion and net assets.

103
Deutsche Bank Review ReportInterim Report as of September 30, 2017
Review Report
To Deutsche Bank Aktiengesellschaft, Frankfurt am Main
We have reviewed the condensed interim consolidated financial statements of Deutsche Bank Aktiengesellschaft, Frankfurt amMain - comprising the consolidated statement of income, consolidated statement of comprehensive income, consolidated bal-ance sheet, consolidated statement of changes in equity, consolidated statement of cash flows and selected explanatory notes- together with the interim group management report of Deutsche Bank Aktiengesellschaft, Frankfurt am Main, for the periodfrom January 1 to September 30, 2017 that are part of the quarterly financial report according to § 37w WpHG ["Wertpapier-handelsgesetz": German Securities Trading Act]. The preparation of the condensed interim consolidated financial statements inaccordance with International Accounting Standard IAS 34 "Interim Financial Reporting" as adopted by the EU and IAS 34“Interim Financial Reporting”, as issued by the International Accounting Standards Board (IASB), and of the interim group man-agement report in accordance with the requirements of the WpHG applicable to interim group management reports, is the re-sponsibility of Deutsche Bank Aktiengesellschaft’s management. Our responsibility is to issue a report on the condensed interimconsolidated financial statements and on the interim group management report based on our review.
We performed our review of the condensed interim consolidated financial statements and the interim group management reportin accordance with the German generally accepted standards for the review of financial statements promulgated by the Institutder Wirtschaftsprüfer (IDW). Those standards require that we plan and perform the review so that we can preclude throughcritical evaluation, with a certain level of assurance, that the condensed interim consolidated financial statements have not beenprepared, in material respects, in accordance with IAS 34, "Interim Financial Reporting" as adopted by the EU and with IAS 34“Interim Financial Reporting”, as issued by the IASB, and that the interim group management report has not been prepared, inmaterial respects, in accordance with the requirements of the WpHG applicable to interim group management reports. A reviewis limited primarily to inquiries of company employees and analytical assessments and therefore does not provide the assur-ance attainable in a financial statement audit. Since, in accordance with our engagement, we have not performed a financialstatement audit, we cannot issue an auditor’s report.
Based on our review, no matters have come to our attention that cause us to presume that the condensed interim consolidatedfinancial statements have not been prepared, in material respects, in accordance with IAS 34, "Interim Financial Reporting" asadopted by the EU and with IAS 34 “Interim Financial Reporting”, as issued by the IASB, or that the interim group managementreport has not been prepared, in material respects, in accordance with the requirements of the WpHG applicable to interimgroup management reports.
Frankfurt am Main (Germany), October 25, 2017
KPMG AGWirtschaftsprüfungsgesellschaft
PukropskiWirtschaftsprüfer
BöthWirtschaftsprüfer

104
Deutsche Bank 5 – Other InformationInterim Report as of September 30, 2017
Other Information (unaudited)
Non-GAAP Financial MeasuresThis document and other documents the Group has published or may publish contain non-GAAP financial measures. Non-GAAP financial measures are measures of the Group’s historical or future performance, financial position or cash flows thatcontain adjustments that exclude or include amounts that are included or excluded, as the case may be, from the most directlycomparable measure calculated and presented in accordance with IFRS in the Group’s financial statements.
Return on Equity Ratios
The Group reports a post-tax return on average shareholders’ equity and a post-tax return on average tangible shareholders’equity, each of which is a non-GAAP financial measure.
The post-tax returns on average shareholders’ equity and average tangible shareholders’ equity are calculated as net income(loss) attributable to Deutsche Bank shareholders as a percentage of average shareholders’ equity and average tangibleshareholders' equity, respectively.
Net income (loss) attributable to Deutsche Bank shareholders is a non-GAAP financial measure and is defined as net income(loss) excluding post-tax income (loss) attributable to noncontrolling interests. For the Group, it reflects the reported effectivetax rate, which was 30 % for the three months ended September 30, 2017 and 55 % for the prior year’s comparative period.The tax rate was 36 % for the nine months ended September 30, 2017 and 67 % for the prior year’s comparative period. Forthe segments, the applied tax rate was 33 % for all reported periods in 2017 and 35 % for the all reported periods in 2016.
At the Group level, tangible shareholders’ equity is shareholders’ equity as reported in the Consolidated Balance Sheet exclud-ing goodwill and other intangible assets. Tangible shareholders´ equity for the segments is calculated by deducting goodwilland other intangible assets from shareholders’ equity as allocated to the segments, as described in the section “Allocation ofAverage Shareholders’ Equity”. Shareholders’ equity and tangible shareholders’ equity are presented on an average basis.
The Group believes that a presentation of average tangible shareholders’ equity makes comparisons to its competitors easier,and refers to this measure in the return on equity ratios presented by the Group. However, average tangible shareholders’equity is not a measure provided for in IFRS, and the Group’s ratios based on this measure should not be compared to othercompanies’ ratios without considering differences in the calculations.
The reconciliation of the aforementioned ratios is set forth in the table below:
Three months ended Sep 30, 2017
in € m.(unless stated otherwise)
Corporate & Investment
Bank
Private & Commercial
Bank
DeutscheAsset
Management
Non-Core Operations
Unit
Consoli- dation &
Adjust-ments
Total Consoli-
datedIncome (loss) before income taxes (IBIT) 361 332 195 - 44 933Income tax expense (284)Net Income (loss) 242 223 131 - 53 649Net income (loss) attributable to noncontrolling interests 0 0 0 - (2) (2)Net Income attributable to DB shareholders and additional equitycomponents 242 223 131 - 51 647
Average shareholders’ equity 45,938 15,057 4,774 - 0 65,769Add (deduct) :Average goodwill and other intangible assets (3,081) (1,998) (3,716) - 24 (8,772)Average tangible shareholders’ equity 42,856 13,058 1,058 - 24 56,997Post-tax return on average shareholders’ equity (in %) 2.1 5.9 10.9 - N/M 3.9Post-tax return on average tangible shareholders’ equity (in %) 2.3 6.8 49.3 - N/M 4.5N/M – Not meaningful

105
Deutsche Bank Other Information (unaudited)Interim Report as of September 30, 2017 Non-GAAP Financial Measures
Three months ended Sep 30, 2016
in € m.(unless stated otherwise)
Corporate & Investment
Bank
Private & Commercial
Bank
DeutscheAsset
Management
Non-Core Operations
Unit
Consoli- dation &
Adjust-ments
Total Consoli-
datedIncome (loss) before income taxes (IBIT) 969 187 215 (538) (215) 619Income tax expense (340)Net Income (loss) 634 122 141 (352) (267) 278Net income (loss) attributable to noncontrolling interests 0 0 0 0 (22) (22)Net Income attributable to DB shareholders and additional equitycomponents 634 122 141 (352) (289) 256
Average shareholders’ equity 40,001 14,375 5,953 1,679 0 62,008Add (deduct) :Average goodwill and other intangible assets (2,846) (1,846) (4,883) (430) 160 (9,846)Average tangible shareholders’ equity 37,155 12,530 1,069 1,248 160 52,162Post-tax return on average shareholders’ equity (in %) 6.3 3.4 9.5 N/M N/M 1.6Post-tax return on average tangible shareholders’ equity (in %) 6.8 3.9 52.7 N/M N/M 2.0N/M – Not meaningful
Nine months ended Sep 30, 2017
in € m.(unless stated otherwise)
Corporate & Investment
Bank
Private & Commercial
Bank
DeutscheAsset
Manage-ment
Non-Core Operations
Unit
Consoli- dation &
Adjust-ments
Total Consoli-
datedIncome (loss) before income taxes (IBIT) 1,610 1,041 610 - (627) 2,633Income tax expense (944)Net Income (loss) 1,079 698 409 - (495) 1,689Net income (loss) attributable to noncontrolling interests 0 0 0 - (25) (25)Net Income attributable to DB shareholders and additional equitycomponents 1,079 698 409 - (521) 1,664
Average shareholders’ equity 43,759 14,793 4,944 - 127 63,623Add (deduct) :Average goodwill and other intangible assets (3,069) (2,003) (3,933) - 118 (8,887)Average tangible shareholders’ equity 40,690 12,790 1,011 - 245 54,736Post-tax return on average shareholders’ equity (in %) 3.3 6.3 11.0 - N/M 3.5Post-tax return on average tangible shareholders’ equity (in %) 3.5 7.3 53.9 - N/M 4.1N/M – Not meaningful
Nine months ended Sep 30, 2016
in € m.(unless stated otherwise)
Corporate & Investment
Bank
Private & Commercial
Bank
DeutscheAsset
Manage-ment
Non-Core Operations
Unit
Consoli- dation &
Adjust-ments
Total Consoli-
datedIncome (loss) before income taxes (IBIT) 2,138 739 547 (1,703) (116) 1,606Income tax expense (1,071)Net Income (loss) 1,398 483 358 (1,113) (591) 534Net income (loss) attributable to noncontrolling interests 0 0 0 0 (47) (47)Net Income attributable to DB shareholders and additional equitycomponents 1,398 483 358 (1,113) (638) 488
Average shareholders’ equity 40,447 13,950 6,078 1,805 13 62,292Add (deduct) :Average goodwill and other intangible assets (2,691) (1,906) (4,995) (408) 27 (9,973)Average tangible shareholders’ equity 37,756 12,044 1,083 1,396 40 52,319Post-tax return on average shareholders’ equity (in %) 4.6 4.6 7.8 N/M N/M 1.0Post-tax return on average tangible shareholders’ equity (in %) 4.9 5.4 44.0 N/M N/M 1.2N/M – Not meaningful

106
Deutsche Bank 5 – Other InformationInterim Report as of September 30, 2017
Adjusted Costs
Adjusted costs is one of the key performance indicators and is a non-GAAP financial measure most directly comparable to theIFRS financial measure noninterest expenses. Adjusted costs is calculated by adjusting noninterest expenses under IFRS for (i)impairment of goodwill and other intangible assets, (ii) litigation, (iii) policyholder benefits and claims and (iv) restructuring andseverance. Policyholder benefits and claims arose from the Abbey Life Assurance business which was sold in late 2016 and sowill not occur in future periods. The Group believes that a presentation of noninterest expenses excluding the impact of theseitems provides a more meaningful depiction of the costs associated with our operating businesses.
Three months ended Sep 30, 2017
in € m.
Corporate & Investment
Bank
Private & Commercial
Bank
DeutscheAsset
Manage-ment
Non-Core Operations
Unit
Consoli- dation &
Adjust-ments
Total Consoli-
datedNoninterest expenses 3,011 2,179 433 - 37 5,660Impairment of goodwill and other intangible assets 0 0 0 - 0 0Litigation 93 11 1 - 34 140Policyholder benefits and claims 0 0 0 - 0 0Restructuring and severance 10 (3) (0) - (1) 7Adjusted costs 2,908 2,170 432 - 4 5,513
Three months ended Sep 30, 2016
in € m.
Corporate & Investment
Bank
Private & Commercial
Bank
DeutscheAsset
Manage-ment
Non-Core Operations
Unit
Consoli- dation &
Adjust-ments
Total Consoli-
datedNoninterest expenses 3,333 2,231 606 330 47 6,547Impairment of goodwill and other intangible assets 0 0 0 (49) 0 (49)Litigation 342 (4) (0) 163 (0) 501Policyholder benefits and claims 0 0 167 0 0 167Restructuring and severance 66 (15) 9 1 14 76Adjusted costs 2,924 2,249 430 215 34 5,852
Nine months ended Sep 30, 2017
in € m.
Corporate & Investment
Bank
Private & Commercial
Bank
DeutscheAsset
Manage-ment
Non-Core Operations
Unit
Consoli- dation &
Adjust-ments
Total Consoli-
datedNoninterest expenses 9,653 6,634 1,300 - 122 17,708Impairment of goodwill and other intangible assets 6 0 0 - 0 6Litigation (12) 56 1 - 38 82Policyholder benefits and claims 0 0 0 - 0 0Restructuring and severance 151 (30) 8 - 2 131Adjusted costs 9,508 6,608 1,291 - 82 17,489
Nine months ended Sep 30, 2016
in € m.
Corporate & Investment
Bank
Private & Commercial
Bank
DeutscheAsset
Manage-ment
Non-Core Operations
Unit
Consoli- dation &
Adjust-ments
Total Consoli-
datedNoninterest expenses 10,795 6,865 1,669 1,083 39 20,450Impairment of goodwill and other intangible assets 285 0 0 (49) 0 236Litigation 416 59 1 401 (67) 809Policyholder benefits and claims 0 0 285 0 0 285Restructuring and severance 360 126 67 9 6 568Adjusted costs 9,734 6,679 1,316 723 100 18,552

107
Deutsche Bank Other Information (unaudited)Interim Report as of September 30, 2017 Non-GAAP Financial Measures
Book Value and Tangible Book Value per Basic Share Outstanding
Book value per basic share outstanding and tangible book value per basic share outstanding are non-GAAP financialmeasures that are used and relied upon by investors and industry analysts as capital adequacy metrics. Book value per basicshare outstanding represents the Bank’s total shareholders’ equity divided by the number of basic shares outstanding at peri-od-end. Tangible book value represents the Bank’s total shareholders’ equity less goodwill and other intangible assets. Tangi-ble book value per basic share outstanding is computed by dividing tangible book value by period-end basic sharesoutstanding.
Tangible Book Valuein € m. Sep 30, 2017 Dec 31, 2016Total shareholders’ equity (Book value) 65,676 59,833Goodwill and other intangible assets (8,773) (8,982)Tangible shareholders’ equity (Tangible book value) 56,903 50,851
Basic Shares Outstandingin million(unless stated otherwise) Sep 30, 2017 Dec 31, 20161
Number of shares issued 2,066.8 1,545.5Treasury shares (0.6) (0.2)Vested share awards 27.5 23.3Basic shares outstanding 2,093.7 1,568.6
Book value per basic share outstanding in € 31.37 38.14Tangible book value per basic share outstanding in € 27.18 32.421 All figures have been adjusted for December 31, 2016 in order to reflect the effect of the bonus component of subscription rights issued in April 2017 in connection with the
capital increase.
Fully loaded CRR/CRD 4 Measures
Our regulatory assets, exposures, risk-weighted assets, capital and ratios thereof are calculated for regulatory purposes andare set forth throughout this document under CRR/CRD 4. CRR/CRD 4 provides for “transitional” (or “phase-in”) rules, underwhich capital instruments that are no longer eligible under the new rules are permitted to be phased out as the new rules onregulatory adjustments are phased in, as well as regarding the risk weighting of certain categories of assets. In some cases,CRR/CRD 4 maintains transitional rules that had been adopted in earlier capital adequacy frameworks through Basel 2 orBasel 2.5. The transitional rules relate, e.g., to the risk weighting of certain categories of assets. Unless otherwise noted, ourCRR/CRD 4 solvency measures as of September, 30 2017 and December 31, 2016 set forth in this document reflect thesetransitional rules.
We also set forth in this document such CRR/CRD 4 measures on a “fully loaded” basis, reflecting full application of the finalCRR/CRD 4 framework without consideration of the transitional provisions under CRR/CRD 4, except as described below.
The transitional rules include rules permitting the grandfathering of equity investments at a risk-weight of 100 % instead of arisk weight between 190 % and 370 % determined based on Article 155 CRR that would apply under the CRR/CRD 4 fullyloaded rules. Despite the grandfathering rule for equity investments not applying under the full application of the finalCRR/CRD 4 framework, we continue to apply it in our CRR/CRD 4 fully loaded methodology for a limited subset of equitypositions, based on our intention to mitigate the impact of the expiration of the grandfathering rule through sales of the underly-ing assets or other measures prior to its expiration at end of 2017. We are closely monitoring the market and potential impactsfrom illiquid markets or other similar difficulties which could delay or make it unfeasible to exit all positions by end of 2017.Starting in the fourth quarter 2017 we will apply a risk weight between 190 % and 370 % determined based on Article 155 CRRunder the CRR/CRD 4 fully loaded rules to all our equity positions.
As of September 30, 2017, our portfolio of transactions for which we applied the equity investment grandfathering rule in calcu-lating our fully loaded RWA consisted of 9 transactions amounting to € 153 million in exposures. Had we not applied the grand-fathering rule for these transactions, their fully loaded RWA would have been no more than € 567 million, and thus our Groupfully loaded RWA would have been no more than € 355.5 billion as of September 30, 2017, rather than the Group fully loadedRWA of € 355.1 billion that we reported on a fully loaded basis with application of the grandfathering rule. Also, had we calcu-lated our fully loaded CET 1 capital ratio, Tier 1 capital ratio and Total capital ratio using fully loaded RWAs without applicationof the grandfathering rule, such capital ratios would have remained unchanged (due to rounding) at 13.8 %, 15.1 % and 18.4 %,respectively, that we reported on a fully loaded basis with application of the grandfathering rule.

108
Deutsche Bank 5 – Other InformationInterim Report as of September 30, 2017
As of December 31, 2016, our portfolio of transactions for which we applied the equity investment grandfathering rule in calcu-lating our fully loaded RWA consisted of 15 transactions amounting to € 220 million in exposures. Had we not applied thegrandfathering rule for these transactions, their fully loaded RWA would have been no more than € 816 million, and thus ourGroup fully loaded RWA would have been no more than € 358.1 billion as of December 31, 2016, rather than the Group fullyloaded RWA of € 357.5 billion that we reported on a fully loaded basis with application of the grandfathering rule. Also, had wecalculated our fully loaded CET 1 capital ratio, Tier 1 capital ratio and Total capital ratio as of December 31, 2016 using fullyloaded RWAs without application of the grandfathering rule, such capital ratios would have remained unchanged (due torounding) at 11.8 %, 13.1 % and 16.6 %, respectively, that we reported on a fully loaded basis with application of the grandfa-thering rule.
As the final implementation of CRR/CRD 4 may differ from our expectations, and our competitors’ assumptions and estimatesregarding such implementation may vary, our fully loaded CRR/CRD 4 measures may not be comparable with similarly labeledmeasures used by our competitors.
We believe that these fully loaded CRR/CRD 4 calculations provide useful information to investors as they reflect our progressagainst the new regulatory capital standards and as many of our competitors have been describing CRR/CRD 4 calculationson a fully loaded basis.
For descriptions of these fully loaded CRR/CRD 4 measures and the differences from the most directly comparable measuresunder the CRR/CRD 4 transitional rules, please refer to “Management Report: Risk Report: Risk and Capital Performance:Capital and Leverage Ratio”.
109
Deutsche Bank ImprintInterim Report as of September 30, 2017
Imprint
Deutsche Bank AktiengesellschaftTaunusanlage 1260262 Frankfurt am MainGermanyTelephone: +49 69 9 10 [email protected]
Investor Relations:+49 69 9 10-3 80 [email protected]
PublicationPublished on October 26, 2017
Cautionary statement regarding forward-lookingstatements
This report contains forward-looking statements.Forward-looking statements are statements thatare not historical facts; they include statementsabout our beliefs and expectations and theassumptions underlying them. These statementsare based on plans, estimates and projections asthey are currently available to the managementof Deutsche Bank. Forward-looking statementstherefore speak only as of the date they aremade, and we undertake no obligation to updatepublicly any of them in light of new information orfuture events.
By their very nature, forward-looking statementsinvolve risks and uncertainties. A number ofimportant factors could therefore cause actualresults to differ materially from those contained inany forward-looking statement. Such factorsinclude the conditions in the financial markets inGermany, in Europe, in the United States andelsewhere from which we derive a substantialportion of our revenues and in which we hold asubstantial portion of our assets, the develop-ment of asset prices and market volatility, poten-tial defaults of borrowers or tradingcounterparties, the implementation of our strate-gic initiatives, the reliability of our risk manage-ment policies, procedures and methods, andother risks referenced in our filings with the U.S.Securities and Exchange Commission. Suchfactors are described in detail in our SEC Form20-F of March 20, 2017 under the heading “RiskFactors”.

2018 Financial Calendar
February 2, 2018Preliminary results for the 2017 financial year
March 16, 2018Annual Report 2017 and Form 20-F
April 26, 2018Interim Report as of March 31, 2018
May 24, 2018Annual General Meeting in the Festhalle Frankfurt am Main (Exhibition Center)
May 29, 2018Dividend payment (incaseofadistributableprofit and the decision of the AGM to pay a dividend)
July 26, 2018Interim Report as of June 30, 2018
October 25, 2018Interim Report as of September 30, 2018