INTERIM REPORT 2017 Q2 - Microsoft... · Gazelle Company. A SHORT HISTORY ... ZINZINO INTERIM...
12
INTERIM REPORT 2017 I Q2
Transcript of INTERIM REPORT 2017 Q2 - Microsoft... · Gazelle Company. A SHORT HISTORY ... ZINZINO INTERIM...

INTERIM REPORT 2017 I Q2

3
THIS IS ZINZINOZinzino AB (publ.) is a direct sales company that operates in Europe and North America. Zinzino markets and sells products in two product lines: Zinzino Health, with a focus on long-term health, and Zinzino Coffee, consisting of espresso machines, coffee and tea.
Zinzino owns the Norwegian research company BioActive Foods AS and the production unit Faun Pharma AS. Zinzino has more than 120 employees. The company has its headquarters in Gothenburg, and offices in Helsinki, Riga and Oslo, and in Florida, United States. Zinzino is a publicly-held limited liability company and its shares are listed on Nasdaq First North.
Zinzino was designated in 2016 both as one of Veckans Affärer’s “Super Companies” and as Dagens Industri’s Gazelle Company.
A SHORT HISTORY 2007 - Zinzino AB was started. The company’s principal business is to own and develop companies in direct sales and related businesses.
2009 - Zinzino Nordic AB was acquired, partly through a directed issuance in kind to the owners of Zinzino Nordic AB and partly through a subscription for shares in the preference issuance Zinzino Nordic AB carried out in December 2009. Through this Zinzino AB acquired control over 97% of the votes and 92% of the capital of Nordic AB. By 31 December 2015 the ownership share had increased to 93% of the capital.
2010 - Zinzino shares were listed for trading on the Aktiegtorget stock market.
2011 - The group was expanded with companies in Estonia and Lithuania.
2012 - Companies were started in Latvia and on Iceland.
2013 - A company was started in the United States with its head quarters in Jupiter, Florida.
2014 - The group was further expanded by companies in Poland and Holland. The same year Zinzino AB acquired the remaining shares in BioActive Foods AS and 85% of the shares in Faun Pharma AS. This was also the year when Zinzino AB was listed for trading on Nasdaq OMX First North.
2015 - A company was started in Canada and the ownership share in Faun Pharma AS was increased to 98.8%.
2016 - A subsidiary was started in Germany. - Sales were opened in all of the EU countries.
THE GROUP’S KEY RATIOS Q2 - 2017 Q2 - 2016 CUM. 2017 CUM. 2016 FULL YEAR 2016
Total revenues 137.3 107.0 265.5 216.8 492.3
Net turnover 125.0 97.7 242.8 199.3 436.4
Sales growth 28% 0% 22% 1% 11%
Gross profit 37.2 33.6 76.2 72.0 167.2
Gross profit margin 27.1% 31.4% 28.7% 33.2% 34.0%
Operating profit before depreciation and amortisation
1.6 4.6 7.3 12.8 23.0
Operating margin before depreciation and amortisation
1.2% 4.3% 2.8% 5,9% 4.7%
Operating profit -0.7 2.3 2.8 8.3 14.0
Operating margin -0.5% 2.2% 1.1% 3.8% 2.8%
Profit before tax -0.7 2.3 2.7 8.0 13.9
Net profit -1.0 0.9 0.9 5.2 9.7
Net margin -0.8% 0.8% 0.3% 2.4% 2.0%
Net profit per share after tax before dilution, SEK
-0.03 0.03 0.03 0.17 0.31
Net profit per share after tax at full dilution, SEK
-0.03 0.03 0.03 0.15 0.29
Liquid assets 26.6 24.0 26.6 24.0 23.3
Equity/assets ratio 48% 50% 48% 50% 50%
Equity capital per share before dilution, SEK
2.51 2.63 2.51 2.64 2.82
Number of issued shares on average for the period
32,580,025 31,017,416 32,580,025 30,958,541 31,359,861
Number of issued shares on average for the period with full dilution
33,984,326 33,780,025 33,883,850 33,780,025 33,780,025
FINANCIAL SUMMARY (SEK MILLION)*
QUARTER IN REVIEW • Total revenues increased by 28% (0%) to SEK 137.3 (107.0) million.
• Zinzino’s production unit Faun Pharma AS increased its external sales by 158% to SEK 19.9 (7.7) million.
• The product segment Health increased by 25% to SEK 93.3 (74.7) million.
• Completed web projects provide greater digital exposure.
• Beginning of sales in Switzerland.
• The launch of the newly developed dietary supplement Viva provides a new dimension in health.
ZINZINO INTERIM REPORT 2017 I Q2
The board of directors of Zinzino maintains its forecast that the total revenues in 2017 will be SEK 540 - 580 million. Operating margin before depreciation as a percentage is estimated to be on par with last year. The target for average growth in sales in Zinzino for the
period 2017-2019 is a minimum of 20% and for the operating margin before depreciation to increase to > 6%. The dividend policy is at least 50% of the net profit, liquidity and equity/assets ratio permitting.
FINANCIAL GOALS AND ZINZINO’S OUTLOOK FOR 2017
*Comparison ratios adjusted to take into consideration new accounting principles relating to currency-related revenues and costs
HALF-YEAR IN REVIEW • Total revenues increased by 22% (1%) to SEK 265.5 (216.8) million.
• Zinzino’s production unit Faun Pharma AS increased its external sales by 115% to SEK 36.9 (17.2) million.
• The product segment Health increased by 21% to SEK 182.5 (151.2) million.
• Cash and cash equivalents on reporting date amounted to SEK 26.6 (24.0) million.
ZINZINO AB I Q1 REPORT 20172

5
AN INTENSIVE QUARTER The second quarter was a very labour-intensive quarter. Many projects were completed and we can report a strong growth that we are satisfied with.
As already announced, with a new web shop, new products and new markets, we will grow quickly in the future. An efficient organisation and production will make profitability grow in line with the growth we anticipate of at least 20% per year during the coming years.
Q2 was a satisfying quarter in terms of growth and project focus, but we are not satisfied with the fact that we used more money on growth than planned during the quarter and consequently did not make money.
We invested a great deal of time and resources in the digital shift at the same time that it was necessary to invest in marketing with new commercials and campaigns to maintain growth. The digital tool now works well, which creates a good foundation for growth without extra marketing. We will reduce selected costs in the current quarter, and our margins will improve in the upcoming quarter and for the full year.
SCALABLE BUSINESS MODEL AND EFFICIENCY ENHANCEMENTSIn the annual report, we explained how we will use our scalable business model and that Zinzino will double its sales from half a billion SEK to one billion SEK at the end of 2020. We will potentially reach one billion customers in the markets we have opened, we have world-leading health products, we distribute our products efficiently through our direct sales concept, we ourselves develop and produce at our production unit Faun and we will open new, interesting markets. All of this means that we view our growth target of 20% positively.
In that time, we will more than double our net margin in percent as a result of our having invested in new technology which both simplifies and makes more efficient more processes in support, finance, logistics, IT and sales. This means that we will invest less and employ fewer in relative terms per increased SEK. We are also going to reduce costs both in production and in the purchase of products and services when the volumes increase. We continue to regularly improve our processes, become more efficient and use our economies of scale, which will in turn lead to profitable growth. Such a scalable business model is very interesting and inspiring for our partners, employees and shareholders.
Dag Bergheim PettersenWe aspire to inspire a change in people’s life
A STRONG GROWTH OF 28% AND LAUNCH OF A NEW DIGITAL PLATFORMThe most important launch during the quarter is primarily our new digital platform, including a new web shop, for customers and distributors. The platform is one of the largest reasons that we will grow strongly in the future. We also launched the new product Viva and we established operations in Switzerland. We also conducted a project for more efficient deliveries to customers and distributors and launched two new commercials in social media to increase awareness of our brand. Altogether, these projects and launches give us the chance to focus on efficiency and improved profitability. And this ultimately means growth for us.
“The second quarter was a very labour-intensive quarter. Many projects were completed and we can report a strong growth that we are satisfied with”.
4 ZINZINO AB I INTERIM REPORT 2017 I Q2
7
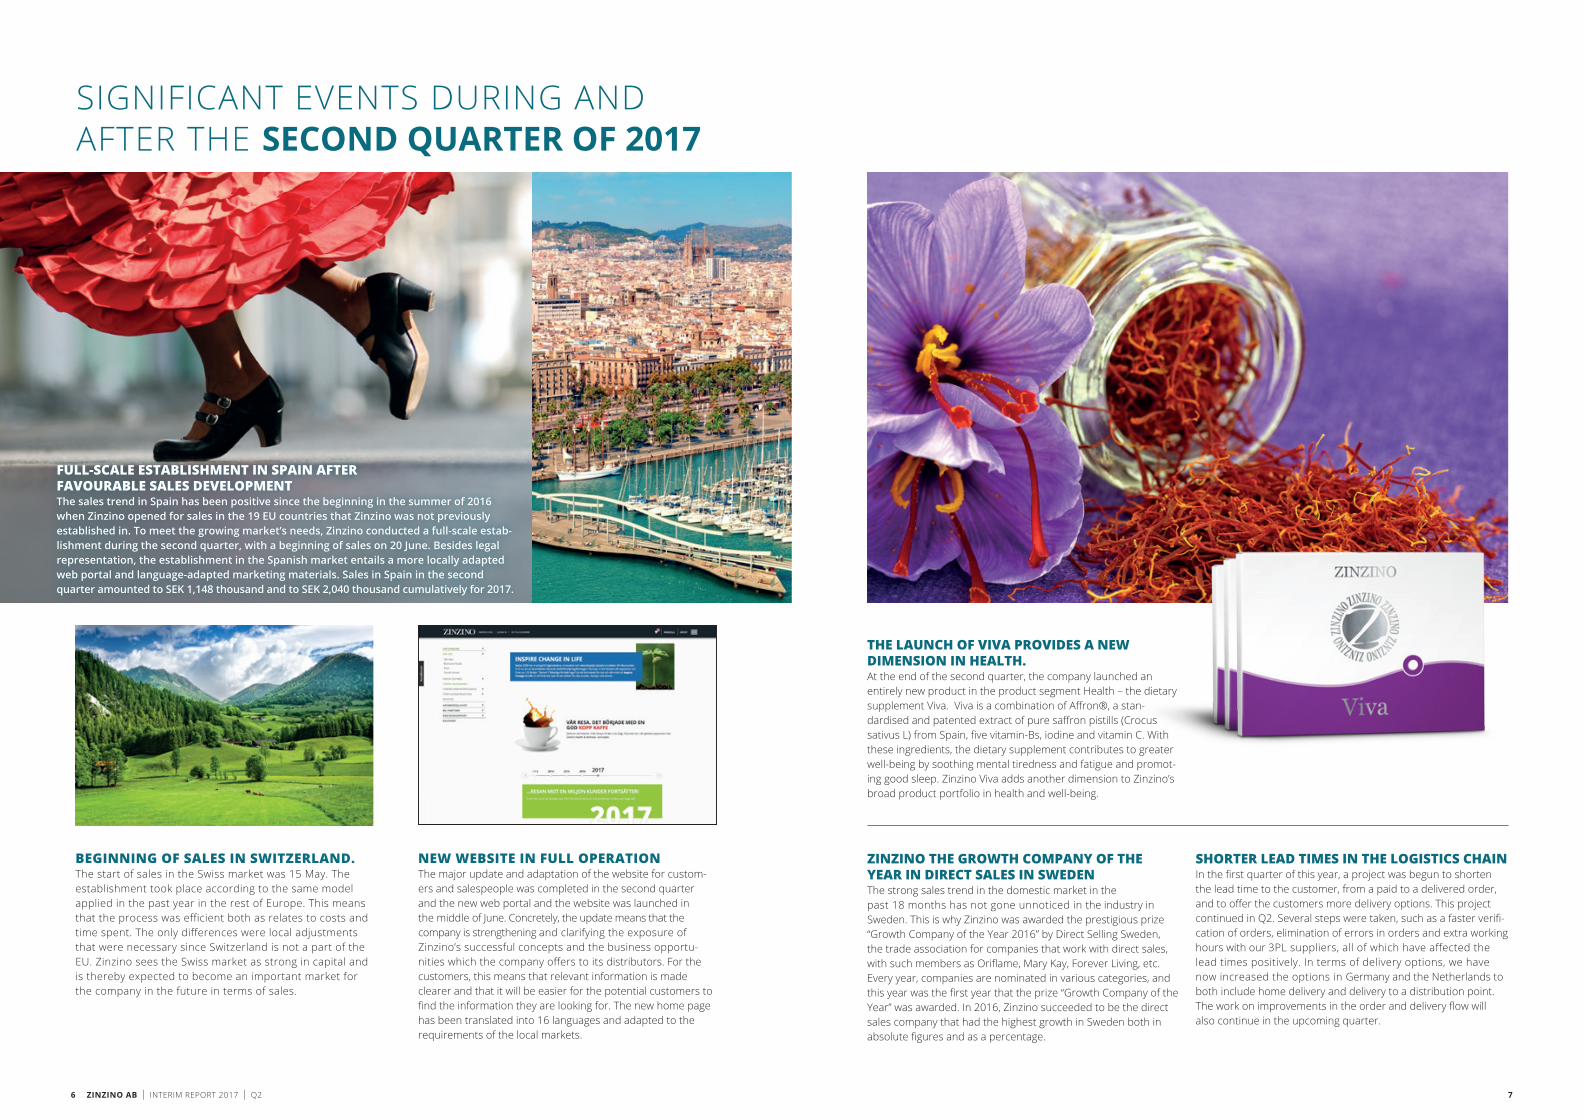
THE LAUNCH OF VIVA PROVIDES A NEW DIMENSION IN HEALTH. At the end of the second quarter, the company launched an entirely new product in the product segment Health – the dietary supplement Viva. Viva is a combination of Affron®, a stan-dardised and patented extract of pure saffron pistills (Crocus sativus L) from Spain, five vitamin-Bs, iodine and vitamin C. With these ingredients, the dietary supplement contributes to greater well-being by soothing mental tiredness and fatigue and promot-ing good sleep. Zinzino Viva adds another dimension to Zinzino’s broad product portfolio in health and well-being.
ZINZINO THE GROWTH COMPANY OF THE YEAR IN DIRECT SALES IN SWEDEN The strong sales trend in the domestic market in the past 18 months has not gone unnoticed in the industry in Sweden. This is why Zinzino was awarded the prestigious prize “Growth Company of the Year 2016” by Direct Selling Sweden, the trade association for companies that work with direct sales, with such members as Oriflame, Mary Kay, Forever Living, etc. Every year, companies are nominated in various categories, and this year was the first year that the prize “Growth Company of the Year” was awarded. In 2016, Zinzino succeeded to be the direct sales company that had the highest growth in Sweden both in absolute figures and as a percentage.
SHORTER LEAD TIMES IN THE LOGISTICS CHAIN In the first quarter of this year, a project was begun to shorten the lead time to the customer, from a paid to a delivered order, and to offer the customers more delivery options. This project continued in Q2. Several steps were taken, such as a faster verifi-cation of orders, elimination of errors in orders and extra working hours with our 3PL suppliers, all of which have affected the lead times positively. In terms of delivery options, we have now increased the options in Germany and the Netherlands to both include home delivery and delivery to a distribution point. The work on improvements in the order and delivery flow will also continue in the upcoming quarter.
SIGNIFICANT EVENTS DURING AND AFTER THE SECOND QUARTER OF 2017
NEW WEBSITE IN FULL OPERATIONThe major update and adaptation of the website for custom-ers and salespeople was completed in the second quarter and the new web portal and the website was launched in the middle of June. Concretely, the update means that the company is strengthening and clarifying the exposure of Zinzino’s successful concepts and the business opportu-nities which the company offers to its distributors. For the customers, this means that relevant information is made clearer and that it will be easier for the potential customers to find the information they are looking for. The new home page has been translated into 16 languages and adapted to the requirements of the local markets.
BEGINNING OF SALES IN SWITZERLAND.The start of sales in the Swiss market was 15 May. The establishment took place according to the same model applied in the past year in the rest of Europe. This means that the process was efficient both as relates to costs and time spent. The only differences were local adjustments that were necessary since Switzerland is not a part of the EU. Zinzino sees the Swiss market as strong in capital and is thereby expected to become an important market for the company in the future in terms of sales.
SPAIN PIC-TURE?
FULL-SCALE ESTABLISHMENT IN SPAIN AFTER FAVOURABLE SALES DEVELOPMENTThe sales trend in Spain has been positive since the beginning in the summer of 2016 when Zinzino opened for sales in the 19 EU countries that Zinzino was not previously established in. To meet the growing market’s needs, Zinzino conducted a full-scale estab-lishment during the second quarter, with a beginning of sales on 20 June. Besides legal representation, the establishment in the Spanish market entails a more locally adapted web portal and language-adapted marketing materials. Sales in Spain in the second quarter amounted to SEK 1,148 thousand and to SEK 2,040 thousand cumulatively for 2017.
6 ZINZINO AB I INTERIM REPORT 2017 I Q2

9
SALES AND PROFITS 2017 I Q2THE SECOND QUARTER – SALESIn total, revenues for the quarter were SEK 137.3 (107.0) million which corresponds to a growth of 28% (0%) as compared to the prior year. Both the Swedish and Finnish market grew strongly in the second quarter as well, where the revenues were 50% and 34%, respectively, higher than the second quarter of 2016. There was also growth in Norway where the revenues increased by 3% over the year-before period.
The Danish market has shown strong growth for a long time. After the decrease in sales in the previous quarter, growth returned in the second quarter, at 2% over the second quarter of 2016.
Among the market newly established in 2016, the sales growth was strongest in Germany, which increased by 53%, although this is compared with a period of modest sales last year. Germany is one of the world’s larges direct sales markets and Zinzino sees great potential to grow the market share in the country.
Spain and Austria also showed strong sales growth of 29% and 9%, respectively. Comparing Q2 to Q1, the sales increases were SEK 1.1 million and SEK 0.8 million, respectively. There are also signs that the large countries by population are at the starting phase of generating good growth in the Group in the next few years.
With a new web portal and website, tailored for the North American market, in operation since mid-June, Zinzino has strong hopes of turning the temporarily downward trend for North America. During the quarter, the USA and Canada showed a negative sales growth of 5%.
Zinzino is actively working to increase the number of distributors and customers in North America by cultivating the market with campaigns and events for the sales force.
The sales situation in the Baltic countries improved slightly in the second quarter where the revenues rose by a full 53% in Lithuania and 20% in Latvia, both compared with the second quarter of last year. At the same time, the trend of decreasing sales continued in Estonia where the revenues declined by 38% compared with the second quarter of last year. Zinzino believes that the bottom has been reached in Estonia and that the market is expected to stabilise in the upcoming quarters. As communicated earlier, the Estonian cus-tomer and distributor organisation was perhaps struck hardest by the effects of the IT system’s replacement that the Group made in the past two years.
The Icelandic market has also been affected negatively over an extended period by the consequences of the IT system change that resulted in declining sales figures. In the second quarter, the slowdown of the sales decline continued as the revenues were only 8% lower than the corresponding period in the previous quarter. With the new payment solution and collection management combined with the new locally adapted web solution for customers and distributors, Zinzino believes the sales decrease will turn to growth in the third quarter of 2017.
The production unit Faun Pharma AS also strongly increased its external sales during the second quarter and growth was a full 158% as compared to the corre-sponding period in the prior year.The growth is mainly attributable to high-volume production for the key customer ProteinFabrikken.
Zinzino has great expectations of continuing to increase the group’s revenues for a long time to come, which the communicated goal of 20% average sales growth in the period 2017-2019 confirms.
The geographic distribution shows that the largest part of the revenues, as before, will come from the Nordic countries. Sweden continued to increase its share of the total sales and was, after Norway, the second larg-est market. The Finnish market also strongly increased it’s share of total shares.
The product segment Zinzino Health increased by 25% to SEK 93.3 (74.7) million and accounted for 68% (70%) of the total revenues. The decline continued in the segment Coffee, which decreased by 24% to SEK 11.5 (15.3) million, which corresponded to 9% (14%) of the total revenues. Faun Pharma AS increased its external sales by 158% to SEK 19.9 (7.7) million, which corre-sponded to 14% (7%) of the total revenues. Other reve-nues were SEK 12.4 (9.3) million which corresponded to the remaining 9% (7%) of the revenues for the quarter.
Zinzino has made a major change in the product mix in recent years and the principal revenues are now in the area health. The market for health products and a greater focus on health trends around the world create good growth in this segment, which is of interest to Zinzino to be in.
In the second quarter, Zinzino sold more than 185,000 (148,000) bottles of Balance Oil Orange/Lemon/Mint, which was another record. The Health segment’s other products are also very popular as interest in greater well-being reaches more and more people. The products that stood out through continuously increasing sales were Zinzino Skin Serum, which increased to 24,000 sold units during the quarter, and Zinzino’s protein bars, launched in October 2016, which had a steady sales growth of 40% per month on average and which the company sold 31,394 units of in Q2 2017. Zinzino also saw a sales increase of the Leanshake segment of 28% compared with Q2 2016 and sold 28,516 (22,257) units in Q2 2017. The product has been given a new packaging in that Zinzino introduced the new 960 gr zip bag and portion package. These steps increase the product’s area of use and make it easier for the customer to live a healthy life.
Within Zinzino’s Coffee segment, Zinzino French Espresso was the most popular coffee yet again, with 34,000 sold units in Q2. In Q2 2017, we sold 189,700 (243,200) units, which meant a sales decrease of 22% compared with 2016. The sale of coffee makers was a total of 869 (1,234) units, which was a sales decrease of 30% for the quarter compared with 2016.
Q2 Q2
0
20
40
60
80
100
120
140
160
2013 Q2
2014 Q2
2015 Q2
2016 Q2
2017 Q2
0%
5%
10%
15%
20%
25%
30%
35%
40%MKR
Total revenues Gross profit Gross profit margin
Revenues
Growth per market 2017 versus 2016
Geographic distribution of sales
Sweden 20,3%
Norway 22,5%
Finland 18,7%
Denmark+Faroe Islands 14,5%
Iceland 3,5%
The Baltic States 8,2%
USA/Canada 5,5%
Holland 0,8% Poland 0,3%Germany 2,6%
Switzerland 0,1%EU 2,9%
Sales
MSEK 137.3 (107.0)
(2017; 93,3 (74,7) Mkr)
(2017; 19,9 (7,7) Mkr)
(2017; 11,7 (15,3) Mkr)
(2017; 12,4 (9,3) Mkr)
68%
14%
9%
9%
(2017; 93,3 (74,7) Mkr)
(2017; 19,9 (7,7) Mkr)
(2017; 11,7 (15,3) Mkr)
(2017; 12,4 (9,3) Mkr)
68%
14%
9%
9%
(2017; 93,3 (74,7) Mkr)
(2017; 19,9 (7,7) Mkr)
(2017; 11,7 (15,3) Mkr)
(2017; 12,4 (9,3) Mkr)
68%
14%
9%
9%
(2017; 93,3 (74,7) Mkr)
(2017; 19,9 (7,7) Mkr)
(2017; 11,7 (15,3) Mkr)
(2017; 12,4 (9,3) Mkr)
68%
14%
9%
9%
OTHER REVENUES FAUN
COFFEEHEALTH
THE SECOND QUARTER – COSTS AND PROFIT The gross profit for the second quarter was SEK 37.2 (33.6) million and the gross profit margin was 27.1% (31.4%). Two causes were mainly behind the margin decrease. High remuneration levels in the new recruitment of distributors and market establishments have driven growth, but degraded the gross margins. In Q3-Q4, Zinzino believes that the remuneration levels will normalise and that the gross margin will thereby improve again. This combined with the Faun Pharmas AS sales mix to external customers largely consisted of high-volume productions in the second quarter as well, which also affects the gross margin level during the quarter.
EBITDA for the second quarter amounted to SEK 1.6 (4.6) million and the operating margin before depreci-ation and amortisation amounted to 1.2% (4.3%). The operating loss was SEK 0.7 (profit: 2.3) million and the operating margin was neg (2.2%). The decline in profit was primarily linked to worsened profitability at the gross level. In addition, the invest-ments in systems, web pages and marketing measures were at a high level during the quarter, something which will be lowered to a normal level during the coming quarter.
The loss before tax for the quarter was SEK 0.7 (profit: 2.3) million and the net loss was SEK 1.0 (profit: 0.9) million.
DEPRECIATION AND AMORTISATIONDepreciation and amortisation for the quarter has negatively affected the profit for the period by SEK 2,273 (2,231) thousand of which SEK 209 (96) thousand was depreciation of tangible fixed assets, SEK 838 (909) thousand was amortisation of intangible fixed assets, and SEK 1,226 (1,226) thousand was amortisation of goodwill.
50%
3%
34%
3%
-7% -2% -5%
4%
-45%
53%
-70%
-50%
-30%
-10%
10%
30%
50%
70%
Sweden Norway Finland Denmark+Faroe Islands
Iceland The Baltic States
USA/Canada Holland Poland Germany
Tillväxt per marknad Q2 2017 vs 2016
8 ZINZINO AB I INTERIM REPORT 2017 I Q2

THE GROUP’S POSITION AND PERFORMANCE AS OF THE FIRST HALF OF THE YEAR 2017 IN Q1 + Q2
THE GROUP’S POSITION AND PERFORMANCE AS OF THE FIRST HALF OF THE YEAR 2016 SALESIn total, revenues for the quarter were SEK 265.5 (216.8) million which corresponds to a growth of 22% (1%) as compared to the prior year.
In the first half of the year, the Swedish market had the best growth together with the relatively recently established German market. Strong growth in the Finnish market as well and some growth in Zinzino’s largest market Norway and in the Netherlands. As pre-viously described, many of the recently established markets are advancing with the largest growth in Spain, Austria and Romania. North America has had a negative growth. The Baltic countries are also declining due to the Estonian market’s decline, but there was growth in both Latvia and Lithuania. Very weak growth in Poland, but this is from already low sales levels.
The Nordic markets accounted for nearly 80% of the sales (not including Faun Pharma AS) Norway continued to be the largest market followed by Sweden, Finland and Denmark. The recently established markets continue to take a growing share of the total sales.
The product segment Health increased by 21% to SEK 182.5 (151.2) million, which represented 69% (70%) of the total revenues. The product segment of Coffee amounted to SEK 23.2 (30.8) million and decreased 25% and contributed 9% (14%) of the total revenues. Faun Pharma increased by 115% to SEK 36.9 (17.2) million, which represented 14% (8%) of total revenues. Shipping and other revenues amounted to SEK 22.9 (17.6) million which represented the remaining 8% (8%) of the revenues.
In addition, the revenue analysis shows that more than 360,000 (240,000) bottles of Balance Oil Orange/Lemon/Mint were sold in the first half of 2017 compared with the previous year. In total, 471,000 (415,000) bottles of Balance Oil of various flavours were sold compared with the preceding year. As the Health segment grew in sales by 21% compared with 2016, this reflects a clear trend that consumption for better health and well-being is growing worldwide.
Among the other products in Zinzino Health, Zinzino Skin Serum is growing the most where 39,000 bottles were delivered in the first half of the year; since the launch of the product in October 2016, the company has sent out more than 54,000 bottles. Zinzino Bars are also growing and sales amounted to 44,000 bars in the first half of the year. Zinzino Bars are also a product launched in October and sales increased an average of 40% per month since the beginning.
Zinzino also saw a sales increase of the Leanshake seg-ment of 22% compared with the same period in 2016 and sold 55,205 (45,277) units in the first half of 2017. The product has been given a new packaging in that Zinzino introduced the the two variants, 960 gr zip bag and portion package.
In the first half of the year, 390,000 (500,000) packages of coffee were delivered, which gave a sales decrease of 22%. The most popular coffee sort is Zinzino French Espresso, of which we sold 70,000 (80,000) units in 2017, a sales decrease of 14%. The sale of coffee mak-ers was a total of 1,719 (2,505) units, which was a sales decrease of 31% for the period compared with 2016. COSTS AND PROFITThe gross profit was SEK 76.2 (72.0) million and the gross profit margin was 28.7% (33.2%). The decrease was mainly attributable to the higher costs for sales commissions as described above combined with Faun Pharmas sales mix largely accounting for high volume production in the first half of the year. As previously described, Zinzino is adjusting the remuneration model to the sales force, which is lowering the com-missions cost and is working intensively to enhance the efficiency of the Norwegian production unit to thereby increase productivity and strengthen the gross profit margin in the group. EBITDA for the first half of the year amounted to SEK 7.3 (12.8) million and the operating margin before depreciation and amortisation amounted to 2.8% (5.9%). The operating profit was SEK 2.8 (8.3) million and the operating margin was 1.1% (3.8%). The group currently has a large cost base through the production unit Faun Pharma and the research company Bioactive Foods while the head office has invested in a new IT system and has expanded the workforce to manage the increasing sales and the expansion of the group. This will affect the operating margins negatively in the short term but will generate margin improvements over the longer term.
Profit before tax for the first half of the year amounted to SEK 2.7(8.0) million and the net profit to SEK 0.9 (5.2) million.
INVENTORIESThe group’s combined goods inventories at the balance sheet date were SEK 59.7 (47.0) million. The increase depended primarily on the group’s increased sales in more markets than previously, moving the production in Zinzino Health from an external party to Faun Pharma AS, and Faun’s increased holding of inventory for the account of customers.
Q1 + Q2 Q1+Q2
-30
20
70
120
170
220
270
2013 2014 2015 2016 20170%
5%
10%
15%
20%
25%
30%
35%
40%MKR
Total revenues Gross profit Gross profit margin
Revenues
Growth per market 6 months 2017 vs 2016
Geographic distribution of sales
Sweden 19,8%
Norway 23,5%
Finland 18,0%
Denmark+Faroe Islands 14,4%
Iceland
The Baltic States 8,5%
USA/Canada 5,7%
Holland 0,9% Poland 0,3%Germany
EU 2,7%
2,5%
3,5%
Sales
MSEK 265.5 (216.8)
(2017; 182,5 (151,2) Mkr)
(2017; 36,9 (17,2) Mkr)
(2017; 23,2 (30,8) Mkr)
(2017; 22,9 (17,6) Mkr)
69%
14%
9%
8%
(2017; 182,5 (151,2) Mkr)
(2017; 36,9 (17,2) Mkr)
(2017; 23,2 (30,8) Mkr)
(2017; 22,9 (17,6) Mkr)
69%
14%
9%
8%
(2017; 182,5 (151,2) Mkr)
(2017; 36,9 (17,2) Mkr)
(2017; 23,2 (30,8) Mkr)
(2017; 22,9 (17,6) Mkr)
69%
14%
9%
8%
(2017; 182,5 (151,2) Mkr)
(2017; 36,9 (17,2) Mkr)
(2017; 23,2 (30,8) Mkr)
(2017; 22,9 (17,6) Mkr)
69%
14%
9%
8%
OTHER REVENUES FAUN
COFFEEHEALTH
54%
6%20%
-0,4%-20%
-14% -4%
8%
-56%-70%
-50%
-30%
-10%
10%
30%
50%
70%
Sweden Norway Finland Denmark+Faroe Islands
Iceland The Baltic States
USA/Canada Holland Poland Germany
Tillväxt per marknad 6 mån 2017 vs 2016
104%
LIQUIDITY AND EQUITY/ASSETS RATIOAt the balance sheet date, cash amounted to SEK 26.6 (26.9) million. The group’s equity/assets ratio was 48% (50%). The quarter’s cash flow was negative SEK 2.5 (7.1) million. During the quarter, SEK 8.1 million was paid to the shareholders as dividends after the Annual General Meeting resolved to pay the dividend. The Board of Directors makes the continued judgement that liquid assets are at a satisfactory level and that the group’s positive cash from the current business will ensure liquidity in the group for the foreseeable future.
ORGANISATIONDuring 2016, the Zinzino organisation was strength-ened through further resources in the IT and marketing departments. This combined with the capacity increase that arose at the support department through the implementation of the new business system and cus-tomer communication program “KUNDO” and the major web update completed in the second quarter. The in-vestments mean that Zinzino is well-equipped to handle large growth in sales in th group and that the company does not need to hire more people as the sales grow.
1110 ZINZINO AB I INTERIM REPORT 2017 I Q2

13
Amounts in SEK thousands 01-04-2017 01-04-2016 01-01-2017 01-01-2016 01-01-201630-06-2017 30-06-2016 30-06-2017 30-06-2016 12-31-2016
Net turnover 125,025 97,663 242,799 199,264 436,399
Other revenues 12,266 9,314 22,709 17,558 55,911
Goods and other direct costs -100,090 -73,349 -189,302 -144,859 -325,118
Gross profit 37,201 33,628 76,206 71,963 167,192External operating costs -19,087 -15,527 -35,869 -31,627 -85,245
Personnel costs -16,527 -13,525 -32,991 -27,582 -58,906
Depreciation and amortisation -2,273 -2,231 -4,548 -4,463 -8,997
Operating profit -686 2,345 2,798 8,291 14,044
Net financial items -33 -94 -57 -295 -177
Tax -324 -1,399 -1,841 -2,785 -4,198
The period’s profit -1,043 852 900 5,211 9,669
INCOME STATEMENTS ZINZINO GROUP (SEK THOUSANDS)
Amounts in SEK thousands 01-04-2017 01-04-2016 01-01-2017 01-01-201630-06-2017 30-06-2016 30-06-2017 30-06-2016
Net turnover 1,000 1,000 2,000 1,350
Other revenues - 26 - 16
Goods and other direct costs - - - -
Gross profit 1,000 1,026 2,000 1,366External operating costs -819 -675 -1,472 -1,414
Depreciation and amortisation -4 -4 -8 -8
Operating profit 177 347 520 -56
Net financial items -2 - -2 -
Tax -39 - -114 -
The year’s profit 136 347 404 -56
INCOME STATEMENTS ZINZINO AB (SEK THOUSANDS)
12 ZINZINO AB I INTERIM REPORT 2017 I Q2

15
Amounts in SEK thousands 30-06-2017 30-06-2016 12-31-2016
Fixed assets
Goodwill 36,100 41,004 38,552
Intangible fixed assets 21,234 15,144 19,511
Tangible fixed assets 3,146 3,387 3,322
Financial fixed assets 2,373 5,356 3,998
Total fixed assets 62,853 64,891 65,383
Current assets
Goods inventories 59,688 47,001 63,518
Short-term receivables 21,769 25,521 23,911
Cash and bank 26,581 23,975 23,323
Total current assets 108,038 96,497 110,752
Total assets 170,891 161,388 176,135
Restricted equity capital 4,275 3,105 3,258
Unrestricted equity capital 76,723 73,121 75,536
The year’s profit 900 5,211 9,669
Total equity capital 81,898 81,437 88 463
Long-term liabilities 580 732 543
Short-term liabilities 88,413 79,219 87,129
Total liabilities 88,993 79,951 87,672
Total equity capital and liabilities 170,891 161,388 176,135
BALANCE SHEETS ZINZINO GROUP (SEK THOUSANDS)
Amounts in SEK thousands 30-06-2017 30-06-2016 12-31-2016
Fixed assets
Intangible fixed assets 1,017 - 894
Financial fixed assets 83,414 83,434 83,449
Total fixed assets 84,431 83,434 84,343
Current assets
Short-term receivables 206 238 223
Cash and bank 679 1,217 1,047
Total current assets 885 1,455 1,270
Total assets 85,316 84,889 85,613
Restricted equity capital 4,275 3,105 4,152
Unrestricted equity capital 30,724 36,234 38,429
The year’s profit 404 -56 563
Total equity capital 35,403 39,283 43,144
Long-term liabilities 16,056 16,208 16,056
Short-term liabilities 33,857 29,398 26,413
Total liabilities 49,913 45,606 42,469
Total equity capital and liabilities 85,316 84,889 85,613
BALANCE SHEETS ZINZINO AB (SEK THOUSANDS)
14 ZINZINO AB I INTERIM REPORT 2017 I Q2

17
Amounts in SEK thousands 01-04-2017 01-04-2016 1 Jan 2017 01-01-2016 1 Jan 201630-06-2017 30-06-2016 30-06-2017 30-06-2016 31 Dec
2016
The ongoing businessProfit before financial items -686 2,345 2,798 8,291 14,044
Depreciation and amortisation / write-downs 2,273 2,231 4,548 4,463 8,997
Other items not affecting liquidity 977 -614 716 -40 1,681
2,564 3,962 8,062 12,714 24,722
Interest received 8 3 24 6 49
Interest paid -41 -96 -80 -298 -226
Tax paid 38 -33 38 -55 -62
5 -126 -18 -346 -239
Cash flow from the ongoing business
before change in operating capital 2,569 3,836 8,044 12,368 24,483
Cash flow from change in operating capital
Increase(-) / Decrease(+) in goods inventories 8,208 -2,409 3,830 -6,712 -23,229
Increase(-) / Decrease(+) in short-term receivables 79 -283 2,142 -3,197 -1,587
Increase(+) / Decrease(-) in short-term liabilities -3,212 2,626 1,284 5,789 10,882
Cash flow from the ongoing business 7,644 3,770 15,300 8,248 10,549
Investment activity
Investments in intangible fixed assets -1,847 -1,196 -3,470 -1,196 -6,939
Investments in financial fixed assets - -860 -91 -3,829 -764
Investments in tangible fixed assets -106 -1 432 -336 -174 -2,016
Cast flow from investment activity -1,953 -3,488 -3,897 -5,199 -9,719
Financing activity
Loans taken - 55 - 55 -
Release of options - - - - 44
Dividend -8,145 -7,763 -8,145 -7,763 -7,763
Subscriptions for shares on outstanding subscription options
- 285 - 395 3,360
Cash flow from financing activity -8,145 -7,423 -8,145 -7,313 -4,359
THE PERIOD’S CASH FLOW -2,454 -7,141 3,258 -4,264 -3,529
Liquid assets at the start of the period 29,035 31,116 23,323 31,116 26,852
Liquid assets at the end of the period 26,581 23,975 26,581 26,852 23,323
Change in liquid assets -2,454 -7,141 3,258 -4,264 -3,529
CASH FLOR ANALYSES ZINZINO GROUP (SEK THOUSANDS)
Amounts in SEK thousands 01-04-2017 01-04-2016 1 Jan 2017 01-01-2016 1 Jan 201630-06-2017 30-06-2016 30-06-2017 30-06-2016 31 Dec 2016
The ongoing businessProfit before financial items 177 347 520 -56 722
Depreciation and amortisation / write-downs 4 4 8 8 16
Other items not affecting liquidity -5 -3 -8 -6 -22
176 348 520 -54 716
Interest received - - - - -
Interest paid -2 - -2 - -
Tax paid - - - -
-2 -126 -2 0 0
Cash flow from the ongoing business
before change in operating capital 174 348 518 -54 716
Cash flow from change in operating capital
Increase(-) / Decrease(+) in short-term receivables 155 126 17 -92 -35
Increase(+) / Decrease(-) in short-term liabilities 7,589 7,237 7,444 8,679 4,402
Cash flow from the ongoing business 7,918 7,711 7,979 8,533 5,083
Investment activity
Investments in intangible fixed assets -123 - -123 - -
Investments in financial fixed assets - -54 -79 -450 -623
Investments in tangible fixed assets - - - - -
Cast flow from investment activity -123 -54 -202 -450 -623
Financing activity
Release of options - 55 - 55 543
Dividend -8,145 -7,763 -8,145 -7,763 -7,763
Subscriptions for shares on outstanding subscription options
- 285 - 395 3,360
Cash flow from financing activity -8,145 -7,423 -8,145 -7,313 -3,860
THE PERIOD’S CASH FLOW -350 234 -368 770 600
Liquid assets at the start of the period 1,029 983 1,047 447 447
Liquid assets at the end of the period 679 1,217 679 1,217 1,047
Change in liquid assets -350 234 -368 770 600
CASH FLOR ANALYSES ZINZINO AB (SEK THOUSANDS)
16 ZINZINO AB I INTERIM REPORT 2017 I Q2
19
CHANGES IN EQUITY CAPITAL ZINZINO GROUP (SEK THOUSANDS)Amounts in SEK thousands 01-01-2017 01-01-2016 1 Jan 2016
30-06-2017 30-06-2016 31 Dec 2016
Equity capital at the start of the period 88 463 88 320 88,320Adjustment for errors in prior years - -4,513 -4,513
Subscriptions for shares on subscription options - 205 3,392
Dividend to shareholders -8,145 -7763 -7,763
Currency rate of exchange conversions 680 -23 -642
The period’s profit 900 5,211 9,669
Equity capital at the end of the period 81,898 81,437 88 463
CHANGES IN EQUITY CAPITAL ZINZINO AB (SEK THOUSANDS)Amounts in SEK thousands 01-01-2017 01-01-2016 01-01-2016
30-06-2017 30-06-2016 31 Dec 2016
Equity capital at the start of the period 43,144 46,707 46,707Subscriptions for shares on subscription options 395 3,637
Dividend to shareholders -8,145 -7763 -7,763
The period’s profit 404 -56 563
Equity capital at the end of the period 35,403 39,283 43,144
GROSS MARGINTotal revenues minus cost of goods sold, partner commissions and outgoing freight in percent of the period’s total revenues.
OPERATING MARGINOperating profit after depreciation and amortisation in percent of the period’s total revenues.
PROFIT PER SHARE The period’s profit in relation to the period’s average number of out-standing shares.
OPERATING MARGIN BEFORE DEPRECIATION AND AMORTISATIONOperating profit before depreciation and amortisation in percent of the period’s total revenues.
EQUITY CAPITAL PER SHAREEquity capital in relation to the number of outstanding shares on the balance sheet date.
NET MARGINThe period’s profit in percent of the period’s net sales.
EQUITY/ASSETS RATIOEquity capital in percent of the balance sheet total.
DEFINITIONS OF KEY RATIOS
THE NUMBER OF OUTSTANDING SHARESThe share capital as of 30 June 2017 is divided into 32,580,025 shares, of which 5,113,392 are A shares (1 vote) and 27,466,633 B shares (0.1 vote). The share’s par value is SEK 0.10. The company’s B shares are traded on Nasdaq Omx First North, nasdaqomxnordic.com.
The company, as of the report date, has three outstanding options programs. The first options program will expire on 31 May 2019 at an exercise price of SEK 16 and will cover 600,000 options. The second options program also includes 600,000 options, but at an exercise price of SEK 26. That options program expires on 31 May 2020. In addition to this, it was decided at the Annual Meeting of the Shareholders on 24 May to issue a further 500,000 warrants at an exercise price of SEK 14. The option program will expire on 31 May 2020.
If all the warrants outstanding on 30 June 2017 are exercised for new subscriptions to 1,700,000 shares the dilution of the share capital will be about 5%.
18 ZINZINO AB I INTERIM REPORT 2017 I Q2

21
This interim report has been prepared in accordance with the Swedish Annual Reports Act and the Swedish Accounting Standards Board’s general advice. The group report and annual report are prepared in accordance with BFNAR 2012:1 Annual reports and group reports (K3).
AUDITING PRINCIPLESREVENUES BY COMPANY Q2 (SEK THOUSAND)COMPANY Q2 2017 Q2 2016 Growth by
company compared with
prior year
Share of total revenues
Zinzino Sverige AB* 27,070 15,822 71% 21%
Zinzino AS (Norway) 26,103 25,357 3% 20%
Zinzino OY (Finland) 21,765 16,276 34% 16%
Zinzino ApS (Denmark+Faroe Islands) 16,830 16,370 3% 12%
Zinzino Ehf (Iceland) 4,008 4,338 -8% 3%
Zinzino UAB (Lithuania) 3,317 2,170 53% 2%
Zinzino SIA (Latvia) 3,062 2,552 20% 2%
Zinzino OÜ (Estonia) 3,176 5,121 -38% 2%
Zinzino LLC (United States) 6,152 6,394 -4% 4%
Zinzino BV (Holland) 969 934 4% 1%
Zinzino SP z.o.o (Poland) 393 720 -45% 0%
Zinzino Canada Corp 190 332 -43% 0%
Zinzino Gmbh (Germany) 3,048 2,007 238% 2%
Faun Pharma AS (Norway) 19,890 7,656 160% 14%
Zinzino Nordic AB 1,318 928 -42% 1%
Total 137,291 106,977 28% 100%
* The Swedish company includes sales for the EU
REVENUES BY COMPANY Q1 - Q2 (SEK THOUSAND)COMPANY Q1 - Q2 2017 Q1 - Q2 2016 Growth by
company compared with
prior year
Share of total revenues
Zinzino Sverige AB 51,328 29,409 75% 20%
Zinzino AS (Norway) 53,235 50,434 6% 20%
Zinzino OY (Finland) 41,005 34,074 20% 15%
Zinzino ApS (Denmark) 32,748 32,861 0% 12%
Zinzino Ehf (Iceland) 8,011 10,018 -20% 3%
Zinzino UAB (Lithuania) 6,398 5,017 28% 2%
Zinzino SIA (Latvia) 6,101 5,599 9% 2%
Zinzino OÜ (Estonia) 6,789 11,971 -43% 3%
Zinzino LLC (United States) 12,666 12,834 -1% 5%
Zinzino BV (Holland) 2,071 1,913 8% 1%
Zinzino SP z.o.o (Poland) 732 1,650 -56% 0%
Zinzino Canada Corp 419 745 n/a 0%
Zinzino Gmbh (Germany 5,716 2,789 n/a 2%
Faun Pharma AS (Norway) 36,909 17,159 115% 14%
Zinzino Nordic AB 1,380 349 295% 1%
Total 265,508 216,822 22% 100%
* The Swedish company includes sales for the EU
AUDITORS REVIEWThis interim report has not undergone review by the company’s auditors.
REPORT CALENDAR Interim report Q3 2017 will be published 11-20-2017The annual account communique will be published on 28 February 2018
For more information, please ring Dag Bergheim Pettersen, Chief Executive Officer, Zinzino AB
Gothenburg, 31 August 2017
Zinzino AB (publ.)The board of directors
ZINZINO ABHulda Lindgrens gata 8, 421 31 Västra FrölundaE-mail: [email protected]: +46 (0)31-771 71 50
INTERIM REPORT 2017 I Q2
Note: This report is published in Swedish and English. In the event of any difference between the versions, the Swedish version shall prevail.20 ZINZINO AB I INTERIM REPORT 2017 I Q2

INSPIRE CHANGE IN LIFE I ZINZINO.COM