Interim report 2 2010, Nordea Bank
40
Copenhagen, Helsinki, Oslo, Stockholm, 21 July 2010 Second Quarter Report 2010 CEO Christian Clausen’s comment to the report: ”We have seen a positive development in our customer business with a record level of new Gold and Private Banking customers and we have strengthened relationships with our large corporate customers. Our market shares have increased and income in customer segments is up 9%. The Group result is in line with our plans. Net interest income is holding up well despite the low interest rate levels. Net fee and commission income has increased. The net result from items at fair value has decreased from the high level in the first quarter. We are especially pleased with the continued development of our relationship banking model and our growth initiatives. Together, they lay a strong foundation for reaching our long-term financial targets.” (For further viewpoints, see CEO comments, page 2) Second quarter vs first quarter: • Income from corporate customers up 10% and from household customers up 7% • Number of Gold and Private Banking customers up by 73,000 or 2.6% • Net loan losses down 28% to 26 basis points, excluding provisions for the Danish guarantee scheme, and the growth in impaired loans levelled out and a slight decrease was seen • Operating profit down 17%, due to lower result from items at fair value • Outlook. The outlook is improved regarding the Nordic macroeconomic development. Net loan losses in 2010 are now expected to be lower than in 2009. Credit quality continues to stabilise, in line with the economic recovery. Nordea continues to expect risk-adjusted profit to be lower in 2010 compared to 2009, due to lower income in Treasury and Markets. (For full outlook, see page 8) Summary key figures, EURm Q2 10 Q1 10 Ch.% Q2 09 Ch.% H1 10 H1 09 Ch.% Net interest income 1,249 1,235 1 1,305 -4 2,484 2,661 -7 Total operating income 2,161 2,303 -6 2,359 -8 4,464 4,638 -4 Profit before loan losses 975 1,139 -14 1,243 -22 2,114 2,432 -13 Net loan losses -245 -261 -6 -425 -42 -506 -781 -35 Loan loss ratio annualised, bps 35 37 57 36 55 Operating profit 730 878 -17 818 -11 1,608 1,651 -3 Risk-adjusted profit 516 678 -24 777 -34 1,194 1,524 -22 Diluted earnings per share, EUR 0.13 0.16 0.15 0.29 0.34 Return on equity, % 9.5 11.3 12.0 10.4 12.8 For further information: Christian Clausen, President and Group CEO +46 8 614 7804 Fredrik Rystedt, Group CFO +46 8 614 7812 Rodney Alfvén, Head of Investor Relations +46 8 614 7880 (or +46 72 235 05 15) Jan Larsson, Head of Group Identity & Communications +46 8 614 7916 (or +46 70 593 34 12) Nordea’s vision is to be a Great European bank, acknowledged for its people, creating superior value for customers and shareholders. We are making it possible for our customers to reach their goals by providing a wide range of products, services and solutions within banking, asset management and insurance. Nordea has around 10 million customers, approx. 1,400 branch offices and a leading net banking position with 6.1 million e-customers. The Nordea share is listed on the NASDAQ OMX Nordic Exchange in Stockholm, Helsinki and Copenhagen. www.nordea.com
-
Upload
nordea-bank -
Category
Economy & Finance
-
view
609 -
download
0
Transcript of Interim report 2 2010, Nordea Bank

Copenhagen, Helsinki, Oslo, Stockholm, 21 July 2010
Second Quarter Report 2010 CEO Christian Clausen’s comment to the report: ”We have seen a positive development in our customer business with a record level of new Gold and Private Banking customers and we have strengthened relationships with our large corporate customers. Our market shares have increased and income in customer segments is up 9%.
The Group result is in line with our plans. Net interest income is holding up well despite the low interest rate levels. Net fee and commission income has increased. The net result from items at fair value has decreased from the high level in the first quarter.
We are especially pleased with the continued development of our relationship banking model and our growth initiatives. Together, they lay a strong foundation for reaching our long-term financial targets.” (For further viewpoints, see CEO comments, page 2)
Second quarter vs first quarter:
• Income from corporate customers up 10% and from household customers up 7%
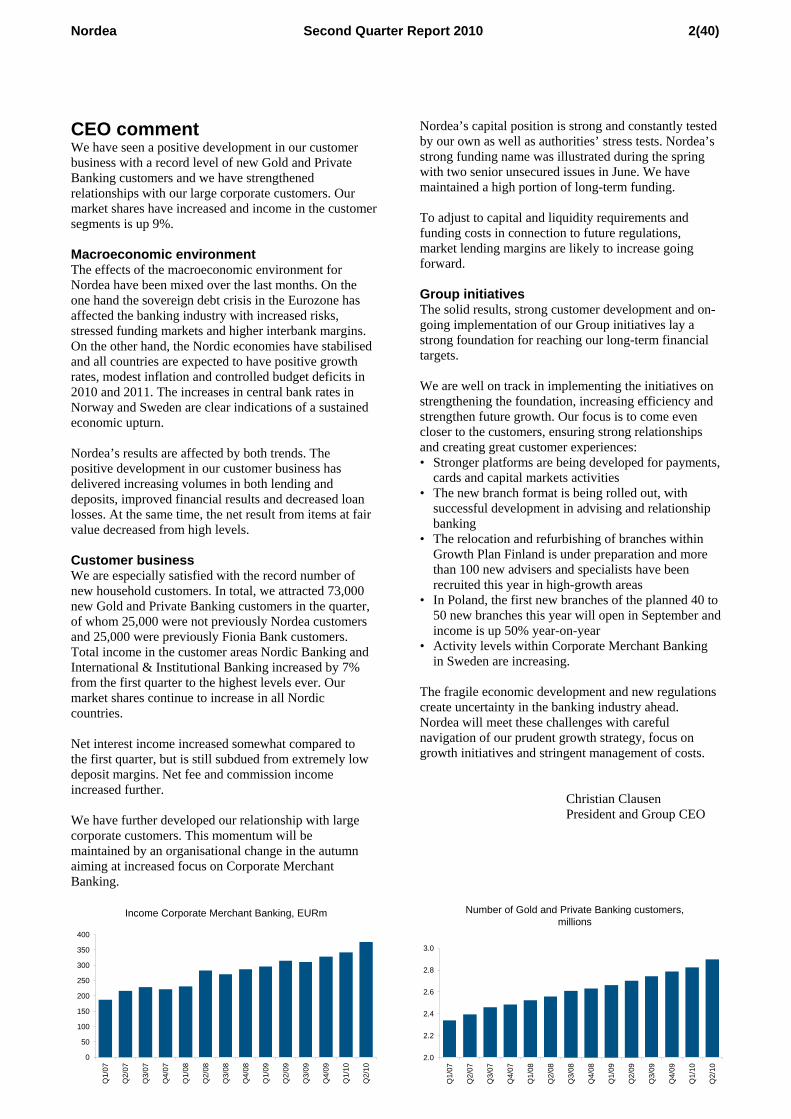
• Number of Gold and Private Banking customers up by 73,000 or 2.6%
• Net loan losses down 28% to 26 basis points, excluding provisions for the Danish guarantee scheme, and the growth in impaired loans levelled out and a slight decrease was seen
• Operating profit down 17%, due to lower result from items at fair value
• Outlook. The outlook is improved regarding the Nordic macroeconomic development. Net loan losses in 2010 are now expected to be lower than in 2009. Credit quality continues to stabilise, in line with the economic recovery. Nordea continues to expect risk-adjusted profit to be lower in 2010 compared to 2009, due to lower income in Treasury and Markets. (For full outlook, see page 8)
Summary key figures, EURm
Q2 10 Q1 10 Ch.% Q2 09 Ch.% H1 10 H1 09 Ch.%
Net interest income 1,249 1,235 1 1,305 -4 2,484 2,661 -7 Total operating income 2,161 2,303 -6 2,359 -8 4,464 4,638 -4 Profit before loan losses 975 1,139 -14 1,243 -22 2,114 2,432 -13 Net loan losses -245 -261 -6 -425 -42 -506 -781 -35 Loan loss ratio annualised, bps 35 37 57 36 55 Operating profit 730 878 -17 818 -11 1,608 1,651 -3 Risk-adjusted profit 516 678 -24 777 -34 1,194 1,524 -22 Diluted earnings per share, EUR 0.13 0.16 0.15 0.29 0.34 Return on equity, % 9.5 11.3 12.0 10.4 12.8
For further information:
Christian Clausen, President and Group CEO +46 8 614 7804 Fredrik Rystedt, Group CFO +46 8 614 7812 Rodney Alfvén, Head of Investor Relations +46 8 614 7880 (or +46 72 235 05 15) Jan Larsson, Head of Group Identity & Communications +46 8 614 7916 (or +46 70 593 34 12)
Nordea’s vision is to be a Great European bank, acknowledged for its people, creating superior value for customers and shareholders. We are making it possible for our customers to reach their goals by providing a wide range of products, services and solutions within banking, asset management and insurance. Nordea has around 10 million customers, approx. 1,400 branch offices and a leading net banking position with 6.1 million e-customers. The Nordea share is listed on the NASDAQ OMX Nordic Exchange in Stockholm, Helsinki and Copenhagen.
www.nordea.com
Nordea Second Quarter Report 2010 2(40)
Income Corporate Merchant Banking, EURm
0
50
100
150
200
250
300
350
400
Q1/
07
Q2/
07
Q3/
07
Q4/
07
Q1/
08
Q2/
08
Q3/
08
Q4/
08
Q1/
09
Q2/
09
Q3/
09
Q4/
09
Q1/
10
Q2/
10
Number of Gold and Private Banking customers, millions
2.0
2.2
2.4
2.6
2.8
3.0
Q1/
07
Q2/
07
Q3/
07
Q4/
07
Q1/
08
Q2/
08
Q3/
08
Q4/
08
Q1/
09
Q2/
09
Q3/
09
Q4/
09
Q1/
10
Q2/
10
CEO comment We have seen a positive development in our customer business with a record level of new Gold and Private Banking customers and we have strengthened relationships with our large corporate customers. Our market shares have increased and income in the customer segments is up 9%. Macroeconomic environment The effects of the macroeconomic environment for Nordea have been mixed over the last months. On the one hand the sovereign debt crisis in the Eurozone has affected the banking industry with increased risks, stressed funding markets and higher interbank margins. On the other hand, the Nordic economies have stabilised and all countries are expected to have positive growth rates, modest inflation and controlled budget deficits in 2010 and 2011. The increases in central bank rates in Norway and Sweden are clear indications of a sustained economic upturn. Nordea’s results are affected by both trends. The positive development in our customer business has delivered increasing volumes in both lending and deposits, improved financial results and decreased loan losses. At the same time, the net result from items at fair value decreased from high levels. Customer business We are especially satisfied with the record number of new household customers. In total, we attracted 73,000 new Gold and Private Banking customers in the quarter, of whom 25,000 were not previously Nordea customers and 25,000 were previously Fionia Bank customers. Total income in the customer areas Nordic Banking and International & Institutional Banking increased by 7% from the first quarter to the highest levels ever. Our market shares continue to increase in all Nordic countries. Net interest income increased somewhat compared to the first quarter, but is still subdued from extremely low deposit margins. Net fee and commission income increased further. We have further developed our relationship with large corporate customers. This momentum will be maintained by an organisational change in the autumn aiming at increased focus on Corporate Merchant Banking.
Nordea’s capital position is strong and constantly tested by our own as well as authorities’ stress tests. Nordea’s strong funding name was illustrated during the spring with two senior unsecured issues in June. We have maintained a high portion of long-term funding. To adjust to capital and liquidity requirements and funding costs in connection to future regulations, market lending margins are likely to increase going forward. Group initiatives The solid results, strong customer development and on-going implementation of our Group initiatives lay a strong foundation for reaching our long-term financial targets. We are well on track in implementing the initiatives on strengthening the foundation, increasing efficiency and strengthen future growth. Our focus is to come even closer to the customers, ensuring strong relationships and creating great customer experiences: • Stronger platforms are being developed for payments,
cards and capital markets activities • The new branch format is being rolled out, with
successful development in advising and relationship banking
• The relocation and refurbishing of branches within Growth Plan Finland is under preparation and more than 100 new advisers and specialists have been recruited this year in high-growth areas
• In Poland, the first new branches of the planned 40 to 50 new branches this year will open in September and income is up 50% year-on-year
• Activity levels within Corporate Merchant Banking in Sweden are increasing.
The fragile economic development and new regulations create uncertainty in the banking industry ahead. Nordea will meet these challenges with careful navigation of our prudent growth strategy, focus on growth initiatives and stringent management of costs.
Christian Clausen President and Group CEO

Nordea Second Quarter Report 2010 3(40)
Income statement1
Q2 Q1 Change Q2 Change Jan-Jun Jan-Jun ChangeEURm 2010 2010 % 2009 % 2010 2009 %Net interest income 1,249 1,235 1 1,305 -4 2,484 2,661 -7Net fee and commission income 538 475 13 412 31 1,013 793 28Net result from items at fair value 339 548 -38 594 -43 887 1,109 -20Equity method 7 25 -72 17 -59 32 26 23Other operating income 28 20 40 31 -10 48 49 -2Total operating income 2,161 2,303 -6 2,359 -8 4,464 4,638 -4
Staff costs -701 -687 2 -687 2 -1,388 -1,352 3Other expenses -445 -438 2 -392 14 -883 -786 12Depreciation of tangible and intangible assets -40 -39 3 -37 8 -79 -68 16Total operating expenses -1,186 -1,164 2 -1,116 6 -2,350 -2,206 7
Profit before loan losses 975 1,139 -14 1,243 -22 2,114 2,432 -13Net loan losses -245 -261 -6 -425 -42 -506 -781 -35Operating profit 730 878 -17 818 -11 1,608 1,651 -3Income tax expense -191 -235 -19 -200 -5 -426 -406 5Net profit for the period 539 643 -16 618 -13 1,182 1,245 -5
30 Jun 31 Mar Change 30 Jun ChangeEURbn 2010 2010 % 2009 %Loans to the public 302.6 292.5 3 278.3 9Deposits and borrowings from the public 160.9 160.0 1 149.7 7 of which savings deposits 49.7 47.6 4 46.6 7Assets under management 170.0 169.3 0 136.5 25Technical provisions, Life 34.7 33.9 2 29.6 17Equity 22.9 22.3 3 21.1 9Total assets 571.1 526.2 9 475.6 20
Q2 Q1 Q2 Jan-Jun Jan-Jun2010 2010 2009 2010 2009
Diluted earnings per share, EUR 0.13 0.16 0.15 0.29 0.34EPS, rolling 12 months up to period end, EUR 0.55 0.57 0.72 0.55 0.72Share price2, EUR 6.81 7.34 5.62 6.81 5.62Total shareholders' return, % -8.9 1.0 55.6 -8.0 49.7Equity per share2, EUR 5.68 5.53 5.23 5.68 5.23Potential shares outstanding2, million 4,043 4,037 4,037 4,043 4,037Weighted average number of diluted shares, million 4,022 4,018 3,982 4,019 3,668Return on equity, % 9.5 11.3 12.0 10.4 12.8Cost/income ratio, % 55 51 47 53 48Core Tier 1 capital ratio, excl transition rules2, % 10.0 10.1 10.3 10.0 10.3Tier 1 capital ratio, excl transition rules2, % 11.1 11.2 11.2 11.1 11.2Total capital ratio, excl transition rules2, % 13.2 13.6 13.2 13.2 13.2Core Tier 1 capital ratio2, % 9.0 9.2 9.2 9.0 9.2Tier 1 capital ratio2, % 10.0 10.1 9.9 10.0 9.9Total capital ratio2, % 11.8 12.3 11.7 11.8 11.7Tier 1 capital2, EURm 20,491 20,070 19,034 20,491 19,034Risk-weighted assets incl transition rules2, EURbn 206 198 192 206 192Loan loss ratio, basis points3 35 37 57 36 55Number of employees (full-time equivalents)2 33,511 33,477 33,510 33,511 33,510Risk-adjusted profit, EURm 516 678 777 1,194 1,524Economic profit, EURm 90 265 418 355 803Economic capital2, EURbn 17.9 17.4 16.0 17.7 16.0EPS, risk-adjusted, EUR 0.13 0.17 0.20 0.30 0.42RAROCAR, % 12.3 16.5 20.2 14.2 19.81 For exchange rates used in the consolidation of Nordea Group see Note 1.2 End of period.3 Loan loss ratio in Q2 2009 excluding provision for a legal claim contested by Nordea.
Business volumes, key items1
Ratios and key figures

Nordea Second Quarter Report 2010 4(40)
The Group Result summary, second quarter 2010 Total income decreased 6% from the previous quarter and 8% compared to the second quarter last year. The development in the customer business remained strong, despite the financial turmoil. Lending volumes increased by 3% and deposit volumes by 1% from the previous quarter, margins were largely stable in the quarter and market shares increased in most markets. Total income in customer segments increased by 9% compared to the previous quarter. However, the turmoil in the European financial markets during the second quarter has resulted in lower net result from fair value items in Group Treasury. The fair value result in the Group was also affected by a non-recurring gain of approx. EUR 50m in connection to the merger of the two payment companies Nordito and PBS. Net loan loss provisions in the second quarter amounted to EUR 245m, of which EUR 58m related to the Danish guarantee scheme. The loan loss ratio was 35 basis points including and 26 basis points excluding the guarantee scheme provisions, compared to 37 basis points in the first quarter. Credit quality continued to stabilise and impaired loans for the Group decreased 1% from the first quarter. Total expenses increased 2% compared to the previous quarter and staff costs increased by 2%. Operating profit was down 17% from the previous quarter, mainly due to the lower net result from items at fair value. Risk-adjusted profit decreased 24% compared to the previous quarter. The inflow of new Gold and Private Banking customers continued to be strong in the second quarter, increasing by more than 24,000 per month, including customers from Fionia Bank. More than 75% of the new Gold customers were new customers to Nordea, including the customers from Fionia Bank. Despite the difficult market conditions, Nordea has benefitted from a strong funding name and has continued to issue long-term funding throughout the second quarter. The core tier 1 capital ratio, ie excluding hybrid loans, was 10.0% excluding transition rules according to Basel II (10.1% in the first quarter). The effect from currency fluctuations contributed to an increase in income and expenses of approx. 1 %-point compared to the previous quarter and of approx. 4-5 %-points compared to the second quarter last year.
Income Total income decreased 6% from the previous quarter, to EUR 2,161m. Net interest income Net interest income increased 1% compared to the previous quarter to EUR 1,249m. Lending and deposit volumes continued to increase, resulting in higher net interest income in the customer areas, which, however, was partly offset by higher average funding costs. Corporate lending Corporate lending volumes, excluding reversed repurchase agreements, were up 2% in local currencies in the second quarter, an annualised growth rate of 9%. Market shares increased in Denmark, Finland and Sweden. The demand for financing of acquisitions and investments remains subdued, while demand for working capital financing has returned. Corporate lending margins were largely unchanged in the quarter. Household lending Household mortgage lending volume increased 3% in local currencies compared to the previous quarter, an annualised growth rate of 12%. Market shares grew in all four Nordic countries in the second quarter. Total underlying household mortgage lending margins were stable in the second quarter, although they decreased in Norway due to the lag effect in connection with the increased market interest rates and competitive situation. Corporate and household deposits Total deposits from the public increased 1% to EUR 161bn compared to the previous quarter and 7% compared to one year ago, reflecting Nordea’s strong rating and competitive offerings. Household deposits increased 4%. Fierce competition for savings deposits continued and both household and corporate deposit margins decreased somewhat in the second quarter. Group Treasury Net interest income decreased in the second quarter, mainly due to that average funding costs increased somewhat as maturing long-term funding was prolonged at higher market rates. Net fee and commission income Net fee and commission income increased 13% compared to the previous quarter to EUR 538m. Increases were seen in most areas, with higher commission income from corporate finance and higher savings commission income both from asset management and life as well as from custody business.

Nordea Second Quarter Report 2010 5(40)
Savings and asset management commissions Savings-related commissions increased 8% in the second quarter to EUR 335m, due to higher asset management transaction-related income, and higher commission income from life and custody business. Assets under Management (AuM) increased somewhat to EUR 170bn. Lending-related and payment commissions Lending-related commissions increased 3% in the second quarter to EUR 128m, due to continued high activity in the capital markets. Payment commissions net decreased 2% compared to the previous quarter. Net result from items at fair value Net result from items at fair value decreased 38% from a very high level in the first quarter to EUR 339m. The result on Group level included a non-recurring gain of approx. EUR 50m in connection to the merger of the two payment transaction companies Nordito in Norway and PBS in Denmark. Capital Markets income in customer areas The customer-driven capital markets activities with Nordic Banking and Institutional & International Banking customers continued to perform well. Market volumes increased compared to the previous quarter, in particular within the fixed income and foreign exchange products areas, as corporate hedging activity picked up due to the financial turmoil. The net fair value result from transactions with customers in Nordic Banking and Institutional & International Banking increased 25% to EUR 246m from previous quarter. Capital Markets unallocated income The net fair value result in Capital Markets unallocated income, ie income from risk management and trading in connection with managing the risk inherent in customer transactions, decreased 66% to EUR 60m, due to the challenging environment during the quarter. Group Treasury The net result from fair value items in Group Treasury was affected by the financial turmoil in the quarter. On the back of a positive macro scenario, Nordea was positioned to higher interest rates, tighter credit spreads and stronger equity markets, which led to a negative result in the second quarter as opposed to the strong positive result in the first quarter. Net fair value result in Group Treasury was EUR -97m compared to EUR 53m in the first quarter. Life insurance operations Net result from items at fair value in Life was strong in the second quarter, although down 10% to EUR 88m. The financial buffers were 6.1% of technical provisions, or EUR 1,487m, at the end of the second quarter, a decrease of 1.0 %-point compared to the first quarter.
Equity method Income from companies accounted for under the Equity method was EUR 7m, of which the result from the holding in Eksportfinans was EUR -5m. Other operating income Other operating income was EUR 28m compared to EUR 20m in the previous quarter. Expenses Total expenses increased 2% compared to the previous quarter to EUR 1,186m, due to increased costs related to the Group initiatives and currency fluctuation effects. Staff costs increased 2% to EUR 701m and other expenses increased 2% to EUR 445m. Total expenses increased by 6% and staff costs by 2%, compared to the same quarter last year. In local currencies, total expenses increased 1%, staff costs decreased 3% mainly due to lower performance-related salaries and other expenses increased 8% due to higher activity level than in the second quarter last year. The number of employees (FTEs) at the end of the second quarter was largely unchanged compared to the end of the first quarter. The cost/income ratio was 55%, compared to 51% in the previous quarter and 47% one year ago. Provisions for performance-related salaries in the second quarter were EUR 60m, compared to EUR 67m in the first quarter and EUR 90m in the second quarter last year. The final decision on payout of performance-related salaries will be made based on the full-year financial outcome. Allocations to the profit-sharing scheme for all employees were EUR 13m for the second quarter compared to EUR 7m for the first quarter and EUR 25m for the second quarter last year. Net loan losses Net loan loss provisions were EUR 245m. This includes provisions of EUR 58m related to the Danish guarantee scheme (none in the first quarter), which includes incurred claims and also provisions for potential claims under the guarantee. Net loan losses excluding the guarantee scheme provisions were 28% lower in the second quarter than in the first quarter, with decreases in most countries. New collective provisions net were EUR 2m in the second quarter (EUR 80m in the first quarter), as rating migration has levelled out. The loan loss ratio was 35 basis points in the second quarter, including the Danish guarantee scheme provisions, and 26 basis points excluding these. This compares to 37 basis points in the first quarter, when no guarantee scheme provisions were recorded. In the Baltic countries, the loan

Nordea Second Quarter Report 2010 6(40)
loss ratio was 114 basis points (166 basis points in first quarter). Taxes The effective tax rate was 26.2% compared to 26.8 % previous quarter and 24.4% same quarter previous year. No tax is incurred for the Nordito transaction. Net profit Net profit decreased 16% compared to the previous quarter to EUR 539m, corresponding to a return on equity of 9.5%. Diluted earnings per share were EUR 0.13 (EUR 0.16 in the first quarter). Risk-adjusted profit Risk-adjusted profit decreased to EUR 516m, down 24% compared to the previous quarter and down 34% compared to one year ago. The non-recurring gain from the Nordito transaction has been adjusted for in risk-adjusted profit. Result summary January – June 2010 The first half year 2010 showed continued high total income, although down 4% compared to very strong first half year last year. Operating profit decreased 3%, due to lower income, mainly net result from items at fair value, and higher total expenses while net loan losses decreased 35% to EUR 506m. Risk-adjusted profit decreased by 22% compared to the same period last year. Income Net interest income decreased 7% compared to the first half year last year. Lending volumes increased 9% and corporate lending margins were higher, while deposit margins have decreased from last year. Net fee and commission income has recovered strongly from the weak first half year 2009 and increased by 28%. Net result from items at fair value decreased by 20% compared to very high levels in the same period last year. The customer-driven capital markets operations continued to be strong with increasing volumes, but the results from Group Treasury and Capital Markets unallocated income were lower. Income under equity method was EUR 32m and other income was EUR 48m. Expenses Total expenses increased 7% compared to the same period last year. Staff costs increased 3%. In local currencies, total expenses increased 2% and staff costs decreased 2%. Net loan losses Net loan losses decreased 35% to EUR 506m, compared to the same period last year, corresponding to a loan loss ratio of 36 basis points (55 basis points).
Taxes The effective tax rate in the first half year was 26.5%, compared to 24.6% last year. Net profit Net profit decreased 5% to EUR 1,182m, due to lower income. Risk-adjusted profit Risk-adjusted profit decreased 22% compared to the same period last year to EUR 1,194m. Other information Group initiatives 2010 Activities related to the Group initiatives launched early 2010 are well on track in all areas. The new distribution plans are carried out in Nordic Banking and 14 branches are now operating in the new branch format. Several improvements and new features in the Private Netbank have been implemented as well as enhanced mobile offering. New customer acquisition continued strongly with approx. 50,000 new Gold and Private Banking customers which were new customers to Nordea during the second quarter, including the customers from Fionia Bank. Growth Plan Corporate Merchant Banking Sweden proceeds as planned, in terms of income development and progress regarding customer relations and new cash management mandates. Corporate lending market shares continued to increase in the second quarter. Growth Plan Finland proceeds according to plans and more than 100 new advisers and specialists have been recruited this year in high-growth areas to ensure services needed in the coming years. 28 branches will be relocated or refurbished to better serve our customers during the next 12 months. In Poland, preparations for the opening of new branches develop well and the first launch of the planned 40-50 branches is scheduled for September. During the second quarter, total investments amounted to approx. EUR 30m, of which EUR 23m were accounted for as expenses in the income statement. The increase in income generation is expected to reach the full year plan. Credit portfolio Total lending increased by 3% to EUR 303bn compared to the previous quarter and by 9% compared to one year ago. The total effect on risk-weighted assets (RWA) from rating migration shows a further slowdown and was

Nordea Second Quarter Report 2010 7(40)
approx. 0.3% during the second quarter measured in the portfolio held at the start of the quarter. However, in total, RWA decreased approx. 1% due to improved average credit quality since new exposures have higher ratings than amortised exposures. Impaired loans gross in the Group decreased 1% to EUR 4,407m at the end of the second quarter, corresponding to 135 basis points of total loans. 52% of impaired loans gross are performing loans and 48% are non-performing loans. Impaired loans net, after allowances for individually assessed impaired loans amounted to EUR 2,861m, corresponding to 88 basis points of total loans. The provisioning ratio increased to 56%, compared to 54% at the end of the first quarter. Loan loss ratios and impaired loans Q2 Q1 Q4 Q3 Q2 Basis points of loans 2010 10 2009 09 09 Loan loss ratio
Group annualised 35
37
52 54 57¹ of which individual 34 26 40 37 41¹ of which collective 1 11 12 17 16 Loan loss ratios:
Nordic Banking 35
37
47 49 63 IIB 55 64 104 122 92 Baltic countries 114 166 338 322 214 Impaired loans ratio
gross, Group (bps) 135
140
140 128 118 - performing 52% 53% 56% 57% 55% - non-performing 48% 47% 44% 43% 45% Total allowance
ratio, Group (bps) 76
76
73 65 57 Provisioning ratio,
Group² 56% 54% 52% 51% 49% ¹ Excluding the provision concerning the legal claim, contested by Nordea, related to the debt restructuring liquidation of Swiss Air Group. ² Total allowances in relation to gross impaired loans. Market risk Interest-bearing securities and treasury bills were EUR 79bn at the end of the second quarter, of which EUR 25bn in the life insurance operations and the remaining part in the liquidity buffer and trading portfolios. 29% of the portfolio comprises government or municipality bonds and 37% is mortgage bonds. Total Value at Risk (VaR) market risk decreased to EUR 72m in the second quarter compared to EUR 138m in the first quarter, due to reduced exposures in all risk types, in particular equity risk, and an increase in diversification. Market risk Q2 Q1 Q4 Q2 EURm 2010 10 2009 09 Total risk, VaR 72 138 114 98 Interest rate risk, VaR 56 66 111 98 Equity risk, VaR 21 63 38 18 Foreign exchange risk, VaR 24 32 19 16 Credit spread risk, VaR 31 41 24 34 Diversification effect 45% 32% 41% 41%
Balance sheet Total assets in the balance sheet increased 9% compared to at the end of the previous quarter to EUR 571bn. In addition to higher lending, the increase mainly relates to higher market values of derivatives by approx. EUR 30bn both on the asset side and the liability side of the balance sheet. As the increase reflects market values before the effect of closeout netting and collateral agreements, the increase in counterparty credit risk is considerably smaller. Capital position and risk-weighted assets At the end of the second quarter, Nordea’s risk-weighted assets (RWA) were EUR 184.9bn excluding transition rules, up 3.0% compared to the previous quarter and up 8.5% compared to one year ago, when RWA were EUR 170.4bn. During the second quarter, the changes in RWA were mainly due to corporate and retail volume growth, while rating migration was lower. RWA including transition rules amounted to EUR 205.9bn at the end of the second quarter. The core tier 1 ratio, ie excluding transition rules under Basel II, was 10.0%. The tier 1 capital ratio and the total capital ratio are well above the targets in Nordea’s capital policy. The capital base of EUR 24.3bn exceeds the Pillar 1 capital requirements of EUR 14.8bn excluding transition rules by EUR 9.5bn. The tier 1 capital of EUR 20.5bn exceeds the Pillar 1 capital requirements (excluding transitions rules) by EUR 5.7bn. Capital ratios Q2 Q1 Q4 Q2 % 2010 10 2009 09 Excluding transition rules:
Core tier 1 capital ratio 10.0 10.1 10.3 10.3
Tier 1 capital ratio 11.1 11.2 11.4 11.2 Total capital ratio 13.2 13.6 13.4 13.2 Including transition rules:
Core tier 1 capital ratio 9.0 9.2 9.3 9.2
Tier 1 capital ratio 10.0 10.1 10.2 9.9 Total capital ratio 11.8 12.3 11.9 11.7 Hybrid capital constituted 9.4% of the tier 1 capital, a portion which is low compared to the statutory limit of 30%. Economic Capital (EC) was at the end of the second quarter EUR 17.9bn, compared to EUR 17.4bn at the end of the first quarter. Nordea has received response from the Swedish FSA related to the supervisory review process (SREP). The over-all assessment is that the capital situation of Nordea is satisfactory. Nordea’s funding operations Nordea drew benefit from a strong funding name and has continued to issue long-term funding also throughout the second quarter.

Nordea Second Quarter Report 2010 8(40)
The average funding cost is increasing somewhat as maturing long-term funding is prolonged at higher market rates. Nordea issued approx. EUR 10.5bn of long-term funding in the second quarter, of which approx. EUR 3.7bn represented issuance of covered bonds in the Swedish market and EUR 2.2bn net issuance of covered bonds in the Danish market. Among the transactions in the international market, were a GBP 500m senior 5.5-year note and a CHF 350m senior 6-year note issued in April. In June, following several weeks of almost no supply in the market, Nordea reopened the senior unsecured market for financial institutions by issuing a EUR 1bn 3-year FRN and a EUR 1.25bn 10-year fixed bond. The liquidity buffer is composed of highly liquid central bank eligible securities and amounted to EUR 48.5bn at the end of the second quarter. Nordea share During the second quarter, the share price of Nordea on the NASDAQ OMX Nordic Exchange depreciated from SEK 71.25 to SEK 64.90. Total shareholder return (TSR) during the second quarter was -8.9%. Nordea was number 7 of 20 in the European peer group, where the average TSR was -14.1%. Appointments in Group Executive Management and establishing of a new area On 1 July, Nordea’s Chief Risk Officer Carl-Johan Granvik stepped down from the CRO position to retire later this year, and was replaced by Ari Kaperi, member of Group Executive Management.
On 1 September, Casper von Koskull will join Nordea’s Group Executive Management and take responsibility for the newly established area Corporate Merchant Banking & Capital Markets. The new area Corporate Merchant Banking & Capital Markets is established to further build on Nordea’s relationship banking approach, and to ensure that all service and product competencies of Nordea reach the large corporate customers. This area will include the present Corporate Merchant Banking, Financial Institutions and Capital Markets Products divisions. These divisions will have unchanged roles in the operating model with Corporate Merchant Banking continuing to cooperate closely with Nordic Banking and Capital Markets Products continuing to serve all customer segments. Outlook 2010 Nordea expects the macroeconomic recovery to continue in 2010. Although the global development is still fragile and hence uncertainty remains, the outlook for the Nordic markets has improved during the year. Excluding currency effects in 2010, Nordea expects cost growth to be broadly in line with 2009, including the effects from growth and efficiency initiatives. Nordea expects risk-adjusted profit to be lower in 2010 compared to 2009, due to lower income in Treasury and Markets. Net loan losses in 2010 are expected to be lower than in 2009. Credit quality continues to stabilise, in line with the macroeconomic recovery.
Quarterly development, Group
Q2 Q1 Q4 Q3 Q2 Jan-Jun Jan-JunEURm 2010 2010 2009 2009 2009 2010 2009Net interest income 1,249 1,235 1,299 1,321 1,305 2,484 2,661Net fee and commission income 538 475 463 437 412 1,013 793Net result from items at fair value 339 548 351 486 594 887 1,109Equity method 7 25 15 7 17 32 26Other operating income 28 20 30 26 31 48 49Total operating income 2,161 2,303 2,158 2,277 2,359 4,464 4,638
General administrative expenses: Staff costs -701 -687 -702 -670 -687 -1,388 -1,352 Other expenses -445 -438 -471 -382 -392 -883 -786Depreciation of tangible and intangible assets -40 -39 -46 -35 -37 -79 -68Total operating expenses -1,186 -1,164 -1,219 -1,087 -1,116 -2,350 -2,206
Profit before loan losses 975 1,139 939 1,190 1,243 2,114 2,432Net loan losses -245 -261 -347 -358 -425 -506 -781Operating profit 730 878 592 832 818 1,608 1,651Income tax expense -191 -235 -145 -206 -200 -426 -406Net profit for the period 539 643 447 626 618 1,182 1,245Diluted earnings per share (EPS), EUR 0.13 0.16 0.11 0.15 0.15 0.29 0.34EPS, rolling 12 months up to period end, EUR 0.55 0.57 0.60 0.68 0.72 0.55 0.72

Nordea Second Quarter Report 2010 9(40)
Customer areas Nordic Banking The number of Gold and Private Banking customers increased by 67,000 during the second quarter 2010. This is the highest increase ever during a quarter, even when adjusting for the new customers from the integration of Fionia Bank in Denmark. The underlying annualised growth rate was 6%. Around 75% of the new Gold and Private Banking customers were new customers to Nordea, including the customers from Fionia Bank. The second quarter showed a significant increase in the number of proactive customer meetings with both household and corporate customers compared with the same period last year. Both household lending and deposit market shares increased as well as corporate lending market shares. Total income increased 7% compared to the previous quarter, with increases in all revenue lines. Net interest income increased 2%, since increased volumes more than compensated for the pressure on margins.
Adjusted for the so-called lag effect in Norway, household mortgage margins are largely unchanged from the previous quarter. Income from corporate customers increased 10%, with corporate lending and capital markets products as main income drivers. The strongest income growth was in the corporate merchant banking (CMB) segment.
Income related to the household segment increased compared to the previous quarter. Income from lending and savings products increased, while income from deposits decreased following continued fierce price competition. Total net sales of savings products to household customers continued at a high level during the second quarter and amounted to EUR 3.2bn. Expenses decreased 1% from the previous quarter. Total net loan losses decreased compared to the previous quarter. The loan loss ratio was 35 basis points including provisions related to the Danish guarantee scheme and 25 basis points excluding these. Net loan losses were up in Denmark due to the guarantee scheme provisions but down excluding these, and were unchanged in Finland and down in Norway and Sweden.
Nordic Banking, operating profit, volumes and margins
Q2 Q1 Q4 Q3 Q2 Q210/ Q210/EURm 2010 2010 2009 2009 2009 Q110 Q209Net interest income 951 936 978 988 983 2% -3%Net fee and commission income 491 432 418 373 365 14% 35%Net result from items at fair value 173 139 138 122 150 24% 15%Equity method & other income 22 16 19 6 17 38% 29%Total income incl. allocations 1,637 1,523 1,553 1,489 1,515 7% 8%Staff costs -311 -303 -356 -292 -290 3% 7%Total expenses incl. allocations -862 -874 -885 -780 -776 -1% 11%Profit before loan losses 775 649 668 709 739 19% 5%Net loan losses -200 -209 -267 -263 -334 -4% -40%Operating profit 575 440 401 446 405 31% 42%Cost/income ratio, % 53 57 57 52 51RAROCAR, % 16 13 14 15 16Number of employees (FTEs) 16,528 16,570 16,575 16,397 16,796 0% -2%Volumes, EURbn:Lending to corporates 115.1 110.9 107.1 107.4 108.1 4% 6%Lending to households 128.8 123.9 119.5 116.1 111.1 4% 16%Total Lending 243.9 234.8 226.6 223.5 219.2 4% 11%Corporate deposits 55.8 56.7 57.3 52.9 53.0 -2% 5%Household deposits 71.8 68.7 68.3 66.7 65.8 5% 9%Total deposits 127.6 125.4 125.6 119.6 118.8 2% 7%Margins, %:Corporate lending 1.48 1.48 1.43 1.42 1.34Household mortgage lending 0.81 0.84 0.82 0.87 0.90Consumer lending 4.07 4.03 4.06 4.04 3.87Total lending margins 1.43 1.45 1.41 1.43 1.38Corporate deposits 0.16 0.19 0.21 0.23 0.34Household deposits 0.01 0.04 0.08 0.14 0.37Total deposits margins 0.08 0.11 0.14 0.18 0.35Historical information has been restated due to organisational changes and changed allocation principles.
Yield fees have been remapped between net interest income and net commission income and has been removed from margins.
Change

Nordea Second Quarter Report 2010 10(40)
Banking Denmark Business development Banking Denmark continued to increase business volumes as well as the customer base in the second quarter. All market shares increased further and the number of Gold customers increased by 33,600, including customers from Fionia. The underlying annualised growth rate was 5%. The margins on corporate lending were maintained at the level from first quarter in an environment where competition is picking up in a market still influenced by the economic slowdown. The integration of Fionia Bank proceeded successfully in the second quarter. All branches have been re-branded and all customer data was moved to Nordea’s systems during May, and all products and services are now based on the Nordea platform.
Result Total income in the second quarter was up 6% compared to the first quarter. The interest rate level was lower than in the first quarter, which resulted in lower deposit margins. On the back of the historically low interest rate level savings income has risen due to customers seeking alternatives to traditional deposit accounts. Also in the wake of the low interest level, household mortgage refinancing has picked-up somewhat. Net result on items at fair value was at a higher level than in the first quarter and up 31% compared to the second quarter 2009. Total expenses were unchanged from the previous quarter. The total number of employees (FTEs) was slightly lower than in the first quarter, in line with the efficiency strategy for the branch network. Net loan losses were EUR 137m, including provisions related to the Danish guarantee scheme of EUR 58m (EUR 0m in the first quarter). The loan loss ratio was 45 basis points excluding the guarantee-related provisions (66 basis points in the first quarter) and 78 basis points including these.
Banking Denmark, operating profit, volumes, margins and market shares
Q2 Q1 Q4 Q3 Q2 Q210/ Q210/EURm 2010 2010 2009 2009 2009 Q110 Q209Net interest income 324 325 354 351 346 0% -6%Net fee and commission income 100 90 91 77 72 11% 39%Net result from items at fair value 63 52 35 42 48 21% 31%Equity method & other income 20 13 15 5 14 54% 43%Total income incl. allocations 507 480 495 475 480 6% 6%Staff costs -105 -103 -112 -96 -98 2% 7%Total expenses incl. allocations -260 -261 -256 -237 -235 0% 11%Profit before loan losses 247 219 239 238 245 13% 1%Net loan losses -137 -115 -153 -143 -207 19% -34%Operating profit 110 104 86 95 38 6% 189%Cost/income ratio, % 51 54 52 50 49RAROCAR, % 18 16 20 19 20Number of employees (FTEs) 5,149 5,164 5,191 4,962 5,054 0% 2%Volumes, EURbn:Lending to corporates 31.2 30.1 30.5 29.6 30.4 4% 3%Lending to households 41.7 40.7 40.3 39.2 38.5 2% 8%Total Lending 72.9 70.8 70.8 68.8 68.9 3% 6%Corporate deposits 13.2 13.4 13.9 13.2 13.6 -1% -3%Household deposits 23.5 22.1 22.4 20.6 20.7 6% 14%Total deposits 36.7 35.5 36.3 33.8 34.3 3% 7%Margins, %:Corporate lending 1.73 1.73 1.65 1.66 1.57 Q210 Q110 Q209Household mortgage lending 0.50 0.50 0.49 0.49 0.49 20.9 20.8 20.4Consumer lending 4.70 4.65 4.71 4.73 4.51 16.7 16.4 15.8Total lending margins 1.63 1.64 1.58 1.57 1.50 15.7 15.6 15.5Corporate deposits 0.18 0.22 0.21 0.25 0.31 23.9 22.8 26.2Household deposits 0.01 0.11 0.19 0.45 0.80 22.5 21.7 21.3Total deposits margins 0.09 0.16 0.20 0.35 0.54 1) Excl. Financial institutionsHistorical information has been restated due to organisational changes and changed allocation principles.
Yield fees have been remapped between net interest income and net commission income.
Househ.lendingHH mortg.lendingCorp.deposits 1)
Househ.deposits
Change
Market shares, %:
Corp.lending 1)

Nordea Second Quarter Report 2010 11(40)
Banking Finland Business development Growth Plan Finland is progressing according to plan, the number of Gold customers increased by 12,000 during the second quarter, clearly higher than the increase in the first quarter. The annualised growth rate was 5%. The number of household and corporate customer meetings remained at a higher level than last year also during the second quarter. Market shares for both household and corporate customers increased during the second quarter, with corporate deposits as the exception, due to fierce price competition. Corporate lending volume increased during the second quarter, due to increased activity in the corporate sector. Margins increased as a result of continued re-pricing of the lending stock. Deposits continued to be the most competitive area during the second quarter, where the rates offered to customers continued to put pressure on margins. Nordea has been the leading bank for the Single European Payment Area (SEPA) introduction and implementation in
Finland, which has supported the positive development in cash management. In the end of the second quarter, Nordea had over 7,000 corporate customers using SEPA services, over 2 million monthly SEPA transactions and Nordea was ranked third among European banks in terms of number of SEPA transactions. The recruitment of advisers and specialists as well as renewals in the branch offices in Helsinki area and other growth areas continued during the second quarter to support the structural change and growth. Result Total income decreased slightly from the previous quarter. Net interest income from lending increased, driven by the volume development. Savings commission income increased significantly from the previous quarter, however without fully compensating for a decrease in mainly lending commissions. Staff costs were close to unchanged from the previous quarter, despite an increase in the number of full-time employees by 47. Net loan losses were EUR 55m, arising mainly from the corporate sector. The loan loss ratio was 45 basis points (45 basis points in the first quarter).
Banking Finland, operating profit, volumes, margins and market shares
Q2 Q1 Q4 Q3 Q2 Q210/ Q210/EURm 2010 2010 2009 2009 2009 Q110 Q209Net interest income 189 190 193 199 204 -1% -7%Net fee and commission income 131 132 119 109 112 -1% 17%Net result from items at fair value 35 36 39 29 45 -3% -22%Equity method & other income 1 1 1 0 2 0% -50%Total income incl. allocations 356 359 352 337 363 -1% -2%Staff costs -73 -72 -91 -77 -72 1% 1%Total expenses incl. allocations -212 -213 -224 -195 -192 0% 10%Profit before loan losses 144 146 128 142 171 -1% -16%Net loan losses -55 -55 -42 -50 -44 0% 25%Operating profit 89 91 86 92 127 -2% -30%Cost/income ratio, % 60 59 64 58 53RAROCAR, % 12 14 12 13 17Number of employees (FTEs) 5,216 5,169 5,148 5,085 5,288 1% -1%Volumes, EURbn:Lending to corporates 23.9 23.3 22.6 23.1 24.4 3% -2%Lending to households 28.9 27.7 27.4 27.0 26.5 4% 9%Total Lending 52.8 51.0 50.0 50.1 50.9 4% 4%Corporate deposits 14.1 14.1 13.6 12.4 12.5 0% 13%Household deposits 23.2 22.3 22.1 21.8 22.1 4% 5%Total deposits 37.3 36.4 35.7 34.2 34.6 2% 8%Margins, %:Corporate lending 1.44 1.40 1.32 1.27 1.14 Q210 Q110 Q209Household mortgage lending 0.81 0.82 0.83 0.90 0.86 34.7 34.6 35.5Consumer lending 3.39 3.36 3.48 3.44 3.23 30.8 30.7 30.3Total lending margins 1.38 1.37 1.36 1.36 1.25 30.9 30.7 30.4Corporate deposits 0.06 0.08 0.14 0.18 0.40 38.9 39.8 41.7Household deposits -0.17 -0.13 -0.07 -0.05 0.26 31.5 31.2 31.5Total deposits margins -0.08 -0.05 0.01 0.03 0.31 1) Excl. Financial institutionsHistorical information has been restated due to organisational changes and changed allocation principles.
Yield fees have been remapped between net interest income and net commission income.
Change
Market shares, %:
Corp.lending 1)
Househ.lendingHH mortg.lendingCorp.deposits 1)
Househ.deposits

Nordea Second Quarter Report 2010 12(40)
Banking Norway Business development Pro-activity towards household and corporate relationship customers improved further during the quarter. Corporate lending and deposit volumes developed positively. Competition remained fierce and margins on both lending and deposits were down. As a result of improved pro-activity towards corporate customers, fee and commission income and net result from items at fair value increased significantly. The number of Gold customers increased 5,200 in the second quarter, a 9% annualised growth rate. Acquisitions of new customers made a significant contribution. Growth in household lending continued during the quarter. Nordea’s market share for household mortgage lending continued to increase. Household deposit volumes increased during the quarter. Household savings commission income increased further from an already high level in previous quarters. Improved pro-activity towards Gold and Private Banking customers
is a key factor explaining the growth. The long-term focus on reduction of manual cash services in branches has resulted in 19% reduction in manual cash-transactions during the last year and today close to 40% of branches are without manual cash services. Result Total income increased by 10% from the previous quarter and by 7% from the second quarter last year (down 4% in local currency). The increase from the previous quarter was driven by net fee and commission income, much related to capital markets and savings commission income. The underlying household mortgage lending margins (adjusted for the six weeks notice) was down 7 basis points. Total expenses were down 5% from previous quarter, due to lower costs in centralised back-office functions and that the total number of full-time employees was down 1%. Reallocation of resources from low-growth to high-growth areas continued. Net loan losses were EUR 7m. The loan loss ratio was 7 basis points (22 basis points in the first quarter).
Banking Norway, operating profit, volumes, margins and market shares
Q2 Q1 Q4 Q3 Q2 Q210/ Q210/EURm 2010 2010 2009 2009 2009 Q110 Q209Net interest income 187 187 189 193 192 0% -3%Net fee and commission income 70 51 56 50 49 37% 43%Net result from items at fair value 29 20 31 20 26 45% 12%Equity method & other income 0 2 2 1 1 -100% -100%Total income incl. allocations 286 260 278 264 268 10% 7%Staff costs -46 -46 -54 -41 -42 0% 10%Total expenses incl. allocations -130 -137 -141 -117 -118 -5% 10%Profit before loan losses 156 123 137 147 150 27% 4%Net loan losses -7 -23 -47 -31 -35 -70% -80%Operating profit 149 100 90 116 115 49% 30%Cost/income ratio, % 46 53 51 44 44RAROCAR, % 15 11 12 13 15Number of employees (FTEs) 1,791 1,810 1,803 1,834 1,870 -1% -4%Volumes, EURbn:Lending to corporates 23.8 22.3 21.7 22.0 21.4 7% 11%Lending to households 23.0 22.1 20.8 19.7 18.3 4% 26%Total Lending 46.8 44.4 42.5 41.7 39.7 5% 18%Corporate deposits 14.0 13.8 14.0 13.4 12.7 1% 10%Household deposits 8.2 7.7 7.6 7.6 7.3 6% 12%Total deposits 22.2 21.5 21.6 21.0 20.0 3% 11%Margins, %:Corporate lending 1.56 1.61 1.60 1.61 1.60 Q210 Q110 Q209Household mortgage lending 1.07 1.24 1.16 1.33 1.55 14.7 14.8 15.5Consumer lending 7.52 7.46 7.43 7.52 7.41 11.3 11.2 11.1Total lending margins 1.48 1.59 1.55 1.65 1.74 11.7 11.6 11.3Corporate deposits 0.22 0.27 0.26 0.23 0.30 16.3 17.2 17.7Household deposits 0.14 0.04 -0.04 -0.20 -0.28 8.7 8.7 8.7Total deposits margins 0.19 0.19 0.16 0.08 0.10 1) Excl. Financial institutionsHistorical information has been restated due to organisational changes and changed allocation principles.
Yield fees have been remapped between net interest income and net commission income and has been removed from margins.
Change
Market shares, %:
Corp.lending 1)
Househ.lendingHH mortg.lendingCorp.deposits 1)
Househ.deposits

Nordea Second Quarter Report 2010 13(40)
Banking Sweden Business development Intense business activity continued in the second quarter, resulting in strong growth in income and profit, as well as a continued increase in market shares (except in household deposits). The growth in number of Gold customers continued, with a total of 14,800 new Gold customers in the second quarter. The annualised growth rate was 7%. The high ambition and strategic focus in the CMB segment materialised in the second quarter in a number of large corporate transactions, including successes in cash management and structured finance. Activity towards customers in the household segment was high in all areas, which led to a continued high growth rate in mortgage lending and investment products. Customers continue to transfer from fixed-rate deposits to investment products, which is also reflected in growing market shares for various categories of investment products, but decreasing market share for deposit products.
In the corporate sector, the demand for new lending continued to increase and margins were largely unchanged. Corporate deposit margins were stable in the second quarter, while volumes decreased somewhat. Result Following the strong development in business activity and business volumes, total income was up 15% compared to the previous quarter and 23% from the second quarter last year (up 10% in local currency when comparing to Q2 2009). Net interest income increased 8% following growing volumes at increasing margins. Net fee and commission income grew by 19%, following a number of large lending transactions in the capital markets in combination with strong development in the savings area. Net fair value result improved by 48%, reflecting a higher momentum in the capital markets for derivates and FX. Net loan losses continued to decrease and in the second quarter reversals of allowances were in line with new loan loss provisions. The loan loss ratio was 0 basis points (8 basis points in the first quarter).
Banking Sweden, operating profit, volumes, margins and market shares
Q2 Q1 Q4 Q3 Q2 Q210/ Q210/EURm 2010 2010 2009 2009 2009 Q110 Q209Net interest income 240 222 228 228 224 8% 7%Net fee and commission income 190 160 153 138 132 19% 44%Net result from items at fair value 46 31 33 31 31 48% 48%Equity method & other income 0 0 0 0 0 #DIV/0! #DIV/0!Total income incl. allocations 476 413 414 397 387 15% 23%Staff costs -87 -82 -98 -76 -77 6% 13%Total expenses incl. allocations -250 -254 -249 -219 -216 -2% 16%Profit before loan losses 226 159 165 178 171 42% 32%Net loan losses 0 -13 -22 -38 -45 -100% -100%Operating profit 226 146 143 140 126 55% 79%Cost/income ratio, % 53 62 60 55 56RAROCAR, % 17 12 14 14 15Number of employees (FTEs) 4,370 4,425 4,430 4,513 4,580 -1% -5%Volumes, EURbn:Lending to corporates 36.2 35.2 32.4 32.7 32.0 3% 13%Lending to households 35.2 33.4 30.9 30.2 27.7 5% 27%Total Lending 71.4 68.6 63.3 62.9 59.7 4% 20%Corporate deposits 14.4 15.3 16.0 13.9 14.1 -6% 2%Household deposits 17.0 16.6 16.1 16.7 15.7 2% 8%Total deposits 31.4 31.9 32.1 30.6 29.8 -2% 5%Margins, %:Corporate lending 1.24 1.23 1.19 1.18 1.10 Q210 Q110 Q209Household mortgage lending 0.95 0.92 0.91 0.89 0.88 17.3 17.2 16.9Consumer lending 2.76 2.73 2.66 2.61 2.53 14.0 13.8 13.7Total lending margins 1.23 1.21 1.19 1.17 1.13 15.0 14.9 14.8Corporate deposits 0.18 0.19 0.24 0.26 0.36 18.8 18.5 19.9Household deposits 0.21 0.20 0.25 0.28 0.43 16.7 17.3 18.2Total deposits margins 0.20 0.19 0.24 0.27 0.40 1) Excl. Financial institutionsHistorical information has been restated due to organisational changes and changed allocation principles.
Yield fees have been remapped between net interest income and net commission income.
Househ.lendingHH mortg.lendingCorp.deposits 1)
Househ.deposits
Change
Market shares, %:
Corp.lending 1)

Nordea Second Quarter Report 2010 14(40)
Institutional & International Banking
Total income in Institutional & International Banking increased 5% from the first quarter, following higher income in all three divisions. Net loan losses decreased
somewhat, both in Shipping, Oil Services & International and in the Baltic countries.
Institutional & International Banking, operating profit and volumes
Q2 Q1 Q4 Q3 Q2 Q210/ Q210/EURm 2010 2010 2009 2009 2009 Q110 Q209Net interest income 217 208 203 192 188 4% 15%Net fee and commission income 78 67 79 63 62 16% 26%Net result from items at fair value 73 58 61 62 85 26% -14%Equity method -5 12 -1 -1 0 -142% #DIV/0!Other income 5 4 15 19 21 25% -76%Total income incl. allocations 368 349 357 335 356 5% 3%Staff costs -57 -52 -51 -46 -48 10% 19%Total expenses incl. allocations -137 -127 -135 -118 -123 8% 11%Profit before loan losses 231 222 222 217 233 4% -1%Net loan losses -45 -52 -84 -96 -45 -13% 0%Operating profit 186 170 138 121 188 9% -1%Cost/income ratio, % 37 36 38 35 35RAROCAR, % 22 23 26 27 31Number of employees (FTEs) 5,192 5,141 5,131 5,041 5,086Volumes, EURbn:Total lending 34.9 33.7 32.5 32.1 32.9 4% 6%Total deposits 18.6 18.2 18.5 19.4 22.0 2% -15%Historical deposit volumes have been restated since certificates of deposits have been excluded from Financial Institutions.
Change
Shipping, Oil Services & International Business development Nordea drew benefit from its strong position in the shipping, offshore and oil services industry, and income picked up after a slow first quarter. Main drivers were increased income from capital markets products and lending fees, reflecting a number of new transactions being signed. Lending volumes increased slightly compared to one year ago, following the strengthened USD against the EUR, which also contributed positively to income. The upward trend in lending margins continued in the quarter, while margins on deposits were stable. Important shipping segments like crude tanker and dry bulk continued to show decent rate levels in the second quarter. However, demand is expected to develop modestly in advanced economies and stimulus to shipping seems contingent upon firm growth particularly in China. Fleet growth remained modest in the tanker segments in the two first quarters of the year, supported by considerable scrapping. The dry bulk segment, on the contrary, experienced considerable fleet growth, with a 15% annualised growth rate in the first half of 2010. Overcapacity, combined with high exposure to Chinese demand, pose a risk to the prospects in this segment. Challenges continue for offshore and oil services
companies. The oil disaster in the Gulf of Mexico creates uncertainty for the sector going forward. While it is hard to predict the long-term impact this may have on oil services, it certainly will put environmental issues in the spotlight and raise concerns on new safety regulations on deep-water drilling to be imposed. The volume of executed new transactions continued to increase in the second quarter indicating a pick-up from last year’s low levels as confidence slowly returns to the market. Transactions are still executed on conservative structures, while increased activity among the shipping banks is noted. Nordea’s exposure to the shipping, offshore and oil services industries is well diversified. Supporting the core customers is paramount. Proactive risk management and stringent handling of the existing portfolio remains vital given the market development. At the end of the second quarter, impaired loans gross amounted to EUR 298m or 202 basis points of total loans, compared with 169 basis points in previous quarter. Result Total income was EUR 106m, up 19% from the previous quarter. Operating profit was EUR 79m. The loan loss ratio was 34 basis points compared with 59 basis points in the previous quarter. Net loan loss provisions amounted to EUR 11m, down from the previous quarters.

Nordea Second Quarter Report 2010 15(40)
Financial Institutions Business development Despite signs of continuing recovery, the financial markets remained hesitant with regard to the financial stability of the so-called PIIGS countries. Consequently, investors increasingly started to shift towards safe havens, as illustrated by the strengthened US dollar. Overall, the financial markets have lost momentum, partly due to heightened risk for political intervention and tighter regulations in the wake of speculations on possible sovereign defaults. The resulting risk aversion among institutional investors led to a largely directionless market in the quarter and relatively low activity. An increased activity in the Nordic markets among global financial institutions was taken on a positive note in Nordea, as business volumes in the international customer segment increased. During the second quarter, Nordea’s Emerging Markets business saw a pickup in trade finance as well as export
finance volumes, with the strengthening of international trade as economic conditions gradually improved. Nordea’s standing in financial markets was once again confirmed in April, as Money Markets magazine awarded Nordea for “Client Service Excellence” and as “Custodian of the year in the Nordic markets”, illustrating the strength of the relationship coverage as well as Nordea’s position within Nordic securities’ infrastructure. Result Market activity remained moderate among financial institutions as the market took an uncertain view of the euro. Despite a relatively slow market environment, Nordea gained market share, underlined by increased net result from items at fair value compared to the previous quarter. Total income was EUR 104m, up 12% from the previous quarter. Operating profit was EUR 57m.
Shipping, Oil Services & International and Financial Institutions, operating profit, volumes and margins by area
Q2 Q1 Q4 Q3 Q2 Q210/ Q210/ Q2 Q1 Q4 Q3 Q2 Q210/ Q210/EURm 2010 2010 2009 2009 2009 Q110 Q209 2010 2010 2009 2009 2009 Q110 Q209Net interest income 79 75 77 70 67 5% 18% 16 15 17 16 19 7% -16%Net fee and commission income 18 7 15 15 9 157% 100% 42 39 37 36 41 8% 2%Net result from items at fair value 9 7 14 4 16 29% -44% 46 36 34 39 50 28% -8%Equity method 0 0 0 0 0 #DIV/0! #DIV/0! 0 0 0 0 0 #DIV/0! #DIV/0!Other operating income 0 0 1 0 0 #DIV/0! #DIV/0! 0 3 12 17 20 -100% -100%Total income incl. allocations 106 89 107 89 92 19% 15% 104 93 100 108 130 12% -20%Staff costs -12 -9 -11 -10 -10 33% 20% -8 -8 -8 -8 -8 0% 0%Other expenses incl. depr. -4 -3 -2 -2 -3 33% 33% -39 -39 -40 -39 -40 0% -3%Expenses incl. allocations -16 -12 -13 -12 -13 33% 23% -47 -47 -48 -47 -48 0% -2%Profit before loan losses 90 77 94 77 79 17% 14% 57 46 52 61 82 24% -30%Net loan losses -11 -19 -13 -27 -24 -42% -54% 0 0 -2 -2 0Operating profit 79 58 81 50 55 36% 44% 57 46 50 59 82 24% -30%
Cost/income ratio, % 15 13 12 13 14 45 51 48 44 37RAROCAR, % 17 22 27 27 28 34 24 36 40 69Lending, EURbn 14.7 13.5 12.9 12.8 13.5 9% 9% 3.9 4.4 3.9 3.9 4.0 -11% -3%Deposits, EURbn 4.8 4.6 4.4 4.8 5.3 4% -9% 9.3 8.9 9.0 10.2 12.2 4% -24%Number of employees (FTEs) 320 311 304 305 303 387 388 410 412 433
Margins, %:Corporate lending 1.84 1.76 1.70 1.53 1.44 0.90 0.82 0.81 0.66 0.77Corporate deposits 0.14 0.14 0.14 0.15 0.16 0.15 0.17 0.17 0.19 0.22
Historical deposit volumes in Financial Institutions have been restated since certificates of deposits have been excluded.
Change Shipping, Oil Services & International
Change Financial Institutions

Nordea Second Quarter Report 2010 16(40)
New European Markets Business development In the second quarter, the positive income development continued in New European Markets, while business volumes grew moderately. Expenses were somewhat higher following ongoing growth investments. Positive signs were recorded in all economies in the New European Markets area. Corporate lending margins decreased somewhat in the second quarter as competition for the strongest customers increased, mainly in Russia. Household lending margins were stable. Competition for deposits remained intense in all countries. Baltic countries The economies of the Baltic countries start to show signs of stabilisation, even if the recovery is expected to be uneven and fragile. Lending as well as deposit volumes were marginally lower in the second quarter, while margins were stable. Income increased by 7% compared to the previous quarter as a result of higher net interest income and improved net fair value result. Loan loss provisions were lower than in the first quarter, reflecting the improved economic climate. Consequently, operating profit turned positive. Poland The Polish economy continues to grow and a solid outlook for 2010 was confirmed in the second quarter. Lending as well as deposit volumes were fairly unchanged in EUR. Excluding currency effects, the business volumes continued to increase, driven by an increase in the household segment. Lending and deposit margins were stable compared to previous quarter. Income increased by 18% compared to the previous quarter and by 51% compared to the second quarter last year. Nordea continued to gain market shares in selected segments and attracted new customers in the quarter. The number of Gold customers increased by some 3,600 compared to the first quarter. Nordea Poland continues to receive recognition in the Polish market and was runner up in the “Large Banks” category in Gazeta Bankowa’s yearly contest in June. Preparations for additional branch network expansion continued and the first branches are scheduled to be opened in the third quarter. Russia The Russian economy also shows clear signs of recovery. Lending volumes increased compared to the first quarter, partly as a result of currency effects, while margins decreased as a result of increasing competition towards top-tier corporate customers.
Income was somewhat lower than in the first quarter, but 11% higher than in the second quarter of last year. Net interest income increased, but volatility in the financial markets negatively impacted result on items at fair value. Nordea continued to expand the business relationships within the targeted customer segments during the quarter. Credit quality Provisions for loan losses in the Baltic countries amounted to EUR 22m in the quarter, EUR 10m lower than in the first quarter, with the highest provisions being in Latvia. The provisions for Poland and Russia were limited, confirming the strong credit quality in these countries. Impaired loans in the Baltic countries decreased by EUR 27m to EUR 614m, compared to the first quarter. This amount equals 808 basis points of total loans, compared with 822 basis points at the end of the first quarter. Total allowances for the Baltic countries at the end of the second quarter corresponded to 457 basis points of loans. The provisioning ratio in the Baltic countries was 57%, to be compared with 53% at the end of the first quarter. The loan loss ratio was 114 basis points for the Baltic countries, while it was 79 basis points for New European Markets in total. Baltic countries, net loan losses and impaired loans Q2 Q1 Q4 Q3 Q2 2010 10 2009 09 09 Net loan losses EURm¹ 22 32 65 62 41 of which collective¹ 4 2 24 24 18 Loan loss ratio, basis
points¹
114
166
338 322 214
Gross impaired loans, EURm
614
641
535 522 418
Impaired loans ratio gross, basis points
808
822
733 705 550
Total allowances, EURm 347 339 319 263 202 Total allowance ratio,
basis points
457
435
437 355 266
Provisioning ratio² 57% 53% 60% 50% 48% ¹ Net loan losses and loan loss ratio 2009 including collective provisions for the Baltic countries reported in the unit IIB Other. ² Total allowances in relation to gross impaired loans. Result Total income increased by 6% compared to previous quarter and was 20% higher than in the second quarter of last year. Net interest income increased by 3% compared to the first quarter. Total expenses increased by 4% compared to the first quarter. The total number of employees (FTEs) increased by 44, reflecting ongoing growth initiatives in Russia and Poland. Higher income and lower loan loss provisions had a positive impact on operating profit, which increased by 17% compared with the first quarter.

Nordea Second Quarter Report 2010 17(40)
New European Markets, operating profit, volumes and margins by area
Q2 Q1 Q4 Q3 Q2 Q210/ Q210/ Q2 Q1 Q4 Q3 Q2EURm 2010 2010 2009 2009 2009 Q110 Q209 2010 2010 2009 2009 2009Net interest income 122 118 109 106 101 3% 21% 0 0 0 0 1Net fee and commission inc. 18 20 20 14 15 -10% 20% 0 1 7 -2 -3Net result from items at fair value 18 15 13 19 19 20% -5% 0 0 0 0 0Equity method 0 0 0 0 0 ###### ###### -5 12 -1 -1 0Other operating income 5 1 2 2 1 400% 400% 0 0 0 0 0Total income incl. alloc. 163 154 144 141 136 6% 20% -5 13 6 -3 -2Staff costs -34 -34 -28 -27 -29 0% 17% -3 -1 -4 -1 -1Other expenses incl. depr. -36 -33 -42 -34 -31 9% 16% -1 0 0 0 -1Expenses incl. allocations -70 -67 -70 -61 -60 4% 17% -4 -1 -4 -1 -2Profit before loan losses 93 87 74 80 76 7% 22% -9 12 2 -4 -4Net loan losses -31 -34 -69 -56 -39 -9% -21% -3 1 0 -13 18Operating profit 62 53 5 24 37 17% 68% -12 13 2 -17 14
Cost/income ratio, % 43 44 49 43 44RAROCAR, % 23 22 20 25 23Lending, EURbn 16.3 15.8 15.7 15.4 15.4 3% 6%Deposits, EURbn 4.5 4.7 5.1 4.4 4.5 -4% 0%Number of employees (FTEs) 4,479 4,435 4,410 4,316 4,343 6 7 7 8 7
Margins, %:Corporate lending 2.29 2.37 2.38 2.34 2.03Household lending 1.84 1.83 1.79 1.68 1.58Corporate deposits 0.51 0.58 0.74 1.06 1.13Household deposits 0.35 0.27 0.43 0.51 0.44
Q2 Q1 Q4 Q3 Q2 Q2 Q1 Q4 Q3 Q2 Q2 Q1 Q4 Q3 Q2EURm 2010 2010 2009 2009 2009 2010 2010 2009 2009 2009 2010 2010 2009 2009 2009Net interest income 35 33 29 25 27 30 30 29 23 20 57 55 51 57 54Net fee and commission inc. 10 12 11 8 9 6 5 5 5 5 3 3 4 2 1Net result from items at fair value 1 -2 -2 4 9 13 9 9 10 9 3 8 6 6 2Equity method 0 0 0 0 0 0 0 0 0 0 0 0 0 0 0Other operating income 0 0 0 0 0 4 1 1 1 1 0 0 1 0 0Total income incl. alloc. 46 43 38 37 45 53 45 44 39 35 63 66 62 65 57Staff costs -7 -7 -4 -7 -8 -10 -10 -10 -9 -9 -15 -15 -12 -10 -11Other expenses incl. depr. -12 -11 -16 -12 -9 -15 -14 -17 -11 -13 -8 -7 -10 -6 -7Expenses incl. allocations -19 -18 -20 -19 -17 -25 -24 -27 -20 -22 -23 -22 -22 -16 -18Profit before loan losses 27 25 18 18 28 28 21 17 19 13 40 44 40 49 39Net loan losses -22 -32 -65 -47 -36 -2 0 -1 0 0 -6 -2 -3 -7 -3Operating profit 5 -7 -47 -29 -8 26 21 16 19 13 34 42 37 42 36
Cost/income ratio, % 41 42 53 51 38 47 53 61 51 63 37 33 35 25 32RAROCAR, % 12 13 9 10 13 28 21 18 21 16 35 36 40 47 48Lending, EURbn 7.6 7.8 7.7 7.8 8.1 4.6 4.5 4.6 4.1 3.8 4.1 3.5 3.4 3.5 3.5Deposits, EURbn 1.7 1.8 2.0 1.8 2.0 2.0 2.1 2.1 1.9 1.9 0.8 0.8 1.0 0.7 0.6Number of employees (FTEs) 1,144 1,154 1,148 1,133 1,134 1,656 1,627 1,630 1,619 1,643 1,648 1,628 1,613 1,545 1,544
In addition to net loan losses in the Baltic countries, collective provisions for the Baltic countries are reported under IIB Other.
Furthermore, changes in the country risk reserve relating to Emerging Markets is also reported under IIB Other.
New European Markets IIB OtherChange
Baltic countries Poland Russia

Nordea Second Quarter Report 2010 18(40)
Other customer operations The customer operations, which are not included in Nordic Banking or Institutional & International Banking, are included under Other customer operations, as well as results not allocated to any of the two main customer areas. International Private Banking & Funds Renewed uncertainty in the financial markets during the second quarter slowed down private banking customer activities and in consequence net flow and performance. Within International Private Banking, Assets under Management (AuM) remained unchanged at EUR 9.2bn compared to end of the previous quarter. Customer activities within Fund Distribution were also impacted by the sentiment in the financial markets; nevertheless, a net inflow of EUR 0.5bn was captured and AuM increased to EUR 4.4bn, up 13% from previous quarter. Total AuM in International Private Banking & Funds were EUR 13.6bn, up EUR 0.4bn or 3% from the end of the previous quarter. The combined result for International Private Banking & Funds was EUR 15m, up 15% from the first quarter.
Life customer operations The customer operation Life includes the Life Insurance operations outside Nordea Bank’s branch distribution network, including sales to Nordic customers through Life & Pensions’ own sales force, brokers and tied agents, and the Polish life business, and is included in the product result for Life & Pensions, see page 22. Life & Pensions’ operations generated income of EUR 96m and operating profit of EUR 40m, down 19% and 38% respectively from the previous quarter, mainly due to lower profit-sharing contribution and return on equity following the volatility in the financial markets. Capital Markets unallocated The customer operations “Capital Markets unallocated” mainly includes the part of the result in Capital Markets Products (see page 21), which is not allocated to Nordic Banking or Institutional & International Banking. Net result from items at fair value decreased, due to a more challenging environment for the risk management and trading in connection with managing the risk inherent in customer transactions. The net fair value result decreased 66% to EUR 60m and total income decreased to EUR 38m.
Other customer operations, by unit
Q2 Q1 Q4 Q3 Q2 Q2 Q1 Q4 Q3 Q2 Q2 Q1 Q4 Q3 Q2EURm 2010 2010 2009 2009 2009 2010 2010 2009 2009 2009 2010 2010 2009 2009 2009Net interest income 7 10 10 11 9 0 0 0 0 0 6 27 16 13 11Net fee and commission inc. 23 18 13 16 17 4 17 3 16 15 -28 -39 -20 -25 -15Net result from items at fair value 6 6 10 8 7 88 98 93 99 54 60 179 130 204 227Equity method 0 0 0 0 0 0 0 0 0 0 0 0 0 0 0Other income 0 0 1 0 0 5 4 9 6 3 0 0 0 0 0Total income incl. alloc. 37 34 34 35 33 96 119 105 121 72 38 167 126 192 223Staff costs -13 -13 -11 -13 -12 -32 -35 -36 -31 -29 -88 -88 -45 -95 -109Other expenses incl. depr. -9 -8 -10 -8 -9 -24 -20 -20 -24 -15 32 30 -3 25 24Total operating expenses -22 -21 -21 -21 -21 -57 -55 -56 -55 -44 -56 -58 -48 -70 -85Net loan losses 0 0 0 0 0 0 0 0 0 0 0 0 0 0 0Operating profit 15 13 13 14 13 40 64 49 66 28 -18 109 78 122 138
Lending, EURbn 1.6 1.8 1.5 1.8 2.0 2.0 2.0 2.0 2.0 2.0 17.4 15.2 16.6 19.5 19.7Deposits, EURbn 2.7 2.6 2.6 2.5 3.0 4.0 4.0 4.0 4.0 3.0 8.1 8.1 4.9 4.9 3.2
Yield fees have been remapped between net interest income and net commission income.
International Private Banking & Funds
Life Capital Markets unallocated

Nordea Second Quarter Report 2010 19(40)
Group functions Group Corporate Centre Business development Nordea had a positive macro scenario during the second quarter and was hence positioned for higher interest rates, tighter credit spreads and stronger equity markets. Therefore, the financial turmoil in the quarter had a negative impact on the result. Financial market development in the second quarter was dominated by the Greek sovereign debt crisis that also spread to other southern European economies. Despite an unprecedented IMF/EU bailout package and government debt purchases by ECB, the crisis led to fears of a double-dip recession in the Eurozone and general risk aversion in financial markets. European equity markets corrected and credit spreads widened while long-term interest rates in core European countries decreased on expectations of continued low central bank rates. Some signs of stress also materialised in the interbank lending markets leading to somewhat wider LIBOR spreads. As a response the European central bank reactivated the liquidity swap lines with the Federal Reserve. Furthermore, full allotment on 3-month liquidity facilities was adopted in May and June. Nordea has not utilised any of these facilities, but continued to benefit from a very strong funding name with access to all relevant markets and all programmes are in active use. Nordea issued approx. EUR 10.5bn of long-term funding in the second quarter, of which approx. EUR 3.7bn represented issuance of covered bonds in the Swedish
market and EUR 2.2bn net issuance of covered bonds in the Danish market. Among the transactions in the international market, were a GBP 500m senior 5.5-year note and a CHF 350m senior 6-year note issued in April. In June, following several weeks of almost no supply in the market Nordea reopened the senior unsecured market for financial institutions by issuing a EUR 1bn 3-year FRN and a EUR 1.25bn 10-year fixed bond. The liquidity buffer is composed of highly liquid central bank eligible securities and amounted to EUR 48.5bn at the end of the second quarter. The price risk on Group Treasury’s interest-rate positions, calculated as VaR, was EUR 37m. The risk related to equities, calculated as VaR, was EUR 30m and the risk related to credit spreads, calculated as VaR, was EUR 27m. Equity risk decreased, while interest rate and credit spread risk were largely unchanged compared to at the end of the first quarter. Result Total operating income was EUR -62m in the second quarter compared to EUR 107m in the first quarter. Net interest income decreased to EUR 37m in the second quarter, mainly due to that average funding cost continued to increase somewhat when maturing long-term funding was prolonged at higher market rates. Net result on items at fair value was EUR -97m compared to EUR 53m in the first quarter, mainly as a result of positions for higher interest rates, tighter credit spreads and stronger equity markets, on the back of the positive macro scenario. Operating profit was EUR -109m.
Group functions, key figures per quarterGroup Corporate Centre Group functions and Eliminations
Q2 Q1 Q4 Q3 Q2 Q2 Q1 Q4 Q3 Q2EURm 2010 2010 2009 2009 2009 2010 2010 2009 2009 2009Net interest income 37 56 86 107 114 31 -2 6 10 0Net fee and commission income -2 -2 -4 -2 0 -28 -18 -26 -4 -32Net result from items at fair value -97 53 -56 2 67 36 15 -26 -11 4Other income 0 0 0 3 0 8 9 2 0 7Total operating income -62 107 27 110 181 47 4 -44 -5 -21Total operating expenses -47 -47 -45 -37 -37 -5 18 -29 -6 -30Net loan losses 0 0 0 0 0 0 0 4 1 -46Operating profit -109 60 -19 73 144 41 22 -69 -10 -98
Number of employees (FTEs) 637 627 605 602 583

Nordea Second Quarter Report 2010 20(40)
Customer segments Corporate customer segments and financial institutions, key figures
Q2 10 Q1 10 Q2 09 Q2 10 Q1 10 Q2 09 Q2 10 Q1 10 Q2 09 Q2 10 Q1 10 Q2 09Number of customer '000 (EOP) 9 8 6 26 25 18
Income, EURm 372 342 315 292 262 261 212 193 191 876 797 767Volumes, EURbn
Lending 44.9 43.2 44.0 45.5 44.1 42.5 24.8 23.7 21.7 115.2 111.0 108.2Deposit 20.4 21.2 19.1 15.6 15.9 15.2 19.8 19.5 18.7 55.8 56.6 52.9
Margins, pct p.a.Lending 1.54% 1.51% 1.21% 1.42% 1.42% 1.36% 1.68% 1.69% 1.64% 1.48% 1.48% 1.34%Deposit 0.10% 0.12% 0.17% 0.17% 0.22% 0.33% 0.22% 0.24% 0.50% 0.16% 0.19% 0.34%
Q2 10 Q1 10 Q2 09 Q2 10 Q1 10 Q2 09 Q2 10 Q1 10 Q2 09 Q2 10 Q1 10 Q2 09Number of customer '000 (EOP) 94 91 84 1 1 1 1 1 1
Income, EURm 82 85 78 106 89 92 104 93 130 1,168 1,064 1,067Volumes, EURbn
Lending 10.4 10.3 10.7 14.7 13.5 13.5 3.9 4.4 4.0 144.2 139.2 136.4Deposit 2.9 3.0 2.9 4.8 4.6 5.3 9.3 8.9 12.2 72.8 73.1 73.3
Margins, pct p.a.Lending 2.29% 2.37% 2.03% 1.84% 1.76% 1.44% 0.88% 0.82% 0.77% 1.56% 1.56% 1.39%Deposit 0.51% 0.58% 1.13% 0.14% 0.14% 0.16% 0.14% 0.17% 0.22% 0.17% 0.20% 0.34%
Household customer segments, key figures
Q2 10 Q1 10 Q2 09 Q2 10 Q1 10 Q2 09 Q2 10 Q1 10 Q2 09 Q2 10 Q1 10 Q2 09Number of customer '000 (EOP) 91 89 84 2,700 2,634 2,533
Income, EURm 119 91 84 472 453 441 159 159 179 750 703 704
Volumes, EURbnLending 6.3 6.0 5.3 112.7 108.0 95.6 9.8 9.9 10.2 128.8 123.9 111.1Deposit 8.3 8.2 8.6 47.0 44.6 41.7 16.4 16.0 15.5 71.7 68.7 65.8Assets under Management 48.1 48.9 39.3
Margins, pct p.a.Lending 0.99% 1.01% 1.07% 1.16% 1.18% 1.19% 3.59% 3.61% 3.60% 1.38% 1.41% 1.43%Deposit -0.05% -0.01% 0.23% -0.08% -0.05% 0.26% 0.22% 0.25% 0.63% 0.01% 0.04% 0.37%
Q2 10 Q1 10 Q2 09 Q2 10 Q1 10 Q2 09 Q2 10 Q1 10 Q2 09Number of customer '000 (EOP) 925 901 812 12 12 12
Income, EURm 47 40 31 24 22 20 821 765 755Volumes, EURbn
Lending 5.9 5.5 4.7 1.1 1.1 1.0 135.8 130.5 116.8Deposit 1.6 1.7 1.6 1.7 1.8 1.8 75.0 72.2 69.2Assets under Management 9.2 9.2 7.5
Margins, pct p.a.Lending 1.84% 1.83% 1.58% 0.95% 0.92% 0.84% 1.39% 1.42% 1.42%Deposit 0.35% 0.27% 0.44% 0.39% 0.36% 0.43% 0.03% 0.05% 0.38%
Corporate and Financial Institutions Total
Nordichouseholdcustomers
New European Marketscorporate customers
Shipping, Oil services and International customers Financial Institutions
Corporate Merchant Banking
Other corporate customers
Nordic corporate customers
Largecorporate customers
Householdcustomers
Total
Nordic Private Banking
Gold customers
Otherhouseholdcustomers
New European Marketshouseholdcustomers International Private Banking

Nordea Second Quarter Report 2010 21(40)
Product divisions Capital Markets Products In general, volatility across all markets was very high in the second quarter reflecting concerns in the financial markets about the levels of sovereign debt. In most markets, volatility was as high as in the challenging periods of 2008. Market volatility created a challenging environment to manage the risk and trading inherent in customer transactions. Corporate demand for risk-management products within the foreign exchange and fixed-income product areas increased in the second quarter as corporates sought to hedge the market volatility. Demand from institutional customers for equity products was negatively affected by the volatility increase in the second quarter. Furthermore, some pension funds lowered their equity portfolios, due to expected difficulties with the solvency rules. The Nordic primary equity market was also affected by the volatility and some IPO’s and rights issues were postponed. However, Nordea participated in the execution of several of the main transactions in the market, eg the rights issues for SAS and REC.
Activity in the Nordic primary bond market decreased compared to the first quarter. In difficult conditions, Nordea arranged important transactions for Nordic issuers, including an USD benchmark issue for Kommuninvest (USD 1bn) and a number of government-guaranteed issues in various currencies for financial institutions, including a US benchmark issue for BRFkredit A/S (USD 1.3bn). Further, Nordea arranged a covered bond benchmark transaction for Sparebanken Vest Boligkreditt (EUR 0.5bn) and a number of issuances in local currencies in the domestic Nordic markets for corporate issuers such as J.Lauritzen (NOK 0.7bn), Amer Sports (EUR 150m) and Bonnier (SEK 1.2bn). Activity in the Nordic syndicated loan markets picked up in the second quarter. Nordea executed transactions for several Nordic companies and thereby maintained its position as the leading arranger of Nordic syndicated loans. Result Market volumes, in particular within the fixed income and foreign exchange areas, increased compared to the previous quarter as corporate hedging activity picked up due to the financial turmoil. In total, the second quarter result was solid with a product result of EUR 336m, a decrease of 14% compared to the first quarter and a decrease of 25% compared to the very strong results in the second quarter last year.
Capital Markets Products, product result
Q2 Q1 Q4 Q3 Q2EURm 2010 2010 2009 2009 2009Net interest income 94 109 88 91 87Net fee and commission income 87 57 48 51 74Net result from items at fair value 302 368 344 396 447Other income 0 0 0 0 0Total income 483 534 480 538 608Staff costs -88 -88 -45 -95 -109Other expenses -53 -53 -74 -44 -47Operating expenses -141 -141 -119 -139 -156Distribution expenses -6 -4 -5 -6 -5Net loan losses 0 0 0 0 0Product result 336 389 356 393 447
Cost/income ratio, % 29 26 25 26 26Number of employees (full-time equivalents) 1,739 1,763 1,716 1,648 1,652
Equity income transferred to Capital Markets Products due to organisational changes.
Yield fees have been remapped between net interest income and net commission income.

Nordea Second Quarter Report 2010 22(40)
Asset Management Business development In the second quarter, Nordea’s Assets under Management (AuM) increased somewhat to EUR 169.8bn. The increase was driven by continued positive net inflow of EUR 1.9bn. A minor outflow of EUR 0.1bn was reported in Nordic retail funds. Outflow was, however, isolated to Finland, as net inflows were reported in the remaining Nordic countries. AuM of Nordic retail funds remained largely unchanged at EUR 32.9bn. Institutional asset management business remained positive in the second quarter. The net inflow of EUR 0.2bn was primarily driven by a strong activity in the Danish and Finnish markets. Total institutional assets increased 2% to EUR 29.7bn, and the value of net inflow continued to develop positively, due to increased investor appetite in higher-margin products. For the first half year of 2010, Nordea delivered in total an absolute return to customers of almost 6%. Second quarter returns were impacted by uncertainty in the Euro zone financial markets, which impacted global equity markets, and resulted in volatility and investors’ flight to safety. Investment performance was mixed across the product range. Fixed income and some local equity related products continued to outperform benchmark, whereas some areas within multi asset products had performance challenges. Over the past 36 months 65% of the investment composites outperformed benchmark. Result Total income in the second quarter was EUR 157m, up 6% from previous quarter and 35% from second quarter last year. The increase in income was mainly attributable to the increase in AuM and increased transaction related income. Accordingly, the product result of EUR 92m was up 3% from the first quarter, and 53% from second quarter last year. Life & Pensions Business development Sales continued to be strong in the second quarter, leading to gross written premiums of EUR 1,316m, representing a
decrease of 6% from the previous quarter and an increase of 30% from the same quarter last year. Customer demand was particularly strong in the bank channel with a focus on unit-linked products. Focused efforts are made to adapt product offers and streamline de-livery processes to the bank’s customers, and provide sup-port to bank advisers on Life & Pensions’ business. Sales via Nordic Banking now represent 56% of total premiums out of which 70% is unit linked sales. Total share of unit linked was 54% in the second quarter, with Sweden and Finland as main contributing markets. Life & Pensions in Sweden continued to strengthen its position in the market for contractual pensions. Nordea was for the first time the number-one choice for re-channelled unit-linked premiums within the public sector pension scheme KAP-KL. Nordea’s positive momentum for contractual pensions in general and continued strong endowment sales generated a record high Swedish market share of 6.5%. Based on the realised risk-return during 2006-2009 and for the second time in a row, the Danish new traditional product “Vækstpension” was awarded the best life cycle product in Denmark by the magazine Penge & Privatøkonomi. Total AuM reached an all-time high at EUR 41bn, up 1% from the previous quarter and 21% from the same quarter last year. This was a result of both asset appreciation and a net inflow of EUR 0.5bn. Market volatility and increased insurance provisions due to updated mortality rates in Denmark of EUR 108m impacted the financial buffers, which ended at EUR 1,487m, corresponding to 6.1% of technical provisions (7.1% in the previous quarter). The MCEV decreased in the second quarter by EUR 317m to EUR 3,096m, due to lower financial buffers. The value of new business was EUR 108m. Result The product result, EUR 79m, was at a continued high level, although down 18% from the previous quarter, mainly due to lower profit-sharing contribution and return on equity following the volatility in the financial markets. The product result was up 61% from the same quarter last year. Unit-linked products accounted for 22% of the total result.
Assets under Management (AuM), volumes and net inflow
Q2 Net inflow Q1 Q4 Q3 Q2EURbn 2010 Q2 2010 2009 2009 2009Nordic Retail funds 32.9 -0.1 33.0 30.7 28.2 24.4European Fund Distribution 4.4 0.5 3.9 2.7 2.4 1.9Nordic Private Banking 48.1 0.8 48.9 45.8 42.8 39.3International Private Banking 9.2 0.0 9.2 8.7 8.3 7.5Institutional clients 29.7 0.2 29.2 28.1 27.2 25.6Life & Pensions 45.5 0.5 45.0 42.2 40.3 37.8Total 169.8 1.9 169.3 158.1 149.2 136.5

Nordea Second Quarter Report 2010 23(40)
Asset Management, key figures per quarter
EURmTotal income 157 148 165 129 116of which income within Nordic Banking 137 114 124 94 94Staff costs -36 -32 -44 -31 -30Other expenses -29 -27 -30 -26 -26Operating expenses -65 -59 -73 -57 -56
Product result 92 89 92 72 60
Cost/income ratio, % 41 40 44 44 48Income related to AuM, margin (basis points) 57 54 65 52 50AuM (managed by Savings Products & Asset Management), EURbn 110 108 101 96 87 of which Equities, % 33 33 32 30 27 of which Fixed income and Other, % 67 67 68 70 73Number of employees (full-time equivalents) 1,070 1,042 1,039 1,026 1,032
Equity income transferred to Capital Markets Products due to organisational changes.
Life & Pensions, key figures per quarter
Q2 Q1 Q4 Q3 Q2EURm 2010 2010 2009 2009 2009
Profit driversTraditional insurance: Fee contribution/profit sharing 38 49 20 55 5 Contribution from cost result 3 2 -4 3 3 Contribution from risk result 8 9 6 9 12 Return on shareholders' equity/other profits 17 22 53 13 23Total profit Traditional 66 82 75 80 42Total profit Unit-linked 17 17 16 17 11
Estimated distribution expenses in Nordic Banking -4 -3 -4 -3 -4Total Product result 79 96 87 94 49 of which income within Nordic Banking 42 35 48 31 26
Key figuresGross premiums written 1,316 1,399 1,222 1,051 1,013 of which from Traditional business 541 590 547 548 491 of which from Unit-linked business 775 809 674 503 522
Investment return % 2.2 2.9 1.8 3.8 1.1Technical provisions 34,675 33,881 32,218 31,226 29,597Financial buffers 1,487 1,702 1,434 1,203 857Investment assets, EURbn 40.9 40.4 38.0 36.2 33.9 of which bonds, % 49 49 52 54 56 of which equities, % 7 7 6 5 4 of which alternative investments, % 7 6 6 6 7 of which property, % 8 9 9 9 10 of which unit linked, % 29 29 27 26 24
Number of employees (full-time equivalents) 1,343 1,340 1,360 1,358 1,360
Q42009
Q32009
Q22009
Q22010
Q12010

Nordea Second Quarter Report 2010 24(40)
Income statementQ2 Q2 Jan-Jun Jan-Jun Full year
EURm Note 2010 2009 2010 2009 2009Operating income
Interest income 2,341 2,758 4,640 6,123 10,973Interest expense -1,092 -1,453 -2,156 -3,462 -5,692Net interest income 1,249 1,305 2,484 2,661 5,281Fee and commission income 758 605 1,431 1,172 2,468Fee and commission expense -220 -193 -418 -379 -775Net fee and commission income 3 538 412 1,013 793 1,693Net result from items at fair value 4 339 594 887 1,109 1,946
7 17 32 26 48Other operating income 28 31 48 49 105Total operating income 2,161 2,359 4,464 4,638 9,073
Operating expenses
General administrative expenses: 5 Staff costs -701 -687 -1,388 -1,352 -2,724 Other expenses -445 -392 -883 -786 -1,639
-40 -37 -79 -68 -149Total operating expenses -1,186 -1,116 -2,350 -2,206 -4,512
Profit before loan losses 975 1,243 2,114 2,432 4,561Net loan losses 6 -245 -425 -506 -781 -1,486Operating profit 730 818 1,608 1,651 3,075Income tax expense -191 -200 -426 -406 -757Net profit for the period 539 618 1,182 1,245 2,318
Attributable to:Shareholders of Nordea Bank AB (publ) 537 616 1,179 1,242 2,314Non-controlling interests 2 2 3 3 4Total 539 618 1,182 1,245 2,318
Basic earnings per share, EUR 0.13 0.15 0.29 0.34 0.60Diluted earnings per share, EUR 0.13 0.15 0.29 0.34 0.60
Statement of comprehensive incomeQ2 Q2 Jan-Jun Jan-Jun Full year
EURm 2010 2009 2010 2009 2009Net profit for the period 539 618 1,182 1,245 2,318
Currency translation differences during the period 76 -13 438 222 740Currency hedging of net investments in foreign operations -22 14 -235 -203 -507Tax on currency hedging of net investments in foreign operations 6 -4 62 53 133Available-for-sale investments: Valuation gains/losses during the period 0 0 0 0 1 Tax on valuation gains/losses during the period 0 0 0 0 0 Transferred to profit or loss on sale for the period 0 0 0 0 -1Cash flow hedges: Valuation gains/losses during the period 0 1 1 3 6 Tax on valuation gains/losses during the period 0 0 0 -1 -2Other comprehensive income, net of tax 60 -2 266 74 370
Total comprehensive income 599 616 1,448 1,319 2,688
Attributable to:Shareholders of Nordea Bank AB (publ) 597 614 1,445 1,316 2,684Non-controlling interests 2 2 3 3 4Total 599 616 1,448 1,319 2,688
Profit from companies accounted for under the equity method
Depreciation, amortisation and impairment charges of tangible and intangible assets

Nordea Second Quarter Report 2010 25(40)
Balance sheet30 Jun 31 Dec 30 Jun
EURm Note 2010 2009 2009AssetsCash and balances with central banks 3,432 11,500 4,949Treasury bills 14,090 12,944 8,749Loans to credit institutions 7 21,906 18,555 20,430Loans to the public 7 302,550 282,411 278,260Interest-bearing securities 55,608 56,155 47,223Financial instruments pledged as collateral 9,743 11,240 6,454Shares 15,207 13,703 9,940Derivatives 10 121,599 75,422 78,060
1,265 763 669Investments in associated undertakings 518 470 435Intangible assets 3,089 2,947 2,621Property and equipment 418 452 389Investment property 3,579 3,505 3,425Deferred tax assets 126 125 46Current tax assets 368 329 396Retirement benefit assets 138 134 172Other assets 15,132 14,397 11,283Prepaid expenses and accrued income 2,308 2,492 2,093Total assets 571,076 507,544 475,594 Of which assets customer bearing the risk 13,547 12,602 9,738
LiabilitiesDeposits by credit institutions 54,233 52,190 58,090Deposits and borrowings from the public 160,922 153,577 149,662Liabilities to policyholders 36,297 33,831 30,629Debt securities in issue 138,104 130,519 109,072Derivatives 10 118,239 73,043 75,768
1,763 874 762Current tax liabilities 320 565 454Other liabilities 25,760 28,589 18,317Accrued expenses and prepaid income 2,758 3,178 3,223Deferred tax liabilities 756 870 1,035Provisions 420 309 220Retirement benefit obligations 396 394 355Subordinated liabilities 8,190 7,185 6,888Total liabilities 548,158 485,124 454,475
Equity
Non-controlling interests 81 80 81
Share capital 4,043 4,037 4,037Share premium reserve 1,065 1,065 1,065Other reserves -252 -518 -814Retained earnings 17,981 17,756 16,750Total equity 22,918 22,420 21,119Total liabilities and equity 571,076 507,544 475,594
Assets pledged as security for own liabilities 130,583 121,052 95,074Other assets pledged 6,777 6,635 8,174Contingent liabilities 23,592 22,267 26,842Credit commitments1 79,746 77,619 83,994Other commitments 2,959 2,178 2,8821 Including unutilised portion of approved overdraft facilities of EUR 42,923m (31 Dec 2009: 46,462m, 30 Jun 2009: 47,729m).
Fair value changes of the hedged items in portfolio hedge of interest rate risk
Fair value changes of the hedged items in portfolio hedge of interest rate risk

Nordea Second Quarter Report 2010 26(40)
Statement of changes in equity
EURmShare
capital1
Share premium
reserve
Translation of foreign operations
Cash flow hedges
Available-for-sale
investmentsRetained earnings Total
Non-controlling
interestsTotal
equityOpening balance at 1 Jan 2010 4,037 1,065 -517 -1 - 17,756 22,340 80 22,420Total comprehensive income - - 265 1 - 1,179 1,445 3 1,448Issued C-shares4 6 - - - - - 6 - 6Repurchase of C-shares4 - - - - - -6 -6 - -6Share-based payments - - - - - 12 12 - 12Dividend for 2009 - - - - - -1,006 -1,006 - -1,006Divestment of own shares3 - - - - - 46 46 - 46Other changes - - - - - - - -2 -2Closing balance at 30 Jun 2010 4,043 1,065 -252 0 - 17,981 22,837 81 22,918
EURmShare
capital1
Share premium
reserve
Translation of foreign operations
Cash flow hedges
Available-for-sale
investmentsRetained earnings Total
Non-controlling
interestsTotal
equityOpening balance at 1 Jan 2009 2,600 - -883 -5 0 16,013 17,725 78 17,803Total comprehensive income - - 366 4 0 2,314 2,684 4 2,688Rights issue2 1,430 1,065 - - - - 2,495 - 2,495Issued C-shares4 7 - - - - - 7 - 7Repurchase of C-shares4 - - - - - -7 -7 - -7Share-based payments - - - - - 10 10 - 10Dividend for 2008 - - - - - -519 -519 - -519Purchases of own shares3 - - - - - -55 -55 - -55Other changes - - - - - - - -2 -2Closing balance at 31 Dec 2009 4,037 1,065 -517 -1 - 17,756 22,340 80 22,420
EURmShare
capital1
Share premium
reserve
Translation of foreign operations
Cash flow hedges
Available-for-sale
investmentsRetained earnings Total
Non-controlling
interestsTotal
equityOpening balance at 1 Jan 2009 2,600 - -883 -5 0 16,013 17,725 78 17,803Total comprehensive income - - 72 2 0 1,242 1,316 3 1,319Rights issue2 1,430 1,065 - - - - 2,495 - 2,495Issued C-shares4 7 - - - - - 7 - 7Repurchase of C-shares4 - - - - - -7 -7 - -7Share-based payments - - - - - 6 6 - 6Dividend for 2008 - - - - - -519 -519 - -519Divestment of own shares3 - - - - - 15 15 - 15Other changes - - - - - - - 0 0Closing balance at 30 Jun 2009 4,037 1,065 -811 -3 0 16,750 21,038 81 21,119
1 Total shares registered were 4,043 million (31 Dec 2009: 4,037 million, 30 Jun 2009: 4,037 million). 2 Shares issued in relation to the Nordea rights issue. 3 Refers to the change in the holding of own shares related to the Long Term Incentive Programme, trading portfolio and Nordea's shares within portfolio schemes in Denmark. The number of own shares at 30 Jun 2010 were 21.4 million (31 Dec 2009: 23.8 million, 30 Jun 2009: 12.5 million). 4 Refers to the Long Term Incentive Programme (LTIP). LTIP 2009 was hedged by issuing 7,250,000 C-shares, the shares have been bought back and converted to ordinary shares. The total holding of own shares related to LTIP is 15.9 million (31 Dec 2009: 12.1 million, 30 Jun 2009: 12.3 million).
Other reserves:
Other reserves:
Attributable to shareholders of Nordea Bank AB (publ)Other reserves:
Attributable to shareholders of Nordea Bank AB (publ)
Attributable to shareholders of Nordea Bank AB (publ)

Nordea Second Quarter Report 2010 27(40)
Cash flow statementJan-Jun Jan-Jun Full year
EURm 2010 2009 2009Operating activitiesOperating profit 1,608 1,651 3,075Adjustments for items not included in cash flow 863 1,169 2,450Income taxes paid -676 -494 -816Cash flow from operating activities before changes in operating assets and liabilities 1,795 2,326 4,709Changes in operating assets and liabilities -10,814 -760 8,915Cash flow from operating activities -9,019 1,566 13,624
Sale/acquisition of business operations1 -39 - -270Property and equipment -31 -62 -130Intangible assets -70 -53 -97Net investments in debt securities, held to maturity 2,372 456 -5,411Other financial fixed assets -3 4 0Cash flow from investing activities 2,229 345 -5,908Financing activitiesNew share issue 6 2,503 2,503Issued/amortised subordinated liabilities 215 -1,358 -1,122Repurchase of own shares incl change in trading portfolio 46 15 -55Dividend paid -1,006 -519 -519Cash flow from financing activities -739 641 807Cash flow for the period -7,529 2,552 8,523
Cash and cash equivalents at beginning of the period 13,962 4,694 4,694Exchange rate difference 633 168 745Cash and cash equivalents at end of the period 7,066 7,414 13,962Change -7,529 2,552 8,5231 EUR -37m relates to the acquisition of Fionia Bank in 2009 and the part of the purchase price settled in cash first in 2010. For further details see Note 53 in the Annual Report 2009.
Cash and cash equivalents 30 Jun 30 Jun 31 Dec2010 2009 2009
Cash and balances with central banks 3,432 4,949 11,5003,634 2,465 2,462
Cash comprises legal tender and bank notes in foreign currencies. Balances with central banks consist of deposits in accounts with central banks and postal giro systems under government authority, where the following conditions are fulfilled:- the central bank or the postal giro system is domiciled in the country where the institution is established - the balance on the account is readily available at any time.Loans to credit institutions, payable on demand include liquid assets not represented by bonds or other interest-bearing securities.
Investing activities
The following items are included in cash and cash equivalents (EURm):
Loans to credit institutions, payable on demand

Nordea Second Quarter Report 2010 28(40)
Notes to the financial statements Note 1 Accounting policies Nordea’s consolidated financial statements are prepared in accordance with International Financial Reporting Standards (IFRS) and interpretations of such standards by the International Financial Reporting Interpretations Committee (IFRIC), as endorsed by the EU Commission. In addition, certain complementary rules in the Swedish Annual Accounts Act for Credit Institutions and Securities Companies (1995:1559), the recommendation RFR 1.3 ”Supplementary Accounting Rules for Groups” and UFR statements issued by the Swedish Financial Reporting Board as well as the accounting regulations of the Swedish Financial Supervisory Authority (FFFS 2008:25, with amendments in FFFS 2009:11), have also been applied. These statements are presented in accordance with IAS 34 “Interim Financial Reporting”. Changed accounting policies and presentation The accounting policies, basis for calculations and presentation are, in all material aspects, unchanged in comparison with the 2009 Annual Report, except for the classification of lending commissions in the income statement and the categorisation of savings related commissions within “Net fee and commission income”. These changes, made in the first quarter, are further described below. Classification of lending commissions The accounting treatment, including the classification in the income statement, of lending commissions depends on for which purpose the commission is received. Commissions that are considered to be an integral part of the effective interest rate of a loan is included in the calculation of effective interest and classified as “Net
interest income” in the income statement, while commissions considered to be compensation for performed services are classified as “Net fee and commission income”. Judgment has to be exercised when deciding on whether or not a commission shall be included, and to what extent, in the calculation of the effective interest of a loan. During the first quarter Nordea reassessed this judgment, which has lead to a reclassification of commissions from “Net fee and commission income” to “Net interest income”. The impact on Group level is not significant and therefore the income statement for the Group has not been restated. Restatements have, on the other hand, been made in the segment reporting (note 2) to reflect significant reclassifications in individual countries. Categorisation of savings related commissions The categorisation of savings related commissions within “Net fee and commission income” (note 3) was changed in the first quarter, in order to be better aligned with the purpose for which the fees are received. The comparable figures have been restated accordingly and the impact is, together with the impact on 2010, disclosed in the below table.
Jan-Jun 2010
Jan-Jun 2009 Full year
2009
EURm Re-
stated
Pre policy
change
Re-
stated Re-
ported
Re-
statedRe-
portedAsset Management commissions 329 308
217 200
492 454Brokerage 105 126 88 105 188 226
Exchange rates
Jan-Jun Jan-Dec Jan-JunEUR 1 = SEK 2010 2009 2009Income statement (average) 9.7965 10.6101 10.8554Balance sheet (at end of period) 9.5259 10.2701 10.8648
EUR 1 = DKKIncome statement (average) 7.4422 7.4460 7.4493Balance sheet (at end of period) 7.4488 7.4410 7.4471EUR 1 = NOKIncome statement (average) 8.0119 8.7283 8.9008Balance sheet (at end of period) 7.9725 8.3022 9.0555EUR 1 = PLNIncome statement (average) 4.0030 4.3189 4.4657Balance sheet (at end of period) 4.1470 4.1268 4.4683EUR 1 = RUBIncome statement (average) 39.9206 44.0882 44.0251Balance sheet (at end of period) 38.2820 43.3452 43.7482

Nordea Second Quarter Report 2010 29(40)
Note 2 Segment reporting1
Jan-Jun Jan-Jun Jan-Jun Jan-Jun Jan-Jun Jan-Jun Jan-Jun Jan-Jun2010 2009 2010 2009 2010 2009 2010 2009
Total operating income, EURm 3,160 3,019 317 268 197 238 195 183Operating profit, EURm 1,015 848 115 98 103 128 137 101Loans to the public, EURbn 244 219 16 15 4 4 15 14Deposits and borrowings from the public, EURbn 128 119 5 5 9 12 5 5
Jan-Jun Jan-Jun Jan-Jun Jan-Jun Jan-Jun Jan-Jun Jan-Jun Jan-Jun2010 2009 2010 2009 2010 2009 2010 2009
Total operating income, EURm 544 984 4,413 4,692 51 -54 4,464 4,638Operating profit, EURm 175 611 1,545 1,786 63 -135 1,608 1,651Loans to the public, EURbn 21 24 300 276 3 2 303 278Deposits and borrowings from the public, EURbn 15 9 162 150 -1 - 161 150
Reconciliation between total operating segments and financial statements
Jan-Jun Jan-Jun Jan-Jun Jan-Jun Jan-Jun Jan-Jun2010 2009 2010 2009 2010 2009
Total Operating segments 1,545 1,786 300 276 162 1502 -174 3 2 -1 -
Differences in accounting policies3 61 39 - - - -Total 1,608 1,651 303 278 161 1502 Consists of Group Management Secretariat, Group Executive Management, Group Internal Audit, Group Credit and Risk Control, Group Human Resources
and Group Identity and Communications. 3 Internally developed and bought software is expensed as incurred in the operating segments, but capitalised as required by IAS 38 in the entity's balance
sheet.
Reportable Operating segments
Reconciliation Total Group
Compared with the 2009 Annual Report there have been no changes in the basis of segmentation and measurement of segment profit or loss.
Group functions2 and unallocated items
Deposits and borrowings from the
public, EURbn
Operating segments
Other Operating segments
Total Operating segments
Nordic Banking conducts a full service banking operation. It is Nordea's largest customer area and serves household customers and corporate customers in the Nordic markets. The branches within Nordea's banking activities in the New European Markets offer full banking services for local and Nordic corporate and personal customers in Estonia, Latvia, Lithuania, Poland and Russia. The Financial Institutions segment is responsible for Nordea's customers within the financial institution industry. The segment Shipping, Oil Services & International is responsible for Nordea's customers within the shipping, offshore and oil services industries.
Financial InstitutionsShipping, Oil Services
& International
Change in basis of segmentation and measurement of segment profit or loss
Nordic BankingNew European
Markets
Loans to the public, EURbn
1 Historical information has been restated mainly due to organisational changes.
Operating profit, EURm
Operating segments

Nordea Second Quarter Report 2010 30(40)
Note 3 Net fee and commission incomeQ2 Q1 Q2 Jan-Jun Jan-Jun Full year
EURm 2010 2010 2009 2010 2009 2009Asset Management commissions 171 158 112 329 217 492Life insurance 76 75 63 151 128 271Brokerage 53 52 47 105 88 188Custody 24 14 22 38 40 77Deposits 11 11 12 22 23 43Total savings related commissions 335 310 256 645 496 1,071Payments 103 102 97 205 190 392Cards 98 89 85 187 161 337Total payment commissions 201 191 182 392 351 729Lending 77 73 60 150 138 283Guarantees and documentary payments 51 51 46 102 86 183Total lending related commissions 128 124 106 252 224 466Other commission income 94 48 61 142 101 202Fee and commission income 758 673 605 1,431 1,172 2,468
Life insurance -14 -19 -15 -33 -32 -64Payment expenses -79 -67 -71 -146 -135 -280State guarantee fees -52 -51 -50 -103 -101 -201Other commission expenses -75 -61 -57 -136 -111 -230Fee and commission expenses -220 -198 -193 -418 -379 -775Net fee and commission income 538 475 412 1,013 793 1,693
Note 4 Net result from items at fair valueQ2 Q1 Q2 Jan-Jun Jan-Jun Full year
EURm 2010 2010 2009 2010 2009 2009Shares/participations and other share-related instruments -8 634 772 626 515 1,762
649 1,188 506 1,837 1,194 2,537Other financial instruments -96 -18 -39 -113 -27 -117Foreign exchange gains/losses -74 -210 183 -284 47 329Investment properties 32 45 33 76 72 117Change in technical provisions1, Life insurance -422 -796 -642 -1,218 -480 -1,870Change in collective bonus potential, Life insurance 242 -303 -237 -61 -228 -865Insurance risk income, Life insurance 74 79 75 152 146 297Insurance risk expense, Life insurance -58 -71 -57 -128 -130 -244Total 339 548 594 887 1,109 1,9461 Premium income amounts to EUR 413m for Q2 2010 and EUR 844m for Jan-Jun 2010 (Q1 2010: EUR 431m, Q2 2009: EUR 500m, Jan-Jun 2009: EUR 1,004m, Jan-Dec 2009: EUR 1,667m).
Note 5 General administrative expensesQ2 Q1 Q2 Jan-Jun Jan-Jun Full year
EURm 2010 2010 2009 2010 2009 2009Staff -701 -687 -687 -1,388 -1,352 -2,724Information technology1 -146 -141 -155 -287 -298 -593Marketing -29 -24 -17 -53 -31 -83Postage, telephone and office expenses -48 -56 -45 -104 -94 -190Rents, premises and real estate expenses -97 -98 -92 -195 -182 -367Other -125 -119 -83 -244 -181 -406Total -1,146 -1,125 -1,079 -2,271 -2,138 -4,3631 Refers to IT operations, service expenses and consultant fees. Total IT-related costs including staff etc, but excluding IT expenses in the Life operations, were EUR -183m in Q2 2010 and EUR -358m for Jan-Jun 2010 (Q1 2010: EUR -175m, Q2 2009: EUR -182m, Jan-Jun 2009: EUR -358m, Jan-Dec 2009: EUR -752m).
Interest-bearing securities and other interest-related instruments

Nordea Second Quarter Report 2010 31(40)
Note 6 Net loan lossesQ2 Q1 Q2 Jan-Jun Jan-Jun Full year
EURm 2010 2010 2009 2010 2009 2009Loan losses divided by classLoans to credit institutions 0 0 3 0 -8 -14Loans to the public -150 -259 -360 -409 -692 -1,337- of which provisions -248 -318 -386 -566 -730 -1,448- of which write-offs -120 -114 -79 -234 -177 -478- of which allowances used for covering write-offs 90 79 46 169 112 277- of which reversals 114 71 47 185 79 238- of which recoveries 14 23 12 37 24 74Off-balance sheet items -95 -2 -68 -97 -81 -135Total -245 -261 -425 -506 -781 -1,486
Key ratiosQ2 Q1 Q2 Jan-Jun Jan-Jun Full year
2010 2010 20092 2010 20092 20092
Loan loss ratio, basis points1 35 37 57 36 55 54- of which individual 34 26 41 30 42 40- of which collective 1 11 16 6 13 141 Net loan losses (annualised) divided by opening balance of loans to the public (lending).2 Loan loss ratio in Q2 2009 excluding provision for a legal claim contested by Nordea.
Note 7 Loans and their impairment
30 Jun 31 Mar 31 Dec 30 JunEURm 2010 2010 20091 2009Loans, not impaired 322,518 312,651 298,949 296,871Impaired loans 4,407 4,453 4,240 3,534- Performing 2,313 2,377 2,372 1,949- Non-performing 2,094 2,076 1,868 1,585Loans before allowances 326,925 317,104 303,189 300,405
Allowances for individually assessed impaired loans -1,546 -1,502 -1,385 -1,098- Performing -806 -766 -733 -613- Non-performing -740 -736 -652 -485Allowances for collectively assessed impaired loans -923 -921 -838 -617Allowances -2,469 -2,423 -2,223 -1,715
Loans, carrying amount 324,456 314,681 300,966 298,690
Credit institutions30 Jun 31 Mar 31 Dec 30 Jun 30 Jun 31 Mar 31 Dec 30 Jun
EURm 2010 2010 2009 2009 2010 2010 20091 2009Loans, not impaired 21,909 22,223 18,558 20,432 300,609 290,428 280,391 276,439Impaired loans 36 36 35 28 4,371 4,417 4,205 3,506- Performing 4 4 4 27 2,309 2,373 2,368 1,922- Non-performing 32 32 31 1 2,062 2,044 1,837 1,584Loans before allowances 21,945 22,259 18,593 20,460 304,980 294,845 284,596 279,945
Allowances for individually assessed impaired loans -36 -36 -35 -28 -1,510 -1,466 -1,350 -1,070- Performing -4 -4 -4 -27 -802 -762 -729 -586- Non-performing -32 -32 -31 -1 -708 -704 -621 -484Allowances for collectively assessed impaired loans -3 -2 -3 -2 -920 -919 -835 -615Allowances -39 -38 -38 -30 -2,430 -2,385 -2,185 -1,685
Loans, carrying amount 21,906 22,221 18,555 20,430 302,550 292,460 282,411 278,2601 Comparative figures have been restated as a consequence of the acquisition of Fionia Bank.
The public
Total

Nordea Second Quarter Report 2010 32(40)
Allowances and provisions30 Jun 31 Mar 31 Dec 30 Jun
EURm 2010 2010 20091 2009Allowances for items in the balance sheet -2,469 -2,423 -2,223 -1,715Provisions for off balance sheet items -334 -238 -236 -182Total allowances and provisions -2,803 -2,661 -2,459 -1,897Key ratios
30 Jun 31 Mar 31 Dec 30 Jun2010 2010 20091 2009
Impairment rate, gross2, basis points 135 140 140 118Impairment rate, net3, basis points 88 93 94 81Total allowance rate4, basis points 76 76 73 57Allowances in relation to impaired loans5, % 35 34 33 31Total allowances in relation to impaired loans6, % 56 54 52 49Non-performing, not impaired7, EURm 334 338 296 2001 Comparative figures have been restated as a consequence of the acquisition of Fionia Bank.2 Individually assessed impaired loans before allowances divided by total loans before allowances.3 Individually assessed impaired loans after allowances divided by total loans before allowances.4 Total allowances divided by total loans before allowances.5 Allowances for individually assessed impaired loans divided by individually assessed impaired loans before allowances.6 Total allowances divided by total impaired loans before allowances.7 Past due loans, not impaired due to future cash flows (included in Loans, not impaired).
Note 8 Classification of financial instruments
EURmLoans and
receivablesHeld to
maturityHeld for
tradingFair value
option
Derivatives used for hedging
Available for sale Total
Financial assetsCash and balances with central banks 3,432 - - - - - 3,432Treasury bills - 813 13,277 - - - 14,090Loans to credit institutions 13,499 - 7,881 526 - - 21,906Loans to the public 242,113 - 15,481 44,956 - - 302,550Interest-bearing securities - 14,835 21,045 19,728 - - 55,608Financial instruments pledged as collateral - - 9,743 - - - 9,743Shares - - 3,960 11,242 - 5 15,207Derivatives - - 120,250 - 1,349 - 121,599Fair value changes of the hedged items in portfolio hedge of interest rate risk 1,265 - - - - - 1,265Other assets 8,907 - - 6,206 - - 15,113Prepaid expenses and accrued income 1,870 - 8 36 - - 1,914Total 30 Jun 2010 271,086 15,648 191,645 82,694 1,349 5 562,427
Total 31 Dec 2009 261,598 17,953 146,715 72,639 390 11 499,306Total 30 Jun 2009 248,797 11,944 140,270 66,483 349 11 467,854
EURmHeld for
tradingFair value
option
Derivatives used for hedging
Other financial liabilities Total
Financial liabilitiesDeposits by credit institutions 17,515 10,657 - 26,061 54,233Deposits and borrowings from the public 8,620 5,553 - 146,749 160,922Liabilities to policyholders, investment contracts - 7,699 - - 7,699Debt securities in issue 6,263 28,019 - 103,822 138,104Derivatives 117,747 - 492 - 118,239Fair value changes of the hedged items in portfolio hedge of interest rate risk - - - 1,763 1,763Other liabilities 7,491 4,794 - 13,406 25,691Accrued expenses and prepaid income 3 524 - 1,326 1,853Subordinated liabilities - - - 8,190 8,190Total 30 Jun 2010 157,639 57,246 492 301,317 516,694Total 31 Dec 2009 106,166 55,458 660 291,954 454,238Total 30 Jun 2009 105,237 41,758 717 277,552 425,264
Note 7, continued

Nordea Second Quarter Report 2010 33(40)
Note 9 Financial instrumentsDetermination of fair value from quoted market prices or valuation techniques
30 Jun 2010, EURmOf which
Life
Valuation technique
using observable
data (Level 2)
Of which Life
Valuation technique
using non-observable
data (Level 3)
Of which Life Total
AssetsLoans to credit institutions - - 8,407 - - - 8,407Loans to the public - - 60,437 - - - 60,437Debt securities1 47,403 17,991 14,258 2,632 1,733 1,658 63,394Shares2 10,906 8,235 56 27 4,644 2,854 15,606Derivatives 434 1 119,016 - 2,149 - 121,599Other assets - - 6,206 - - - 6,206Prepaid expenses and accrued income - - 44 - - - 44
LiabilitiesDeposits by credit institutions - - 28,172 - - - 28,172Deposits and borrowings from the public - - 14,173 - - - 14,173Liabilities to policy holders - - 7,699 7,699 - - 7,699Debt securities in issue 28,019 - 6,263 - - - 34,282Derivatives 345 2 115,768 9 2,126 6 118,239Other liabilities - - 12,285 - - - 12,285Accrued expenses and prepaid income - - 527 - - - 5271 Of which EUR 13,277m Treasury bills and EUR 40,773m Interest-bearing securities (the portion held at fair value in Note 8). EUR 9,344m relates to
the balance sheet item Financial instruments pledged as collateral.2 EUR 399m relates to the balance sheet item Financial instruments pledged as collateral.
Collateralised Debt Obligations (CDO) - Exposure1
Nominals EURmBought
protectionOf which
LifeSold
protectionOf which
LifeCDOs, gross 2,868 - 3,195 615Hedged exposures 1,455 - 1,455 -CDOs, net2 1,4133 - 1,7404 615Of which:- Equity 254 - 476 139- Mezzanine 276 - 582 335- Senior 883 - 682 1411 First-To-Default (FTD) swaps are not classified as CDOs and are therefore not included in the table. Net bought protection amounts to EUR 113m and net sold protection to EUR 105m. Both bought and sold protection are, to the predominant part, investment grade.2 Net exposure disregards exposure where bought and sold tranches are completely identical in terms of reference pool attachment, detachment, maturity and currency.3 Of which investment grade EUR 1,409m and sub investment grade EUR 4m.4 Of which investment grade EUR 1,575m, sub investment grade EUR 23m and not rated EUR 142m.
Credit Default Swaps (CDS) - Exposure
Quoted prices in active markets for
same instrument (Level 1)
CDSs (derivatives) are used for hedging exposure in CDOs as well as Credit Bonds. The net position from bought protection amounts to EUR 2,087m and the net position from sold protection amounts to EUR 800m.

Nordea Second Quarter Report 2010 34(40)
Note 10 Derivatives
Fair value 30 Jun 2010 31 Dec 2009 30 Jun 2009EURm Assets Liabilities Assets Liabilities Assets LiabilitiesDerivatives held for tradingInterest rate derivatives 99,235 97,377 61,053 59,413 58,210 57,304Equity derivatives 956 1,013 914 1,074 905 743Foreign exchange derivatives 17,845 17,045 10,953 9,761 14,674 13,244Credit derivatives 1,258 1,273 1,224 1,238 2,873 2,790Other derivatives 956 1,039 888 897 1,049 970Total 120,250 117,747 75,032 72,383 77,711 75,051
Derivatives used for hedgingInterest rate derivatives 658 296 267 278 265 245Equity derivatives 0 1 1 2 1 2Foreign exchange derivatives 691 195 122 380 83 470Total 1,349 492 390 660 349 717
Total fair value Interest rate derivatives 99,893 97,673 61,320 59,691 58,475 57,549Equity derivatives 956 1,014 915 1,076 906 745Foreign exchange derivatives 18,536 17,240 11,075 10,141 14,757 13,714Credit derivatives 1,258 1,273 1,224 1,238 2,873 2,790Other derivatives 956 1,039 888 897 1,049 970Total 121,599 118,239 75,422 73,043 78,060 75,768
Nominal amount 30 Jun 31 Dec 30 JunEURm 2010 2009 2009Derivatives held for tradingInterest rate derivatives 4,262,684 3,587,802 3,573,567Equity derivatives 19,015 19,866 20,724Foreign exchange derivatives 901,045 716,414 714,887Credit derivatives 66,660 78,669 101,021Other derivatives 16,096 16,947 13,722Total 5,265,500 4,419,698 4,423,921
Derivatives used for hedgingInterest rate derivatives 28,539 22,286 20,872Equity derivatives 33 34 44Foreign exchange derivatives 6,029 5,253 14,755Total 34,601 27,573 35,671
Total nominal amountInterest rate derivatives 4,291,223 3,610,088 3,594,439Equity derivatives 19,048 19,900 20,768Foreign exchange derivatives 907,074 721,667 729,642Credit derivatives1 66,660 78,669 101,021Other derivatives 16,096 16,947 13,722Total 5,300,101 4,447,271 4,459,5921 The net position from credit derivatives is disclosed in Note 9.

Nordea Second Quarter Report 2010 35(40)
Note 11 Capital adequacy
Capital Base 30 Jun 31 Dec 30 Jun
EURm 2010 2009 2009Core Tier 1 capital 18,564 17,766 17,585Tier 1 capital 20,491 19,577 19,034Total capital base 24,336 22,926 22,497
Capital requirement30 Jun 30 Jun 31 Dec 31 Dec 30 Jun 30 Jun
2010 2010 2009 2009 2009 2009
EURmCapital
requirement RWACapital
requirement RWACapital
requirement RWACredit risk 13,134 164,176 12,250 153,123 12,208 152,587IRB 10,263 128,287 9,655 120,692 9,549 119,361 - of which corporate 7,532 94,144 7,060 88,249 7,065 88,308 - of which institutions 725 9,069 821 10,262 882 11,024 - of which retail 1,902 23,770 1,673 20,912 1,514 18,930 - of which other 104 1,304 101 1,269 88 1,099
Standardised 2,871 35,889 2,595 32,431 2,659 33,226 - of which sovereign 65 815 70 871 39 491 - of which retail 758 9,470 711 8,887 647 8,080 - of which other 2,048 25,604 1,814 22,673 1,973 24,655
Market risk 486 6,069 431 5,386 378 4,721 - of which trading book, VaR 176 2,197 107 1,335 127 1,583 - of which trading book, non-VaR 232 2,895 267 3,341 196 2,453 - of which FX, non-VaR 78 977 57 710 55 685
Operational risk 1,176 14,704 1,057 13,215 1,048 13,101Standardised 1,176 14,704 1,057 13,215 1,048 13,101Sub total 14,796 184,949 13,738 171,724 13,634 170,409
Adjustment for transition rulesAdditional capital requirement according to transition rules 1,676 20,954 1,611 20,134 1,740 21,747Total 16,472 205,903 15,349 191,858 15,374 192,156
Capital ratio
30 Jun 31 Dec 30 Jun2010 2009 2009
Core Tier I ratio, %, incl profit 9.0 9.3 9.2Tier I ratio, %, incl profit 10.0 10.2 9.9Capital ratio, %, incl profit 11.8 11.9 11.7
Analysis of capital requirements
Exposure class, 30 Jun 2010
Average risk weight
(%)
Capital requirement
(EURm)Corporate 60% 7,532Institutions 20% 725Retail IRB 17% 1,902Sovereign 2% 65Other 82% 2,910Total credit risk 13,134

Nordea Second Quarter Report 2010 36(40)
Note 12 Risks and uncertainties Nordea’s revenue base reflects the Group’s business with a large and diversified customer base, comprising household customers, corporate customers and financial institutions, representing different geographic areas and industries. Nordea’s main risk exposure is credit risk. The Group also assumes risks such as market risk, liquidity risk, operational risk and life insurance risk. For further information on risk composition, see the Annual Report. The financial crisis and the deteriorating macroeconomic situation have not had material impact on Nordea’s financial position. However, the macroeconomic development remains uncertain, as communicated in the Outlook on page 8. None of the above exposures and risks is expected to have any significant adverse effect on the Group or its financial position in the medium term. Within the framework of the normal business operations, the Group faces claims in civil lawsuits and other disputes, most of which involve relatively limited amounts. None of these disputes is considered likely to have any significant adverse effect on the Group or its financial position in the next six months.
Note 13 Related-party transactions Nordea defines related parties as Shareholders with significant influence, Group undertakings, Associated undertakings, Key management personnel and Other related parties. Key management personnel include the Board of Directors, the Chief Executive Officer and the Group Executive Management. Other related parties comprise companies significantly influenced by Key management personnel in Nordea Group as well as companies significantly influenced by close family members to these Key management personnel. Transactions with Other related parties are normally made in Nordea’s and the related companies’ ordinary course of business and on the same criteria and terms as those for comparable transactions with companies of similar standing. During the second quarter 2010, an associated undertaking in the Group acquired the shares in a company in which Nordea had an insignificant influence. The acquiring company is still, after the transaction, an associated undertaking in the Group and continues to be accounted for under the equity method.

Nordea Second Quarter Report 2010 37(40)
Nordea Bank AB (publ) Accounting policies The financial statements for the parent company, Nordea Bank AB (publ) are prepared in accordance with the Swedish Annual Accounts Act for Credit Institutions and Securities Companies (1995:1559) and IFRS with the amendments and exceptions following the recommendation RFR 2.3 “Accounting for Legal Entities” issued by the Swedish Financial Reporting Board and the accounting regulations of the Swedish Financial Supervisory Authority (FFFS 2008:25, with amendments in FFFS 2009:11). Under RFR 2.3, the parent company shall apply all standards and interpretations issued by the IASB and IFRIC to the extent possible within the framework of Swedish accounting legislation and considering the close tie between financial reporting and taxation. The recommendation sets out the exceptions and amendments to IFRS that shall be made. Changed accounting policies and presentation The accounting policies, basis for calculations and presentation are, in all material aspects, unchanged in comparison with the 2009 Annual Report, except for the classification of lending commissions and pension expenses in the income statement, which were changed in the first quarter. More informa-
tion on the classification of lending commissions can be found in Note 1 for the Group, while more information on the classification of pension expenses follows below. Classification of pension expenses The classification of pension expenses in the income statement has been changed. All components within pension expenses are, as from the first quarter, classified as “Staff costs”. Previously only the change in recognised pension provisions, including special wage tax, was classified as “Staff costs”, while the other components were classified as “Appropriations”. The comparable figures have been restated accordingly and the impact is, together with the impact on 2010, disclosed in the below table. Jan-Jun 2010 Jan-Jun 2009 Full year 2009
EURm Re-
stated
Pre policy
change Re-
stated Re-
ported Re-
statedRe-
ported
Staff costs -373 -325 -325 -283 -644 -595Appro-priations - -48 - -42 -3 -52
Income statement
Q2 Q2 Jan-Jun Jan-Jun Full yearEURm 2010 2009 2010 2009 2009Operating income
Interest income 352 431 718 1,043 1,793Interest expense -228 -259 -440 -721 -1,127Net interest income 124 172 278 322 666
Fee and commission income 212 171 363 308 614Fee and commission expense -44 -39 -77 -74 -158Net fee and commission income 168 132 286 234 456Net result from items at fair value -33 98 38 147 152Dividends 0 0 300 300 973Other operating income 28 35 54 63 123Total operating income 287 437 956 1,066 2,370
Operating expenses
General administrative expenses: Staff costs -179 -144 -373 -325 -644 Other expenses -119 -107 -242 -209 -443
-27 -26 -54 -51 -106Total operating expenses -325 -277 -669 -585 -1,193
Profit before loan losses -38 160 287 481 1,177
Net loan losses 1 -39 -12 -103 -165Impairment of securities held as financial non-current assets -102 - -102 - -Operating profit -139 121 173 378 1,012
Appropriations - - - - -3Income tax expense 6 -14 -4 -15 -24Net profit for the period -133 107 169 363 985
Depreciation, amortisation and impairment charges of tangible and intangible assets
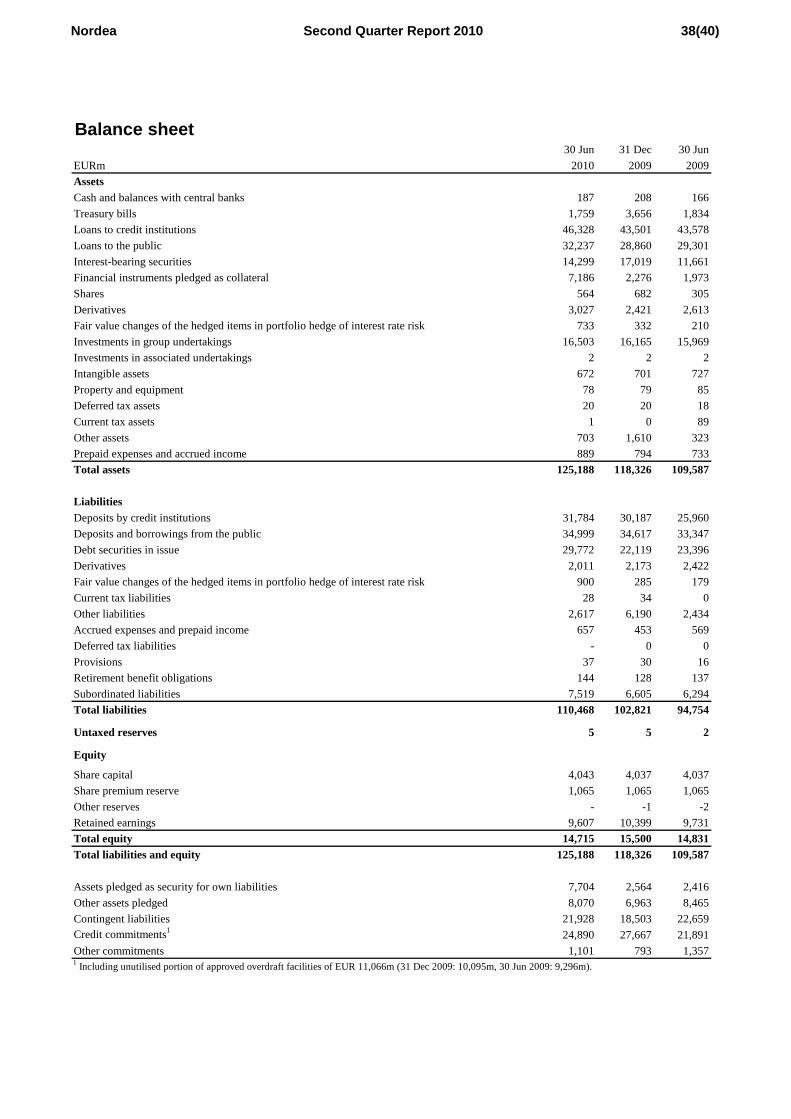
Nordea Second Quarter Report 2010 38(40)
Balance sheet30 Jun 31 Dec 30 Jun
EURm 2010 2009 2009AssetsCash and balances with central banks 187 208 166Treasury bills 1,759 3,656 1,834Loans to credit institutions 46,328 43,501 43,578Loans to the public 32,237 28,860 29,301Interest-bearing securities 14,299 17,019 11,661Financial instruments pledged as collateral 7,186 2,276 1,973Shares 564 682 305Derivatives 3,027 2,421 2,613
733 332 210Investments in group undertakings 16,503 16,165 15,969Investments in associated undertakings 2 2 2Intangible assets 672 701 727Property and equipment 78 79 85Deferred tax assets 20 20 18Current tax assets 1 0 89Other assets 703 1,610 323Prepaid expenses and accrued income 889 794 733Total assets 125,188 118,326 109,587
LiabilitiesDeposits by credit institutions 31,784 30,187 25,960Deposits and borrowings from the public 34,999 34,617 33,347Debt securities in issue 29,772 22,119 23,396Derivatives 2,011 2,173 2,422
900 285 179Current tax liabilities 28 34 0Other liabilities 2,617 6,190 2,434Accrued expenses and prepaid income 657 453 569Deferred tax liabilities - 0 0Provisions 37 30 16Retirement benefit obligations 144 128 137Subordinated liabilities 7,519 6,605 6,294Total liabilities 110,468 102,821 94,754
Untaxed reserves 5 5 2
Equity
Share capital 4,043 4,037 4,037Share premium reserve 1,065 1,065 1,065Other reserves - -1 -2Retained earnings 9,607 10,399 9,731Total equity 14,715 15,500 14,831Total liabilities and equity 125,188 118,326 109,587
Assets pledged as security for own liabilities 7,704 2,564 2,416Other assets pledged 8,070 6,963 8,465Contingent liabilities 21,928 18,503 22,659Credit commitments1 24,890 27,667 21,891Other commitments 1,101 793 1,3571 Including unutilised portion of approved overdraft facilities of EUR 11,066m (31 Dec 2009: 10,095m, 30 Jun 2009: 9,296m).
Fair value changes of the hedged items in portfolio hedge of interest rate risk
Fair value changes of the hedged items in portfolio hedge of interest rate risk

Nordea Second Quarter Report 2010 39(40)
For further information: - A press and analyst conference with management will be arranged on 21 July 2010 at 09.30 CET, at Smålandsgatan
17, Stockholm. - An international telephone conference for analysts with management will be arranged on 21 July at 14.30 CET.
(Please dial +44 (0) 20 7138 0824, confirmation code 7068054, latest ten minutes in advance.) The telephone conference can be monitored live on www.nordea.com. An indexed on-demand version will also be available on www.nordea.com. A replay will also be available through 28 July, by dialling +44 (0) 20 7111 1244, access code 7068054#.
- An analyst and investor presentation will be arranged in London on 22 July at 8.00 GMT at Andaz Liverpool Street, 40 Liverpool Street, London EC2M 7QN. To attend, please contact Veronica Molina, Carnegie by e-mail [email protected].
- This quarterly report is available on www.nordea.com, as also an investor presentation and a fact book are. Contacts:
Christian Clausen, President and Group CEO +46 8 614 7804 Fredrik Rystedt, Group CFO +46 8 614 7812 Rodney Alfvén, Head of Investor Relations +46 8 614 7880 (or +46 72 235 05 15) Jan Larsson, Head of Group Identity & Communications +46 8 614 7916 (or +46 70 593 34 12)
Financial calendar 27 October 2010 – third quarter report 2010 The Board of Directors and the President and Group CEO certify that the half-year interim report provides a fair overview of the Parent Company’s and the Group’s operations, their financial position and result, and describes material risks and uncertainties that the Parent Company and other companies in the Group are facing. Stockholm 21 July 2010 Hans Dalborg
Chairman Björn Wahlroos Kari Ahola Stine Bosse Vice Chairman Board member¹ Board member Marie Ehrling Svein Jacobsen Tom Knutzen Board member Board member Board member Steinar Nickelsen Lars G Nordström Lars Oddestad Board member¹ Board member Board member¹ Sarah Russell Björn Savén Kari Stadigh Board member Board member Board member
Christian Clausen President and Group CEO
¹ Employee representative

Nordea Second Quarter Report 2010 40(40)
This report is published in four additional language versions; Danish, Finnish, Norwegian and Swedish. In the event of any inconsistencies between those language versions and this English version, the English version shall prevail. The information provided in this press release is such, which Nordea is required to disclose pursuant to the Swedish Financial Instruments Trading Act (1991:980) and/or the Swedish Securities Markets Act (2007:528). This report contains forward-looking statements that reflect management’s current views with respect to certain future events and potential financial performance. Although Nordea believes that the expectations reflected in such forward-looking statements are reasonable, no assurance can be given that such expectations will prove to have been correct. Accordingly, results could differ materially from those set out in the forward looking statements as a result of various factors. Important factors that may cause such a difference for Nordea include, but are not limited to: (i) the macroeconomic development, (ii) change in the competitive climate and (iii) change in interest rate and foreign exchange rate levels. This report does not imply that Nordea has undertaken to revise these forward-looking statements, beyond what is required by applicable law or applicable stock exchange regulations if and when circumstances arise that will lead to changes compared to the date when these statements were provided. Nordea Bank AB (publ) Smålandsgatan 17 SE-105 71 Stockholm www.nordea.com/ir Tel. +46 8 614 7800 Corporate registration No. 516406-0120 Report on Review of Interim Financial Information Introduction We have reviewed the half-year interim report of Nordea Bank AB (publ) as of June 30, 2010 and for the six-month period then ended. The Board of directors and the Managing Director are responsible for the preparation and fair presentation of this interim financial information in accordance with IAS 34 and the Annual Accounts Act of Credit Institutions and Securities Companies. Our responsibility is to express a conclusion on this half-year interim report based on our review. Scope of Review We conducted our review in accordance with the Standard on Review Engagements (SÖG) 2410, Review of Interim Financial Information Performed by the Independent Auditor of the Entity. A review of interim financial information consists of making inquiries, primarily of persons responsible for financial and accounting matters, and applying analytical and other review procedures. A review is substantially less in scope than an audit conducted in accordance with the Standards on Auditing in Sweden RS and other generally accepted auditing practices. The procedures performed in a review do not enable us to obtain a level of assurance that would make us aware of all significant matters that might be identified in an audit. Therefore, the conclusion expressed based on a review does not give the same level of assurance as a conclusion expressed based on an audit. Conclusion Based on our review, nothing has come to our attention that causes us to believe that the half-year interim report is not prepared, in all material respects, in accordance with IAS 34 and the Annual Accounts Act of Credit Institutions and Securities Companies for the group and in accordance with the Annual Accounts Act of Credit Institutions and Securities Companies for the parent company. Stockholm 21 July 2010 KPMG AB Carl Lindgren Authorised public accountant