Interim REPORT 1–9/2018
23
STRATEGIC JOURNEY CONTINUES DESPITE A CHALLENGING EUROPEAN MARKET HILLE KORHONEN PRESIDENT AND CEO AUGUST 6, 2019
Transcript of Interim REPORT 1–9/2018

S T R A T E G I C J O U R N E Y C O N T I N U E S D E S P I T E A C H A L L E N G I N G E U R O P E A N M A R K E T
H I L L E K O R H O N E N
P R E S I D E N T A N D C E O
A U G U S T 6 , 2 0 1 9

W E A K E U R O P E A N M A R K E T
I M P A C T I N G Q 2
• Net sales EUR 419.1 million (429.1), -2.6% with comparable currencies
• Operating profit EUR 94.1 million (108.0)
• Highly competitive tire market in Central Europe, lower volumes and higher material costs
• Increased opex investments to support our strategic journey
• Profit for the period EUR 73.0 million (87.5)
2
4–6/2019

H 1 : P R O G R E S S I N H E A V Y T Y R E S
A N D V I A N O R
• Net sales EUR 762.8 million (765.2), +0.2% with comparable currencies
• Good progress in Heavy Tyres continued
• Operating profit EUR 148.0 million (169.3)
• Currencies and higher material costs had an adverse impact
• Increased opex investments to support our strategic journey
• Vianor profitability improved in line with the plan
• Profit for the period EUR 267.6 million (134.1)
• Positively impacted by EUR 149.6 million related to the rulings on the tax disputes
3
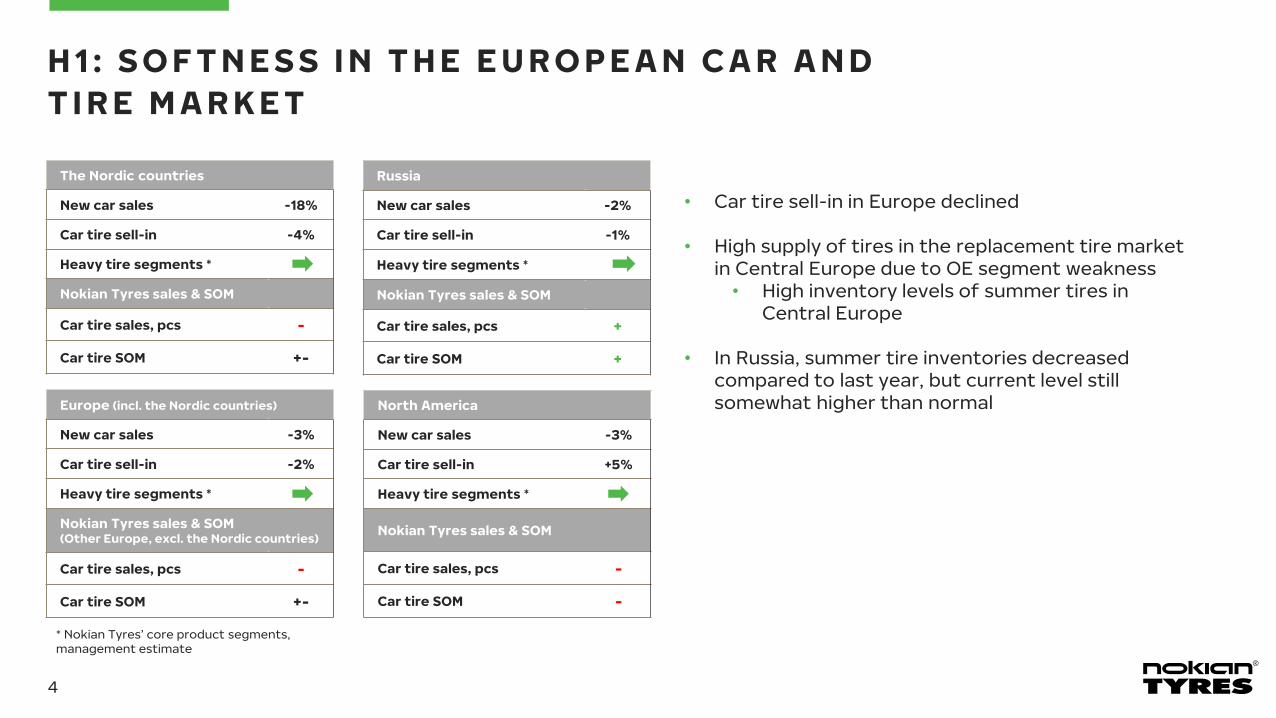
North America
New car sales -3%
Car tire sell-in +5%
Heavy tire segments *
Nokian Tyres sales & SOM
Car tire sales, pcs -
Car tire SOM -
Russia
New car sales -2%
Car tire sell-in -1%
Heavy tire segments *
Nokian Tyres sales & SOM
Car tire sales, pcs +
Car tire SOM +
Europe (incl. the Nordic countries)
New car sales -3%
Car tire sell-in -2%
Heavy tire segments *
Nokian Tyres sales & SOM (Other Europe, excl. the Nordic countries)
Car tire sales, pcs -
Car tire SOM +-
H 1 : S O F T N E S S I N T H E E U R O P E A N C A R A N D
T I R E M A R K E T
4
* Nokian Tyres’ core product segments, management estimate
The Nordic countries
New car sales -18%
Car tire sell-in -4%
Heavy tire segments *
Nokian Tyres sales & SOM
Car tire sales, pcs -
Car tire SOM +-
• Car tire sell-in in Europe declined
• High supply of tires in the replacement tire market in Central Europe due to OE segment weakness • High inventory levels of summer tires in
Central Europe
• In Russia, summer tire inventories decreased compared to last year, but current level still somewhat higher than normal

H1/2019

K E Y F I G U R E S H 1 / 2 0 1 9
6
* Comparable currencies ** EPS 1-6/19 excl. the impact of the rulings on the tax disputes of EUR 1.08 were EUR 0.86 *** Rolling 12 months
EUR, million4–6/19
4–6/18
Change%
CC*Change
%
1–6/19
1–6/18
Change%
CC*Change
%2018
Net sales 419.1 429.1 -2.3% -2.6% 762.8 765.2 -0.3% 0.2% 1,595.6
Operating profit 94.1 108.0 148.0 169.3 372.4
Operating profit % 22.4% 25.2% 19.4% 22.1% 23.3%
Profit before tax 88.9 105.4 179.5 165.4 361.7
Profit for the period 73.0 87.5 267.6 134.1 295.2
Earnings per share, EUR **
0.53 0.63 1.94 0.97 2.15
ROCE, % *** 20.4% 25.3% 23.3%
Equity ratio, % 70.5% 70.5% 71.0%
Cash flow from operating activities
-20.8 169.0 -89.8 150.6 536.9
Gearing, % 15.7% -7.2% -21.2%
Interest-bearingnet debt
252.0 -99.6 -315.2
Capital expenditure 93.7 47.4 148.0 64.9 226.5

H 1 : P A S S E N G E R C A R T Y R E S
• Average Sales Price with comparable currencies increased slightly due to mix and prices
• Operating profit decreased due to lower volumes, higher material costs and currencies• Production capacity utilization rates adjusted to be in line with the market demand
• At the end of 2018, Business Area Europe was split into Central Europe and Nordics, in order to have even more focus on these regions
• Creating one Nordics organization proceeding well• New head of Central Europe started in June
7
S o f t n e s s i n t h e c a r a n d t i r e m a r k e t i n E u r o p e
4–6/19
4–6/18
Change%
CC*Change
%
1–6/19
1–6/18
Change%
CC*Change
%
2018
Net sales, M€ 300.2 309.0 -2.8% -3.3% 556.5 568.0 -2.0% -1.5% 1,150.8
Operating profit, M€
79.9 94.5 143.1 168.5 356.5
Operating profit,%
26.6% 30.6% 25.7% 29.7% 31.0%
* Comparable currencies

NET SALES, M€
H 1 : P A S S E N G E R C A R T Y R E S B R I D G EN e g a t i v e i m p a c t o f E U R 7 . 6 m i l l i o n f r o m m a t e r i a l c o s t o n E B I T
EBIT, M€
8
3.0 -3.0
Volume1-6/2018
-11.5
Price/Mix Net Sales excl.
FX effect
Currency
568.0
1-6/2019
556.5559.5
-1.5%
-2.0% 0.5% -0.5%
3.0
143.1
Price/Mix Fixed CostProd. &
Other Cost
-7.6
Material cost
-5.5-2.5
EBIT excl.
FX effect
-7.1
1-6/2018 1-6/2019
150.2
-5.7
Volume
168.5
Currency

H 1 : P A S S E N G E R C A R T Y R E S N E T S A L E S –
Q U A R T E R L Y C H A N G E S
Q4Q3 Q1Q1 Q2
19.6%
Q2
8.3%
-2.8%-5.2%
1.5%
-5.0%
Q1
-0.4%
Q2Q1 Q3 Q4 Q2
3.7% 2.2% 1.8%
-0.8%
1.7%
Q2Q1 Q2 Q3 Q4 Q1
-7.5% -7.4%-3.1% -2.9% -1.8%
0.5%
V o l u m e s P r i c e / M i x C u r r e n c y
2 0 1 8 2 0 1 9 2 0 1 8 2 0 1 9 2 0 1 8 2 0 1 9
Y o Y C h a n g e %
9
H e a d w i n d f r o m c u r r e n c i e s t u r n i n g

H 1 : H E A V Y T Y R E S
• Sales of agricultural tires and forestry tires increased, in particular
• Operating profit increased due to the sales growth and inventory valuations that had a negative impact on the previous year’s operating profit
• Acquisition of a heavy equipment wheel company Levypyörä Oy supports growth strategy and enables even better service to OE and aftermarket customers
10
G o o d d e m a n d i n c o r e p r o d u c t g r o u p s
4–6/19
4–6/18
Change%
CC*Change
%
1–6/19
1–6/18
Change%
CC*Change
%
2018
Net sales, M€ 47.8 46.5 2.8% 2.6% 96.1 89.6 7.2% 7.2% 187.7
Operating profit, M€
8.3 4.9 17.3 13.2 28.6
Operating profit,%
17.4% 10.5% 18.0% 14.7% 15.2%
* Comparable currencies

H 1 : V I A N O R
• Net sales increased by 1.4% with comparable currencies
• Operating profit improvement was driven by increased operational efficiency,and better sales management
11
P r o f i t a b i l i t y i m p r o v i n g i n l i n e w i t h t h e p l a n
4–6/19
4–6/18
Change%
CC*Change
%
1–6/19
1–6/18
Change%
CC*Change
%
2018
Net sales, M€ 89.8 93.0 -3.5% -0.9% 146.7 146.2 0.3% 1.4% 337.2
Operating profit, M€
9.4 10.0 -2.6 -4.7 1.6
Operating profit, %
10.4% 10.7% -1.8% -3.2% 0.5%
Own service centers, pcs, at period end
188 193 188
* Comparable currencies

OUTLOOK

G U I D A N C E F O R 2 0 1 9
( U P D A T E D J U N E 1 4 )
In 2019, net sales with comparable currencies are
expected to be slightly higher and operating profit to be
lower compared to 2018.
In line with Nokian Tyres’ updated 2018 strategy, the
company is targeting further growth in Russia, Central
Europe, and North America. As a result of ongoing
investment programs to support the growth, operating
profit in 2019 will include significant additional operating
costs.
13

STRATEGIC JOURNEY
CONTINUES

S T R A T E G I C P R O J E C T S
S U P P O R T F U T U R E G R O W T H –
A L L P R O C E E D I N G A C C O R D I N G
T O T H E P L A N
New factory in the US
• The first test tire produced on time. Commercial production to
start in the beginning of 2020.
Testing center in Spain
• Most of the preparatory work for the test tracks completed.
Over 10 tracks for year-round testing of summer, all season
and winter tires will be ready in 2020. The largest single
investment in testing in Nokian Tyres’ history.
Heavy Tyres capacity expansion
• Increasing the production of commercial tires up to 50%, and
more than doubling the number of new products. The new
3,500-square-meter R&D center will be ready in 2019, the
factory will reach full capacity in 2021.
15

OUR
THREE-YEAR
PLAN
1. NOKIAN TYRES HAS A STRONG PLATFORM
FOR GROWTH
2. HIGH-MARGIN WINTER TIRES CONTINUE TO
BE OUR CORE BUSINESS
3. WE WILL SEIZE THE OPPORTUNITY FOR
GROWTH IN RUSSIA, CENTRAL EUROPE
AND NORTH AMERICA AND IN OTHER
WINTER AREAS
4. WE WILL CONTINUE TO DELIVER
PROFITABLE GROWTH, AHEAD OF THE
MARKET

P E A C E O F M I N DI N A L L C O N D I T I O N S

APPENDIX

G R O U P O P E R A T I N G P R O F I T
P E R Q U A R T E R 2 0 1 5–H 1 / 2 0 1 9
1 – 6 / 2 0 1 9
• Net sales 762.8 M€ (765.2 M€), -0.3%
• Operating profit 148.0 M€ (169.3 M€)
4 – 6 / 2 0 1 9
• Net sales 419.1 M€ (429.1 M€), -2.3%
• Operating profit 94.1 M€ (108.0 M€)
19
APPENDIX
C U M U L A T I V E O P E R A T I N G P R O F I T P E R R E V I E W P E R I O D
G R O U P O P E R A T I N G P R O F I T P E R Q U A R T E R
0
50
100
150
Q1 Q2 Q3 Q4
M€
2015 2016 2017 2018 2019
0
50
100
150
200
250
300
350
400
1–3 1–6 1–9 1–12
M€

NET SALES, M€
P A S S E N G E R C A R T Y R E S B R I D G E Q 2 / 2 0 1 9N e g a t i v e i m p a c t o f E U R 7 . 7 m i l l i o n f r o m v o l u m e o n E B I T
EBIT, M€
20
APPENDIX
5.1 1.5
Q2/2018 Price/Mix
298.6 300.2
Q2/2019Volume
-15.4
Net Sales excl.
FX effect
Currency
309.0
-3.3%
-5.0% 1.7% 0.5%
5.1-5.2
Prod. &
Other Cost
Currency
-7.7
Fixed CostVolumeQ2/2018 Price/Mix
-3.1
79.9
Material cost EBIT excl.
FX effect
-0.7
Q2/2019
94.5
80.6-3.1

M A T E R I A L
C O S T D E V E L O P M E N T
21
I n c r e a s e d i n H 1 / 2 0 1 9
APPENDIX
M A T E R I A L C O S T D E V E L O P M E N T I N D E X 2 0 1 0 – E 2 0 1 9
100
131 131
114
96
8379
92 9295
70
80
90
100
110
120
130
140
2010 2011 2012 2013 2014 2015 2016 2017 2018 E2019
9594
9091
9091
9598
95
70
75
80
85
90
95
100
Q2/2017 Q3/2017 Q4/2017 Q1/2018 Q2/2018 Q3/2018 Q4/2018 Q1/2019 Q2/2019
M A T E R I A L C O S T S
( € / K G )
• Increased by 5.8% in Q2/2019
vs. Q2/2018
• Decreased by 2.4% in Q2/2019
vs. Q1/2019
• Increased by 6.7% in H1/2019
vs. H1/2018
Incl. raw and other materials in reported currencies

ICELAND4
UK57
PORTUGAL32
SPAIN116
FRANCE13131
BELGIUM8
NETHER-LANDS
33 GERMANY30317
SWIZERLAND59
NORWAY136
SWEDEN101
FINLAND108
RUSSIA334120
KAZAKHSTAN168
GEORGIA23
CHINA182
AZERBAJAN2
ARMENIA3
TURKEY37
ESTONIA10
LATVIA4 6
LITHUANIA4
BELARUS3 1
UKRAINE167 251
POLAND55 94
ITALY433
DENMARK60
CZECH REP.65 SLOVAKIA
24
SLOVENIA37
CROATIA11
AUSTRIA33
HUNGARY43
ROMANIA45
BULGARIA63 40
SERBIA25 6
MACEDONIA8
MOLDOVA8
N A D
N - T Y R E
V I A N O R
19
GREECE40
N E T W O R K D E V E L O P M E N T P R O G R E S S E D
VIANOR – 1,287 SERVICE CENTERS
IN 24 COUNTRIES
188 own stores and 1,099 partners
Own unchanged, partner -31 vs. year-end 2018
• Largest tire chain in the Nordic countries: 345 service centers (+6 vs. year-end 2018)
• Largest tire chain in Russia and CIS: 381 service centers (+5 vs. year-end 2018)
• Central Europe: 550 service centers (-42 vs. year-end 2018)
• USA: 11 service centers (unchanged vs. year-end 2018)
NOKIAN TYRES AUTHORIZED DEALERS (NAD)
– 2,275 STORES
• In 24 European countries, USA and China
• Increase of 113 stores vs. year-end 2018
N-TYRE – 129 STORES
• In Russia, Kazakhstan and Belarus
• Increase of 2 stores vs. year-end 2018
22
V i a n o r , N A D , N - T y r e ; + 8 4 s t o r e s i n 1 – 6 / 2 0 1 9
APPENDIX
1
254USA
11

Disclaimer
Statements in this presentation, which are not historical facts, such as expectations,
anticipations, beliefs and estimates, are forward-looking statements within the meaning of the
United States Private Securities Litigation Reform Act of 1995. Such statements involve risks and
uncertainties which may cause actual results to materially differ from those expressed in such
forward-looking statements. Nokian Tyres assumes no responsibility to update any of the
forward-looking statements contained herein. No representation or warranty, express or implied,
is made or given by or on behalf of Nokian Tyres or its employees or any other person as to the
accuracy, completeness or fairness of the information or opinions contained in this presentation.
IT’S A BEAUTIFUL JOURNEY