INTERIM FINANCIAL REPORT C · PDF fileCAPGEMINI JUNE 30, 2017 4 STATUTORY AUDITORS’...
25
CAPGEMINI JUNE 30, 2017 1 INTERIM FINANCIAL REPORT CONSOLIDATED FINANCIAL STATEMENTS
Transcript of INTERIM FINANCIAL REPORT C · PDF fileCAPGEMINI JUNE 30, 2017 4 STATUTORY AUDITORS’...

CAPGEMINI JUNE 30, 2017 1
INTERIM FINANCIAL REPORT
CONSOLIDATED FINANCIAL STATEMENTS

CAPGEMINI JUNE 30, 2017 2
CONTENTS
FINANCIAL HIGHLIGHTS .............................. ................................................................................................................................ 3
STATUTORY AUDITORS’ REPORT ON THE 2017 INTERIM FINANCIAL INFORMATION ......................................................... 4
INTERIM FINANCIAL REVIEW............................... ........................................................................................................................ 5
CONDENSED INTERIM CONSOLIDATED FINANCIAL STATEMENTS FOR THE HA LF-YEAR ENDED JUNE 30, 2017 .......... 9
DECLARATION BY THE PERSON RESPONSIBLE FOR THE INTERIM FINANCIAL REPORT ................................................25
CAPGEMINI JUNE 30, 2017 3
FINANCIAL HIGHLIGHTS CONSOLIDATED FINANCIAL STATEMENTS
in millions of euros First-half
2013 First-half
2014 First-half
2015 First-half
2016 First-half
2017
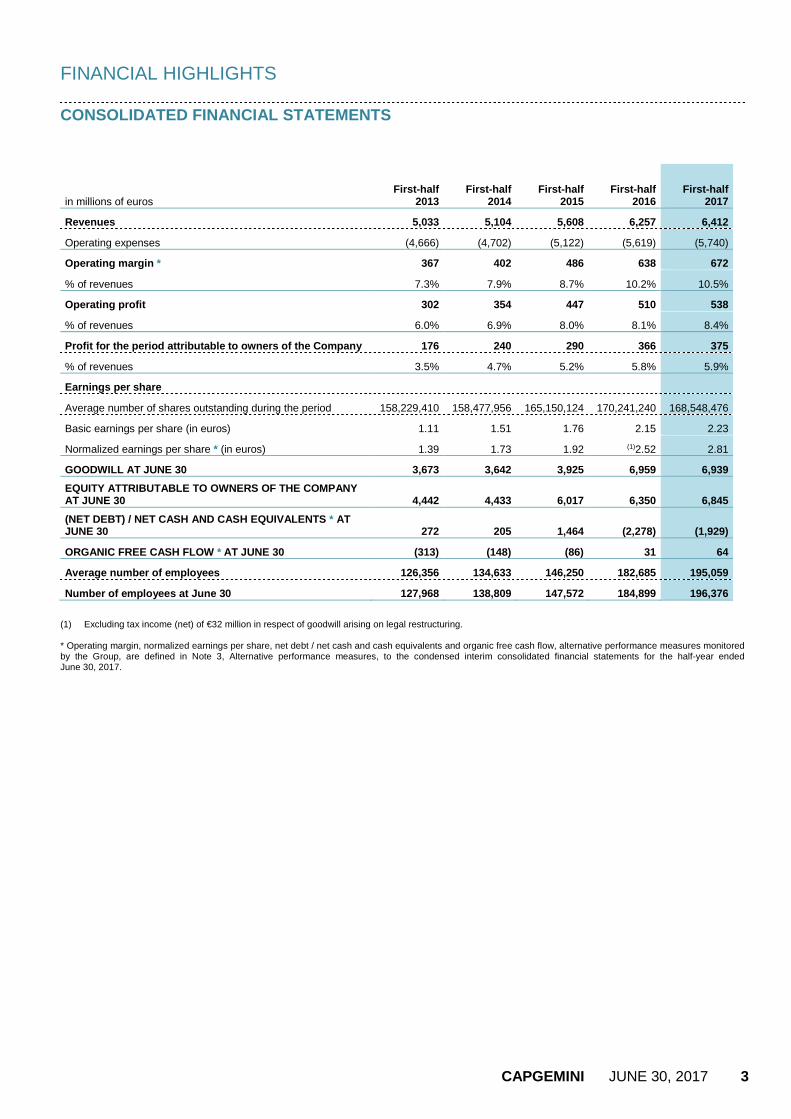
Revenues 5,033 5,104 5,608 6,257 6,412
Operating expenses (4,666) (4,702) (5,122) (5,619) (5,740)
Operating margin * 367 402 486 638 672
% of revenues 7.3% 7.9% 8.7% 10.2% 10.5%
Operating profit 302 354 447 510 538
% of revenues 6.0% 6.9% 8.0% 8.1% 8.4%
Profit for the period attributable to owners of the Company 176 240 290 366 375
% of revenues 3.5% 4.7% 5.2% 5.8% 5.9%
Earnings per share
Average number of shares outstanding during the period 158,229,410 158,477,956 165,150,124 170,241,240 168,548,476
Basic earnings per share (in euros) 1.11 1.51 1.76 2.15 2.23
Normalized earnings per share * (in euros) 1.39 1.73 1.92 (1)2.52 2.81
GOODWILL AT JUNE 30 3,673 3,642 3,925 6,959 6,939
EQUITY ATTRIBUTABLE TO OWNERS OF THE COMPANY AT JUNE 30 4,442 4,433 6,017 6,350 6,845
(NET DEBT) / NET CASH AND CASH EQUIVALENTS * AT JUNE 30 272 205 1,464 (2,278) (1,929)
ORGANIC FREE CASH FLOW * AT JUNE 30 (313) (148) (86) 31 64
Average number of employees 126,356 134,633 146,250 182,685 195,059
Number of employees at June 30 127,968 138,809 147,572 184,899 196,376
(1) Excluding tax income (net) of €32 million in respect of goodwill arising on legal restructuring. * Operating margin, normalized earnings per share, net debt / net cash and cash equivalents and organic free cash flow, alternative performance measures monitored by the Group, are defined in Note 3, Alternative performance measures, to the condensed interim consolidated financial statements for the half-year ended June 30, 2017.
CAPGEMINI JUNE 30, 2017 4
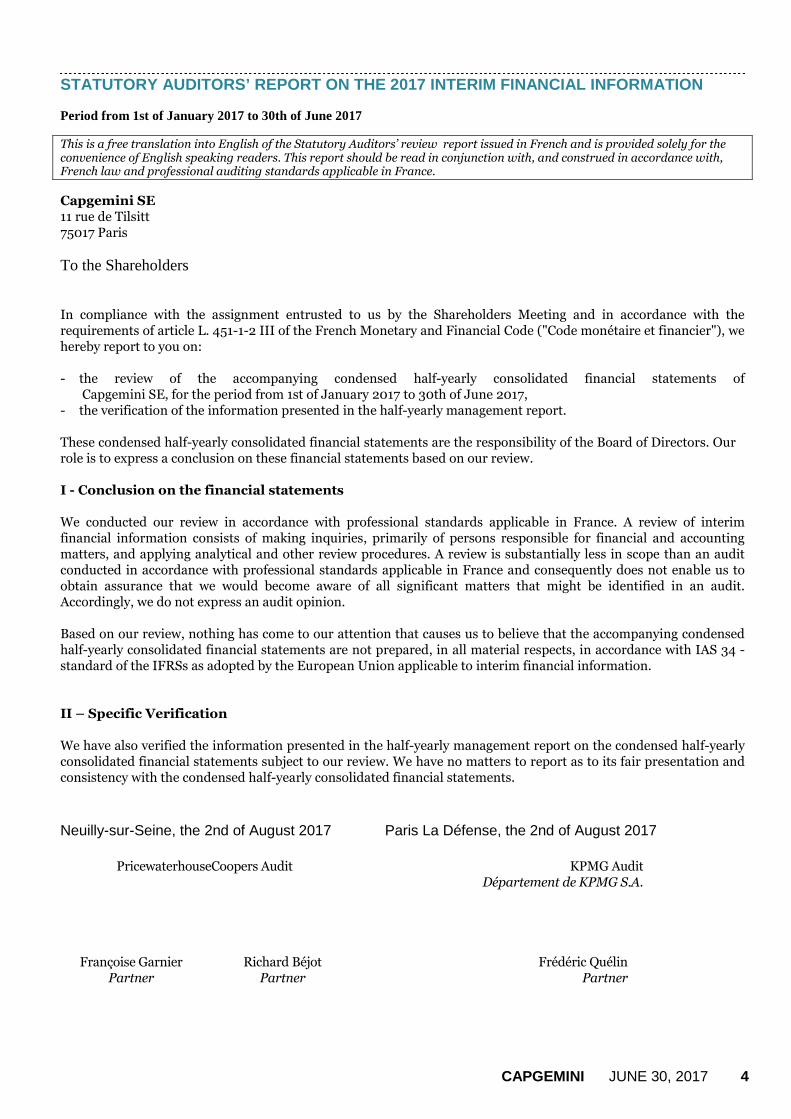
STATUTORY AUDITORS’ REPORT ON THE 2017 INTERIM FINA NCIAL INFORMATION
Period from 1st of January 2017 to 30th of June 2017
This is a free translation into English of the Statutory Auditors’ review report issued in French and is provided solely for the convenience of English speaking readers. This report should be read in conjunction with, and construed in accordance with, French law and professional auditing standards applicable in France.
Capgemini SE 11 rue de Tilsitt 75017 Paris
To the Shareholders
In compliance with the assignment entrusted to us by the Shareholders Meeting and in accordance with the requirements of article L. 451-1-2 III of the French Monetary and Financial Code ("Code monétaire et financier"), we hereby report to you on: - the review of the accompanying condensed half-yearly consolidated financial statements of
Capgemini SE, for the period from 1st of January 2017 to 30th of June 2017, - the verification of the information presented in the half-yearly management report. These condensed half-yearly consolidated financial statements are the responsibility of the Board of Directors. Our role is to express a conclusion on these financial statements based on our review. I - Conclusion on the financial statements We conducted our review in accordance with professional standards applicable in France. A review of interim financial information consists of making inquiries, primarily of persons responsible for financial and accounting matters, and applying analytical and other review procedures. A review is substantially less in scope than an audit conducted in accordance with professional standards applicable in France and consequently does not enable us to obtain assurance that we would become aware of all significant matters that might be identified in an audit. Accordingly, we do not express an audit opinion. Based on our review, nothing has come to our attention that causes us to believe that the accompanying condensed half-yearly consolidated financial statements are not prepared, in all material respects, in accordance with IAS 34 - standard of the IFRSs as adopted by the European Union applicable to interim financial information. II – Specific Verification We have also verified the information presented in the half-yearly management report on the condensed half-yearly consolidated financial statements subject to our review. We have no matters to report as to its fair presentation and consistency with the condensed half-yearly consolidated financial statements.
Neuilly-sur-Seine, the 2nd of August 2017 Paris La Défense, the 2nd of August 2017
PricewaterhouseCoopers Audit
KPMG Audit Département de KPMG S.A.
Françoise Garnier
Partner
Richard Béjot
Partner
Frédéric Quélin
Partner
CAPGEMINI JUNE 30, 2017 5
INTERIM FINANCIAL REVIEW FIRST-HALF 2017 HIGHLIGHTS
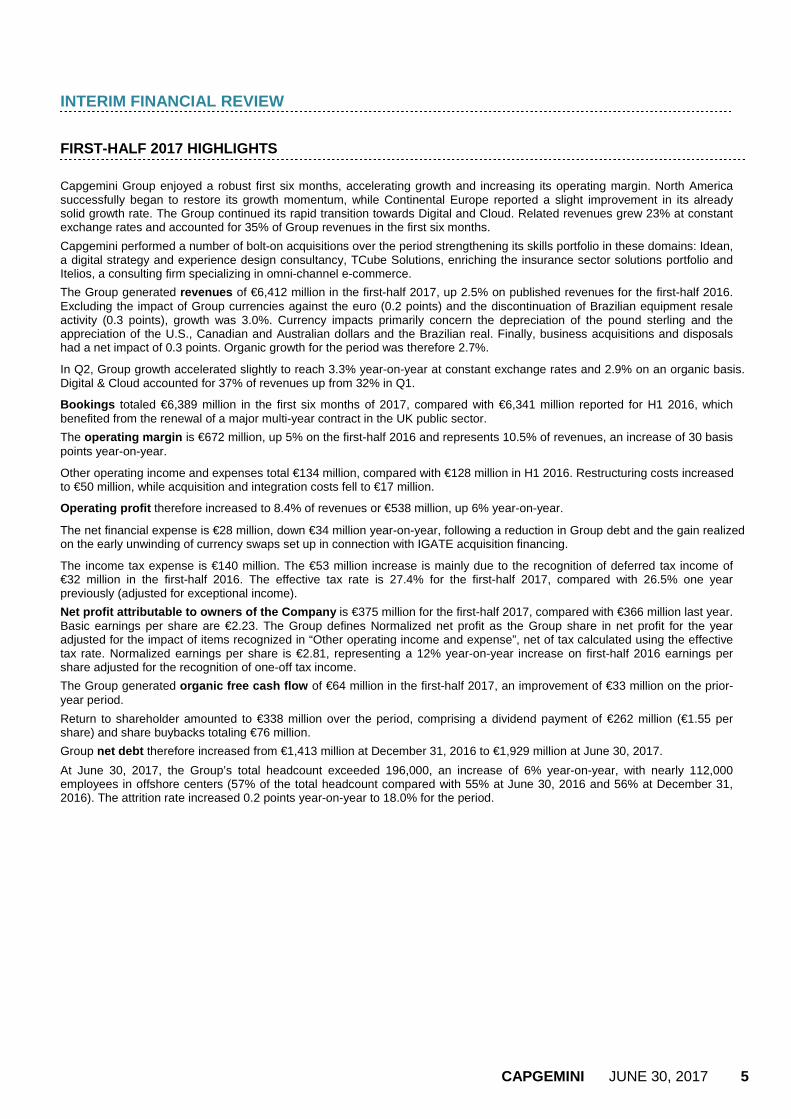
Capgemini Group enjoyed a robust first six months, accelerating growth and increasing its operating margin. North America successfully began to restore its growth momentum, while Continental Europe reported a slight improvement in its already solid growth rate. The Group continued its rapid transition towards Digital and Cloud. Related revenues grew 23% at constant exchange rates and accounted for 35% of Group revenues in the first six months.
Capgemini performed a number of bolt-on acquisitions over the period strengthening its skills portfolio in these domains: Idean, a digital strategy and experience design consultancy, TCube Solutions, enriching the insurance sector solutions portfolio and Itelios, a consulting firm specializing in omni-channel e-commerce.
The Group generated revenues of €6,412 million in the first-half 2017, up 2.5% on published revenues for the first-half 2016. Excluding the impact of Group currencies against the euro (0.2 points) and the discontinuation of Brazilian equipment resale activity (0.3 points), growth was 3.0%. Currency impacts primarily concern the depreciation of the pound sterling and the appreciation of the U.S., Canadian and Australian dollars and the Brazilian real. Finally, business acquisitions and disposals had a net impact of 0.3 points. Organic growth for the period was therefore 2.7%.
In Q2, Group growth accelerated slightly to reach 3.3% year-on-year at constant exchange rates and 2.9% on an organic basis. Digital & Cloud accounted for 37% of revenues up from 32% in Q1.
Bookings totaled €6,389 million in the first six months of 2017, compared with €6,341 million reported for H1 2016, which benefited from the renewal of a major multi-year contract in the UK public sector.
The operating margin is €672 million, up 5% on the first-half 2016 and represents 10.5% of revenues, an increase of 30 basis points year-on-year.
Other operating income and expenses total €134 million, compared with €128 million in H1 2016. Restructuring costs increased to €50 million, while acquisition and integration costs fell to €17 million.
Operating profit therefore increased to 8.4% of revenues or €538 million, up 6% year-on-year.
The net financial expense is €28 million, down €34 million year-on-year, following a reduction in Group debt and the gain realized on the early unwinding of currency swaps set up in connection with IGATE acquisition financing.
The income tax expense is €140 million. The €53 million increase is mainly due to the recognition of deferred tax income of €32 million in the first-half 2016. The effective tax rate is 27.4% for the first-half 2017, compared with 26.5% one year previously (adjusted for exceptional income).
Net profit attributable to owners of the Company is €375 million for the first-half 2017, compared with €366 million last year. Basic earnings per share are €2.23. The Group defines Normalized net profit as the Group share in net profit for the year adjusted for the impact of items recognized in “Other operating income and expense”, net of tax calculated using the effective tax rate. Normalized earnings per share is €2.81, representing a 12% year-on-year increase on first-half 2016 earnings per share adjusted for the recognition of one-off tax income.
The Group generated organic free cash flow of €64 million in the first-half 2017, an improvement of €33 million on the prior-year period.
Return to shareholder amounted to €338 million over the period, comprising a dividend payment of €262 million (€1.55 per share) and share buybacks totaling €76 million.
Group net debt therefore increased from €1,413 million at December 31, 2016 to €1,929 million at June 30, 2017.
At June 30, 2017, the Group’s total headcount exceeded 196,000, an increase of 6% year-on-year, with nearly 112,000 employees in offshore centers (57% of the total headcount compared with 55% at June 30, 2016 and 56% at December 31, 2016). The attrition rate increased 0.2 points year-on-year to 18.0% for the period.
CAPGEMINI JUNE 30, 2017 6
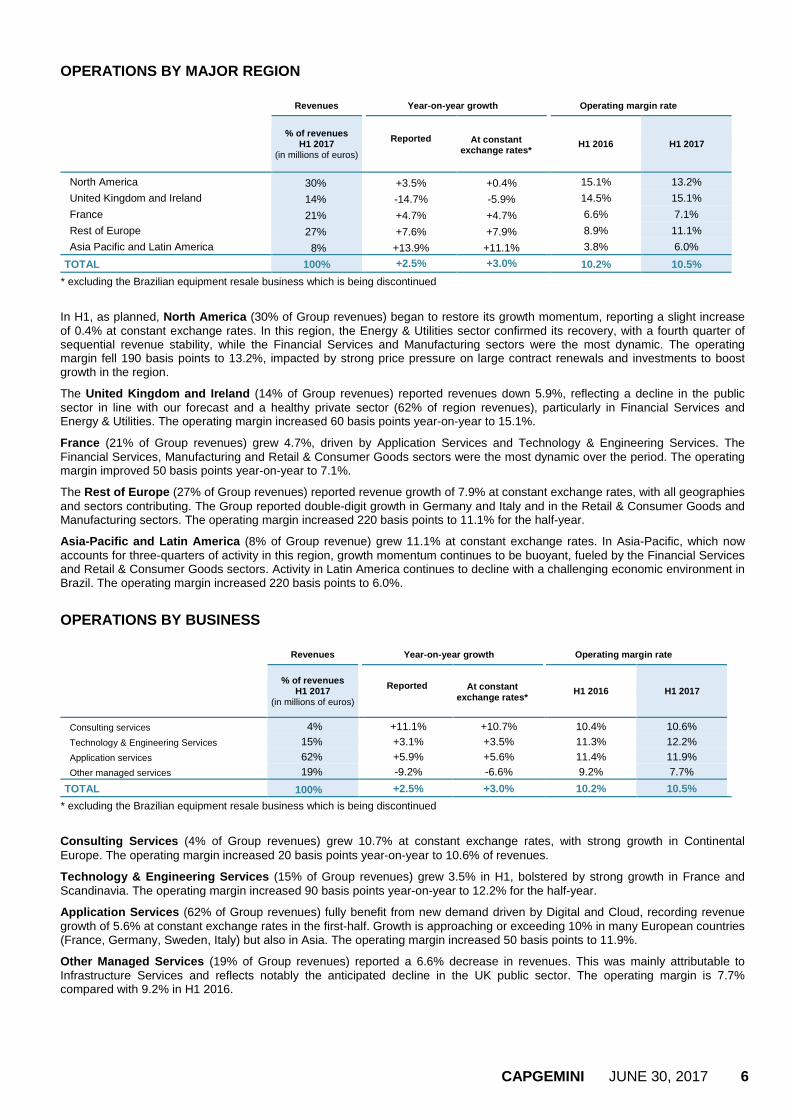
OPERATIONS BY MAJOR REGION Revenues Year-on-year growth Operating margin rate
% of revenues
H1 2017 (in millions of euros)
Reported
At constant exchange rates*
H1 2016 H1 2017
North America 30% +3.5% +0.4% 15.1% 13.2%
United Kingdom and Ireland 14% -14.7% -5.9% 14.5% 15.1%
France 21% +4.7% +4.7% 6.6% 7.1%
Rest of Europe 27% +7.6% +7.9% 8.9% 11.1%
Asia Pacific and Latin America 8% +13.9% +11.1% 3.8% 6.0%
TOTAL 100% +2.5% +3.0% 10.2% 10.5%
* excluding the Brazilian equipment resale business which is being discontinued
In H1, as planned, North America (30% of Group revenues) began to restore its growth momentum, reporting a slight increase of 0.4% at constant exchange rates. In this region, the Energy & Utilities sector confirmed its recovery, with a fourth quarter of sequential revenue stability, while the Financial Services and Manufacturing sectors were the most dynamic. The operating margin fell 190 basis points to 13.2%, impacted by strong price pressure on large contract renewals and investments to boost growth in the region.
The United Kingdom and Ireland (14% of Group revenues) reported revenues down 5.9%, reflecting a decline in the public sector in line with our forecast and a healthy private sector (62% of region revenues), particularly in Financial Services and Energy & Utilities. The operating margin increased 60 basis points year-on-year to 15.1%.
France (21% of Group revenues) grew 4.7%, driven by Application Services and Technology & Engineering Services. The Financial Services, Manufacturing and Retail & Consumer Goods sectors were the most dynamic over the period. The operating margin improved 50 basis points year-on-year to 7.1%.
The Rest of Europe (27% of Group revenues) reported revenue growth of 7.9% at constant exchange rates, with all geographies and sectors contributing. The Group reported double-digit growth in Germany and Italy and in the Retail & Consumer Goods and Manufacturing sectors. The operating margin increased 220 basis points to 11.1% for the half-year.
Asia-Pacific and Latin America (8% of Group revenue) grew 11.1% at constant exchange rates. In Asia-Pacific, which now accounts for three-quarters of activity in this region, growth momentum continues to be buoyant, fueled by the Financial Services and Retail & Consumer Goods sectors. Activity in Latin America continues to decline with a challenging economic environment in Brazil. The operating margin increased 220 basis points to 6.0%.
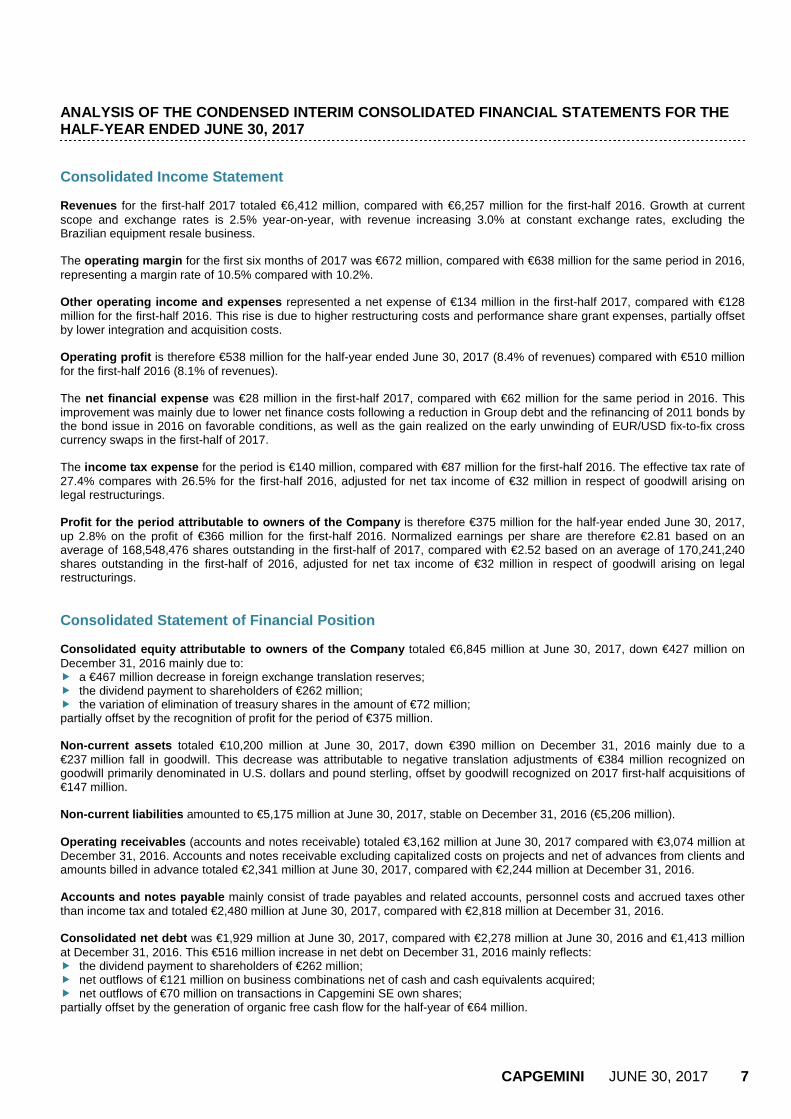
OPERATIONS BY BUSINESS Revenues Year-on-year growth Operating margin rate
% of revenues
H1 2017 (in millions of euros)
Reported
At constant
exchange rates* H1 2016 H1 2017
Consulting services 4% +11.1% +10.7% 10.4% 10.6%
Technology & Engineering Services 15% +3.1% +3.5% 11.3% 12.2%
Application services 62% +5.9% +5.6% 11.4% 11.9%
Other managed services 19% -9.2% -6.6% 9.2% 7.7%
TOTAL 100% +2.5% +3.0% 10.2% 10.5%
* excluding the Brazilian equipment resale business which is being discontinued
Consulting Services (4% of Group revenues) grew 10.7% at constant exchange rates, with strong growth in Continental Europe. The operating margin increased 20 basis points year-on-year to 10.6% of revenues.
Technology & Engineering Services (15% of Group revenues) grew 3.5% in H1, bolstered by strong growth in France and Scandinavia. The operating margin increased 90 basis points year-on-year to 12.2% for the half-year.
Application Services (62% of Group revenues) fully benefit from new demand driven by Digital and Cloud, recording revenue growth of 5.6% at constant exchange rates in the first-half. Growth is approaching or exceeding 10% in many European countries (France, Germany, Sweden, Italy) but also in Asia. The operating margin increased 50 basis points to 11.9%.
Other Managed Services (19% of Group revenues) reported a 6.6% decrease in revenues. This was mainly attributable to Infrastructure Services and reflects notably the anticipated decline in the UK public sector. The operating margin is 7.7% compared with 9.2% in H1 2016.
CAPGEMINI JUNE 30, 2017 7
ANALYSIS OF THE CONDENSED INTERIM CONSOLIDATED FINA NCIAL STATEMENTS FOR THE HALF-YEAR ENDED JUNE 30, 2017 Consolidated Income Statement Revenues for the first-half 2017 totaled €6,412 million, compared with €6,257 million for the first-half 2016. Growth at current scope and exchange rates is 2.5% year-on-year, with revenue increasing 3.0% at constant exchange rates, excluding the Brazilian equipment resale business. The operating margin for the first six months of 2017 was €672 million, compared with €638 million for the same period in 2016, representing a margin rate of 10.5% compared with 10.2%. Other operating income and expenses represented a net expense of €134 million in the first-half 2017, compared with €128 million for the first-half 2016. This rise is due to higher restructuring costs and performance share grant expenses, partially offset by lower integration and acquisition costs. Operating profit is therefore €538 million for the half-year ended June 30, 2017 (8.4% of revenues) compared with €510 million for the first-half 2016 (8.1% of revenues). The net financial expense was €28 million in the first-half 2017, compared with €62 million for the same period in 2016. This improvement was mainly due to lower net finance costs following a reduction in Group debt and the refinancing of 2011 bonds by the bond issue in 2016 on favorable conditions, as well as the gain realized on the early unwinding of EUR/USD fix-to-fix cross currency swaps in the first-half of 2017. The income tax expense for the period is €140 million, compared with €87 million for the first-half 2016. The effective tax rate of 27.4% compares with 26.5% for the first-half 2016, adjusted for net tax income of €32 million in respect of goodwill arising on legal restructurings. Profit for the period attributable to owners of the Company is therefore €375 million for the half-year ended June 30, 2017, up 2.8% on the profit of €366 million for the first-half 2016. Normalized earnings per share are therefore €2.81 based on an average of 168,548,476 shares outstanding in the first-half of 2017, compared with €2.52 based on an average of 170,241,240 shares outstanding in the first-half of 2016, adjusted for net tax income of €32 million in respect of goodwill arising on legal restructurings. Consolidated Statement of Financial Position Consolidated equity attributable to owners of the C ompany totaled €6,845 million at June 30, 2017, down €427 million on December 31, 2016 mainly due to: � a €467 million decrease in foreign exchange translation reserves; � the dividend payment to shareholders of €262 million; � the variation of elimination of treasury shares in the amount of €72 million; partially offset by the recognition of profit for the period of €375 million. Non-current assets totaled €10,200 million at June 30, 2017, down €390 million on December 31, 2016 mainly due to a €237 million fall in goodwill. This decrease was attributable to negative translation adjustments of €384 million recognized on goodwill primarily denominated in U.S. dollars and pound sterling, offset by goodwill recognized on 2017 first-half acquisitions of €147 million. Non-current liabilities amounted to €5,175 million at June 30, 2017, stable on December 31, 2016 (€5,206 million). Operating receivables (accounts and notes receivable) totaled €3,162 million at June 30, 2017 compared with €3,074 million at December 31, 2016. Accounts and notes receivable excluding capitalized costs on projects and net of advances from clients and amounts billed in advance totaled €2,341 million at June 30, 2017, compared with €2,244 million at December 31, 2016. Accounts and notes payable mainly consist of trade payables and related accounts, personnel costs and accrued taxes other than income tax and totaled €2,480 million at June 30, 2017, compared with €2,818 million at December 31, 2016. Consolidated net debt was €1,929 million at June 30, 2017, compared with €2,278 million at June 30, 2016 and €1,413 million at December 31, 2016. This €516 million increase in net debt on December 31, 2016 mainly reflects: � the dividend payment to shareholders of €262 million; � net outflows of €121 million on business combinations net of cash and cash equivalents acquired; � net outflows of €70 million on transactions in Capgemini SE own shares; partially offset by the generation of organic free cash flow for the half-year of €64 million.
CAPGEMINI JUNE 30, 2017 8
RELATED PARTIES No material transactions with related parties took place in the first-half 2017. MAIN RISKS AND UNCERTAINTIES FOR THE SECOND-HALF 20 17 The nature and degree of risks to which the Group is exposed have not changed from those presented on pages 26 to 35 of the 2016 Registration Document. OUTLOOK FOR FISCAL YEAR 2017
For 2017, the Group forecasts revenue growth at constant exchange rates of 3.0%, an operating margin of 11.7% to 11.9% and organic free cash flow generation in excess of €950 million.
In addition: � The impact of currency movements on revenues on a full-year basis is now expected to be negative by slightly more
than 1 point (compared with a positive but negligible impact expected at the start of the year), following the strengthening of the Euro against the Group’s main currencies;
� As announced in February 2017, the Group has decided to discontinue its equipment resale activity in Brazil, which represented approximately €60 million in 2016; to ensure comparable analysis of quarterly trends, organic growth and growth at constant exchange rates are presented after removing this activity from 2016 and 2017 revenues;
� The impact of acquisitions on revenue growth is estimated at this stage to be a few tens of basis points.
CAPGEMINI JUNE 30, 2017 9
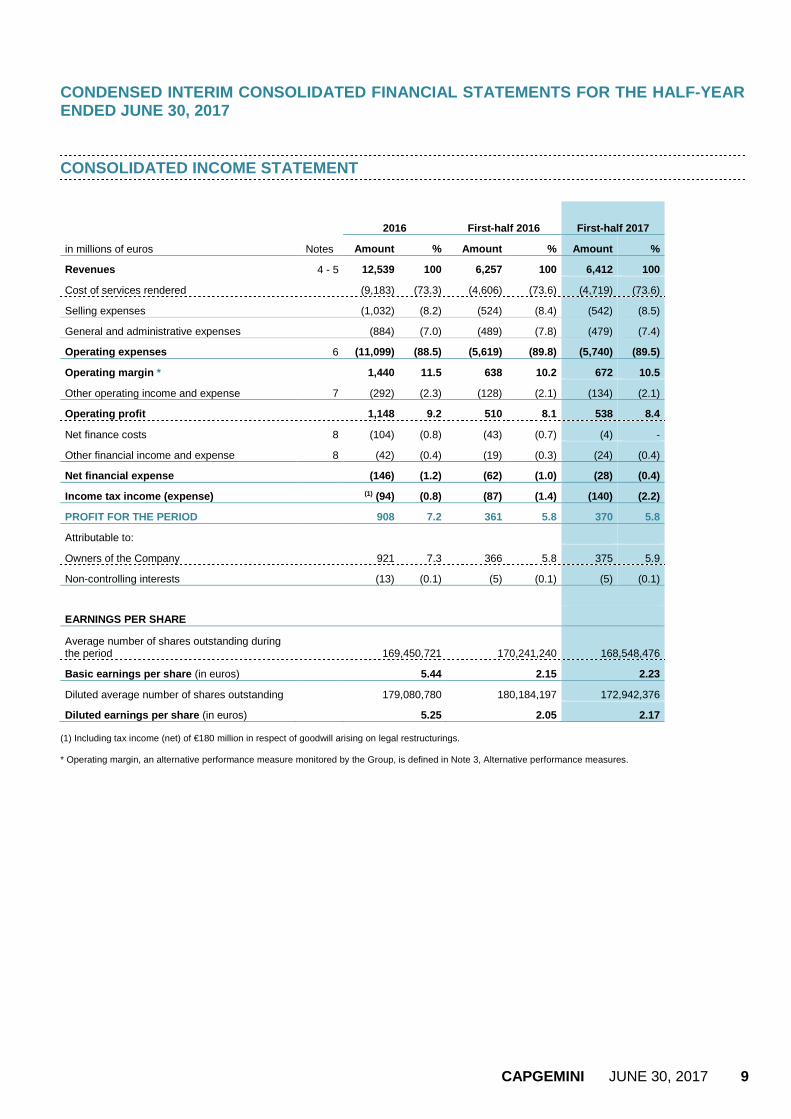
CONDENSED INTERIM CONSOLIDATED FINANCIAL STATEMENTS FOR THE HALF-YEAR ENDED JUNE 30, 2017 CONSOLIDATED INCOME STATEMENT
2016 First-half 2016 First-half 2017
in millions of euros Notes Amount % Amount % Amount %
Revenues 4 - 5 12,539 100 6,257 100 6,412 100
Cost of services rendered (9,183) (73.3) (4,606) (73.6) (4,719) (73.6)
Selling expenses (1,032) (8.2) (524) (8.4) (542) (8.5)
General and administrative expenses (884) (7.0) (489) (7.8) (479) (7.4)
Operating expenses 6 (11,099) (88.5) (5,619) (89.8) (5,740) (89.5)
Operating margin * 1,440 11.5 638 10.2 672 10.5
Other operating income and expense 7 (292) (2.3) (128) (2.1) (134) (2.1)
Operating profit 1,148 9.2 510 8.1 538 8.4
Net finance costs 8 (104) (0.8) (43) (0.7) (4) -
Other financial income and expense 8 (42) (0.4) (19) (0.3) (24) (0.4)
Net financial expense (146) (1.2) (62) (1.0) (28) (0.4)
Income tax income (expense) (1) (94) (0.8) (87) (1.4) (140) (2.2)
PROFIT FOR THE PERIOD
908 7.2 361 5.8 370 5.8
Attributable to:
Owners of the Company 921 7.3 366 5.8 375 5.9
Non-controlling interests (13) (0.1) (5) (0.1) (5) (0.1)
EARNINGS PER SHARE
Average number of shares outstanding during the period 169,450,721 170,241,240 168,548,476
Basic earnings per share (in euros) 5.44 2.15 2.23
Diluted average number of shares outstanding 179,080,780 180,184,197 172,942,376
Diluted earnings per share (in euros) 5.25 2.05 2.17 (1) Including tax income (net) of €180 million in respect of goodwill arising on legal restructurings. * Operating margin, an alternative performance measure monitored by the Group, is defined in Note 3, Alternative performance measures.
CAPGEMINI JUNE 30, 2017 10
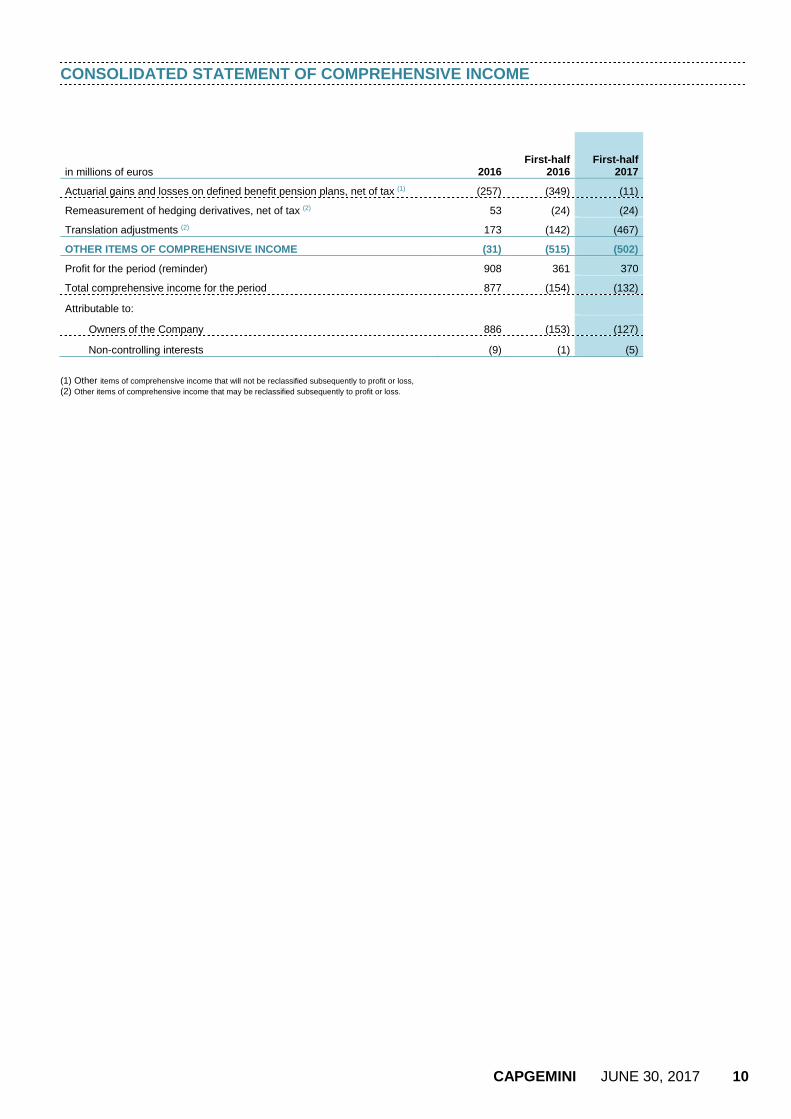
CONSOLIDATED STATEMENT OF COMPREHENSIVE INCOME
in millions of euros 2016 First-half
2016 First-half
2017
Actuarial gains and losses on defined benefit pension plans, net of tax (1) (257) (349) (11)
Remeasurement of hedging derivatives, net of tax (2) 53 (24) (24)
Translation adjustments (2) 173 (142) (467)
OTHER ITEMS OF COMPREHENSIVE INCOME (31) (515) (502)
Profit for the period (reminder) 908 361 370
Total comprehensive income for the period 877 (154) (132)
Attributable to:
Owners of the Company 886 (153) (127)
Non-controlling interests (9) (1) (5)
(1) Other items of comprehensive income that will not be reclassified subsequently to profit or loss, (2) Other items of comprehensive income that may be reclassified subsequently to profit or loss.
CAPGEMINI JUNE 30, 2017 11
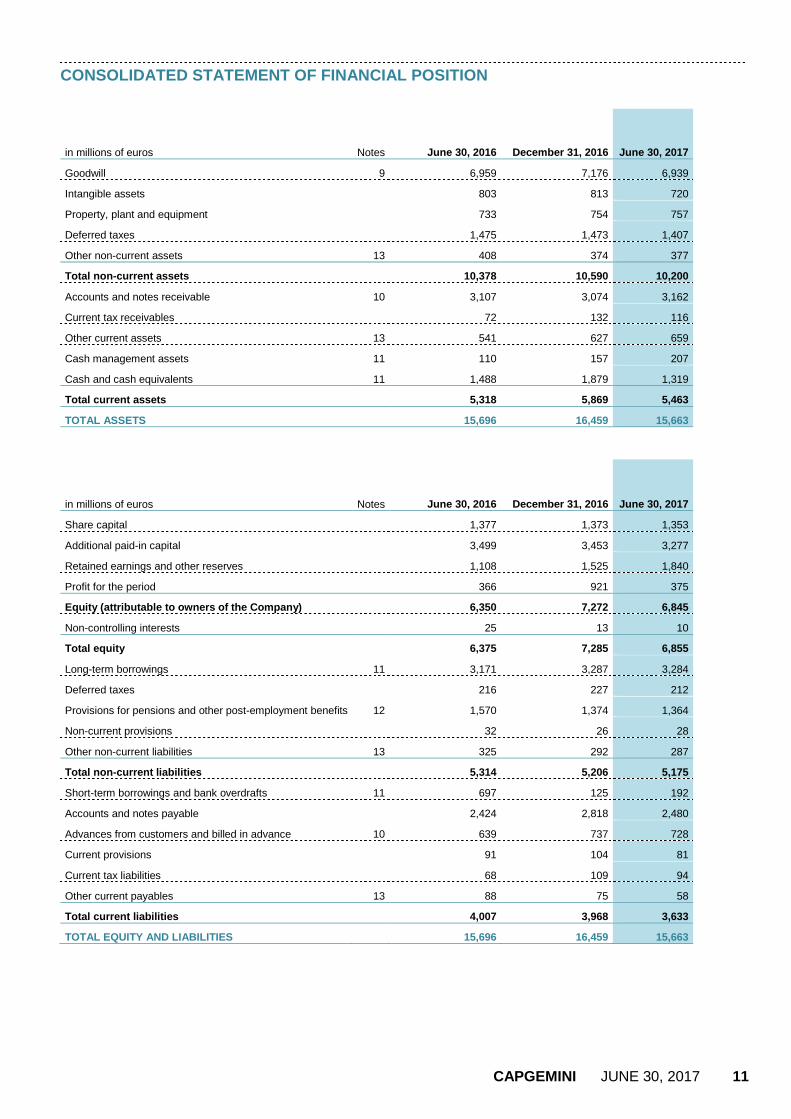
CONSOLIDATED STATEMENT OF FINANCIAL POSITION
in millions of euros Notes June 30, 2016 December 31, 2016 June 30, 2017
Goodwill 9 6,959 7,176 6,939
Intangible assets 803 813 720
Property, plant and equipment 733 754 757
Deferred taxes 1,475 1,473 1,407
Other non-current assets 13 408 374 377
Total non-current assets 10,378 10,590 10,200
Accounts and notes receivable 10 3,107 3,074 3,162
Current tax receivables 72 132 116
Other current assets 13 541 627 659
Cash management assets 11 110 157 207
Cash and cash equivalents 11 1,488 1,879 1,319
Total current assets
5,318 5,869 5,463
TOTAL ASSETS
15,696 16,459 15,663
in millions of euros Notes June 30, 2016 December 31, 2016 June 30, 2017
Share capital 1,377 1,373 1,353
Additional paid-in capital 3,499 3,453 3,277
Retained earnings and other reserves 1,108 1,525 1,840
Profit for the period 366 921 375
Equity (attributable to owners of the Company) 6,350 7,272 6,845
Non-controlling interests 25 13 10
Total equity 6,375 7,285 6,855
Long-term borrowings 11 3,171 3,287 3,284
Deferred taxes 216 227 212
Provisions for pensions and other post-employment benefits 12 1,570 1,374 1,364
Non-current provisions 32 26 28
Other non-current liabilities 13 325 292 287
Total non-current liabilities 5,314 5,206 5,175
Short-term borrowings and bank overdrafts 11 697 125 192
Accounts and notes payable 2,424 2,818 2,480
Advances from customers and billed in advance 10 639 737 728
Current provisions 91 104 81
Current tax liabilities 68 109 94
Other current payables 13 88 75 58
Total current liabilities 4,007 3,968 3,633
TOTAL EQUITY AND LIABILITIES
15,696 16,459 15,663
CAPGEMINI JUNE 30, 2017 12
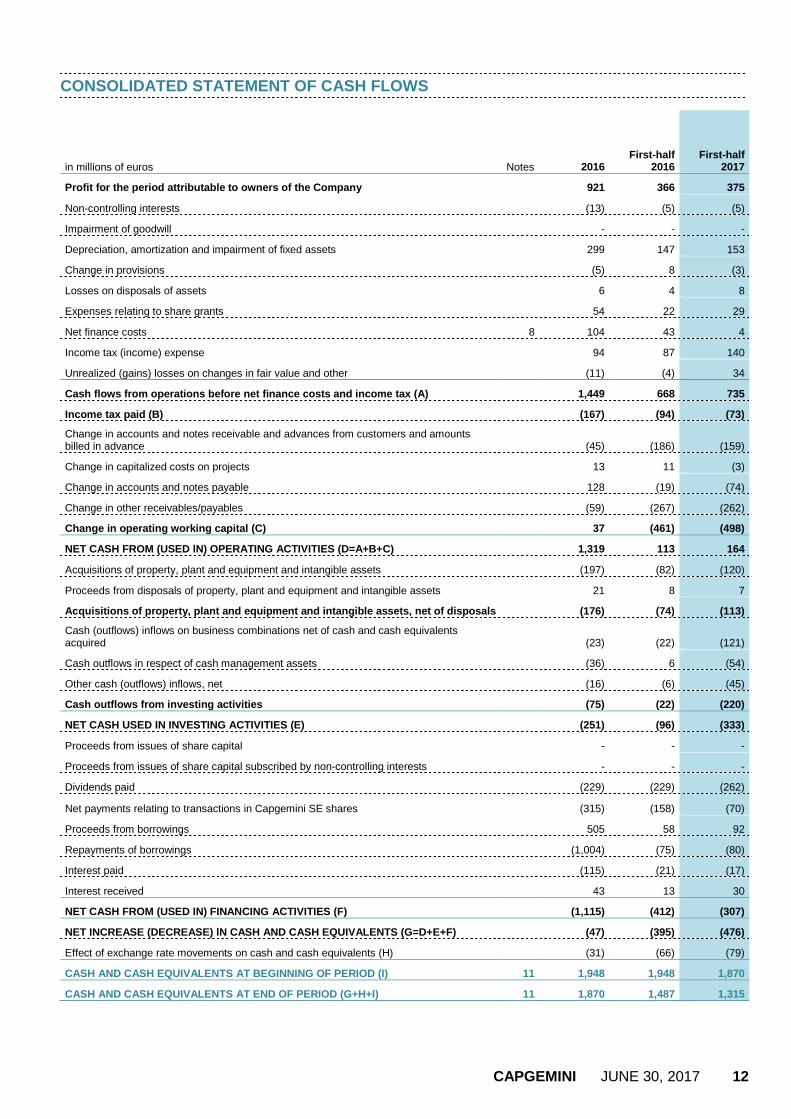
CONSOLIDATED STATEMENT OF CASH FLOWS
in millions of euros Notes 2016 First-half
2016 First-half
2017
Profit for the period attributable to owners of the Company 921 366 375
Non-controlling interests (13) (5) (5)
Impairment of goodwill - - -
Depreciation, amortization and impairment of fixed assets 299 147 153
Change in provisions (5) 8 (3)
Losses on disposals of assets 6 4 8
Expenses relating to share grants 54 22 29
Net finance costs 8 104 43 4
Income tax (income) expense 94 87 140
Unrealized (gains) losses on changes in fair value and other (11) (4) 34
Cash flows from operations before net finance costs and income tax (A) 1,449 668 735
Income tax paid (B) (167) (94) (73)
Change in accounts and notes receivable and advances from customers and amounts billed in advance (45) (186) (159)
Change in capitalized costs on projects 13 11 (3)
Change in accounts and notes payable 128 (19) (74)
Change in other receivables/payables (59) (267) (262)
Change in operating working capital (C) 37 (461) (498)
NET CASH FROM (USED lN) OPERATING ACTIVITIES (D=A+B +C) 1,319 113 164
Acquisitions of property, plant and equipment and intangible assets (197) (82) (120)
Proceeds from disposals of property, plant and equipment and intangible assets 21 8 7
Acquisitions of property, plant and equipment and i ntangible assets, net of disposals (176) (74) (113)
Cash (outflows) inflows on business combinations net of cash and cash equivalents acquired (23) (22) (121)
Cash outflows in respect of cash management assets (36) 6 (54)
Other cash (outflows) inflows, net (16) (6) (45)
Cash outflows from investing activities (75) (22) (220)
NET CASH USED IN INVESTING ACTIVITIES (E) (251) (96) (333)
Proceeds from issues of share capital - - -
Proceeds from issues of share capital subscribed by non-controlling interests - - -
Dividends paid (229) (229) (262)
Net payments relating to transactions in Capgemini SE shares (315) (158) (70)
Proceeds from borrowings 505 58 92
Repayments of borrowings (1,004) (75) (80)
Interest paid (115) (21) (17)
Interest received 43 13 30
NET CASH FROM (USED IN) FINANCING ACTIVITIES (F) (1,115) (412) (307)
NET INCREASE (DECREASE) lN CASH AND CASH EQUIVALENT S (G=D+E+F) (47) (395) (476)
Effect of exchange rate movements on cash and cash equivalents (H) (31) (66) (79)
CASH AND CASH EQUIVALENTS AT BEGINNING OF PERIOD (I ) 11 1,948 1,948 1,870
CASH AND CASH EQUIVALENTS AT END OF PERIOD (G+H+I) 11 1,870 1,487 1,315
CAPGEMINI JUNE 30, 2017 13
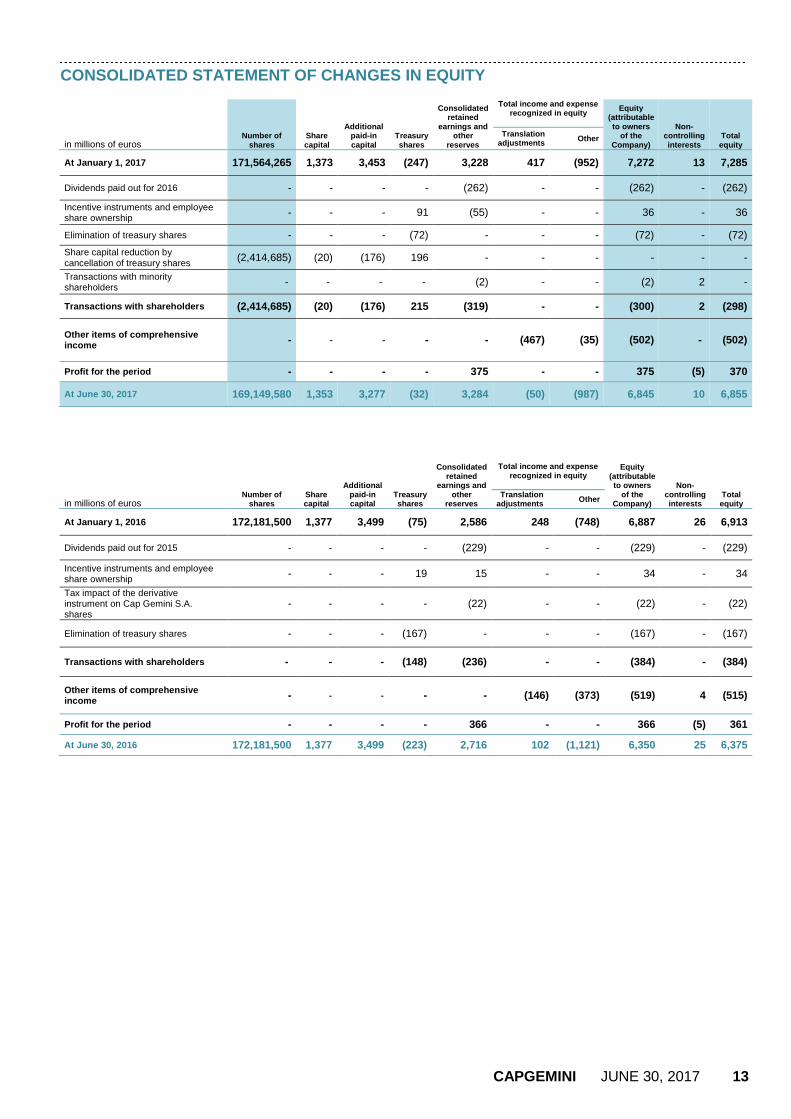
CONSOLIDATED STATEMENT OF CHANGES IN EQUITY
in millions of euros Number of
shares Share capital
Additional paid-in capital
Treasury shares
Consolidated retained
earnings and other
reserves
Total income and expense recognized in equity
Equity (attributable to owners
of the Company)
Non-controlling interests
Total equity
Translation adjustments Other
At January 1, 2017 171,564,265 1,373 3,453 (247) 3,228 417 (952) 7,272 13 7,285
Dividends paid out for 2016 - - - - (262) - - (262) - (262)
Incentive instruments and employee share ownership - - - 91 (55) - - 36 - 36
Elimination of treasury shares - - - (72) - - - (72) - (72)
Share capital reduction by cancellation of treasury shares (2,414,685) (20) (176) 196 - - - - - -
Transactions with minority shareholders - - - - (2) - - (2) 2 -
Transactions with shareholders (2,414,685) (20) (176) 215 (319) - - (300) 2 (298)
Other items of comprehensive income - - - - - (467) (35) (502) - (502)
Profit for the period - - - - 375 - - 375 (5) 370
At June 30, 2017 169,149,580 1,353 3,277 (32) 3,284 (50) (987) 6,845 10 6,855
in millions of euros Number of
shares Share capital
Additional paid-in capital
Treasury shares
Consolidated retained
earnings and other
reserves
Total income and expense recognized in equity
Equity (attributable to owners
of the Company)
Non-controlling interests
Total equity
Translation adjustments Other
At January 1, 2016 172,181,500 1,377 3,499 (75) 2,586 248 (748) 6,887 26 6,913
Dividends paid out for 2015 - - - - (229) - - (229) - (229)
Incentive instruments and employee share ownership - - - 19 15 - - 34 - 34
Tax impact of the derivative instrument on Cap Gemini S.A. shares
- - - - (22) - - (22) - (22)
Elimination of treasury shares - - - (167) - - - (167) - (167)
Transactions with shareholders - - - (148) (236) - - (384) - (384)
Other items of comprehensive income - - - - - (146) (373) (519) 4 (515)
Profit for the period - - - - 366 - - 366 (5) 361
At June 30, 2016 172,181,500 1,377 3,499 (223) 2,716 102 (1,121) 6,350 25 6,375

CAPGEMINI JUNE 30, 2017 14
NOTES TO THE CONDENSED INTERIM CONSOLIDATED FINANCI AL STATEMENTS FOR THE HALF-YEAR ENDED JUNE 30, 2017
NOTE 1 ACCOUNTING BASIS The condensed interim consolidated financial statements for the half-year ended June 30, 2017 and the notes thereto were drawn up under the responsibility of the Board of Directors and adopted by the Board of Directors’ meeting of July 26, 2017. A) IFRS standards base The condensed interim consolidated financial statements for the half-year ended June 30, 2017 have been prepared in accordance with lAS 34, Interim Financial Reporting, as issued by the International Accounting Standards Board (IASB), and endorsed by the European Union. The Group also takes account of the positions adopted by Syntec Numérique – an organization representing major consulting and computer services companies in France - regarding the application of certain IFRS. These condensed interim consolidated financial statements for the half-year ended June 30, 2017 should be read in conjunction with the 2016 consolidated financial statements. B) New standards and interpretations applicable in 2017
a) New standards, amendments and interpretations of mandatory effect at January 1, 2017 The accounting policies applied by the Capgemini Group are unchanged on those applied for the preparation of the December 31, 2016 consolidated financial statements. The standards, amendments, and interpretations which entered into mandatory effect on January 1, 2017 do not have a material effect on the Group financial statements.
b) IFRS 15, Revenue from contracts with customers IFRS 15 on revenue recognition will enter into effect on January 1, 2018. The Group has been working with international sector peers and within Syntec Numérique in France on identifying implementation terms. At the same time the Group launched an analysis of a sample of contracts representative of the different revenue recognition categories from 2016. The Group has since (i) continued its interpretation work, (ii) launched steps to measure the impact of differences identified and (iii) begun the drafting and roll-out of revised accounting rules and procedures. The following main issues were identified:
• “Principal” versus “agent” considerations As part of its operational activities, the Group can be required to resell hardware, software and services purchased from third-party suppliers to its clients. IFRS 15 amends the principles and indicators determining whether the Group should present these transactions in the Income Statement as a “principal”, on a gross basis (with recognition of purchases in operating expenses) or as an “agent”, on a net basis (recognition of revenues equal to amounts invoiced to the client net of amounts invoiced by the supplier). Pursuant to IFRS 15, the Group acts as a “principal” when it obtains control of the hardware, software or services before transferring them to the client. Based on preliminary analyses, the Groups expects more transactions to be presented on a net basis, resulting in a decrease in consolidated revenues estimated to date at around 2%.
• Identification of performance obligations in outsourcing services The new standard clarifies the treatment of revenues and costs of initial activities, performed before the start or at the start of recurring services. Pursuant to the standard, it is necessary to determine whether these activities represent a service benefiting the client or internal start-up activities for a recurring service. In the latter case, revenue can only be recognized as the recurring services are rendered and the initial costs must be capitalized if they create a resource used in the future performance of services. These clarifications should not have a material impact.
• Measuring the progress of fixed-price services Fixed-price systems integration and solution development services will continue to be recognized based on expenditure incurred.
• Measuring the progress of outsourcing services Outsourcing services will generally continue to be recognized as invoicing rights arise, except in specific cases where invoicing terms and conditions do not reflect the value of services rendered.
• Costs of obtaining contracts Going forward, the Group will be required to capitalize commission and bonuses paid to obtain multi-year contracts. This change should not have a material impact.
• Reimbursements received from clients Reimbursements received from clients shall no longer be recognized as a deduction from costs incurred but as revenues unless the Group is acting as an “agent”. This change should not have a material impact. The Group intends to adopt the full retrospective method with restatement of 2017 comparative figures and recognition of the cumulated effect in equity at January 1, 2017.

CAPGEMINI JUNE 30, 2017 15
c) Other new standards not yet in effect at January 1, 2017 and not adopted early
The main standards concerned are:
- IFRS 9, Financial Instruments; - IFRS16, Leases.
The Group is currently analyzing the potential impacts of these standards on the consolidated financial statements.
NOTE 2 CHANGES IN CONSOLIDATION SCOPE The following acquisitions and disposals did not have a material impact on Group financial indicators.
A) Acquisitions Group acquisitions in the first-half of 2017:
- TCube Solutions Inc. in the United States in January 2017, the largest independent IT service provider specializing in Duck Creek Technologies solutions for property and casualty insurance management. This acquisition aims to accelerate the transition of the Group’s business portfolio, particularly in North America.
- Idean Enterprises Oy in February 2017, a digital strategy and experience design consultancy with a strong presence in the United States and Finland. This acquisition will help the Group meet growing customer demand for end-to-end digital services.
- Itelios SAS in France in March 2017, a consulting firm specializing in connected commerce. This acquisition will enable the Group to meet growing customer demand for its end-to-end digital services, and positions it as the leader in Salesforce Commerce Cloud based solutions.
The fair value remeasurement of the assets and liabilities of these companies and the calculation and determination of goodwill pursuant to IFRS 3 is ongoing and will be finalized within 12 months of the acquisition dates.
B) Disposals
Early May 2017, the Group sold its IBX business.
CAPGEMINI JUNE 30, 2017 16
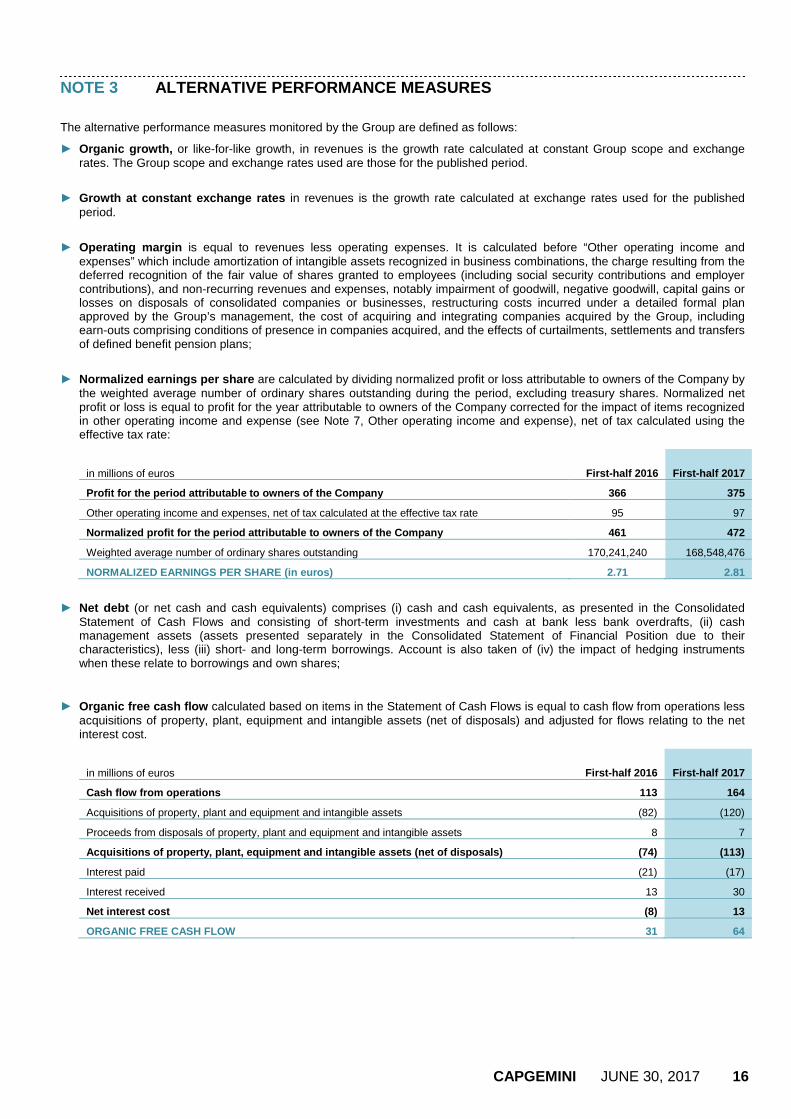
NOTE 3 ALTERNATIVE PERFORMANCE MEASURES
The alternative performance measures monitored by the Group are defined as follows:
► Organic growth, or like-for-like growth, in revenues is the growth rate calculated at constant Group scope and exchange rates. The Group scope and exchange rates used are those for the published period.
► Growth at constant exchange rates in revenues is the growth rate calculated at exchange rates used for the published period.
► Operating margin is equal to revenues less operating expenses. It is calculated before “Other operating income and expenses” which include amortization of intangible assets recognized in business combinations, the charge resulting from the deferred recognition of the fair value of shares granted to employees (including social security contributions and employer contributions), and non-recurring revenues and expenses, notably impairment of goodwill, negative goodwill, capital gains or losses on disposals of consolidated companies or businesses, restructuring costs incurred under a detailed formal plan approved by the Group’s management, the cost of acquiring and integrating companies acquired by the Group, including earn-outs comprising conditions of presence in companies acquired, and the effects of curtailments, settlements and transfers of defined benefit pension plans;
► Normalized earnings per share are calculated by dividing normalized profit or loss attributable to owners of the Company by
the weighted average number of ordinary shares outstanding during the period, excluding treasury shares. Normalized net profit or loss is equal to profit for the year attributable to owners of the Company corrected for the impact of items recognized in other operating income and expense (see Note 7, Other operating income and expense), net of tax calculated using the effective tax rate:
in millions of euros First-half 2016 First-half 2017
Profit for the period attributable to owners of the Company 366 375
Other operating income and expenses, net of tax calculated at the effective tax rate 95 97
Normalized profit for the period attributable to ow ners of the Company 461 472
Weighted average number of ordinary shares outstanding 170,241,240 168,548,476
NORMALIZED EARNINGS PER SHARE (in euros) 2.71 2.81
► Net debt (or net cash and cash equivalents) comprises (i) cash and cash equivalents, as presented in the Consolidated Statement of Cash Flows and consisting of short-term investments and cash at bank less bank overdrafts, (ii) cash management assets (assets presented separately in the Consolidated Statement of Financial Position due to their characteristics), less (iii) short- and long-term borrowings. Account is also taken of (iv) the impact of hedging instruments when these relate to borrowings and own shares;
► Organic free cash flow calculated based on items in the Statement of Cash Flows is equal to cash flow from operations less acquisitions of property, plant, equipment and intangible assets (net of disposals) and adjusted for flows relating to the net interest cost.
in millions of euros First-half 2016 First-half 2017
Cash flow from operations 113 164
Acquisitions of property, plant and equipment and intangible assets (82) (120)
Proceeds from disposals of property, plant and equipment and intangible assets 8 7
Acquisitions of property, plant, equipment and inta ngible assets (net of disposals) (74) (113)
Interest paid (21) (17)
Interest received 13 30
Net interest cost (8) 13
ORGANIC FREE CASH FLOW 31 64
CAPGEMINI JUNE 30, 2017 17
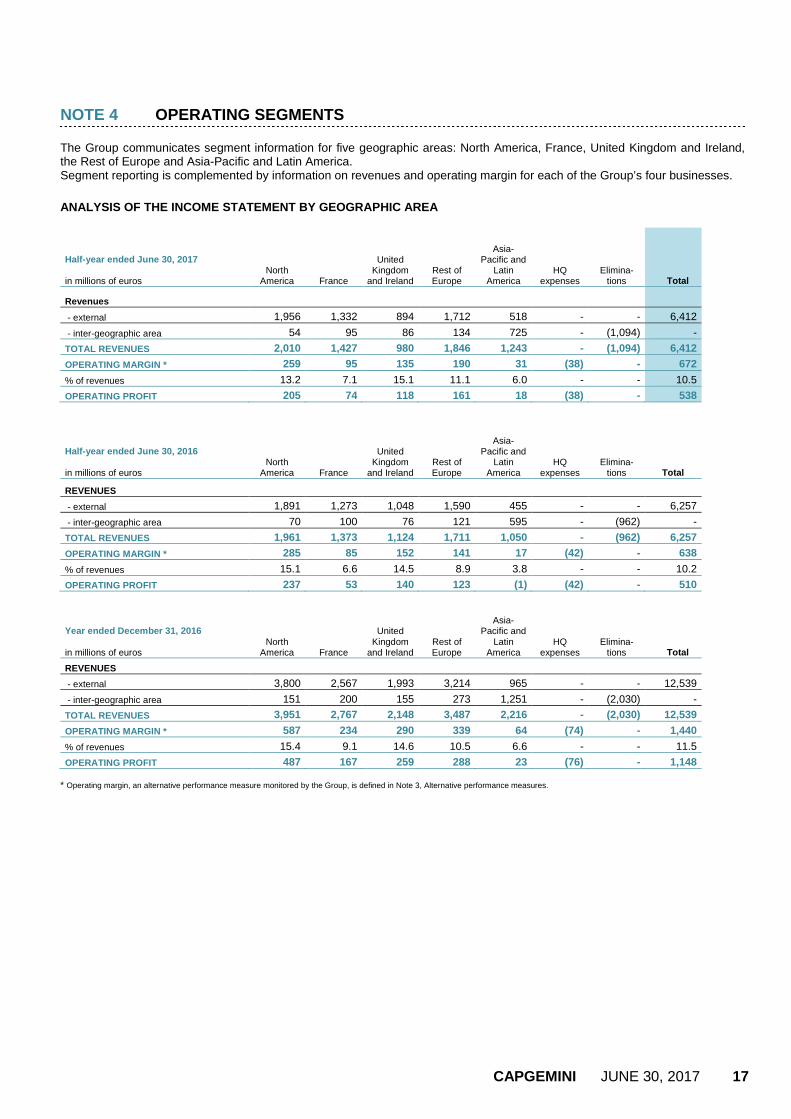
NOTE 4 OPERATING SEGMENTS The Group communicates segment information for five geographic areas: North America, France, United Kingdom and Ireland, the Rest of Europe and Asia-Pacific and Latin America. Segment reporting is complemented by information on revenues and operating margin for each of the Group’s four businesses. ANALYSIS OF THE INCOME STATEMENT BY GEOGRAPHIC AREA
Half-year ended June 30, 2017 in millions of euros
North America France
United Kingdom
and Ireland Rest of Europe
Asia-Pacific and
Latin America
HQ expenses
Elimina- tions Total
Revenues
- external 1,956 1,332 894 1,712 518 - - 6,412
- inter-geographic area 54 95 86 134 725 - (1,094) -
TOTAL REVENUES 2,010 1,427 980 1,846 1,243 - (1,094) 6,412
OPERATING MARGIN * 259 95 135 190 31 (38) - 672
% of revenues 13.2 7.1 15.1 11.1 6.0 - - 10.5
OPERATING PROFIT 205 74 118 161 18 (38) - 538
Half-year ended June 30, 2016 in millions of euros
North America France
United Kingdom
and Ireland Rest of Europe
Asia-Pacific and
Latin America
HQ expenses
Elimina- tions Total
REVENUES
- external 1,891 1,273 1,048 1,590 455 - - 6,257
- inter-geographic area 70 100 76 121 595 - (962) -
TOTAL REVENUES 1,961 1,373 1,124 1,711 1,050 - (962) 6,257
OPERATING MARGIN * 285 85 152 141 17 (42) - 638
% of revenues 15.1 6.6 14.5 8.9 3.8 - - 10.2
OPERATING PROFIT 237 53 140 123 (1) (42) - 510
Year ended December 31, 2016 in millions of euros
North America France
United Kingdom
and Ireland Rest of Europe
Asia-Pacific and
Latin America
HQ expenses
Elimina- tions Total
REVENUES
- external 3,800 2,567 1,993 3,214 965 - - 12,539
- inter-geographic area 151 200 155 273 1,251 - (2,030) -
TOTAL REVENUES 3,951 2,767 2,148 3,487 2,216 - (2,030) 12,539
OPERATING MARGIN * 587 234 290 339 64 (74) - 1,440
% of revenues 15.4 9.1 14.6 10.5 6.6 - - 11.5
OPERATING PROFIT 487 167 259 288 23 (76) - 1,148 * Operating margin, an alternative performance measure monitored by the Group, is defined in Note 3, Alternative performance measures.
CAPGEMINI JUNE 30, 2017 18
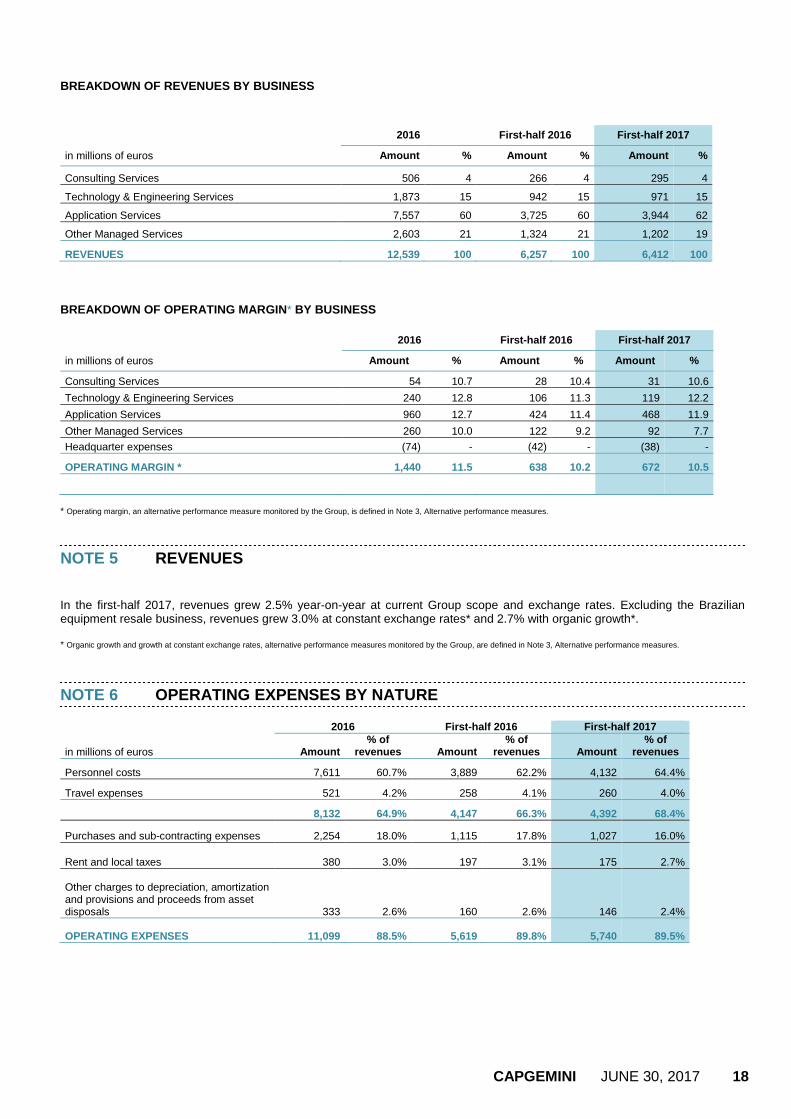
BREAKDOWN OF REVENUES BY BUSINESS
2016 First-half 2016 First-half 2017
in millions of euros Amount % Amount % Amount %
Consulting Services 506 4 266 4 295 4
Technology & Engineering Services 1,873 15 942 15 971 15
Application Services 7,557 60 3,725 60 3,944 62
Other Managed Services 2,603 21 1,324 21 1,202 19
REVENUES 12,539 100 6,257 100 6,412 100 BREAKDOWN OF OPERATING MARGIN * BY BUSINESS
2016 First-half 2016 First-half 2017
in millions of euros Amount % Amount % Amount %
Consulting Services 54 10.7 28 10.4 31 10.6
Technology & Engineering Services 240 12.8 106 11.3 119 12.2
Application Services 960 12.7 424 11.4 468 11.9
Other Managed Services 260 10.0 122 9.2 92 7.7
Headquarter expenses (74) - (42) - (38) -
OPERATING MARGIN * 1,440 11.5 638 10.2 672 10.5
* Operating margin, an alternative performance measure monitored by the Group, is defined in Note 3, Alternative performance measures.
NOTE 5 REVENUES In the first-half 2017, revenues grew 2.5% year-on-year at current Group scope and exchange rates. Excluding the Brazilian equipment resale business, revenues grew 3.0% at constant exchange rates* and 2.7% with organic growth*. * Organic growth and growth at constant exchange rates, alternative performance measures monitored by the Group, are defined in Note 3, Alternative performance measures.
NOTE 6 OPERATING EXPENSES BY NATURE
2016 First -half 2016 First -half 2017
in millions of euros Amount % of
revenues Amount % of
revenues Amount % of
revenues
Personnel costs 7,611 60.7% 3,889 62.2% 4,132 64.4%
Travel expenses 521 4.2% 258 4.1% 260 4.0%
8,132 64.9% 4,147 66.3% 4,392 68.4%
Purchases and sub-contracting expenses 2,254 18.0% 1,115 17.8% 1,027 16.0%
Rent and local taxes 380 3.0% 197 3.1% 175 2.7%
Other charges to depreciation, amortization and provisions and proceeds from asset disposals 333 2.6% 160 2.6% 146 2.4%
OPERATING EXPENSES 11,099 88.5% 5,619 89.8% 5,740 89.5%
CAPGEMINI JUNE 30, 2017 19
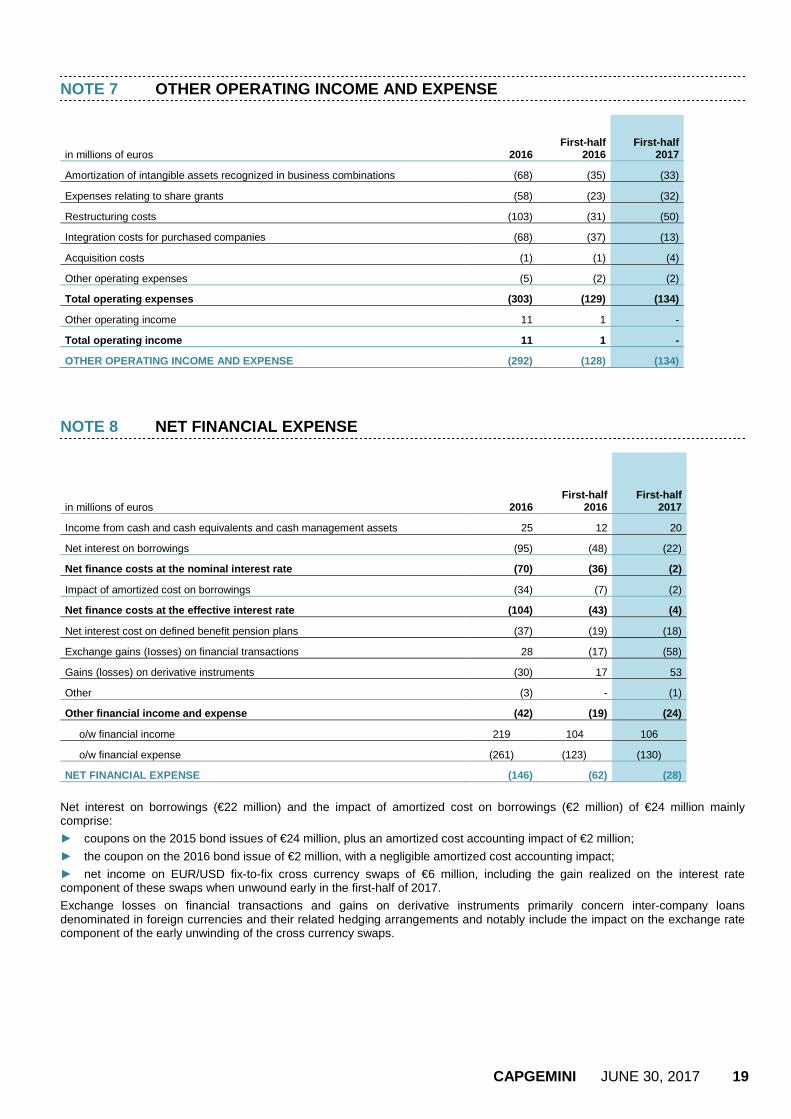
NOTE 7 OTHER OPERATING INCOME AND EXPENSE
in millions of euros 2016 First-half
2016 First-half
2017
Amortization of intangible assets recognized in business combinations (68) (35) (33)
Expenses relating to share grants (58) (23) (32)
Restructuring costs (103) (31) (50)
Integration costs for purchased companies (68) (37) (13)
Acquisition costs (1) (1) (4)
Other operating expenses (5) (2) (2)
Total operating expenses (303) (129) (134)
Other operating income 11 1 -
Total operating income 11 1 -
OTHER OPERATING INCOME AND EXPENSE (292) (128) (134) NOTE 8 NET FINANCIAL EXPENSE
in millions of euros 2016 First-half
2016 First-half
2017
Income from cash and cash equivalents and cash management assets 25 12 20
Net interest on borrowings (95) (48) (22)
Net finance costs at the nominal interest rate (70) (36) (2)
Impact of amortized cost on borrowings (34) (7) (2)
Net finance costs at the effective interest rate (104) (43) (4)
Net interest cost on defined benefit pension plans (37) (19) (18)
Exchange gains (Iosses) on financial transactions 28 (17) (58)
Gains (losses) on derivative instruments (30) 17 53
Other (3) - (1)
Other financial income and expense (42) (19) (24)
o/w financial income 219 104 106
o/w financial expense (261) (123) (130)
NET FINANCIAL EXPENSE (146) (62) (28)
Net interest on borrowings (€22 million) and the impact of amortized cost on borrowings (€2 million) of €24 million mainly comprise:
► coupons on the 2015 bond issues of €24 million, plus an amortized cost accounting impact of €2 million;
► the coupon on the 2016 bond issue of €2 million, with a negligible amortized cost accounting impact;
► net income on EUR/USD fix-to-fix cross currency swaps of €6 million, including the gain realized on the interest rate component of these swaps when unwound early in the first-half of 2017.
Exchange losses on financial transactions and gains on derivative instruments primarily concern inter-company loans denominated in foreign currencies and their related hedging arrangements and notably include the impact on the exchange rate component of the early unwinding of the cross currency swaps.

CAPGEMINI JUNE 30, 2017 20
NOTE 9 GOODWILL
The €237 million decrease in goodwill over the period is attributable to negative translation adjustments of €384 million recognized on goodwill primarily denominated in U.S. dollars and pound sterling, offset by goodwill recognized on 2017 first-half acquisitions of €147 million (see Note 2, Changes in consolidation scope). In addition, the loss reported by the Group’s Brazilian activities in the first half of 2017 fell substantially short of objectives and was considered an indication of loss in value. The Latin America cash-generating unit, which represents net goodwill of €111 million, was therefore tested again for impairment at June 30, 2017. No additional impairment was recognized in the Group consolidated financial statements as a result of this test.
NOTE 10 ACCOUNTS AND NOTES RECEIVABLE
in millions of euros June 30,
2016 December
31, 2016 June 30,
2017
Accounts receivable 1,757 1,996 1,670
Provisions for doubtful accounts (18) (27) (23)
Accrued income 1,274 1,012 1,422
Accounts and notes receivable, excluding capitalize d costs on projects 3,013 2,981 3,069
Capitalized costs on projects 94 93 93
ACCOUNTS AND NOTES RECEIVABLE 3,107 3,074 3,162 Total accounts receivable and accrued income, net of advances from customers and billed in advance, can be analyzed as follows in number of days’ annual revenue:
in millions of euros June 30,
2016 December
31, 2016 June 30,
2017
Accounts and notes receivable, excluding capitalized costs on projects 3,013 2,981 3,069
Advances from customers and billed in advance (639) (737) (728)
TOTAL ACCOUNTS RECEIVABLE NET OF ADVANCES FROM CUST OMERS AND BILLED IN ADVANCE 2,374 2,244 2,341
ln number of days’ annual revenue 68 64 66 Receivables totaling €82 million were assigned to financial institutions with transfer of risk as defined by IAS 39 in the first-half of 2017 (compared with €47 million at June 30, 2016) and were therefore derecognized in the Statement of Financial Position at June 30, 2017.
CAPGEMINI JUNE 30, 2017 21
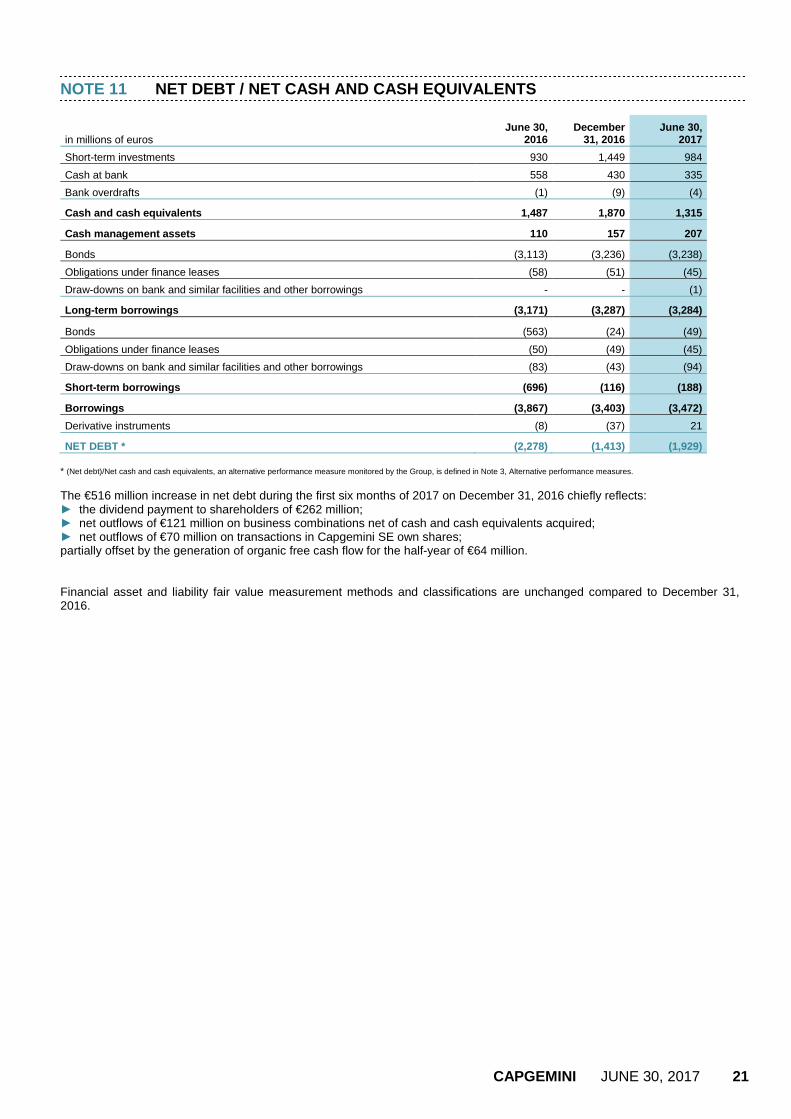
NOTE 11 NET DEBT / NET CASH AND CASH EQUIVALENTS
in millions of euros June 30,
2016 December
31, 2016 June 30,
2017
Short-term investments 930 1,449 984
Cash at bank 558 430 335
Bank overdrafts (1) (9) (4)
Cash and cash equivalents 1,487 1,870 1,315
Cash management assets 110 157 207
Bonds (3,113) (3,236) (3,238)
Obligations under finance leases (58) (51) (45)
Draw-downs on bank and similar facilities and other borrowings - - (1)
Long-term borrowings (3,171) (3,287) (3,284)
Bonds (563) (24) (49)
Obligations under finance leases (50) (49) (45)
Draw-downs on bank and similar facilities and other borrowings (83) (43) (94)
Short-term borrowings (696) (116) (188)
Borrowings (3,867) (3,403) (3,472)
Derivative instruments (8) (37) 21
NET DEBT * (2,278) (1,413) (1,929) * (Net debt)/Net cash and cash equivalents, an alternative performance measure monitored by the Group, is defined in Note 3, Alternative performance measures. The €516 million increase in net debt during the first six months of 2017 on December 31, 2016 chiefly reflects: ► the dividend payment to shareholders of €262 million; ► net outflows of €121 million on business combinations net of cash and cash equivalents acquired; ► net outflows of €70 million on transactions in Capgemini SE own shares; partially offset by the generation of organic free cash flow for the half-year of €64 million. Financial asset and liability fair value measurement methods and classifications are unchanged compared to December 31, 2016.
CAPGEMINI JUNE 30, 2017 22
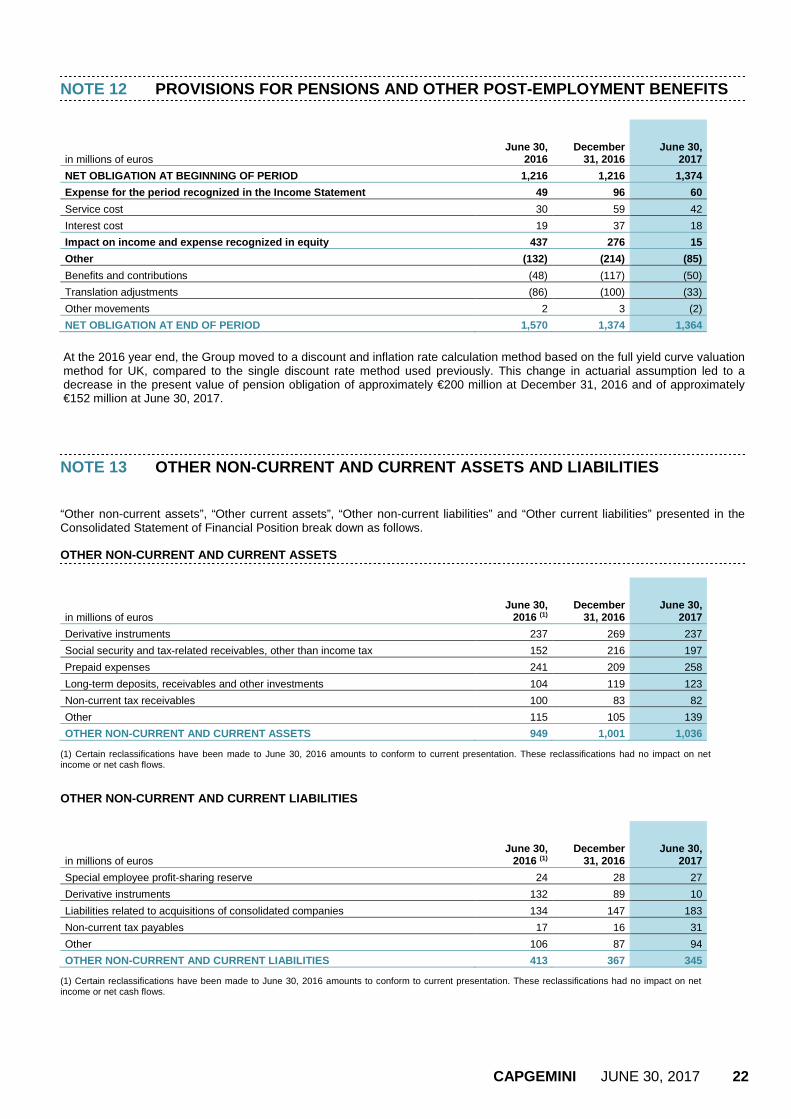
NOTE 12 PROVISIONS FOR PENSIONS AND OTHER POST-EMPLOYMENT B ENEFITS
in millions of euros June 30,
2016 December
31, 2016 June 30,
2017
NET OBLIGATION AT BEGINNING OF PERIOD 1,216 1,216 1,374
Expense for the period recognized in the Income Sta tement 49 96 60
Service cost 30 59 42
Interest cost 19 37 18
Impact on income and expense recognized in equity 437 276 15
Other (132) (214) (85)
Benefits and contributions (48) (117) (50)
Translation adjustments (86) (100) (33)
Other movements 2 3 (2)
NET OBLIGATION AT END OF PERIOD 1,570 1,374 1,364
At the 2016 year end, the Group moved to a discount and inflation rate calculation method based on the full yield curve valuation method for UK, compared to the single discount rate method used previously. This change in actuarial assumption led to a decrease in the present value of pension obligation of approximately €200 million at December 31, 2016 and of approximately €152 million at June 30, 2017.
NOTE 13 OTHER NON-CURRENT AND CURRENT ASSETS AND LIABILITIE S “Other non-current assets”, “Other current assets”, “Other non-current liabilities” and “Other current liabilities” presented in the Consolidated Statement of Financial Position break down as follows. OTHER NON-CURRENT AND CURRENT ASSETS
in millions of euros June 30,
2016 (1) December
31, 2016 June 30,
2017
Derivative instruments 237 269 237
Social security and tax-related receivables, other than income tax 152 216 197
Prepaid expenses 241 209 258
Long-term deposits, receivables and other investments 104 119 123
Non-current tax receivables 100 83 82
Other 115 105 139
OTHER NON-CURRENT AND CURRENT ASSETS 949 1,001 1,036
(1) Certain reclassifications have been made to June 30, 2016 amounts to conform to current presentation. These reclassifications had no impact on net income or net cash flows.
OTHER NON-CURRENT AND CURRENT LIABILITIES
in millions of euros June 30,
2016 (1) December
31, 2016 June 30,
2017
Special employee profit-sharing reserve 24 28 27
Derivative instruments 132 89 10
Liabilities related to acquisitions of consolidated companies 134 147 183
Non-current tax payables 17 16 31
Other 106 87 94
OTHER NON-CURRENT AND CURRENT LIABILITIES 413 367 345
(1) Certain reclassifications have been made to June 30, 2016 amounts to conform to current presentation. These reclassifications had no impact on net income or net cash flows.
CAPGEMINI JUNE 30, 2017 23
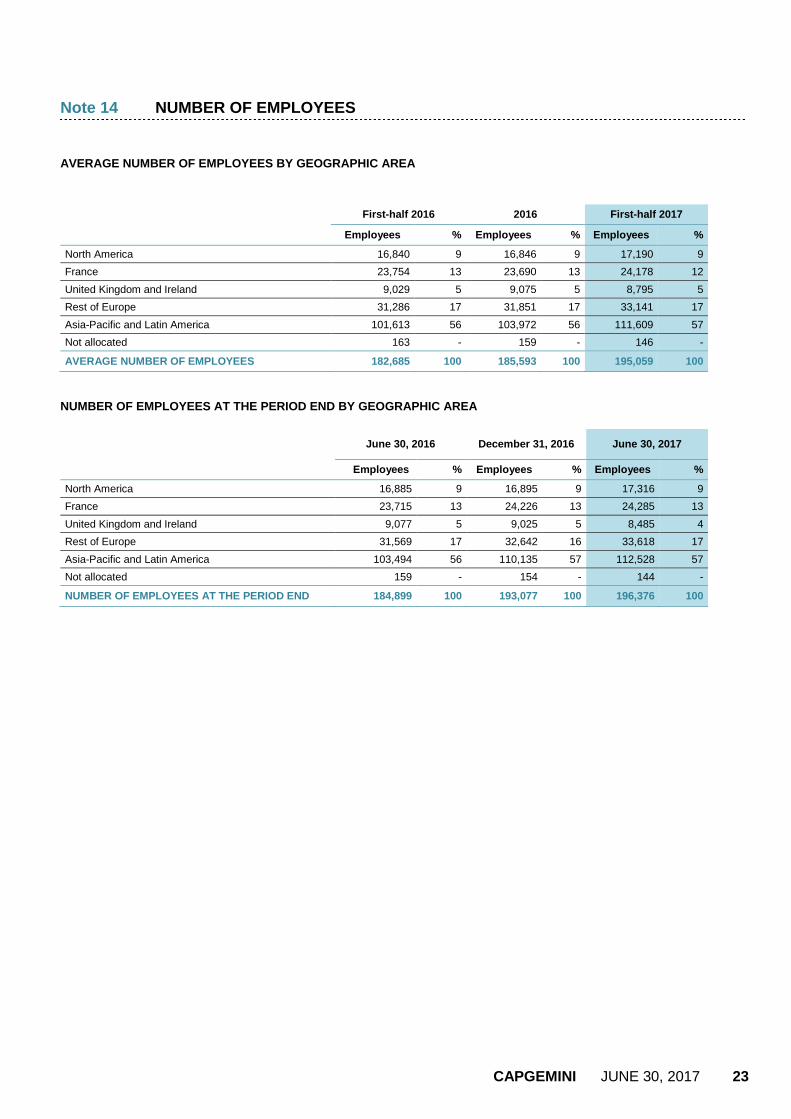
Note 14 NUMBER OF EMPLOYEES AVERAGE NUMBER OF EMPLOYEES BY GEOGRAPHIC AREA
First-half 2016 2016 First-half 2017
Employees % Employees % Employees %
North America 16,840 9 16,846 9 17,190 9
France 23,754 13 23,690 13 24,178 12
United Kingdom and Ireland 9,029 5 9,075 5 8,795 5
Rest of Europe 31,286 17 31,851 17 33,141 17
Asia-Pacific and Latin America 101,613 56 103,972 56 111,609 57
Not allocated 163 - 159 - 146 -
AVERAGE NUMBER OF EMPLOYEES 182,685 100 185,593 100 195,059 100
NUMBER OF EMPLOYEES AT THE PERIOD END BY GEOGRAPHIC AREA
June 30, 2016 December 31, 2016 June 30, 2017
Employees % Employees % Employees %
North America 16,885 9 16,895 9 17,316 9
France 23,715 13 24,226 13 24,285 13
United Kingdom and Ireland 9,077 5 9,025 5 8,485 4
Rest of Europe 31,569 17 32,642 16 33,618 17
Asia-Pacific and Latin America 103,494 56 110,135 57 112,528 57
Not allocated 159 - 154 - 144 -
NUMBER OF EMPLOYEES AT THE PERIOD END 184,899 100 193,077 100 196,376 100

CAPGEMINI JUNE 30, 2017 24
Note 15 OFF-BALANCE SHEET COMMITMENTS COMMITMENTS GIVEN
in millions of euros June 30, 2016 December 31,
2016 June 30,
2017
On client contracts 1,766 1,798 1,800
On non-cancellable leases 795 775 766
Other commitments given 38 37 24
COMMITMENTS GIVEN 2,599 2,610 2,590 COMMITMENTS RECEIVED
In millions of euros June 30, 2016 December 31,
2016 June 30,
2017
On client contracts 107 113 110
Other commitments received 17 17 1
COMMITMENTS RECEIVED 124 130 111
CONTINGENT LIABILITIES During the first-half of 2017 and in previous fiscal years, certain Group companies underwent tax audits leading in some cases to tax reassessments. A number of proposed adjustments have been challenged and litigation and pre-litigation proceedings were in progress at June 30, 2017. In general, no provisions have been set aside for these disputes in the consolidated financial statements in so far as Capgemini can justify its positions and considers the likelihood of winning the disputes to be high. This is particularly the case, in France, for research tax credits for the period 2008 to 2013, in respect of which the tax authorities have rejected the portion concerning private clients in certain companies registered for research tax credit. NOTE 16 SUBSEQUENT EVENTS There were no material events after the balance sheet date.
CAPGEMINI JUNE 30, 2017 25
DECLARATION BY THE PERSON RESPONSIBLE FOR THE INTERIM FINANCIAL REPORT "I hereby declare that, to the best of my knowledge, the condensed interim consolidated financial statements for the half-year ended June 30, 2017 have been prepared in accordance with applicable accounting standards and give a true and fair view of the assets, liabilities, financial position and results of the Company and all the other companies included in the scope of consolidation and that the interim financial review gives a fair description of the material events that occurred in the first six months of the fiscal year and their impact on the financial statements, the main related party transactions, as well as a description of the main risks and uncertainties for the remaining six months of the year". Paul Hermelin Chairman and Chief Executive Officer