Interim Financial Report at September 30, 2011 - Enel...The accounting policies adopted and...
98
Interim Financial Report at September 30, 2011
Transcript of Interim Financial Report at September 30, 2011 - Enel...The accounting policies adopted and...
Interim Financial Report at September 30, 2011

Enel – Interim Financial Report at September 30, 2011 2

Contents
The Enel structure ........................................................................................ 4
Foreword .................................................................................................... 6
Summary of results .................................................................................... 11
Results by Division ..................................................................................... 14
> Sales ..................................................................................................... 17
> Generation and Energy Management .......................................................... 20
> Engineering and Innovation ...................................................................... 24
> Infrastructure and Networks ..................................................................... 26
> Iberia and Latin America .......................................................................... 29
> International .......................................................................................... 34
> Renewable Energy ................................................................................... 39
> Parent Company, Services and Other Activities ............................................ 43
Significant events in the 3rd Quarter of 2011 ................................................. 46
Reference scenario ..................................................................................... 48
> Developments in the main market indicators ............................................... 48
> Italy ...................................................................................................... 48
> Spain .................................................................................................... 50
Regulatory and rate issues ........................................................................... 51
Outlook ..................................................................................................... 72
Consolidated financial statements
Condensed Consolidated Income Statement ................................................... 74
Statement of Comprehensive Income ............................................................ 75
Condensed Consolidated Balance Sheet ......................................................... 76
Statement of Changes in Consolidated Shareholders’ Equity ............................. 77
Condensed Consolidated Statement of Cash Flows .......................................... 78
Operating performance and financial position ................................................. 79
Other information ....................................................................................... 91
Subsequent events ..................................................................................... 96
Declaration of the officer responsible for the preparation of the company’s financial
reports pursuant to the provisions of Article 154-bis, paragraph 2, of Legislative
Decree 58/1998 ......................................................................................... 97
The Enel structure
In its capacity as an industrial holding company, Enel SpA defines the strategic objectives of
the Group and coordinates the activities of subsidiaries. In addition, Enel SpA manages
central treasury operations and insurance risk coverage, providing assistance and guidelines
on organization, personnel management and labor relations, accounting, administrative,
fiscal, legal, and corporate matters. Enel also currently holds a contract with Alpiq (formerly
Atel) for the import of electricity on the Swiss border.
The Sales Division is responsible for commercial activities, with the objective of developing
an integrated package of electricity and gas products and services for end users. The
activities are carried out by:
> Enel Servizio Elettrico and Vallenergie (the operations of the latter are limited to the
Valle d’Aosta region) for the sale of electricity on the enhanced protection market;
> Enel Energia for the sale of electricity on the free and safeguard markets and the sale of
natural gas to end users.
The Generation and Energy Management Division operates in the field of electricity
generation and energy products. The main activities of the Division are as follows:
> the generation and sale of electricity:
- generation with thermal and schedulable hydroelectric power plants in Italy through
Enel Produzione, Hydro Dolomiti Enel (in the province of Trento) and SE Hydro Power
(in the province of Bolzano);
- trading on international and domestic markets, primarily through Enel Trade, Enel
Trade Hungary and Enel Trade Romania;
> the supply and sale of energy products through Enel Trade:
- provisioning for all of the Group’s needs;
- the sale of natural gas to distributors;
> the development of natural gas extraction projects (through Enel Longanesi Development)
and natural gas regasification and storage plants (through Nuove Energie and Enel
Stoccaggi).
The mission of the Engineering and Innovation Division is to serve the Group by
managing the engineering processes related to the development and construction of power
plants, ensuring achievement of the quality, temporal and financial objectives set for it. The
Division also coordinates and supplements the Group’s research activities, ensuring the
scouting, development and leveraging of innovation opportunities in all Group business
areas, with a special focus on the development of major environmental initiatives.
The Infrastructure and Networks Division is responsible for operating the electricity
distribution networks.
The activities are essentially carried out by:
> Enel Distribuzione and Deval (the latter’s operations are limited to the Valle d’Aosta
region) for the distribution of electricity;
> Enel Sole for public and artistic lighting.
Enel – Interim Financial Report at September 30, 2011 4
Enel – Interim Financial Report at September 30, 2011 5
The Iberia and Latin America Division focuses on developing Enel’s presence and
coordinating its operations in the electricity and gas markets of Spain, Portugal and Latin
America, formulating growth strategies in the related regional markets.
Following the integration of Enel’s operations in the renewable energy sector in Spain and
Portugal, the activities of Endesa Cogeneración y Renovables (ECyR, now Enel Green Power
España) and its subsidiaries were transferred from the Iberia and Latin America Division to
the Renewable Energy Division as from April 1, 2010.
The mission of the International Division is to support the Group’s strategies for
international growth, as well as to manage and integrate the foreign businesses outside the
Iberian and Latin American markets, which are managed by the Iberia and Latin America
Division, monitoring and developing business opportunities that should present themselves
on the electricity and fuel markets.
The chief geographical areas of operation for this Division are:
> Central Europe, where the Division is active in electricity sales in France (Enel France),
power generation in Slovakia (Slovenské elektrárne), and the development of thermal
power plants and support activities in Belgium (Marcinelle Energie and Enel Operations
Belgium);
> south-eastern Europe, with the development of generation capacity in Romania (Enel
Productie), electricity distribution, sales and support activities in Romania (Enel Distributie
Banat, Enel Distributie Dobrogea, Enel Energie, Enel Distributie Muntenia, Enel Energie
Muntenia, Enel Romania, and Enel Servicii Comune) and the development of thermal
plants in Greece (Enelco);
> Russia, with electricity sales and trading (RusEnergoSbyt), power generation and sales
(Enel OGK-5), and support services (Enel Rus).
The Renewable Energy Division has the mission of developing and managing operations
for the generation of electricity from renewable resources, ensuring their integration within
the Group in line with the Enel Group’s strategies. The geographical areas of operation for
this Division are:
> Italy and the rest of Europe, with power generation from non-schedulable hydroelectric
plants, as well as geothermal, wind and solar plants in Italy (Enel Green Power), Greece
(Enel Green Power Hellas), France (Enel Green Power France), Romania (Enel Green
Power Romania) and Bulgaria (Enel Green Power Bulgaria), and plant and franchising
activities in Italy (Enel.si);
> Iberia and Latin America, with power generation from renewable sources in Spain and
Portugal (Enel Green Power España and Enel Unión Fenosa Renovables) and Latin America
(Enel Green Power Latin America);
> North America, with power generation from renewable sources (Enel Green Power North
America).
The primary purpose of the Services and Other Activities area is to provide competitive
services to the companies of the Group, such as real estate and facility management
services, IT services, personnel training and administration, general administrative services,
and factoring and insurance services.
Enel – Interim Financial Report at September 30, 2011 6
Foreword
The Interim Financial Report at September 30, 2011 has been prepared in compliance with
Article 154-ter, paragraph 5, of Legislative Decree 58 of February 24, 1998, and in
conformity with the recognition and measurement criteria set out in the international
accounting standards (International Accounting Standards - IAS and International Financial
Reporting Standards - IFRS) issued by the International Accounting Standards Board (IASB),
as well as the interpretations of the International Financial Reporting Interpretations
Committee (IFRIC) and the Standing Interpretations Committee (SIC), recognized in the
European Union pursuant to Regulation (EC) no. 1606/2002 and in effect as of the close of
the period.
Accounting policies and measurement criteria The accounting policies adopted and measurement criteria used for the Interim Financial
Report at September 30, 2011, which has not been audited, are consistent with those used
to prepare the consolidated financial statements at December 31, 2010, to which the reader
is referred for more information. In addition, the following international accounting standards
and interpretations that took effect as from January 1, 2011, are material to the Group and
were used in preparing this Report:
> “Revised IAS 24 – Related party disclosures”: the standard allows companies that are
subsidiaries or under the significant influence of a government agency to adopt special
related-party disclosure rules allowing summary disclosure of transactions with the
government agency and with other companies controlled or under the significant influence
of the government agency. The new version of IAS 24 also amends the definition of
related parties for the purposes of disclosure in the notes to the financial statements.
The retrospective application of IAS 24 did not have an impact in this Report.
> “Amendments to IFRIC 14 – Prepayments of a minimum funding requirement”: the
changes clarify the accounting treatment under the so-called asset ceiling rules, in cases
of prepayment of a minimum funding requirement (MFR). More specifically, the amended
interpretation sets out new rules for measuring the economic benefits of reducing future
MFR contributions.
The retrospective application of the amendments did not have a significant impact in this
Report.
> “IFRIC 19 – Extinguishing financial liabilities with equity instruments”: the interpretation
clarifies the accounting treatment that a debtor must apply in the case of liability being
extinguished through the issue of equity instruments to the creditor. In particular, the
equity instruments issued represent the consideration for extinguishing the liability and
must be measured at fair value as of the date of extinguishment. Any difference between
the carrying amount of the extinguished liabilities and the initial value of the equity
instruments shall be recognized through profit or loss.
The retrospective application of IFRIC 19 did not have an impact in this Report.
> “Amendments to IAS 32 – Financial instruments – Presentation”: the amendment
specifies that rights, options or warrants that entitle the holder to purchase a specific
number of equity instruments of the entity issuing such rights for a specified amount of
Enel – Interim Financial Report at September 30, 2011 7
any currency shall be classified as equity instruments if (and only if) they are offered pro
rata to all existing holders of the same class of equity instruments (other than
derivatives).
The retrospective application of the amendments did not have an impact in this Report.
> “Improvements to International Financial Reporting Standards”: the changes regard
improvements to existing standards. The main developments regard:
− “IFRS 3 – Business combinations”, as revised in 2008: specifies that non-controlling
interests in an acquiree that are present ownership interests entitle their holders, in the
event of the liquidation of the company, to a proportionate share of the entity’s net
assets. They must be measured at fair value or as a proportionate share of the
acquiree’s net identifiable assets. All other components classifiable as non-controlling
interests but which do not have the above characteristics (for example, share options,
preference shares, etc.) must be measured at fair value at the acquisition date unless
other measurement criteria are provided for under international accounting standards.
The prospective application of IFRS 3 as from the date of first-time adoption of IFRS 3
by the Group (2010 financial year) did not have an impact in this Report.
− “IAS 1 – Presentation of financial statements”: specifies that the reconciliation of the
carrying amount at the start and end of the period for each element of “other
comprehensive income” (OCI) shall be presented either in the statement of changes in
equity or in the notes to the financial statements.
The application of the amendment did not have an impact in this Report.
− “IAS 34 – Interim financial reporting”: the standard has been amended to add disclosure
requirements for interim financial reports concerning, in particular, financial assets and
liabilities. For example, it now requires information on changes in the business or in
economic conditions that have had an impact on the fair value of financial
assets/liabilities measured at fair value or using the amortized cost method.
The application of the amendment did not have a significant impact in this Report.
Enel – Interim Financial Report at September 30, 2011 8
Definition of performance indicators In order to facilitate the assessment of the Group’s performance and financial position, this
Interim Financial Report at September 30, 2011 uses a number of “alternative performance
indicators” not envisaged in the IFRS-EU accounting standards. In accordance with
recommendation CESR/05-178b published on November 3, 2005, the criteria used to
calculate these indicators are described below.
Gross operating margin: an operating performance indicator, calculated as “Operating
income” plus “Depreciation, amortization and impairment losses”.
Net non-current assets: calculated as the difference between “Non-current assets” and “Non-
current liabilities” with the exception of:
> “Deferred tax assets”;
> “Other securities designated at fair value through profit or loss” and other items reported
under “Other financial receivables”;
> “Long-term loans”;
> “Post-employment and other employee benefits”;
> “Provisions for risks and charges”;
> “Deferred tax liabilities”.
Net current assets: calculated as the difference between “Current assets” and “Current
liabilities” with the exception of:
> “Receivables for factoring advances”, “Long-term financial receivables (short-term
portion)”, “Other securities” and other items, reported under “Current financial assets”;
> “Cash and cash equivalents”;
> “Short-term loans” and the “Current portion of long-term loans”.
Net assets held for sale: calculated as the algebraic sum of “Assets held for sale” and
“Liabilities held for sale”.
Net capital employed: calculated as the algebraic sum of “Net non-current assets” and “Net
current assets”, provisions not previously considered, “Deferred tax liabilities” and “Deferred
tax assets”, as well as “Net assets held for sale”.
Net financial debt: a financial structure indicator, determined by “Long-term loans”, the
current portion of such loans and “Short-term loans” less “Cash and cash equivalents”,
“Current financial assets” and “Non-current financial assets” not previously considered in
other balance sheet indicators. More generally, the net financial debt of the Enel Group is
calculated in conformity with paragraph 127 of Recommendation CESR/05-054b
implementing Regulation (EC) no. 809/2004 and in line with the CONSOB instructions of July
26, 2007 for the determination of the net financial position, net of financial receivables and
long-term securities.

Enel – Interim Financial Report at September 30, 2011 9
Main changes in the scope of consolidation In addition to the business combination involving the acquisition of control of SE Hydropower
discussed below, the scope of consolidation underwent the following main changes in the first
nine months of the year:
2010 > disposal, on December 17, 2010, of 80% of Nubia 2000, a company owning assets
(acquired by Endesa Gas during the year) in the gas transport and distribution industry in
Spain. The sale also includes a 35% stake in Gas Aragon, which had previously been
acquired by Nubia 2000. 2011 > disposal, on February 24, 2011, of Compañía Americana de Multiservicios (CAM), which
operates in Latin America in the general services sector;
> disposal, on March 1, 2011, of Synapsis IT Soluciones y Servicios (Synapsis), which
operates in Latin America in the IT services sector;
> acquisition, on March 31, 2011, of 16.67% of Sociedad Eólica de Andalucía – SEA, which
enabled Enel Green Power España to increase its holding from 46.67% to 63.34%,
thereby acquiring control as the majority shareholder;
> change in the consolidation method from full to proportionate (at 49%) owing to the loss
of control of Hydro Dolomiti Enel as a result of the change in that company’s governance
structure, as provided for in the agreements reached between the two shareholders in
2008, which had provided for joint control as from that date. See the following section for
more details;
> acquisition of full control (from joint control) of the assets retained by Enel Unión Fenosa
Renovables (EUFER) following the break-up of the joint venture between Enel Green
Power España and its partner Gas Natural under the agreement finalized on May 30,
2011. As from the date of execution of the agreement, those assets are therefore
consolidated on a full line-by-line basis, as discussed in greater detail below;
> acquisition, on June 9, 2011, of an additional 50% of Sociedade Térmica Portuguesa. With
the transaction, Enel Green Power España became the sole shareholder of the Portuguese
company, which operates in generation from renewables;
> disposal, on June 28, 2011, to Contour Global LP of the entire capital of the Dutch
companies Maritza East III Power Holding BV and Maritza O&M Holding Netherland BV.
These companies respectively own 73% of the Bulgarian company Maritza East 3 AD and
73% of the Bulgarian company Enel Operations Bulgaria AD.

Enel – Interim Financial Report at September 30, 2011 10
Restatement of balance-sheet figures at December 31, 2010 On June 1, 2010, the Group acquired control of SE Hydropower, which operates in the
generation of electricity in the province of Bolzano, through the transfer to the company of
certain generation assets of Enel Produzione in exchange for a 40% holding in the company.
Since the acquisition date Enel Produzione has exercised a dominant influence under specific
shareholders’ agreements concerning the governance of the company that give it effective
control and allow it to consolidate the company on a full line-by-line basis. During the 1st
Half of 2011, in accordance with the rules and deadlines established under IFRS 3 (Revised),
the process of allocating the consideration paid in the business combination was completed. As
a result of the determination of the fair value of the assets acquired and the liabilities and
contingent liabilities assumed as at the acquisition date, the figures for a number of items in
the consolidated financial statements at December 31, 2010 have been restated, with a
consequent increase in consolidated equity pertaining to shareholders of the Parent Company
of €128 million and in equity pertaining to non-controlling interests of €193 million. More
specifically, the completion of the allocation process involved the allocation of the entire
consideration transferred, representing 60% of the estimated fair value of the assets
transferred by Enel Produzione, to the value of the concessions acquired with the transaction,
net of tax effects.
Millions of euro
at Dec. 31,
2010 Effect of SE
Hydropower PPAat Dec. 31,
2010 restated
Non-current assets
- Property, plant and equipment and intangible assets 98,994 510 99,504
- Goodwill 18,470 - 18,470
- Equity investments accounted for using the equity method 1,033 - 1,033
- Other non-current assets 11,780 - 11,780
Total 130,277 510 130,787
Current assets 36,157 - 36,157
Assets held for sale 1,618 - 1,618
TOTAL ASSETS 168,052 510 168,562
Liabilities and shareholders’ equity
- Equity attributable to the shareholders of the Parent Company 37,861 128 37,989
- Equity attributable to non-controlling interests 15,684 193 15,877
Total 53,545 321 53,866
Non-current liabilities
- Long-term loans 52,440 - 52,440
- Provisions and deferred tax liabilities 23,242 189 23,431
- Other non-current liabilities 3,835 - 3,835
Total 79,517 189 79,706
Current liabilities 33,992 - 33,992
Liabilities held for sale 998 - 998
TOTAL LIABILITIES 114,507 189 114,696
TOTAL LIABILITIES AND SHAREHOLDERS’ EQUITY 168,052 510 168,562
Enel – Interim Financial Report at September 30, 2011 11
Summary of results
Performance and financial position
3rd Quarter Millions of euro First nine months
2011 2010 2011 2010
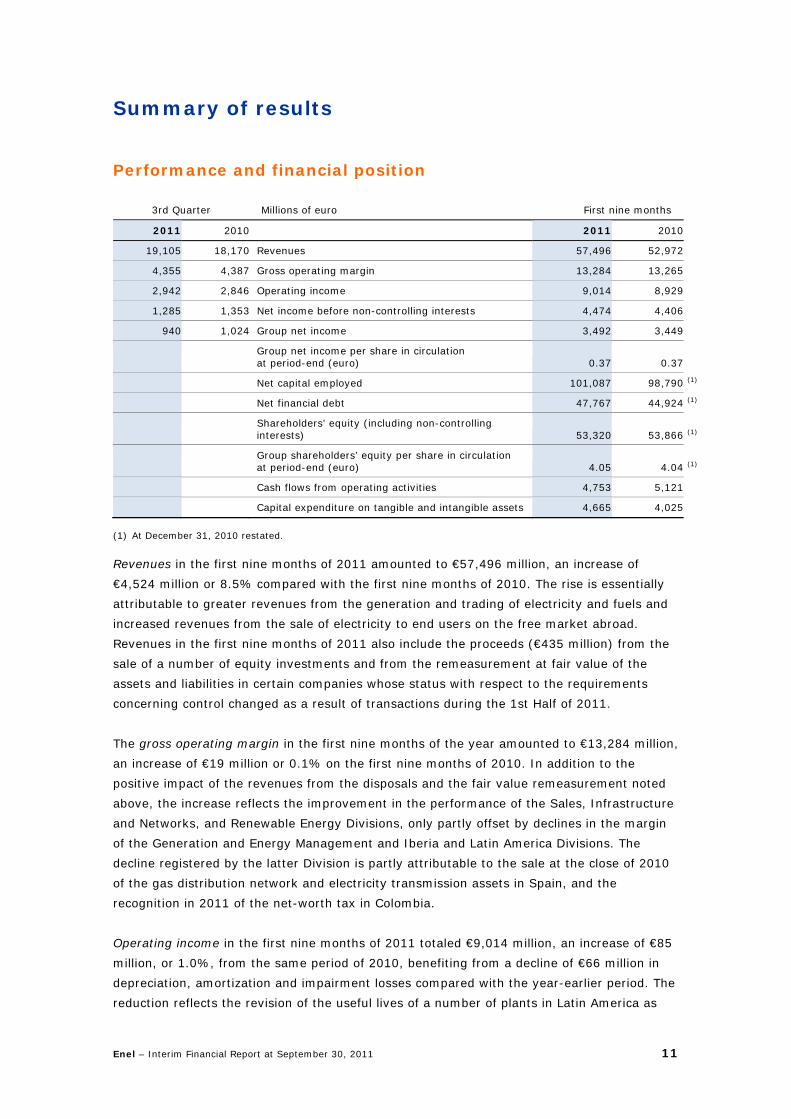
19,105 18,170 Revenues 57,496 52,972
4,355 4,387 Gross operating margin 13,284 13,265
2,942 2,846 Operating income 9,014 8,929
1,285 1,353 Net income before non-controlling interests 4,474 4,406
940 1,024 Group net income 3,492 3,449
Group net income per share in circulation at period-end (euro) 0.37 0.37
Net capital employed 101,087 98,790 (1)
Net financial debt 47,767 44,924 (1)
Shareholders’ equity (including non-controlling interests) 53,320 53,866 (1)
Group shareholders’ equity per share in circulation at period-end (euro) 4.05 4.04 (1)
Cash flows from operating activities 4,753 5,121
Capital expenditure on tangible and intangible assets 4,665 4,025
(1) At December 31, 2010 restated.
Revenues in the first nine months of 2011 amounted to €57,496 million, an increase of
€4,524 million or 8.5% compared with the first nine months of 2010. The rise is essentially
attributable to greater revenues from the generation and trading of electricity and fuels and
increased revenues from the sale of electricity to end users on the free market abroad.
Revenues in the first nine months of 2011 also include the proceeds (€435 million) from the
sale of a number of equity investments and from the remeasurement at fair value of the
assets and liabilities in certain companies whose status with respect to the requirements
concerning control changed as a result of transactions during the 1st Half of 2011.
The gross operating margin in the first nine months of the year amounted to €13,284 million,
an increase of €19 million or 0.1% on the first nine months of 2010. In addition to the
positive impact of the revenues from the disposals and the fair value remeasurement noted
above, the increase reflects the improvement in the performance of the Sales, Infrastructure
and Networks, and Renewable Energy Divisions, only partly offset by declines in the margin
of the Generation and Energy Management and Iberia and Latin America Divisions. The
decline registered by the latter Division is partly attributable to the sale at the close of 2010
of the gas distribution network and electricity transmission assets in Spain, and the
recognition in 2011 of the net-worth tax in Colombia.
Operating income in the first nine months of 2011 totaled €9,014 million, an increase of €85
million, or 1.0%, from the same period of 2010, benefiting from a decline of €66 million in
depreciation, amortization and impairment losses compared with the year-earlier period. The
reduction reflects the revision of the useful lives of a number of plants in Latin America as
Enel – Interim Financial Report at September 30, 2011 12
well as the change in the scope of consolidation (essentially attributable to the disposal of
the high-voltage network in Spain).
Group net income was €3,492 million in the first nine months of 2011, an increase of €43
million compared with the same period of 2010 (up 1.2%). The positive impact of the
Group’s operational performance and the improvement in the results of finance operations
were partially offset by higher estimated taxes for the period. The latter reflected the
adjustment of current and deferred taxation following the changes to the rules governing the
“Robin Hood Tax” in Italy.
Net financial debt, excluding debt in respect of assets held for sale totaling €25 million at
September 30, 2011 (€636 million at December 31, 2010), amounted to €47,767 million, up
€2,843 million compared with the end of 2010. At September 30, 2011, the debt/equity ratio
was 0.90, compared with 0.83 at December 31, 2010.
Capital expenditure in the first nine months of 2011 totaled €4,665 million, an increase of
€640 million on the year-earlier period. With investment in traditional technologies broadly
unchanged (as an increase in expenditure abroad was offset by a reduction in Italy), the rise
is essentially attributable to greater investment by the Renewable Energy Division.
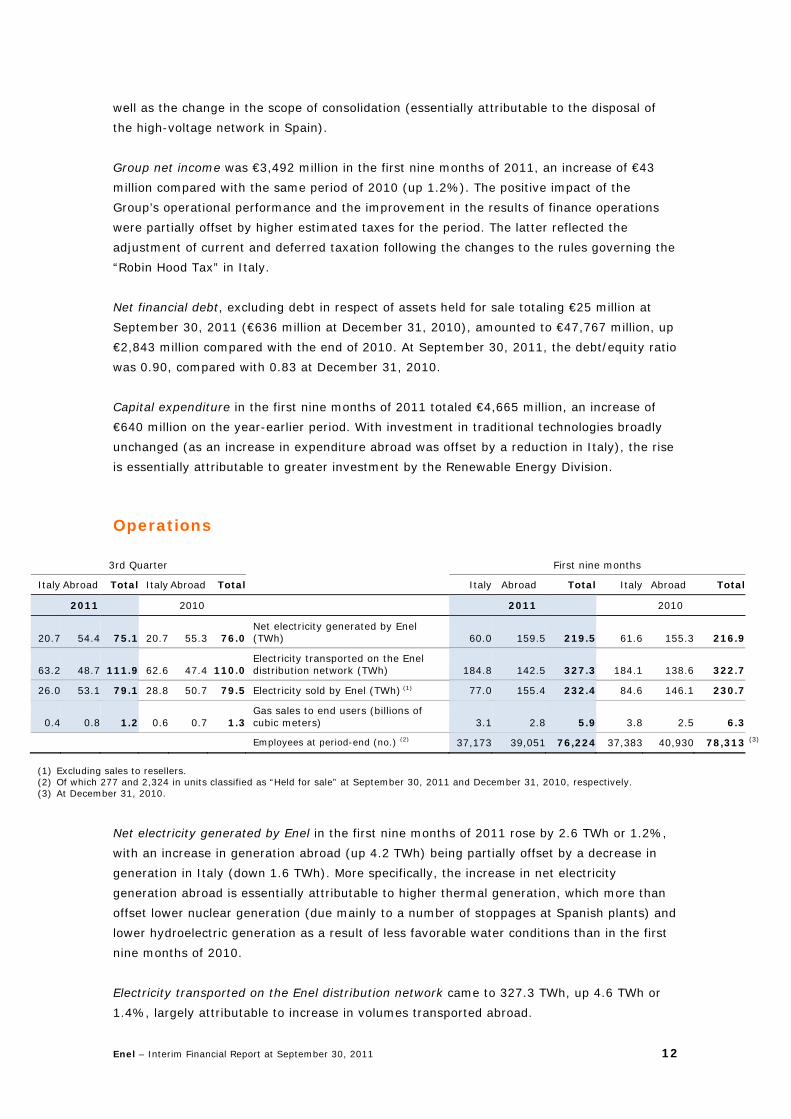
Operations
3rd Quarter First nine months
Italy Abroad Total Italy Abroad Total Italy Abroad Total Italy Abroad Total
2011 2010 2011 2010
20.7 54.4 75.1 20.7 55.3 76.0Net electricity generated by Enel (TWh) 60.0 159.5 219.5 61.6 155.3 216.9
63.2 48.7 111.9 62.6 47.4 110.0Electricity transported on the Enel distribution network (TWh) 184.8 142.5 327.3 184.1 138.6 322.7
26.0 53.1 79.1 28.8 50.7 79.5 Electricity sold by Enel (TWh) (1) 77.0 155.4 232.4 84.6 146.1 230.7
0.4 0.8 1.2 0.6 0.7 1.3Gas sales to end users (billions of cubic meters) 3.1 2.8 5.9 3.8 2.5 6.3
Employees at period-end (no.) (2) 37,173 39,051 76,224 37,383 40,930 78,313 (3)
(1) Excluding sales to resellers. (2) Of which 277 and 2,324 in units classified as “Held for sale” at September 30, 2011 and December 31, 2010, respectively. (3) At December 31, 2010.
Net electricity generated by Enel in the first nine months of 2011 rose by 2.6 TWh or 1.2%,
with an increase in generation abroad (up 4.2 TWh) being partially offset by a decrease in
generation in Italy (down 1.6 TWh). More specifically, the increase in net electricity
generation abroad is essentially attributable to higher thermal generation, which more than
offset lower nuclear generation (due mainly to a number of stoppages at Spanish plants) and
lower hydroelectric generation as a result of less favorable water conditions than in the first
nine months of 2010.
Electricity transported on the Enel distribution network came to 327.3 TWh, up 4.6 TWh or
1.4%, largely attributable to increase in volumes transported abroad.

Enel – Interim Financial Report at September 30, 2011 13
Electricity sold by Enel in the first nine months of 2011 rose by 1.7 TWh or 0.7%, essentially
due to increased sales in Latin America (up 4.2 TWh), especially in Chile, greater anticipated
capacity in France (up 3.9 TWh), the expansion of operations in new regions in Russia (up 1.1
TWh) and greater sales in Slovakia (up 1.1 TWh) due to greater volumes sold. These factors
were partially offset by the decline in Italian sales (down 7.6 TWh) as a result of a contraction
in quantities on both the free market and the regulated market.
At September 30, 2011 Enel Group employees numbered 76,224 (78,313 at December 31,
2010). The reduction of 2,089 employees essentially reflects the change in the scope of
consolidation (a decrease of 2,293) related mainly to the sale of CAM, Synapsis, Enel
Operations Bulgaria and Enel Maritza East 3, as well as the change in the method of
consolidating Hydro Dolomiti Enel (from full to proportionate).
Enel – Interim Financial Report at September 30, 2011 14
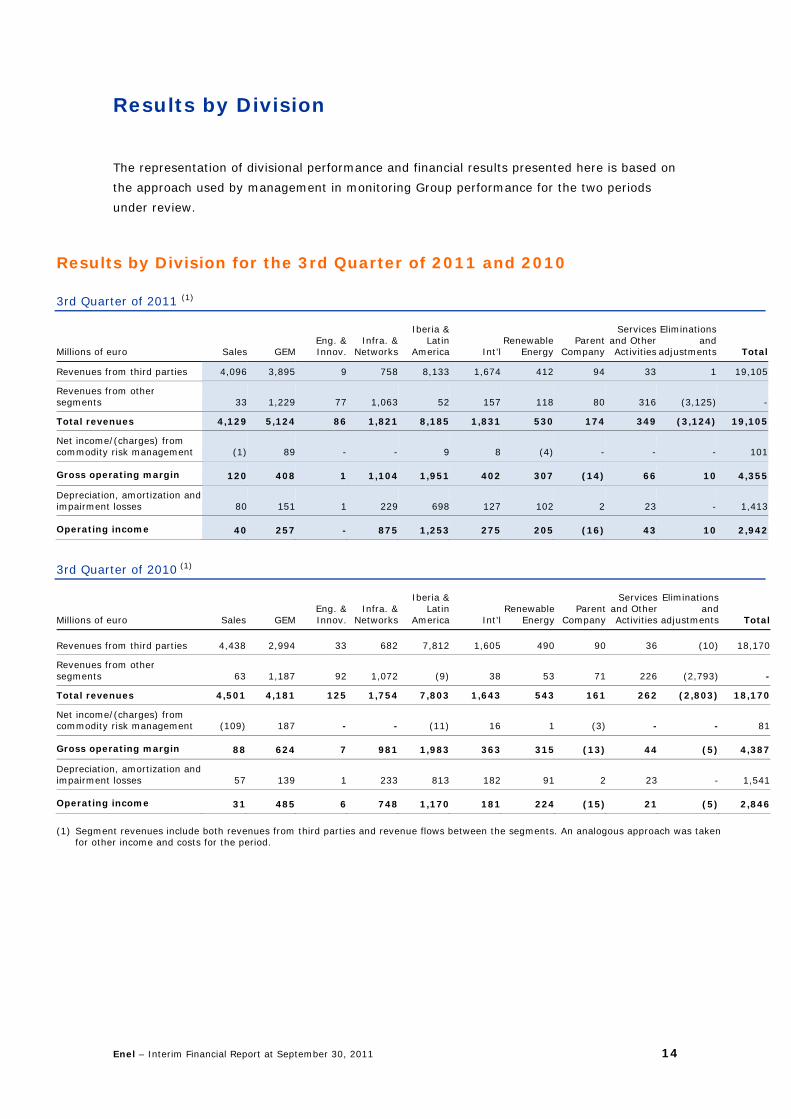
Results by Division
The representation of divisional performance and financial results presented here is based on
the approach used by management in monitoring Group performance for the two periods
under review.
Results by Division for the 3rd Quarter of 2011 and 2010
3rd Quarter of 2011 (1)
Millions of euro Sales GEM Eng. & Innov.
Infra. & Networks
Iberia & Latin
America Int’lRenewable
EnergyParent
Company
Services and Other Activities
Eliminations and
adjustments Total
Revenues from third parties 4,096 3,895 9 758 8,133 1,674 412 94 33 1 19,105
Revenues from other segments 33 1,229 77 1,063 52 157 118 80 316 (3,125) -
Total revenues 4,129 5,124 86 1,821 8,185 1,831 530 174 349 (3,124) 19,105
Net income/(charges) from commodity risk management (1) 89 - - 9 8 (4) - - - 101
Gross operating margin 120 408 1 1,104 1,951 402 307 (14) 66 10 4,355
Depreciation, amortization and impairment losses 80 151 1 229 698 127 102 2 23 - 1,413
Operating income 40 257 - 875 1,253 275 205 (16) 43 10 2,942
3rd Quarter of 2010 (1)
Millions of euro Sales GEM Eng. & Innov.
Infra. & Networks
Iberia & Latin
America Int’lRenewable
EnergyParent
Company
Services and Other Activities
Eliminationsand
adjustments Total
Revenues from third parties 4,438 2,994 33 682 7,812 1,605 490 90 36 (10) 18,170
Revenues from other segments 63 1,187 92 1,072 (9) 38 53 71 226 (2,793) -
Total revenues 4,501 4,181 125 1,754 7,803 1,643 543 161 262 (2,803) 18,170
Net income/(charges) from commodity risk management (109) 187 - - (11) 16 1 (3) - - 81
Gross operating margin 88 624 7 981 1,983 363 315 (13) 44 (5) 4,387
Depreciation, amortization and impairment losses 57 139 1 233 813 182 91 2 23 - 1,541
Operating income 31 485 6 748 1,170 181 224 (15) 21 (5) 2,846
(1) Segment revenues include both revenues from third parties and revenue flows between the segments. An analogous approach was taken
for other income and costs for the period.
Enel – Interim Financial Report at September 30, 2011 15
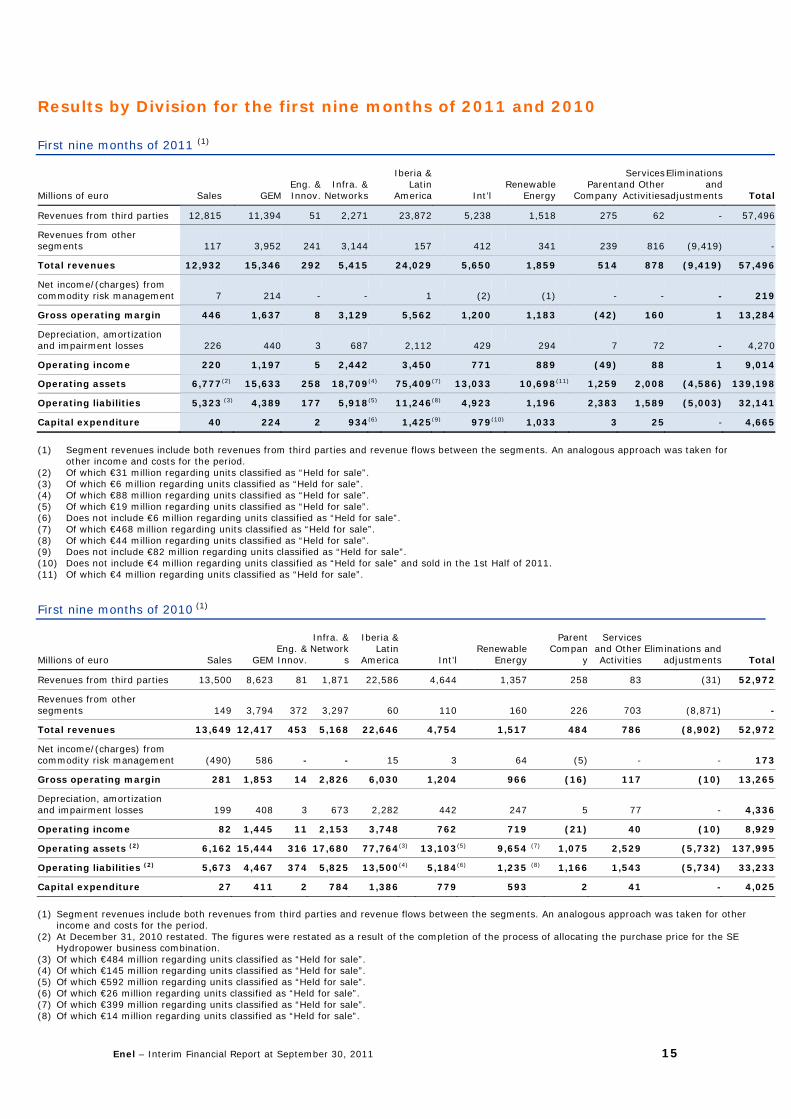
Results by Division for the first nine months of 2011 and 2010
First nine months of 2011 (1)
Millions of euro Sales
GEM Eng. & Innov.
Infra. & Networks
Iberia &Latin
America Int’l Renewable
EnergyParent
Company
Services and Other Activities
Eliminations and
adjustments Total
Revenues from third parties 12,815 11,394 51 2,271 23,872 5,238 1,518 275 62 - 57,496
Revenues from other segments 117 3,952 241 3,144 157 412 341 239 816 (9,419) -
Total revenues 12,932 15,346 292 5,415 24,029 5,650 1,859 514 878 (9,419) 57,496
Net income/(charges) from commodity risk management 7 214 - - 1 (2) (1) - - - 219
Gross operating margin 446 1,637 8 3,129 5,562 1,200 1,183 (42) 160 1 13,284
Depreciation, amortization and impairment losses 226 440 3 687 2,112 429 294 7 72 - 4,270
Operating income 220 1,197 5 2,442 3,450 771 889 (49) 88 1 9,014
Operating assets 6,777 (2) 15,633 258 18,709 (4) 75,409(7) 13,033 10,698 (11) 1,259 2,008 (4,586) 139,198
Operating liabilities 5,323 (3) 4,389 177 5,918 (5) 11,246(8) 4,923 1,196 2,383 1,589 (5,003) 32,141
Capital expenditure 40 224 2 934 (6) 1,425(9) 979(10) 1,033 3 25 - 4,665
(1) Segment revenues include both revenues from third parties and revenue flows between the segments. An analogous approach was taken for
other income and costs for the period. (2) Of which €31 million regarding units classified as “Held for sale”. (3) Of which €6 million regarding units classified as “Held for sale”. (4) Of which €88 million regarding units classified as “Held for sale”. (5) Of which €19 million regarding units classified as “Held for sale”. (6) Does not include €6 million regarding units classified as “Held for sale”. (7) Of which €468 million regarding units classified as “Held for sale”. (8) Of which €44 million regarding units classified as “Held for sale”. (9) Does not include €82 million regarding units classified as “Held for sale”. (10) Does not include €4 million regarding units classified as “Held for sale” and sold in the 1st Half of 2011. (11) Of which €4 million regarding units classified as “Held for sale”.
First nine months of 2010 (1)
Millions of euro Sales GEM Eng. & Innov.
Infra. & Network
s
Iberia & Latin
America Int’l Renewable
Energy
Parent Compan
y
Services and Other Activities
Eliminations and adjustments Total
Revenues from third parties 13,500 8,623 81 1,871 22,586 4,644 1,357 258 83 (31) 52,972
Revenues from other segments 149 3,794 372 3,297 60 110 160
226 703 (8,871) -
Total revenues 13,649 12,417 453 5,168 22,646 4,754 1,517 484 786 (8,902) 52,972
Net income/(charges) from commodity risk management (490) 586 - - 15 3 64
(5) - - 173
Gross operating margin 281 1,853 14 2,826 6,030 1,204 966 (16) 117 (10) 13,265
Depreciation, amortization and impairment losses 199 408 3 673 2,282 442 247
5 77 - 4,336
Operating income 82 1,445 11 2,153 3,748 762 719 (21) 40 (10) 8,929
Operating assets (2) 6,162 15,444 316 17,680 77,764(3) 13,103(5) 9,654 (7) 1,075 2,529 (5,732) 137,995
Operating liabilities (2) 5,673 4,467 374 5,825 13,500(4) 5,184(6) 1,235 (8) 1,166 1,543 (5,734) 33,233
Capital expenditure 27 411 2 784 1,386 779 593 2 41 - 4,025
(1) Segment revenues include both revenues from third parties and revenue flows between the segments. An analogous approach was taken for other
income and costs for the period. (2) At December 31, 2010 restated. The figures were restated as a result of the completion of the process of allocating the purchase price for the SE
Hydropower business combination. (3) Of which €484 million regarding units classified as “Held for sale”. (4) Of which €145 million regarding units classified as “Held for sale”. (5) Of which €592 million regarding units classified as “Held for sale”. (6) Of which €26 million regarding units classified as “Held for sale”. (7) Of which €399 million regarding units classified as “Held for sale”. (8) Of which €14 million regarding units classified as “Held for sale”.
Enel – Interim Financial Report at September 30, 2011 16
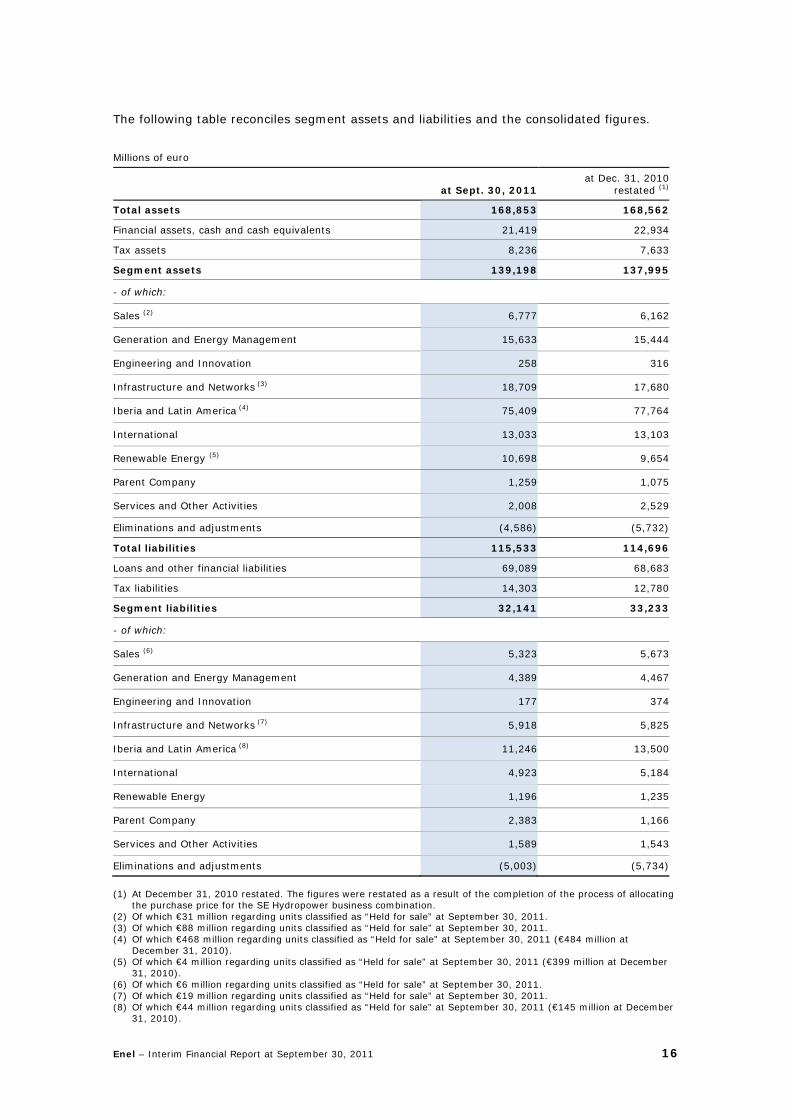
The following table reconciles segment assets and liabilities and the consolidated figures.
Millions of euro
at Sept. 30, 2011at Dec. 31, 2010
restated (1)
Total assets 168,853 168,562
Financial assets, cash and cash equivalents 21,419 22,934
Tax assets 8,236 7,633
Segment assets 139,198 137,995
- of which:
Sales (2) 6,777 6,162
Generation and Energy Management 15,633 15,444
Engineering and Innovation 258 316
Infrastructure and Networks (3) 18,709 17,680
Iberia and Latin America (4) 75,409 77,764
International 13,033 13,103
Renewable Energy (5) 10,698 9,654
Parent Company 1,259 1,075
Services and Other Activities 2,008 2,529
Eliminations and adjustments (4,586) (5,732)
Total liabilities 115,533 114,696
Loans and other financial liabilities 69,089 68,683
Tax liabilities 14,303 12,780
Segment liabilities 32,141 33,233
- of which:
Sales (6) 5,323 5,673
Generation and Energy Management 4,389 4,467
Engineering and Innovation 177 374
Infrastructure and Networks (7) 5,918 5,825
Iberia and Latin America (8) 11,246 13,500
International 4,923 5,184
Renewable Energy 1,196 1,235
Parent Company 2,383 1,166
Services and Other Activities 1,589 1,543
Eliminations and adjustments (5,003) (5,734)
(1) At December 31, 2010 restated. The figures were restated as a result of the completion of the process of allocating
the purchase price for the SE Hydropower business combination. (2) Of which €31 million regarding units classified as “Held for sale” at September 30, 2011. (3) Of which €88 million regarding units classified as “Held for sale” at September 30, 2011. (4) Of which €468 million regarding units classified as “Held for sale” at September 30, 2011 (€484 million at
December 31, 2010). (5) Of which €4 million regarding units classified as “Held for sale” at September 30, 2011 (€399 million at December
31, 2010). (6) Of which €6 million regarding units classified as “Held for sale” at September 30, 2011. (7) Of which €19 million regarding units classified as “Held for sale” at September 30, 2011. (8) Of which €44 million regarding units classified as “Held for sale” at September 30, 2011 (€145 million at December
31, 2010).
Enel – Interim Financial Report at September 30, 2011 17
Sales
Operations
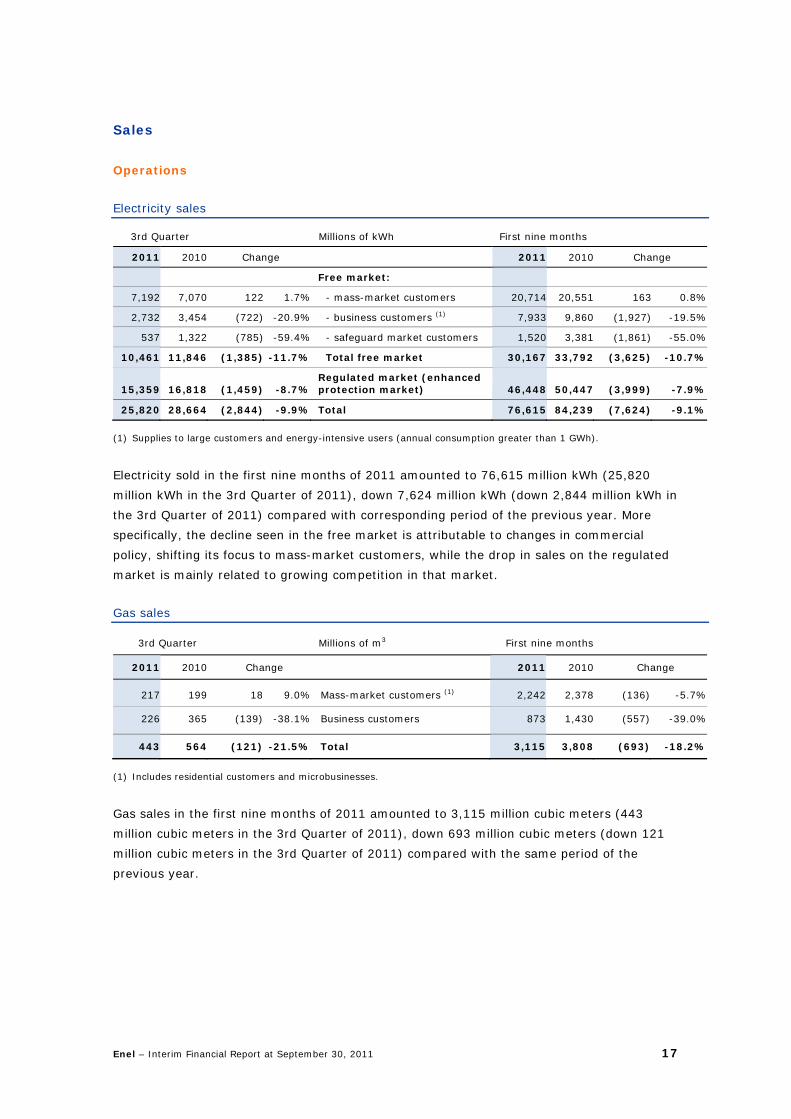
Electricity sales
3rd Quarter Millions of kWh First nine months
2011 2010 Change 2011 2010 Change
Free market:
7,192 7,070 122 1.7% - mass-market customers 20,714 20,551 163 0.8%
2,732 3,454 (722) -20.9% - business customers (1) 7,933 9,860 (1,927) -19.5%
537 1,322 (785) -59.4% - safeguard market customers 1,520 3,381 (1,861) -55.0%
10,461 11,846 (1,385) -11.7% Total free market 30,167 33,792 (3,625) -10.7%
15,359 16,818 (1,459) -8.7%Regulated market (enhanced protection market) 46,448 50,447 (3,999) -7.9%
25,820 28,664 (2,844) -9.9% Total 76,615 84,239 (7,624) -9.1%
(1) Supplies to large customers and energy-intensive users (annual consumption greater than 1 GWh).
Electricity sold in the first nine months of 2011 amounted to 76,615 million kWh (25,820
million kWh in the 3rd Quarter of 2011), down 7,624 million kWh (down 2,844 million kWh in
the 3rd Quarter of 2011) compared with corresponding period of the previous year. More
specifically, the decline seen in the free market is attributable to changes in commercial
policy, shifting its focus to mass-market customers, while the drop in sales on the regulated
market is mainly related to growing competition in that market.
Gas sales
3rd Quarter Millions of m3 First nine months
2011 2010 Change 2011 2010 Change
217 199 18 9.0% Mass-market customers (1) 2,242 2,378 (136) -5.7%
226 365 (139) -38.1% Business customers 873 1,430 (557) -39.0%
443 564 (121) -21.5% Total 3,115 3,808 (693) -18.2%
(1) Includes residential customers and microbusinesses.
Gas sales in the first nine months of 2011 amounted to 3,115 million cubic meters (443
million cubic meters in the 3rd Quarter of 2011), down 693 million cubic meters (down 121
million cubic meters in the 3rd Quarter of 2011) compared with the same period of the
previous year.
Enel – Interim Financial Report at September 30, 2011 18
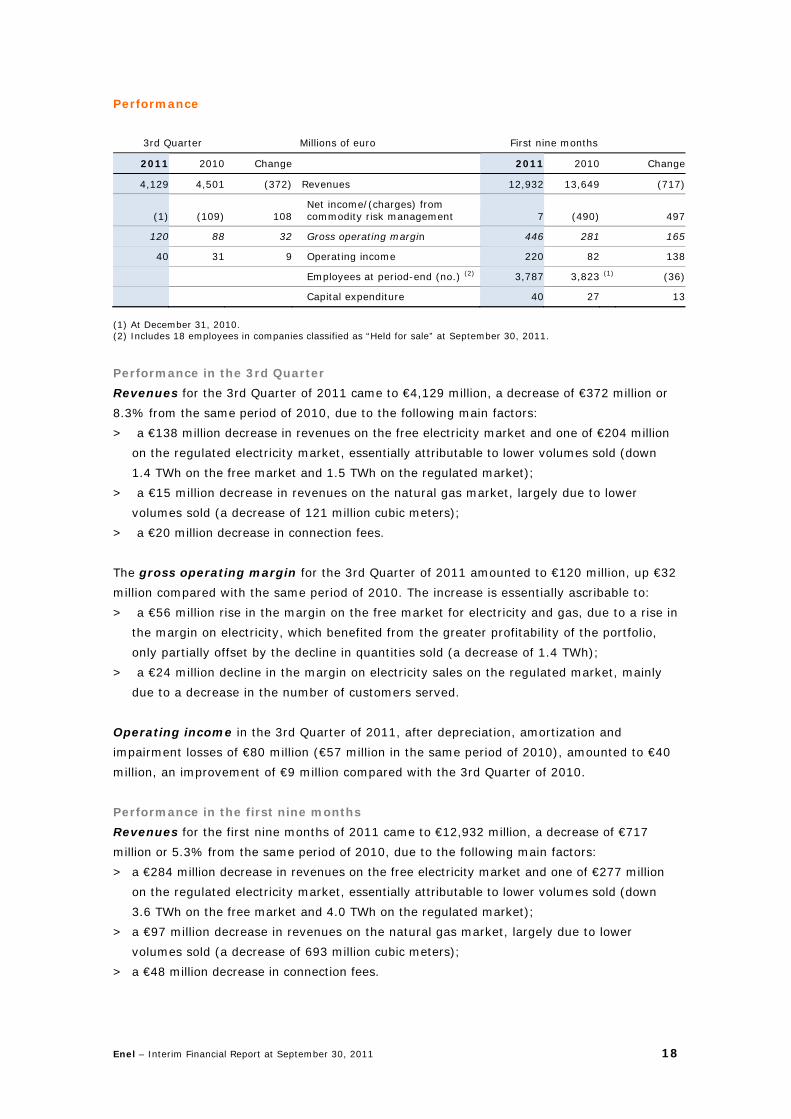
Performance
3rd Quarter Millions of euro First nine months
2011 2010 Change 2011 2010 Change
4,129 4,501 (372) Revenues 12,932 13,649 (717)
(1) (109) 108Net income/(charges) from commodity risk management 7 (490) 497
120 88 32 Gross operating margin 446 281 165
40 31 9 Operating income 220 82 138
Employees at period-end (no.) (2) 3,787 3,823 (1) (36)
Capital expenditure 40 27 13
(1) At December 31, 2010. (2) Includes 18 employees in companies classified as “Held for sale” at September 30, 2011.
Performance in the 3rd Quarter
Revenues for the 3rd Quarter of 2011 came to €4,129 million, a decrease of €372 million or
8.3% from the same period of 2010, due to the following main factors:
> a €138 million decrease in revenues on the free electricity market and one of €204 million
on the regulated electricity market, essentially attributable to lower volumes sold (down
1.4 TWh on the free market and 1.5 TWh on the regulated market);
> a €15 million decrease in revenues on the natural gas market, largely due to lower
volumes sold (a decrease of 121 million cubic meters);
> a €20 million decrease in connection fees.
The gross operating margin for the 3rd Quarter of 2011 amounted to €120 million, up €32
million compared with the same period of 2010. The increase is essentially ascribable to:
> a €56 million rise in the margin on the free market for electricity and gas, due to a rise in
the margin on electricity, which benefited from the greater profitability of the portfolio,
only partially offset by the decline in quantities sold (a decrease of 1.4 TWh);
> a €24 million decline in the margin on electricity sales on the regulated market, mainly
due to a decrease in the number of customers served.
Operating income in the 3rd Quarter of 2011, after depreciation, amortization and
impairment losses of €80 million (€57 million in the same period of 2010), amounted to €40
million, an improvement of €9 million compared with the 3rd Quarter of 2010.
Performance in the first nine months
Revenues for the first nine months of 2011 came to €12,932 million, a decrease of €717
million or 5.3% from the same period of 2010, due to the following main factors:
> a €284 million decrease in revenues on the free electricity market and one of €277 million
on the regulated electricity market, essentially attributable to lower volumes sold (down
3.6 TWh on the free market and 4.0 TWh on the regulated market);
> a €97 million decrease in revenues on the natural gas market, largely due to lower
volumes sold (a decrease of 693 million cubic meters);
> a €48 million decrease in connection fees.
Enel – Interim Financial Report at September 30, 2011 19
The gross operating margin for the first nine months of 2011 amounted to €446 million,
up €165 million compared with the same period of 2010. The increase is essentially
ascribable to:
> a €157 million rise in the margin on the free market for electricity and gas, mainly due to
a rise of €217 million in the margin on electricity, which benefited from the greater
profitability of the portfolio, only partially offset by the decline in quantities sold (a
decrease of 3.6 TWh); this was partially offset by an increase of €36 million in operating
and marketing costs;
> an €8 million increase in the margin on electricity sales on the regulated market, due to
gains in operational efficiency and the impact of the recognition in the first nine months of
2010 of a fine of €12 million levied by the Authority for Electricity and Gas (the Authority)
with its Resolution no. 66/77, factors that more than offset the decrease of €48 million in
the electricity margin associated with the decline in the average number of customers
served under the enhanced protection system following the opening of the market.
Operating income in the first nine months of 2011, after depreciation, amortization and
impairment losses of €226 million (€199 million in the same period of 2010), amounted to
€220 million, up €138 million compared with the first nine months of 2010. This performance
is in line with developments in the gross operating margin.
Capital expenditure
Capital expenditure totaled €40 million, up €13 million compared with the same period of
2010.

Enel – Interim Financial Report at September 30, 2011 20
Generation and Energy Management
Operations
Net electricity generation
3rd Quarter Millions of kWh First nine months
2011 2010 Change 2011 2010 Change
13,663 12,822 841 6.6% Thermal 37,461 35,965 1,496 4.2%
4,325 5,146 (821) -16.0% Hydroelectric 13,509 16,549 (3,040) -18.4%
3 2 1 50.0% Other resources 7 4 3 75.0%
17,991 17,970 21 0.1% Total net generation 50,977 52,518 (1,541) -2.9%
In the first nine months of 2011, net electricity generation totaled 50,977 million kWh, a
decline of 2.9% compared with the corresponding period of 2010; in the 3rd Quarter of 2011
net electricity generation totaled 17,991 million kWh, essentially unchanged (up 0.1%)
compared with the 3rd Quarter of 2010. The decline in hydroelectric generation in the first
nine months of 2011, amounting to 3,040 million kWh, was the result of poorer water
availability during the period (at the national level as well) and the change in the method of
consolidating Hydro Dolomiti Enel (a decrease of 1,012 million kWh). These factors were only
partially offset by greater thermal generation during the period amounting to 1,496 million
kWh. In the 3rd Quarter of 2011, a rise of 841 million kWh in thermal generation more than
offset the decline of 821 million kWh in hydro generation.
Contribution to gross thermal generation
3rd Quarter Millions of kWh First nine months
2011 2010 Change 2011 2010 Change
208 1.4% 162 1.2% 46 28.4%High-sulfur fuel oil (S>0.25%) 564 1.4% 585 1.5% (21) -3.6%
56 0.4% 408 3.0% (352) -86.3%Low-sulfur fuel oil (S<0.25%) 229 0.6% 739 2.0% (510) -69.0%
264 1.8% 570 4.2% (306) -53.7% Total fuel oil 793 2.0% 1,324 3.5% (531) -40.1%
5,428 37.4% 5,207 38.1% 221 4.2% Natural gas 14,593 36.7% 15,332 40.0% (739) -4.8%
8,682 59.8% 7,755 56.8% 927 12.0% Coal 24,008 60.3% 21,262 55.5% 2,746 12.9%
143 1.0% 126 0.9% 17 13.5% Other fuels 403 1.0% 369 1.0% 34 9.2%
14,517 100.0% 13,658 100.0% 859 6.3% Total 39,797 100.0% 38,287 100.0% 1,510 3.9%
Gross thermal generation in the first nine months of 2011 amounted to 39,797 million kWh
(14,517 million kWh in the 3rd Quarter of 2011), an increase of 3.9% with respect to the
corresponding period of 2010 (up 6.3% in the 3rd Quarter of 2011). The increase was due in
particular to generation from coal (up 12.9% in the first nine months of 2011 and 12.0% in
the 3rd Quarter of 2011), mainly as a result of the greater output of the Torrevaldaliga Nord
plant. This increase was partially offset by the decline in generation from fuel oil (down
40.1% in the first nine months of 2011 and 53.7% in the 3rd Quarter of 2011), due to
Enel – Interim Financial Report at September 30, 2011 21
unfavorable fuel prices, which have made its use uncompetitive, as well as lower generation
from natural gas in the first nine months of 2011 (down 4.8%), although the trend reversed
in the 3rd Quarter of 2011 (up 4.2%), mainly as a result of the rise in the use of combined-
cycle plants in central/northern Italy.
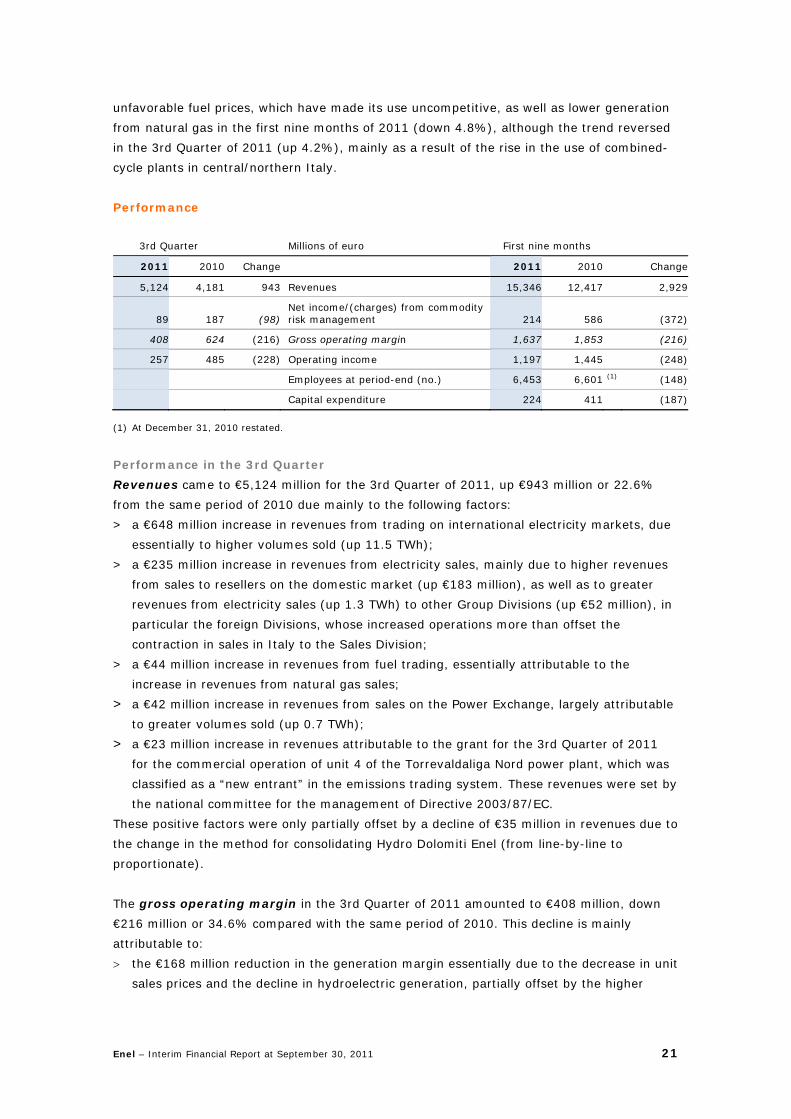
Performance
3rd Quarter Millions of euro First nine months
2011 2010 Change 2011 2010 Change
5,124 4,181 943 Revenues 15,346 12,417 2,929
89 187 (98)Net income/(charges) from commodity risk management 214 586 (372)
408 624 (216) Gross operating margin 1,637 1,853 (216)
257 485 (228) Operating income 1,197 1,445 (248)
Employees at period-end (no.) 6,453 6,601 (1) (148)
Capital expenditure 224 411 (187)
(1) At December 31, 2010 restated.
Performance in the 3rd Quarter
Revenues came to €5,124 million for the 3rd Quarter of 2011, up €943 million or 22.6%
from the same period of 2010 due mainly to the following factors:
> a €648 million increase in revenues from trading on international electricity markets, due
essentially to higher volumes sold (up 11.5 TWh);
> a €235 million increase in revenues from electricity sales, mainly due to higher revenues
from sales to resellers on the domestic market (up €183 million), as well as to greater
revenues from electricity sales (up 1.3 TWh) to other Group Divisions (up €52 million), in
particular the foreign Divisions, whose increased operations more than offset the
contraction in sales in Italy to the Sales Division;
> a €44 million increase in revenues from fuel trading, essentially attributable to the
increase in revenues from natural gas sales;
> a €42 million increase in revenues from sales on the Power Exchange, largely attributable
to greater volumes sold (up 0.7 TWh);
> a €23 million increase in revenues attributable to the grant for the 3rd Quarter of 2011
for the commercial operation of unit 4 of the Torrevaldaliga Nord power plant, which was
classified as a “new entrant” in the emissions trading system. These revenues were set by
the national committee for the management of Directive 2003/87/EC.
These positive factors were only partially offset by a decline of €35 million in revenues due to
the change in the method for consolidating Hydro Dolomiti Enel (from line-by-line to
proportionate).
The gross operating margin in the 3rd Quarter of 2011 amounted to €408 million, down
€216 million or 34.6% compared with the same period of 2010. This decline is mainly
attributable to:
> the €168 million reduction in the generation margin essentially due to the decrease in unit
sales prices and the decline in hydroelectric generation, partially offset by the higher
Enel – Interim Financial Report at September 30, 2011 22
revenues due to the classification of unit 4 of the Torrevaldaliga Nord power plant as a
“new entrant” in the emissions trading system;
> the €25 million decrease in the margin on ancillary services;
> the €31 million decrease due to the effect of the change in the method of consolidating
Hydro Dolomiti Enel (from line-by-line to proportionate).
Operating income amounted to €257 million (€485 million in the 3rd Quarter of 2010) after
an increase in depreciation, amortization and impairment losses of €12 million, mainly
attributable to the effect of the writeback of certain trade receivables in the 2nd Quarter of
2010.
Performance in the first nine months
Revenues for the first nine months of 2011 amounted to €15,346 million, up €2,929 million
or 23.6% compared with the year-earlier period, due mainly to the following factors:
> a €1,752 million increase in revenues from trading on international electricity markets,
due essentially to higher volumes sold (up 30.8 TWh);
> a €544 million increase in revenues from electricity sales, mainly due to higher revenues
from sales to resellers on the domestic market (up €342 million), as well as to greater
revenues from electricity sales (up 2.2 TWh) to other Group Divisions (up €170 million),
in particular the foreign Divisions, whose increased operations more than offset the
contraction in sales in Italy to the Sales Division;
> a €237 million gain from the fair value adjustment of the assets and liabilities of Hydro
Dolomiti Enel, corresponding to the Group’s remaining equity investment in the company
following its loss of control as a result of the change in its corporate governance
structure;
> a €179 million increase in revenues attributable to the grant for 2010 and the first nine
months of 2011 for the commercial operation of unit 4 of the Torrevaldaliga Nord power
plant, which was classified as a “new entrant” in the emissions trading system. These
revenues were set in part (€101 million) by the Authority with Resolutions ARG/elt no.
38/11 and no. 111/11 and in part (€78 million) by the national committee for the
management of Directive 2003/87/EC;
> a €177 million increase in revenues from fuel trading, attributable to revenues from
natural gas sales in the amount of €163 million and sales of other fuels in the amount of
€14 million;
> a €116 million increase in revenues from the sale of green certificates to the Energy
Services Operator (ESO).
These positive factors were only partially offset by a €78 million decrease in revenues from
sales on the Power Exchange, largely attributable to lower volumes sold (down 1.5 TWh) and
the decline in average sales prices.
The gross operating margin in the first nine months of 2011 amounted to €1,637 million,
down €216 million or 11.7% compared with the same period of 2010. If the gain from the
fair value adjustment of the assets and liabilities of Hydro Dolomiti Enel of €237 million is
excluded, the gross operating margin fell by €453 million. This decline is mainly attributable
to:
Enel – Interim Financial Report at September 30, 2011 23
> the €316 million reduction in the generation margin essentially due to the decrease in unit
sales prices and the decline in hydroelectric generation, partially offset by the higher
revenues due to the classification of unit 4 of the Torrevaldaliga Nord power plant as a
“new entrant” in the emissions trading system;
> the €73 million decrease in the margin on natural gas sales due mainly to the decline in
sales prices on the business market (as a result of greater competition) and on the mass
market (following Resolution ARG/gas no. 89/10);
> the €57 million decrease due to the effect of the change in the method of consolidating
Hydro Dolomiti Enel.
Operating income amounted to €1,197 million (€1,445 million in the first nine months of
2010) after an increase in depreciation, amortization and impairment losses of €32 million,
mainly attributable to the effect of the writeback of certain trade receivables in the 2nd
Quarter of 2010.
Capital expenditure
Capital expenditure in the first nine months of 2011 came to €224 million, mainly in
respect of generation plants. The main investments regarded the continuation of work at
thermal plants and the refurbishing/repowering of existing hydroelectric plants. The decrease
compared with the same period of 2010 reflects the completion of a number of major
projects, including the coal conversion of the Torrevaldaliga Nord plant.
Enel – Interim Financial Report at September 30, 2011 24
Engineering and Innovation
Performance
3rd Quarter Millions of euro First nine months
2011 2010 Change 2011 2010 Change
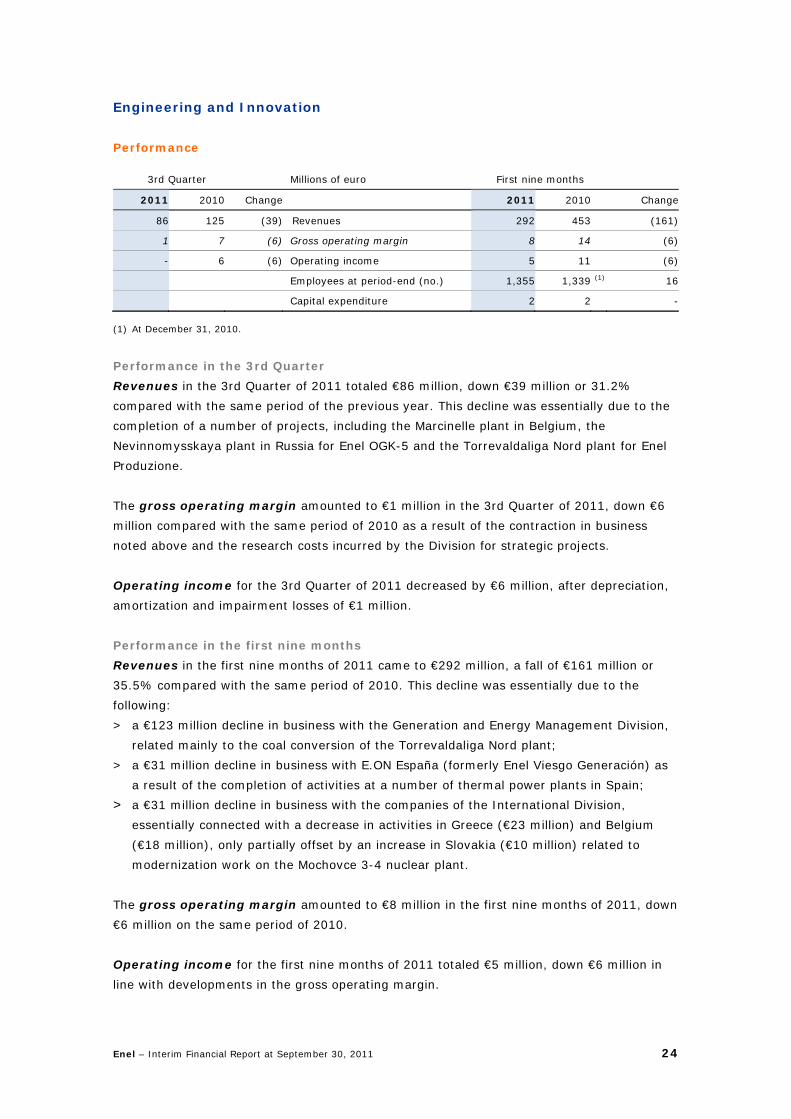
86 125 (39) Revenues 292 453 (161)
1 7 (6) Gross operating margin 8 14 (6)
- 6 (6) Operating income 5 11 (6)
Employees at period-end (no.) 1,355 1,339 (1) 16
Capital expenditure 2 2 -
(1) At December 31, 2010.
Performance in the 3rd Quarter
Revenues in the 3rd Quarter of 2011 totaled €86 million, down €39 million or 31.2%
compared with the same period of the previous year. This decline was essentially due to the
completion of a number of projects, including the Marcinelle plant in Belgium, the
Nevinnomysskaya plant in Russia for Enel OGK-5 and the Torrevaldaliga Nord plant for Enel
Produzione.
The gross operating margin amounted to €1 million in the 3rd Quarter of 2011, down €6
million compared with the same period of 2010 as a result of the contraction in business
noted above and the research costs incurred by the Division for strategic projects.
Operating income for the 3rd Quarter of 2011 decreased by €6 million, after depreciation,
amortization and impairment losses of €1 million.
Performance in the first nine months
Revenues in the first nine months of 2011 came to €292 million, a fall of €161 million or
35.5% compared with the same period of 2010. This decline was essentially due to the
following:
> a €123 million decline in business with the Generation and Energy Management Division,
related mainly to the coal conversion of the Torrevaldaliga Nord plant;
> a €31 million decline in business with E.ON España (formerly Enel Viesgo Generación) as
a result of the completion of activities at a number of thermal power plants in Spain;
> a €31 million decline in business with the companies of the International Division,
essentially connected with a decrease in activities in Greece (€23 million) and Belgium
(€18 million), only partially offset by an increase in Slovakia (€10 million) related to
modernization work on the Mochovce 3-4 nuclear plant.
The gross operating margin amounted to €8 million in the first nine months of 2011, down
€6 million on the same period of 2010.
Operating income for the first nine months of 2011 totaled €5 million, down €6 million in
line with developments in the gross operating margin.
Enel – Interim Financial Report at September 30, 2011 25
Capital expenditure
Capital expenditure amounted to €2 million, essentially in line with the same period of the
previous year.
Enel – Interim Financial Report at September 30, 2011 26
Infrastructure and Networks
Operations
Transport of electricity
3rd Quarter First nine months
2011 2010 Change 2011 2010 Change
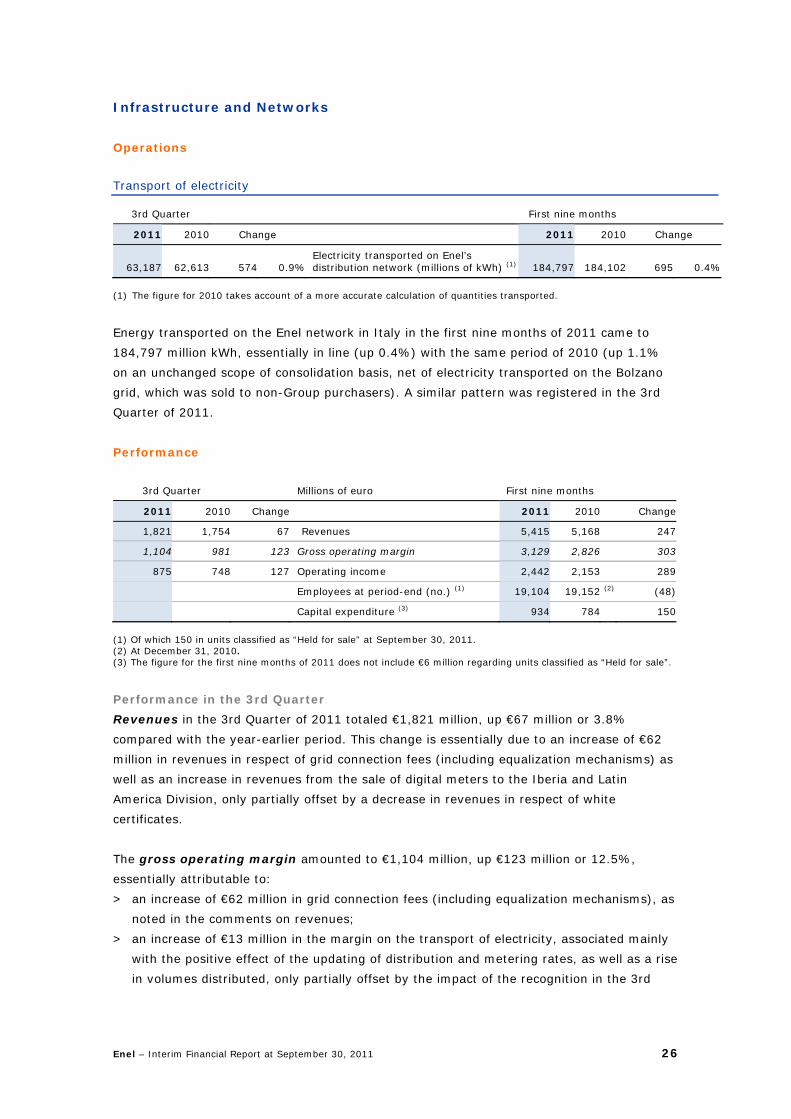
63,187 62,613 574 0.9%Electricity transported on Enel’s distribution network (millions of kWh) (1) 184,797 184,102 695 0.4%
(1) The figure for 2010 takes account of a more accurate calculation of quantities transported.
Energy transported on the Enel network in Italy in the first nine months of 2011 came to
184,797 million kWh, essentially in line (up 0.4%) with the same period of 2010 (up 1.1%
on an unchanged scope of consolidation basis, net of electricity transported on the Bolzano
grid, which was sold to non-Group purchasers). A similar pattern was registered in the 3rd
Quarter of 2011.
Performance
3rd Quarter Millions of euro First nine months
2011 2010 Change 2011 2010 Change
1,821 1,754 67 Revenues 5,415 5,168 247
1,104 981 123 Gross operating margin 3,129 2,826 303
875 748 127 Operating income 2,442 2,153 289
Employees at period-end (no.) (1) 19,104 19,152 (2) (48)
Capital expenditure (3) 934 784 150
(1) Of which 150 in units classified as “Held for sale” at September 30, 2011. (2) At December 31, 2010. (3) The figure for the first nine months of 2011 does not include €6 million regarding units classified as “Held for sale”.
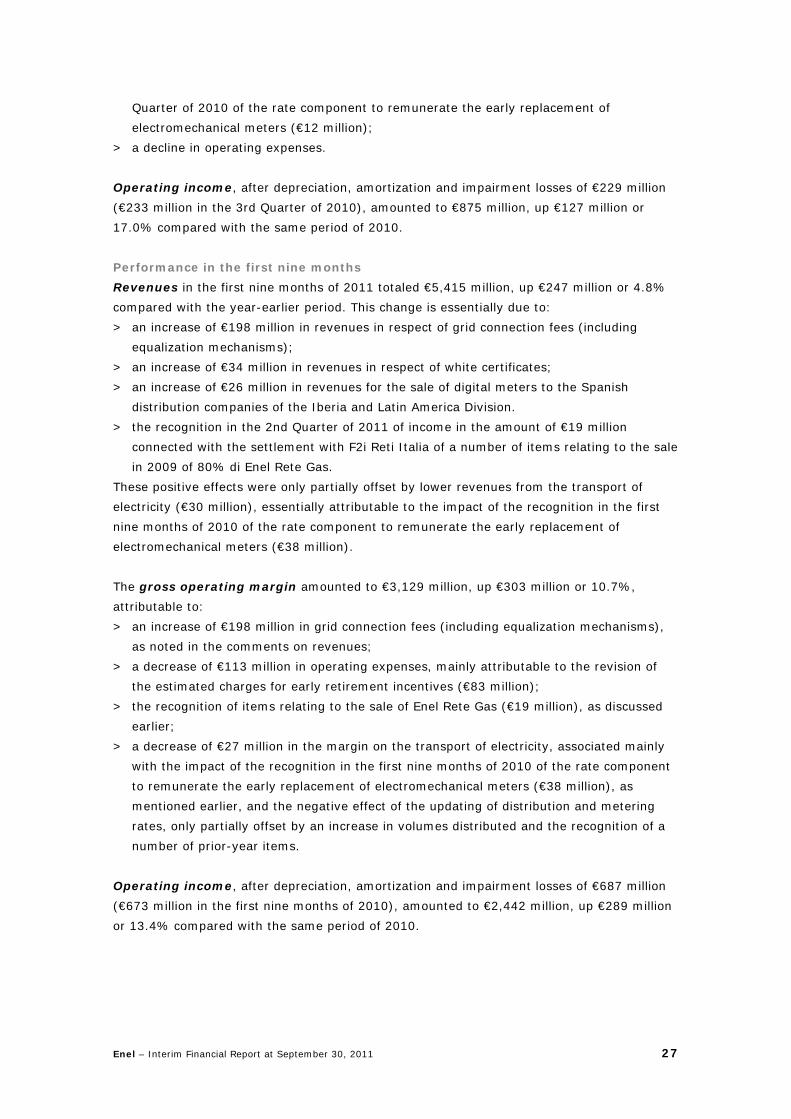
Performance in the 3rd Quarter
Revenues in the 3rd Quarter of 2011 totaled €1,821 million, up €67 million or 3.8%
compared with the year-earlier period. This change is essentially due to an increase of €62
million in revenues in respect of grid connection fees (including equalization mechanisms) as
well as an increase in revenues from the sale of digital meters to the Iberia and Latin
America Division, only partially offset by a decrease in revenues in respect of white
certificates.
The gross operating margin amounted to €1,104 million, up €123 million or 12.5%,
essentially attributable to:
> an increase of €62 million in grid connection fees (including equalization mechanisms), as
noted in the comments on revenues;
> an increase of €13 million in the margin on the transport of electricity, associated mainly
with the positive effect of the updating of distribution and metering rates, as well as a rise
in volumes distributed, only partially offset by the impact of the recognition in the 3rd
Enel – Interim Financial Report at September 30, 2011 27
Quarter of 2010 of the rate component to remunerate the early replacement of
electromechanical meters (€12 million);
> a decline in operating expenses.
Operating income, after depreciation, amortization and impairment losses of €229 million
(€233 million in the 3rd Quarter of 2010), amounted to €875 million, up €127 million or
17.0% compared with the same period of 2010.
Performance in the first nine months
Revenues in the first nine months of 2011 totaled €5,415 million, up €247 million or 4.8%
compared with the year-earlier period. This change is essentially due to:
> an increase of €198 million in revenues in respect of grid connection fees (including
equalization mechanisms);
> an increase of €34 million in revenues in respect of white certificates;
> an increase of €26 million in revenues for the sale of digital meters to the Spanish
distribution companies of the Iberia and Latin America Division.
> the recognition in the 2nd Quarter of 2011 of income in the amount of €19 million
connected with the settlement with F2i Reti Italia of a number of items relating to the sale
in 2009 of 80% di Enel Rete Gas.
These positive effects were only partially offset by lower revenues from the transport of
electricity (€30 million), essentially attributable to the impact of the recognition in the first
nine months of 2010 of the rate component to remunerate the early replacement of
electromechanical meters (€38 million).
The gross operating margin amounted to €3,129 million, up €303 million or 10.7%,
attributable to:
> an increase of €198 million in grid connection fees (including equalization mechanisms),
as noted in the comments on revenues;
> a decrease of €113 million in operating expenses, mainly attributable to the revision of
the estimated charges for early retirement incentives (€83 million);
> the recognition of items relating to the sale of Enel Rete Gas (€19 million), as discussed
earlier;
> a decrease of €27 million in the margin on the transport of electricity, associated mainly
with the impact of the recognition in the first nine months of 2010 of the rate component
to remunerate the early replacement of electromechanical meters (€38 million), as
mentioned earlier, and the negative effect of the updating of distribution and metering
rates, only partially offset by an increase in volumes distributed and the recognition of a
number of prior-year items.
Operating income, after depreciation, amortization and impairment losses of €687 million
(€673 million in the first nine months of 2010), amounted to €2,442 million, up €289 million
or 13.4% compared with the same period of 2010.
Enel – Interim Financial Report at September 30, 2011 28
Capital expenditure
Capital expenditure in the first nine months of 2011 totaled €934 million, up €150 million
on the year-earlier period. It mainly regarded the work done on the medium and high-
voltage grids for the connection of renewables plants.

Enel – Interim Financial Report at September 30, 2011 29
Iberia and Latin America
Operations
Net electricity generation
3rd Quarter Millions of kWh First nine months
2011 2010 Change 2011 2010 Change
19,979 17,749 2,230 12.6% Thermal 55,566 44,342 11,224 25.3%
7,176 7,462 (286) -3.8% Nuclear 18,480 20,278 (1,798) -8.9%
9,714 10,814 (1,100) -10.2% Hydroelectric 28,433 32,534 (4,101) -12.6%
30 32 (2) -6.3% Wind 98 597 (499) -83.6%
8 - 8 - Other resources 26 60 (34) -56.7%
36,907 36,057 850 2.4% Total net generation 102,603 97,811 4,792 4.9%
Net electricity generation in the first nine months of 2011 amounted to 102,603 million kWh
(36,907 million kWh in the 3rd Quarter of 2011), an increase of 4,792 million kWh compared
with the corresponding period of 2010 (up 850 million kWh in the 3rd Quarter of 2011).
In the first nine months of 2011, net power generation in Europe increased by 5,677 million
kWh (up 1,876 million kWh in the 3rd Quarter of 2011) essentially due to the increase in
thermal generation (up 44.8%), which more than offset the reduction in nuclear generation
due to the temporary shut-down of a number of plants (down 8.9%) and the decline in
hydroelectric generation owing to poorer water availability in the period.
Net generation in Latin America declined by 885 million kWh, mainly as a result of lower
hydroelectric generation (due to less favorable water availability in the period in all the Latin
American countries in which the Division operates, with the exception of Colombia and Peru),
partially offset by greater thermal generation in Argentina, Chile and Peru. A similar
development was registered in the 3rd Quarter of 2011 (with a decrease of 1,026 million
kWh) due largely to the decline in generation in Brazil, Colombia and Argentina.
Enel – Interim Financial Report at September 30, 2011 30
Contribution to gross thermal generation
3rd Quarter Millions of kWh First nine months
2011 2010 Change 2011 2010 Change
2,518 8.9% 2,433 9.3% 85 3.5%High-sulfur fuel oil (S>0.25%) 7,118 9.2% 6,615 9.8% 503 7.6%
- - 243 0.9% (243) -100.0%Low-sulfur fuel oil (S<0.25%) - - 569 0.8% (569) -100.0%
2,518 8.9% 2,676 10.2% (158) -5.9% Total fuel oil 7,118 9.2% 7,184 10.6% (66) -0.9%
6,797 24.0% 6,306 24.1% 491 7.8% Natural gas 22,880 29.6% 19,460 28.9% 3,420 17.6%
9,235 32.6% 6,343 24.3% 2,892 45.6% Coal 22,413 29.0% 13,395 19.9% 9,018 67.3%
7,514 26.6% 7,811 29.9% (297) -3.8% Nuclear fuel 19,301 25.0% 21,168 31.4% (1,867) -8.8%
2,245 7.9% 2,995 11.5% (750) -25.0% Other fuels 5,509 7.2% 6,166 9.2% (657) -10.7%
28,309 100.0% 26,131 100.0% 2,178 8.3% Total 77,221 100.0% 67,373 100.0% 9,848 14.6%
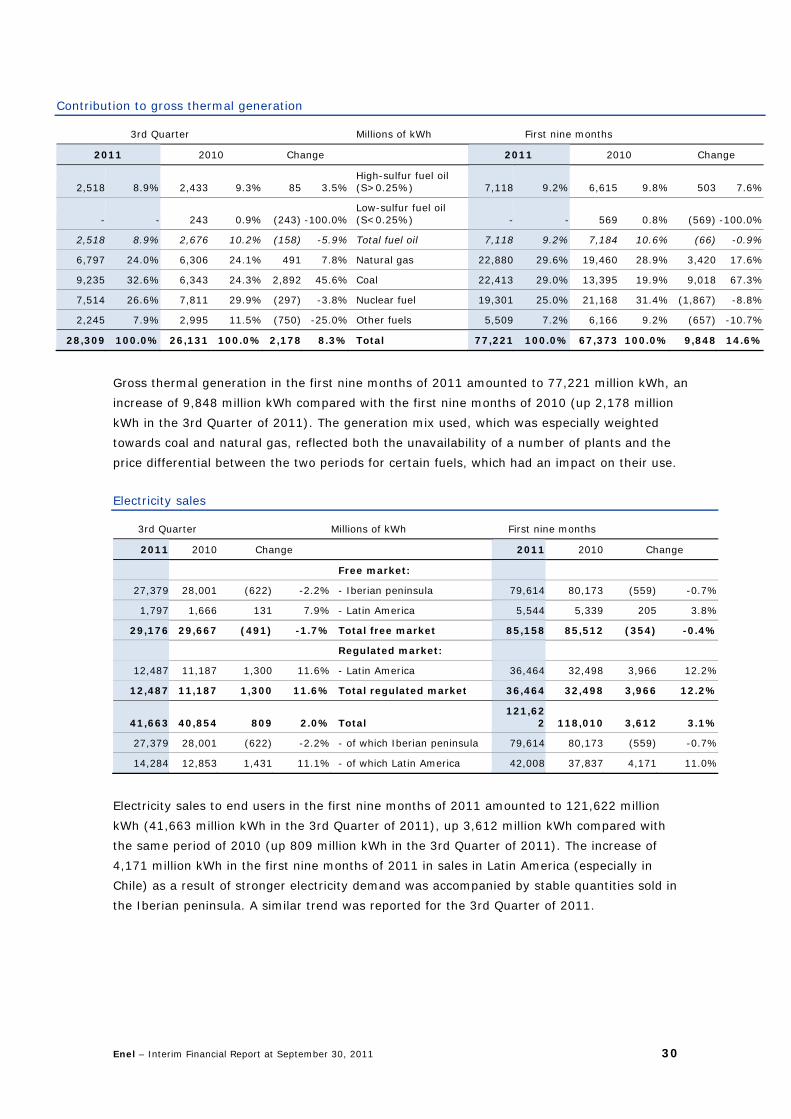
Gross thermal generation in the first nine months of 2011 amounted to 77,221 million kWh, an
increase of 9,848 million kWh compared with the first nine months of 2010 (up 2,178 million
kWh in the 3rd Quarter of 2011). The generation mix used, which was especially weighted
towards coal and natural gas, reflected both the unavailability of a number of plants and the
price differential between the two periods for certain fuels, which had an impact on their use.
Electricity sales
3rd Quarter Millions of kWh First nine months
2011 2010 Change 2011 2010 Change
Free market:
27,379 28,001 (622) -2.2% - Iberian peninsula 79,614 80,173 (559) -0.7%
1,797 1,666 131 7.9% - Latin America 5,544 5,339 205 3.8%
29,176 29,667 (491) -1.7% Total free market 85,158 85,512 (354) -0.4%
Regulated market:
12,487 11,187 1,300 11.6% - Latin America 36,464 32,498 3,966 12.2%
12,487 11,187 1,300 11.6% Total regulated market 36,464 32,498 3,966 12.2%
41,663 40,854 809 2.0% Total 121,62
2 118,010 3,612 3.1%
27,379 28,001 (622) -2.2% - of which Iberian peninsula 79,614 80,173 (559) -0.7%
14,284 12,853 1,431 11.1% - of which Latin America 42,008 37,837 4,171 11.0%
Electricity sales to end users in the first nine months of 2011 amounted to 121,622 million
kWh (41,663 million kWh in the 3rd Quarter of 2011), up 3,612 million kWh compared with
the same period of 2010 (up 809 million kWh in the 3rd Quarter of 2011). The increase of
4,171 million kWh in the first nine months of 2011 in sales in Latin America (especially in
Chile) as a result of stronger electricity demand was accompanied by stable quantities sold in
the Iberian peninsula. A similar trend was reported for the 3rd Quarter of 2011.

Enel – Interim Financial Report at September 30, 2011 31
Performance
3rd Quarter Millions of euro First nine months
2011 2010 Change 2011 2010 Change
8,185 7,803 382 Revenues 24,029 22,646 1,383
9 (11) 20Net income/(charges) from commodity risk management 1 15 (14)
1,951 1,983 (32) Gross operating margin 5,562 6,030 (468)
1,253 1,170 83 Operating income 3,450 3,748 (298)
Employees at period-end (no.) (1) 23,004 24,731 (2) (1,727)
Capital expenditure (3) 1,425 1,386 39
(1) Includes 109 in units classified as “Held for sale” at September 30, 2011 (1,809 at December 31, 2010). (2) At December 31, 2010. (3) The figure for the first nine months of 2011 does not include €82 million in capital expenditure regarding units
classified as “Held for sale”.
Performance in the 3rd Quarter
The table below shows performance by geographical area.
Millions of euro Revenues Gross operating margin Operating income
2011 2010 Change 2011 2010 Change 2011 2010 Change
Europe 5,619 5,158 461 1,062 1,110 (48) 644 588 56
Latin America 2,566 2,645 (79) 889 873 16 609 582 27
Total 8,185 7,803 382 1,951 1,983 (32) 1,253 1,170 83
Revenues in the 3rd Quarter of 2011 rose by €382 million as a result of:
> a €461 million increase in revenues in Europe, essentially due to increased revenues
from electricity generation, partially offset by the decline in revenues from distribution
operations following the sale of the power transmission networks in Spain;
> a €79 million decrease in revenues in Latin America due to lower quantities of electricity
generated in nearly all the Latin American countries.
The gross operating margin amounted to €1,951 million, down €32 million or 1.6% from
the same period of 2010, as a result of:
> a decrease of €48 million in the gross operating margin in Europe, essentially due to the
decline in the electricity margin (€89 million) as well as the negative impact (€59 million)
of the change in the scope of consolidation attributable to the power transmission grid
and the natural gas distribution network in Spain and the transfer of Enel Green Power
España to the Renewable Energy Division. These effects were partially offset by an
increase in the margin on the distribution and sale of electricity;
> an increase of €16 million in the gross operating margin in Latin America, due mainly to
the increase in the electricity margin (€63 million), partially offset by the adverse impact
of the appreciation of the euro against the main Latin American currencies (€52 million).
Enel – Interim Financial Report at September 30, 2011 32
Operating income in the 3rd Quarter of 2011, after depreciation, amortization and
impairment losses of €698 million (€813 million in the 3rd Quarter of 2010), amounted to
€1,253 million, an increase of €83 million compared with the same period of 2010.
Performance in the first nine months
The table below shows performance by geographical area.
Millions of euro Revenues Gross operating margin Operating income
2011 2010 Change 2011 2010 Change 2011 2010 Change
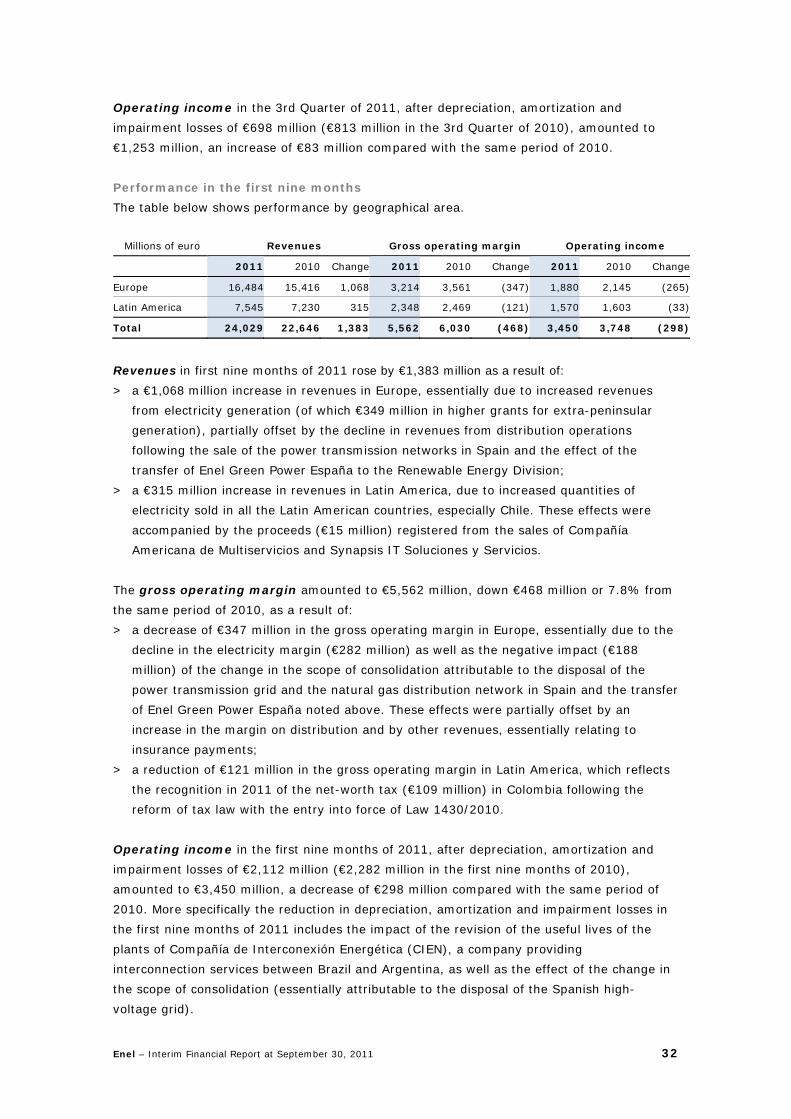
Europe 16,484 15,416 1,068 3,214 3,561 (347) 1,880 2,145 (265)
Latin America 7,545 7,230 315 2,348 2,469 (121) 1,570 1,603 (33)
Total 24,029 22,646 1,383 5,562 6,030 (468) 3,450 3,748 (298)
Revenues in first nine months of 2011 rose by €1,383 million as a result of:
> a €1,068 million increase in revenues in Europe, essentially due to increased revenues
from electricity generation (of which €349 million in higher grants for extra-peninsular
generation), partially offset by the decline in revenues from distribution operations
following the sale of the power transmission networks in Spain and the effect of the
transfer of Enel Green Power España to the Renewable Energy Division;
> a €315 million increase in revenues in Latin America, due to increased quantities of
electricity sold in all the Latin American countries, especially Chile. These effects were
accompanied by the proceeds (€15 million) registered from the sales of Compañía
Americana de Multiservicios and Synapsis IT Soluciones y Servicios.
The gross operating margin amounted to €5,562 million, down €468 million or 7.8% from
the same period of 2010, as a result of:
> a decrease of €347 million in the gross operating margin in Europe, essentially due to the
decline in the electricity margin (€282 million) as well as the negative impact (€188
million) of the change in the scope of consolidation attributable to the disposal of the
power transmission grid and the natural gas distribution network in Spain and the transfer
of Enel Green Power España noted above. These effects were partially offset by an
increase in the margin on distribution and by other revenues, essentially relating to
insurance payments;
> a reduction of €121 million in the gross operating margin in Latin America, which reflects
the recognition in 2011 of the net-worth tax (€109 million) in Colombia following the
reform of tax law with the entry into force of Law 1430/2010.
Operating income in the first nine months of 2011, after depreciation, amortization and
impairment losses of €2,112 million (€2,282 million in the first nine months of 2010),
amounted to €3,450 million, a decrease of €298 million compared with the same period of
2010. More specifically the reduction in depreciation, amortization and impairment losses in
the first nine months of 2011 includes the impact of the revision of the useful lives of the
plants of Compañía de Interconexión Energética (CIEN), a company providing
interconnection services between Brazil and Argentina, as well as the effect of the change in
the scope of consolidation (essentially attributable to the disposal of the Spanish high-
voltage grid).
Enel – Interim Financial Report at September 30, 2011 33
Capital expenditure
Capital expenditure totaled €1,425 million, up €39 million compared with the same period
of the previous year. In particular, capital expenditure in the first nine months of 2011
concerned work on generation plants, including: in Spain and Portugal, the construction of
combined-cycle plants (Besos and Granadilla 2), maintenance at the Asco and Vandellos
nuclear plants, and the expansion of generation capacity of the Almaraz nuclear power plant;
in Latin America, among other projects, the construction of the coal-fired Bocamina II plant
and the El Quimbo hydroelectric plant in Colombia.
Enel – Interim Financial Report at September 30, 2011 34
International
Operations
Net electricity generation
3rd Quarter Millions of kWh First nine months
2011 2010 Change 2011 2010 Change
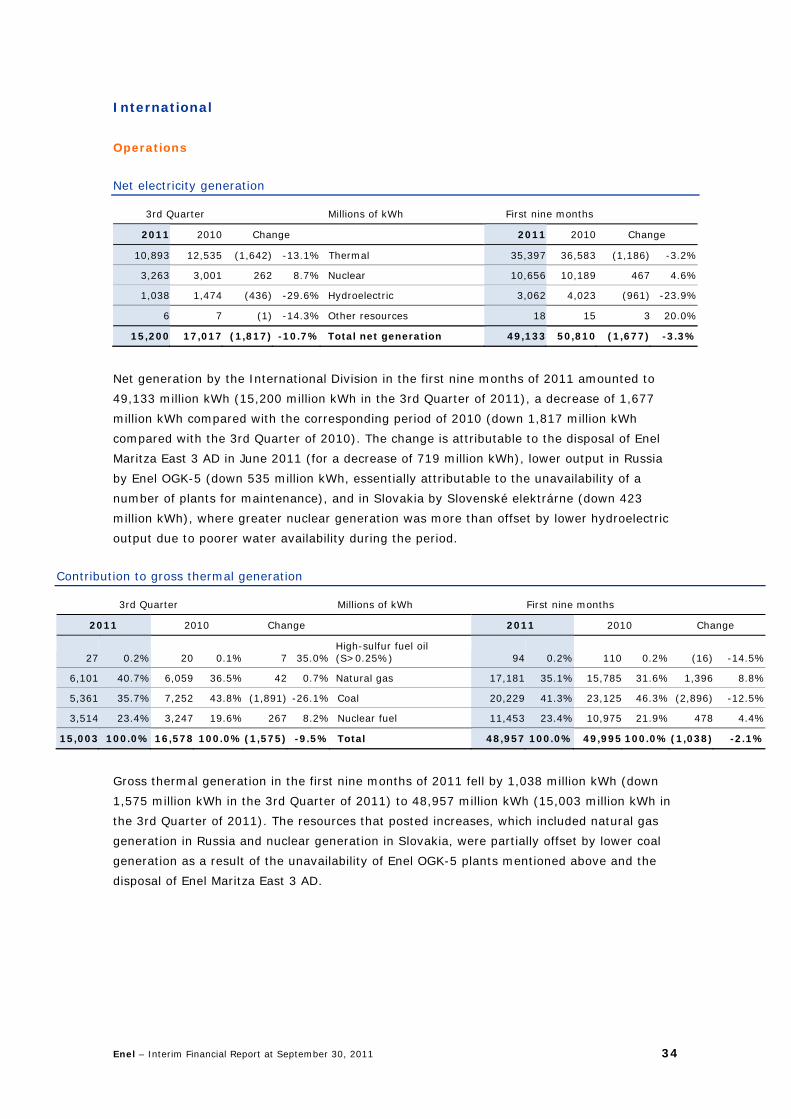
10,893 12,535 (1,642) -13.1% Thermal 35,397 36,583 (1,186) -3.2%
3,263 3,001 262 8.7% Nuclear 10,656 10,189 467 4.6%
1,038 1,474 (436) -29.6% Hydroelectric 3,062 4,023 (961) -23.9%
6 7 (1) -14.3% Other resources 18 15 3 20.0%
15,200 17,017 (1,817) -10.7% Total net generation 49,133 50,810 (1,677) -3.3%
Net generation by the International Division in the first nine months of 2011 amounted to
49,133 million kWh (15,200 million kWh in the 3rd Quarter of 2011), a decrease of 1,677
million kWh compared with the corresponding period of 2010 (down 1,817 million kWh
compared with the 3rd Quarter of 2010). The change is attributable to the disposal of Enel
Maritza East 3 AD in June 2011 (for a decrease of 719 million kWh), lower output in Russia
by Enel OGK-5 (down 535 million kWh, essentially attributable to the unavailability of a
number of plants for maintenance), and in Slovakia by Slovenské elektrárne (down 423
million kWh), where greater nuclear generation was more than offset by lower hydroelectric
output due to poorer water availability during the period.
Contribution to gross thermal generation
3rd Quarter Millions of kWh First nine months
2011 2010 Change 2011 2010 Change
27 0.2% 20 0.1% 7 35.0%High-sulfur fuel oil (S>0.25%) 94 0.2% 110 0.2% (16) -14.5%
6,101 40.7% 6,059 36.5% 42 0.7% Natural gas 17,181 35.1% 15,785 31.6% 1,396 8.8%
5,361 35.7% 7,252 43.8% (1,891) -26.1% Coal 20,229 41.3% 23,125 46.3% (2,896) -12.5%
3,514 23.4% 3,247 19.6% 267 8.2% Nuclear fuel 11,453 23.4% 10,975 21.9% 478 4.4%
15,003 100.0% 16,578 100.0%(1,575) -9.5% Total 48,957 100.0% 49,995 100.0%(1,038) -2.1%
Gross thermal generation in the first nine months of 2011 fell by 1,038 million kWh (down
1,575 million kWh in the 3rd Quarter of 2011) to 48,957 million kWh (15,003 million kWh in
the 3rd Quarter of 2011). The resources that posted increases, which included natural gas
generation in Russia and nuclear generation in Slovakia, were partially offset by lower coal
generation as a result of the unavailability of Enel OGK-5 plants mentioned above and the
disposal of Enel Maritza East 3 AD.
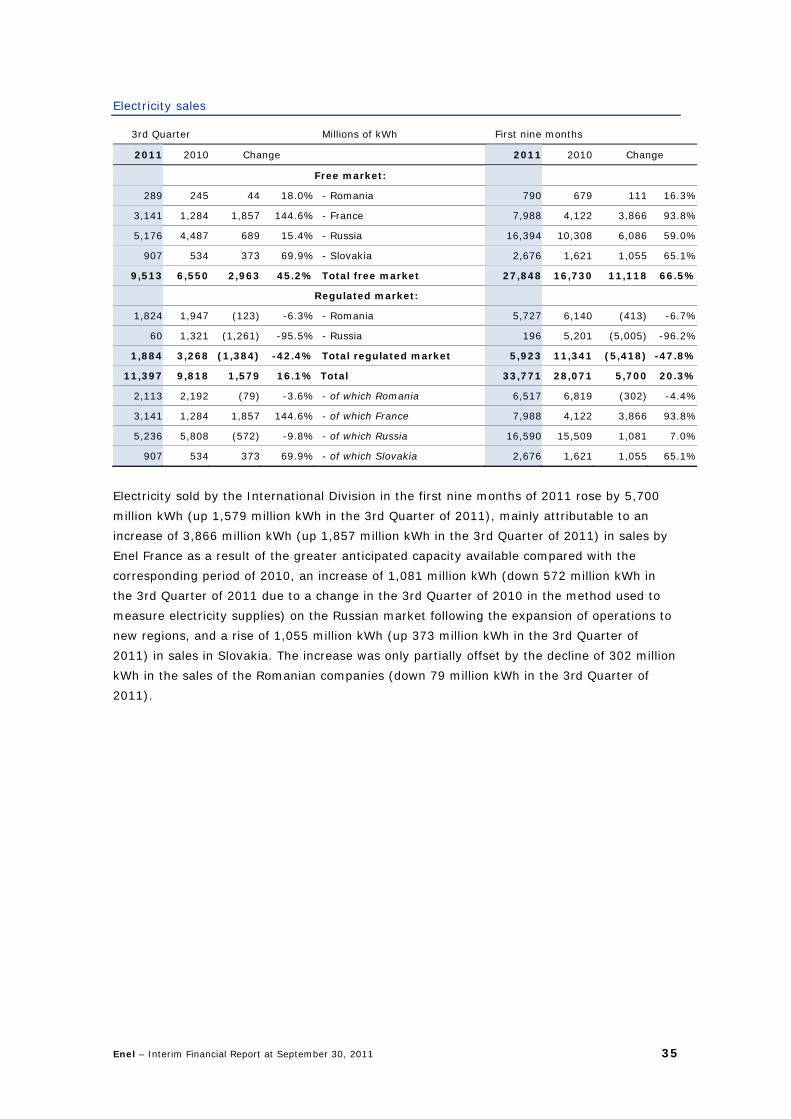
Enel – Interim Financial Report at September 30, 2011 35
Electricity sales
3rd Quarter Millions of kWh First nine months
2011 2010 Change 2011 2010 Change
Free market:
289 245 44 18.0% - Romania 790 679 111 16.3%
3,141 1,284 1,857 144.6% - France 7,988 4,122 3,866 93.8%
5,176 4,487 689 15.4% - Russia 16,394 10,308 6,086 59.0%
907 534 373 69.9% - Slovakia 2,676 1,621 1,055 65.1%
9,513 6,550 2,963 45.2% Total free market 27,848 16,730 11,118 66.5%
Regulated market:
1,824 1,947 (123) -6.3% - Romania 5,727 6,140 (413) -6.7%
60 1,321 (1,261) -95.5% - Russia 196 5,201 (5,005) -96.2%
1,884 3,268 (1,384) -42.4% Total regulated market 5,923 11,341 (5,418) -47.8%
11,397 9,818 1,579 16.1% Total 33,771 28,071 5,700 20.3%
2,113 2,192 (79) -3.6% - of which Romania 6,517 6,819 (302) -4.4%
3,141 1,284 1,857 144.6% - of which France 7,988 4,122 3,866 93.8%
5,236 5,808 (572) -9.8% - of which Russia 16,590 15,509 1,081 7.0%
907 534 373 69.9% - of which Slovakia 2,676 1,621 1,055 65.1%
Electricity sold by the International Division in the first nine months of 2011 rose by 5,700
million kWh (up 1,579 million kWh in the 3rd Quarter of 2011), mainly attributable to an
increase of 3,866 million kWh (up 1,857 million kWh in the 3rd Quarter of 2011) in sales by
Enel France as a result of the greater anticipated capacity available compared with the
corresponding period of 2010, an increase of 1,081 million kWh (down 572 million kWh in
the 3rd Quarter of 2011 due to a change in the 3rd Quarter of 2010 in the method used to
measure electricity supplies) on the Russian market following the expansion of operations to
new regions, and a rise of 1,055 million kWh (up 373 million kWh in the 3rd Quarter of
2011) in sales in Slovakia. The increase was only partially offset by the decline of 302 million
kWh in the sales of the Romanian companies (down 79 million kWh in the 3rd Quarter of
2011).
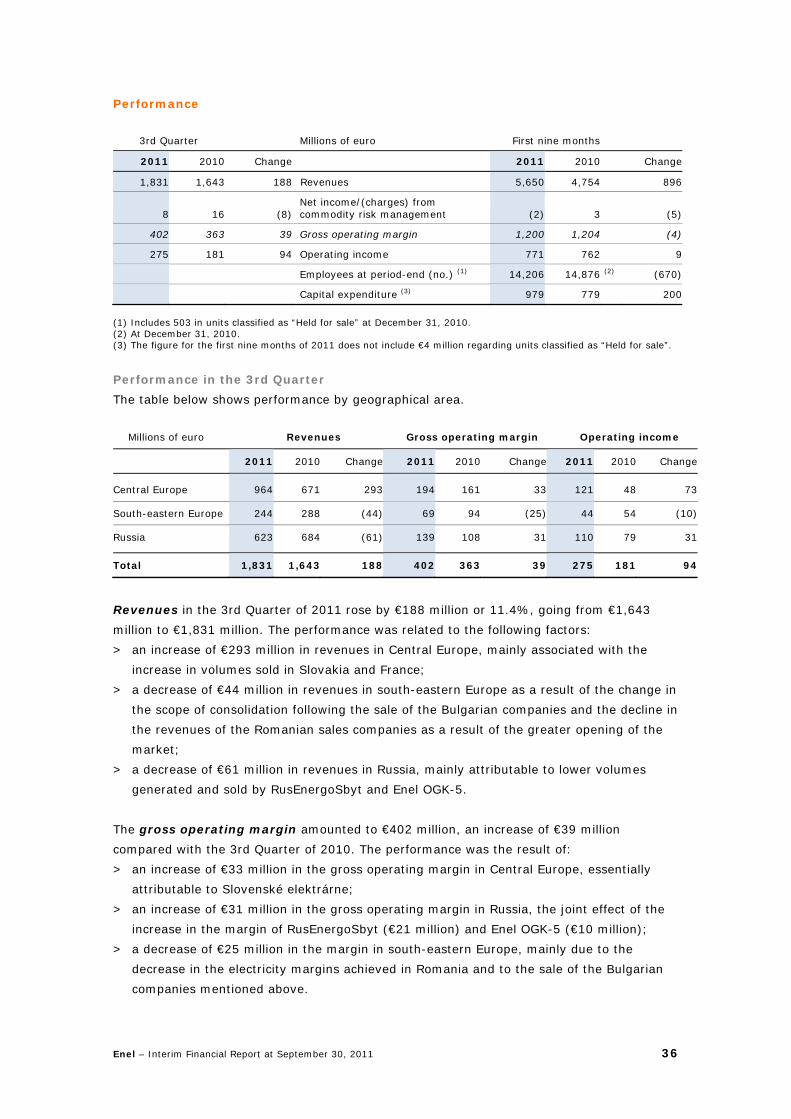
Enel – Interim Financial Report at September 30, 2011 36
Performance
3rd Quarter Millions of euro First nine months
2011 2010 Change 2011 2010 Change
1,831 1,643 188 Revenues 5,650 4,754 896
8 16 (8)Net income/(charges) from commodity risk management (2) 3 (5)
402 363 39 Gross operating margin 1,200 1,204 (4)
275 181 94 Operating income 771 762 9
Employees at period-end (no.) (1) 14,206 14,876 (2) (670)
Capital expenditure (3) 979 779 200
(1) Includes 503 in units classified as “Held for sale” at December 31, 2010. (2) At December 31, 2010. (3) The figure for the first nine months of 2011 does not include €4 million regarding units classified as “Held for sale”.
Performance in the 3rd Quarter
The table below shows performance by geographical area.
Millions of euro Revenues Gross operating margin Operating income
2011 2010 Change 2011 2010 Change 2011 2010 Change
Central Europe 964 671 293 194 161 33 121 48 73
South-eastern Europe 244 288 (44) 69 94 (25) 44 54 (10)
Russia 623 684 (61) 139 108 31 110 79 31
Total 1,831 1,643 188 402 363 39 275 181 94
Revenues in the 3rd Quarter of 2011 rose by €188 million or 11.4%, going from €1,643
million to €1,831 million. The performance was related to the following factors:
> an increase of €293 million in revenues in Central Europe, mainly associated with the
increase in volumes sold in Slovakia and France;
> a decrease of €44 million in revenues in south-eastern Europe as a result of the change in
the scope of consolidation following the sale of the Bulgarian companies and the decline in
the revenues of the Romanian sales companies as a result of the greater opening of the
market;
> a decrease of €61 million in revenues in Russia, mainly attributable to lower volumes
generated and sold by RusEnergoSbyt and Enel OGK-5.
The gross operating margin amounted to €402 million, an increase of €39 million
compared with the 3rd Quarter of 2010. The performance was the result of:
> an increase of €33 million in the gross operating margin in Central Europe, essentially
attributable to Slovenské elektrárne;
> an increase of €31 million in the gross operating margin in Russia, the joint effect of the
increase in the margin of RusEnergoSbyt (€21 million) and Enel OGK-5 (€10 million);
> a decrease of €25 million in the margin in south-eastern Europe, mainly due to the
decrease in the electricity margins achieved in Romania and to the sale of the Bulgarian
companies mentioned above.
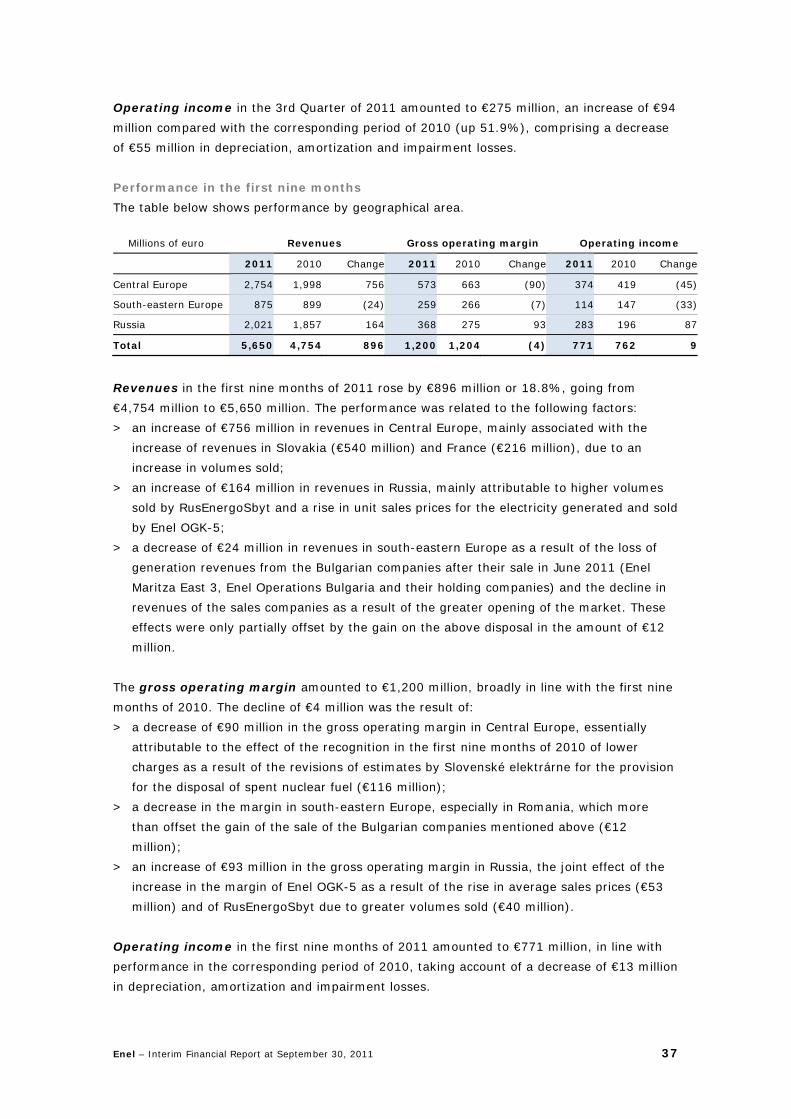
Enel – Interim Financial Report at September 30, 2011 37
Operating income in the 3rd Quarter of 2011 amounted to €275 million, an increase of €94
million compared with the corresponding period of 2010 (up 51.9%), comprising a decrease
of €55 million in depreciation, amortization and impairment losses.
Performance in the first nine months
The table below shows performance by geographical area.
Millions of euro Revenues Gross operating margin Operating income
2011 2010 Change 2011 2010 Change 2011 2010 Change
Central Europe 2,754 1,998 756 573 663 (90) 374 419 (45)
South-eastern Europe 875 899 (24) 259 266 (7) 114 147 (33)
Russia 2,021 1,857 164 368 275 93 283 196 87
Total 5,650 4,754 896 1,200 1,204 (4) 771 762 9
Revenues in the first nine months of 2011 rose by €896 million or 18.8%, going from
€4,754 million to €5,650 million. The performance was related to the following factors:
> an increase of €756 million in revenues in Central Europe, mainly associated with the
increase of revenues in Slovakia (€540 million) and France (€216 million), due to an
increase in volumes sold;
> an increase of €164 million in revenues in Russia, mainly attributable to higher volumes
sold by RusEnergoSbyt and a rise in unit sales prices for the electricity generated and sold
by Enel OGK-5;
> a decrease of €24 million in revenues in south-eastern Europe as a result of the loss of
generation revenues from the Bulgarian companies after their sale in June 2011 (Enel
Maritza East 3, Enel Operations Bulgaria and their holding companies) and the decline in
revenues of the sales companies as a result of the greater opening of the market. These
effects were only partially offset by the gain on the above disposal in the amount of €12
million.
The gross operating margin amounted to €1,200 million, broadly in line with the first nine
months of 2010. The decline of €4 million was the result of:
> a decrease of €90 million in the gross operating margin in Central Europe, essentially
attributable to the effect of the recognition in the first nine months of 2010 of lower
charges as a result of the revisions of estimates by Slovenské elektrárne for the provision
for the disposal of spent nuclear fuel (€116 million);
> a decrease in the margin in south-eastern Europe, especially in Romania, which more
than offset the gain of the sale of the Bulgarian companies mentioned above (€12
million);
> an increase of €93 million in the gross operating margin in Russia, the joint effect of the
increase in the margin of Enel OGK-5 as a result of the rise in average sales prices (€53
million) and of RusEnergoSbyt due to greater volumes sold (€40 million).
Operating income in the first nine months of 2011 amounted to €771 million, in line with
performance in the corresponding period of 2010, taking account of a decrease of €13 million
in depreciation, amortization and impairment losses.
Enel – Interim Financial Report at September 30, 2011 38
Capital expenditure
Capital expenditure came to €979 million, up €200 million from the same period of the
previous year. The change in essentially attributable to greater capital expenditure on
nuclear generation plants (associated with Slovenské elektrárne), partially offset by lower
capital expenditure on thermal plants.
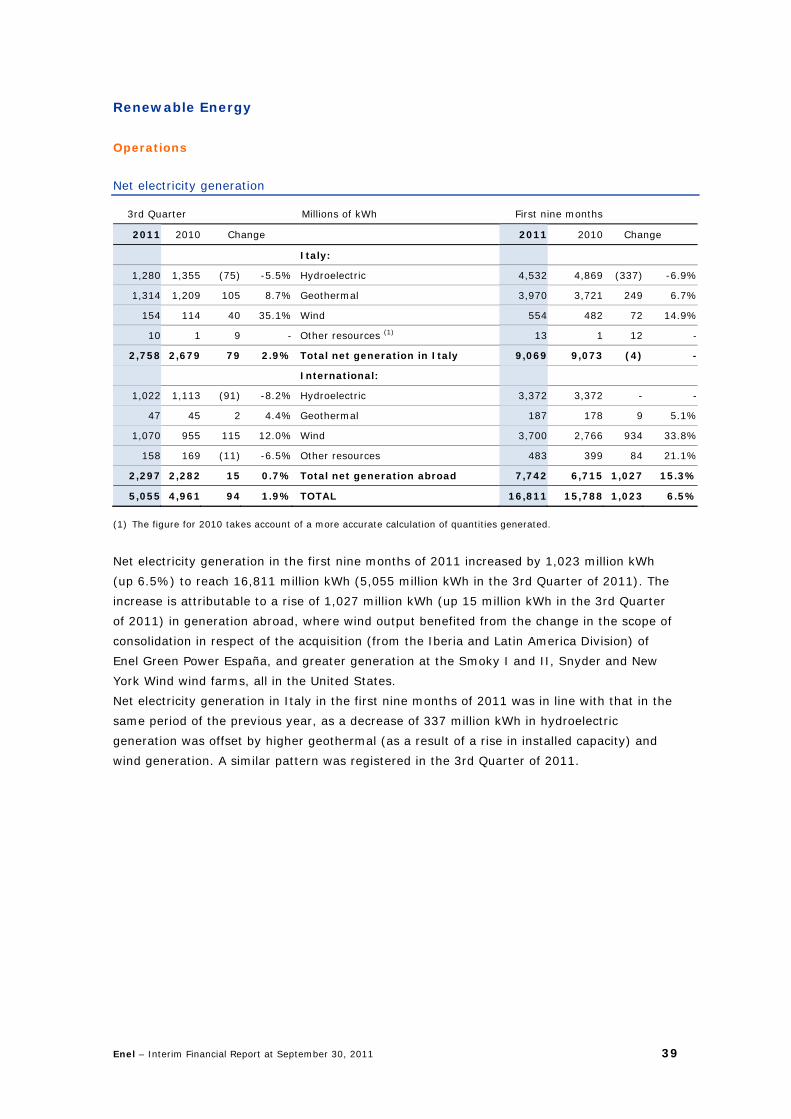
Enel – Interim Financial Report at September 30, 2011 39
Renewable Energy
Operations
Net electricity generation
3rd Quarter Millions of kWh First nine months
2011 2010 Change 2011 2010 Change
Italy:
1,280 1,355 (75) -5.5% Hydroelectric 4,532 4,869 (337) -6.9%
1,314 1,209 105 8.7% Geothermal 3,970 3,721 249 6.7%
154 114 40 35.1% Wind 554 482 72 14.9%
10 1 9 - Other resources (1) 13 1 12 -
2,758 2,679 79 2.9% Total net generation in Italy 9,069 9,073 (4) -
International:
1,022 1,113 (91) -8.2% Hydroelectric 3,372 3,372 - -
47 45 2 4.4% Geothermal 187 178 9 5.1%
1,070 955 115 12.0% Wind 3,700 2,766 934 33.8%
158 169 (11) -6.5% Other resources 483 399 84 21.1%
2,297 2,282 15 0.7% Total net generation abroad 7,742 6,715 1,027 15.3%
5,055 4,961 94 1.9% TOTAL 16,811 15,788 1,023 6.5%
(1) The figure for 2010 takes account of a more accurate calculation of quantities generated.
Net electricity generation in the first nine months of 2011 increased by 1,023 million kWh
(up 6.5%) to reach 16,811 million kWh (5,055 million kWh in the 3rd Quarter of 2011). The
increase is attributable to a rise of 1,027 million kWh (up 15 million kWh in the 3rd Quarter
of 2011) in generation abroad, where wind output benefited from the change in the scope of
consolidation in respect of the acquisition (from the Iberia and Latin America Division) of
Enel Green Power España, and greater generation at the Smoky I and II, Snyder and New
York Wind wind farms, all in the United States.
Net electricity generation in Italy in the first nine months of 2011 was in line with that in the
same period of the previous year, as a decrease of 337 million kWh in hydroelectric
generation was offset by higher geothermal (as a result of a rise in installed capacity) and
wind generation. A similar pattern was registered in the 3rd Quarter of 2011.
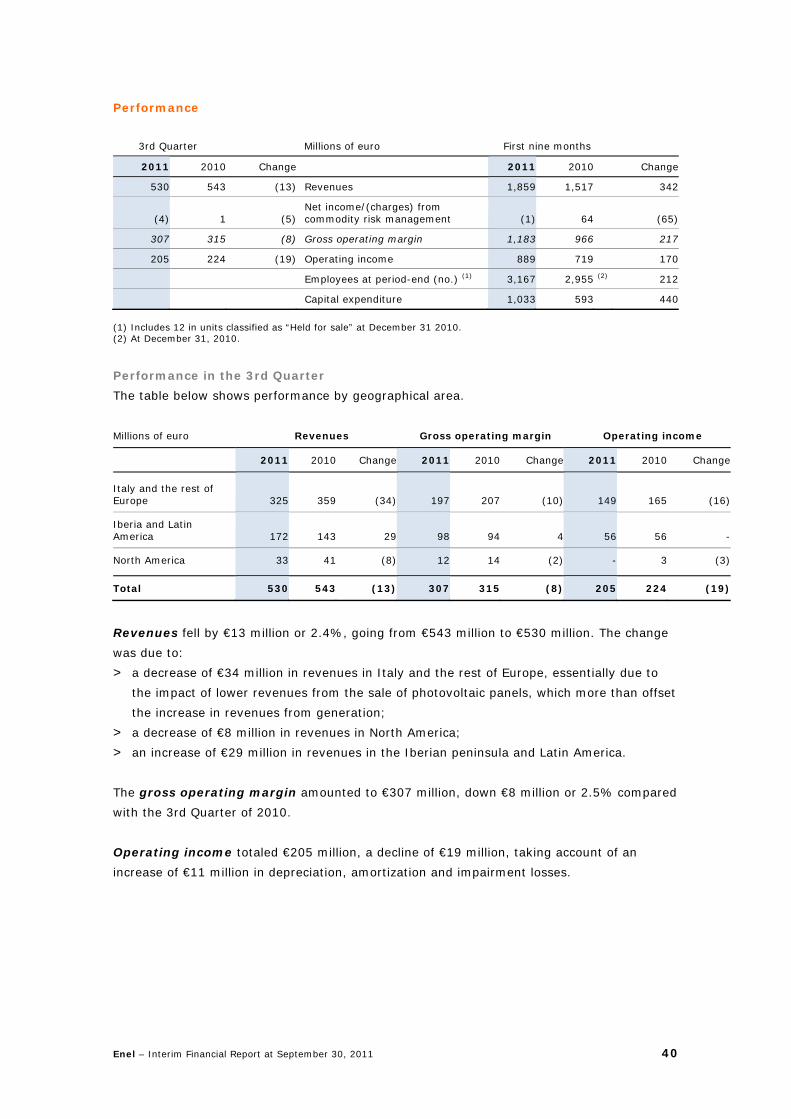
Enel – Interim Financial Report at September 30, 2011 40
Performance
3rd Quarter Millions of euro First nine months
2011 2010 Change 2011 2010 Change
530 543 (13) Revenues 1,859 1,517 342
(4) 1 (5) Net income/(charges) from commodity risk management (1) 64 (65)
307 315 (8) Gross operating margin 1,183 966 217
205 224 (19) Operating income 889 719 170
Employees at period-end (no.) (1) 3,167 2,955 (2) 212
Capital expenditure 1,033 593 440
(1) Includes 12 in units classified as “Held for sale” at December 31 2010. (2) At December 31, 2010.
Performance in the 3rd Quarter
The table below shows performance by geographical area.
Millions of euro Revenues Gross operating margin Operating income
2011 2010 Change 2011 2010 Change 2011 2010 Change
Italy and the rest of Europe 325 359 (34) 197 207 (10) 149 165 (16)
Iberia and Latin America 172 143 29 98 94 4 56 56 -
North America 33 41 (8) 12 14 (2) - 3 (3)
Total 530 543 (13) 307 315 (8) 205 224 (19)
Revenues fell by €13 million or 2.4%, going from €543 million to €530 million. The change
was due to:
> a decrease of €34 million in revenues in Italy and the rest of Europe, essentially due to
the impact of lower revenues from the sale of photovoltaic panels, which more than offset
the increase in revenues from generation;
> a decrease of €8 million in revenues in North America;
> an increase of €29 million in revenues in the Iberian peninsula and Latin America.
The gross operating margin amounted to €307 million, down €8 million or 2.5% compared
with the 3rd Quarter of 2010.
Operating income totaled €205 million, a decline of €19 million, taking account of an
increase of €11 million in depreciation, amortization and impairment losses.
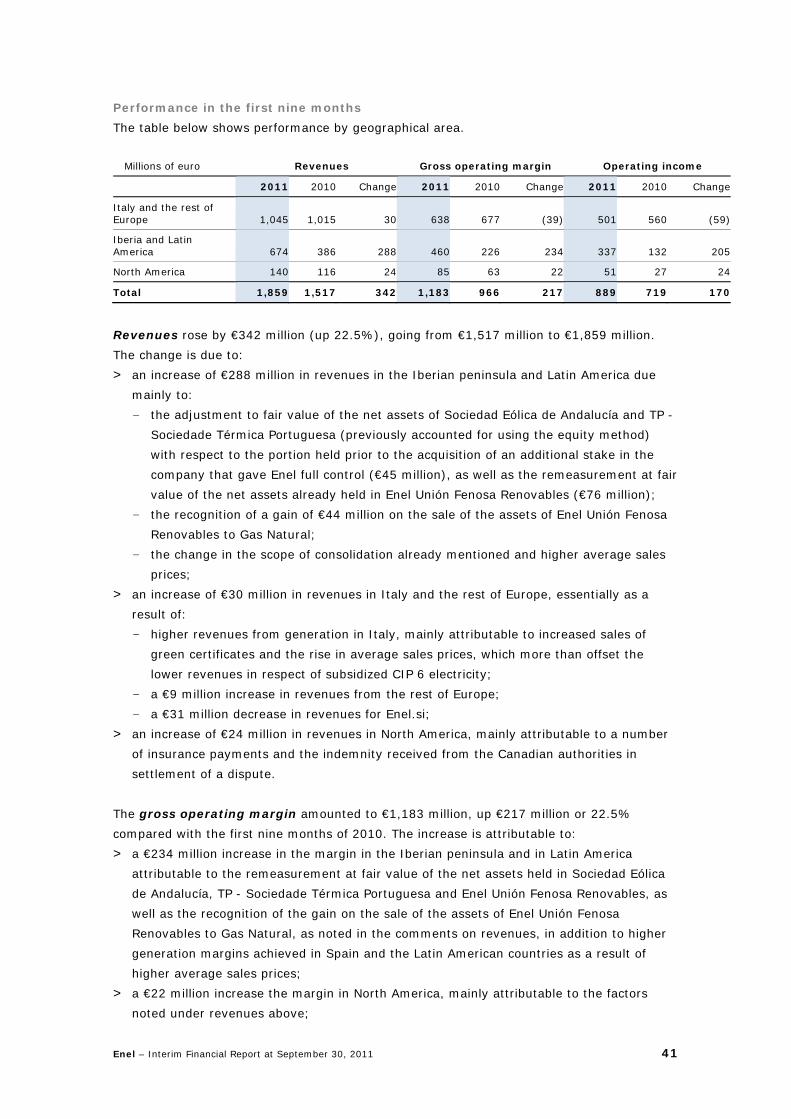
Enel – Interim Financial Report at September 30, 2011 41
Performance in the first nine months
The table below shows performance by geographical area.
Millions of euro Revenues Gross operating margin Operating income
2011 2010 Change 2011 2010 Change 2011 2010 Change
Italy and the rest of Europe 1,045 1,015 30 638 677 (39) 501 560 (59)
Iberia and Latin America 674 386 288 460 226 234 337 132 205
North America 140 116 24 85 63 22 51 27 24
Total 1,859 1,517 342 1,183 966 217 889 719 170
Revenues rose by €342 million (up 22.5%), going from €1,517 million to €1,859 million.
The change is due to:
> an increase of €288 million in revenues in the Iberian peninsula and Latin America due
mainly to:
- the adjustment to fair value of the net assets of Sociedad Eólica de Andalucía and TP -
Sociedade Térmica Portuguesa (previously accounted for using the equity method)
with respect to the portion held prior to the acquisition of an additional stake in the
company that gave Enel full control (€45 million), as well as the remeasurement at fair
value of the net assets already held in Enel Unión Fenosa Renovables (€76 million);
- the recognition of a gain of €44 million on the sale of the assets of Enel Unión Fenosa
Renovables to Gas Natural;
- the change in the scope of consolidation already mentioned and higher average sales
prices;
> an increase of €30 million in revenues in Italy and the rest of Europe, essentially as a
result of:
- higher revenues from generation in Italy, mainly attributable to increased sales of
green certificates and the rise in average sales prices, which more than offset the
lower revenues in respect of subsidized CIP 6 electricity;
- a €9 million increase in revenues from the rest of Europe;
- a €31 million decrease in revenues for Enel.si;
> an increase of €24 million in revenues in North America, mainly attributable to a number
of insurance payments and the indemnity received from the Canadian authorities in
settlement of a dispute.
The gross operating margin amounted to €1,183 million, up €217 million or 22.5%
compared with the first nine months of 2010. The increase is attributable to:
> a €234 million increase in the margin in the Iberian peninsula and in Latin America
attributable to the remeasurement at fair value of the net assets held in Sociedad Eólica
de Andalucía, TP - Sociedade Térmica Portuguesa and Enel Unión Fenosa Renovables, as
well as the recognition of the gain on the sale of the assets of Enel Unión Fenosa
Renovables to Gas Natural, as noted in the comments on revenues, in addition to higher
generation margins achieved in Spain and the Latin American countries as a result of
higher average sales prices;
> a €22 million increase the margin in North America, mainly attributable to the factors
noted under revenues above;
Enel – Interim Financial Report at September 30, 2011 42
> a €39 million reduction in the margin achieved in Italy and the rest of Europe, due
mainly to lower revenues from subsidized CIP 6 electricity and an increase in costs for
personnel and services, partly associated with the expansion in installed capacity.
Operating income totaled €889 million, an increase of €170 million, despite an increase of
€47 million in depreciation, amortization and impairment losses, essentially attributable to
the change in the scope of consolidation.
Capital expenditure
Capital expenditure in the first nine months of 2011 totaled €1,033 million, up €440
million compared with the same period of the previous year. Investments in the period
mainly regarded wind plants in Italy and Europe, Iberia and North America (€668 million),
solar plants in Italy, Greece and North America (€174 million), hydroelectric plants in Italy,
Guatemala, Costa Rica and North America (€93 million) and geothermal plants in Italy and
Chile (€58 million).
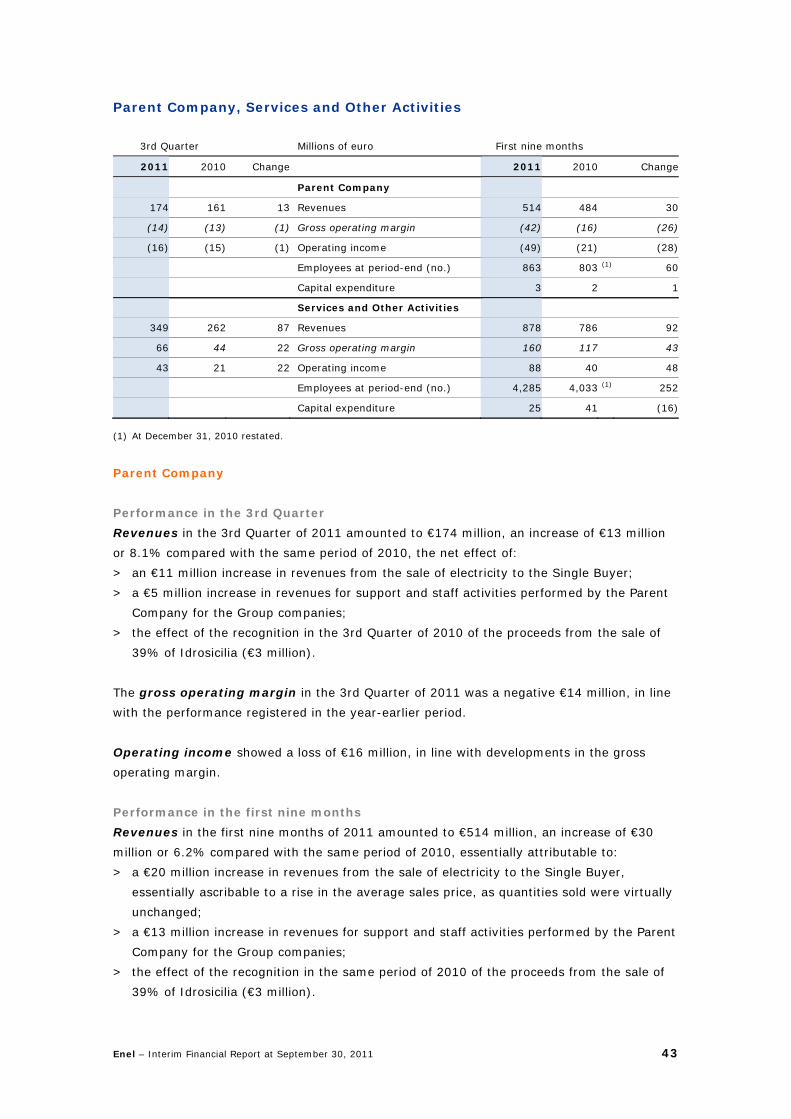
Enel – Interim Financial Report at September 30, 2011 43
Parent Company, Services and Other Activities
3rd Quarter Millions of euro First nine months
2011 2010 Change 2011 2010 Change
Parent Company
174 161 13 Revenues 514 484 30
(14) (13) (1) Gross operating margin (42) (16) (26)
(16) (15) (1) Operating income (49) (21) (28)
Employees at period-end (no.) 863 803 (1) 60
Capital expenditure 3 2 1
Services and Other Activities
349 262 87 Revenues 878 786 92
66 44 22 Gross operating margin 160 117 43
43 21 22 Operating income 88 40 48
Employees at period-end (no.) 4,285 4,033 (1) 252
Capital expenditure 25 41 (16)
(1) At December 31, 2010 restated.
Parent Company
Performance in the 3rd Quarter
Revenues in the 3rd Quarter of 2011 amounted to €174 million, an increase of €13 million
or 8.1% compared with the same period of 2010, the net effect of:
> an €11 million increase in revenues from the sale of electricity to the Single Buyer;
> a €5 million increase in revenues for support and staff activities performed by the Parent
Company for the Group companies;
> the effect of the recognition in the 3rd Quarter of 2010 of the proceeds from the sale of
39% of Idrosicilia (€3 million).
The gross operating margin in the 3rd Quarter of 2011 was a negative €14 million, in line
with the performance registered in the year-earlier period.
Operating income showed a loss of €16 million, in line with developments in the gross
operating margin.
Performance in the first nine months
Revenues in the first nine months of 2011 amounted to €514 million, an increase of €30
million or 6.2% compared with the same period of 2010, essentially attributable to:
> a €20 million increase in revenues from the sale of electricity to the Single Buyer,
essentially ascribable to a rise in the average sales price, as quantities sold were virtually
unchanged;
> a €13 million increase in revenues for support and staff activities performed by the Parent
Company for the Group companies;
> the effect of the recognition in the same period of 2010 of the proceeds from the sale of
39% of Idrosicilia (€3 million).
Enel – Interim Financial Report at September 30, 2011 44
The gross operating margin in the first nine months of 2011 was a negative €42 million, a
deterioration of €26 million. The fall is largely attributable to an increase of €27 million in
operating costs, with the margin on electricity remaining in line with the same period of the
previous year.
Operating income showed a loss of €49 million, a deterioration of €28 million compared
with the first nine months of 2010, in line with developments in the gross operating margin.
Capital expenditure
Capital expenditure in the first nine months of 2011 came to €3 million.
Enel – Interim Financial Report at September 30, 2011 45
Services and Other Activities
Performance in the 3rd Quarter
Revenues for the Services and Other Activities area in the 3rd Quarter of 2011 came to
€349 million, up €87 million compared with the year-earlier period. The increase essentially
reflects higher revenues for IT services and for telephony services for Group companies.
The gross operating margin in the 3rd Quarter of 2011 amounted to €66 million, up €22
million from the same period of the previous year as a result of the positive effects of
margins on contracts.
Operating income in the 3rd Quarter of 2011 amounted to €43 million, up €22 million
compared with the 3rd Quarter of 2010.
Performance in the first nine months
Revenues for the Services and Other Activities area in the first nine months of 2011 came
to €878 million, up €92 million compared with the year-earlier period. The increase
essentially reflects higher revenues for IT services and for telephony services for Group
companies. These factors were partially offset by a decrease in revenues from the sale of
goods.
The gross operating margin in the first nine months of 2011 amounted to €160 million, up
€43 million or 36.8% from the same period of the previous year as a result of the positive
effects of margins on contracts and the revised estimate of liabilities for employee retirement
incentives (€11 million).
Operating income in the first nine months of 2011 amounted to €88 million, up €48 million
compared with the first nine months of 2010, comprising a decrease of €5 million in
depreciation, amortization and impairment losses.
Capital expenditure
Capital expenditure in the first nine months of 2011 came to €25 million, down €16 million
compared with the same period of 2010.
Enel – Interim Financial Report at September 30, 2011 46
Significant events in the 3rd Quarter of 2011
LaGeo dispute: international arbitration board issues ruling On July 5, 2011, the International Chamber of Commerce notified the parties of the ruling
issued by the arbitration board on May 30, 2011 in Paris, in the international arbitration
proceeding initiated by Enel Green Power against its partner in LaGeo, Inversiones
Energéticas (INE), for recognition of its right to finance investments in LaGeo by means of
capitalization of such investments, thus achieving the majority stake in the Salvadorean
company’s share capital. The arbitration board recognized Enel Green Power’s right to make
further investments through LaGeo in geothermal energy in El Salvador and to capitalize
such investments in LaGeo itself by way of the subscription of new shares in that company.
This right, which is provided for in the agreement between LaGeo shareholders of June 4,
2002, will enable Enel Green Power to acquire the majority of LaGeo’s share capital. In
addition, the arbitration board dismissed as unfounded a counterclaim brought by INE
against Enel Green Power for alleged damages.
Bond issue on European market On July 12, 2011, Enel SpA, acting through its subsidiary Enel Finance International, placed
– in execution of the resolution of the Board of Directors of Enel SpA of June 16, 2011 – a
multi-tranche bond issue totaling €1,750 million targeted at institutional investors on the
European market, under its Global Medium Term Notes program.
The transaction, led by a syndicate of banks consisting of Banca IMI, BNP Paribas, Deutsche
Bank, Société Générale and Unicredit in their capacity of joint-bookrunners, received
subscriptions of about €7,500 million. The issue is structured into the following tranches (all
guaranteed by Enel SpA):
> €1,000 million fixed-rate 4.125% bond maturing July 12, 2017.
> €750 million fixed-rate 5% bond maturing July 12, 2021.
Agreement to develop hydroelectric sector in the province of Belluno On July 15, 2011, Enel Produzione and En&En SpA, a company involved in the development
of energy projects, signed an agreement to develop new hydroelectric projects in the
province of Belluno. The accord provides for the establishment of a new company (called
ENergy Hydro Piave) held by Enel Produzione (51%) and En&En (49%) – or companies
directly controlled by that company – to build and operate new hydroelectric plants in the
province, in synergy with the existing Enel Produzione plants in the area and leveraging the
contribution of the local business community. Enel Produzione and En&En have initiated the
process of obtaining permits for two projects with a total capacity of about 60 MW, with the
aim of obtaining, through ENergy Hydro Piave, the award of the first 30-year diversion
concession from the Region of Veneto by the end of 2011.
Enel – Interim Financial Report at September 30, 2011 47
2011 interim dividend On September 28, 2011, the Board of Directors of Enel SpA approved the financial
statements of Enel SpA at June 30, 2011 and the associated report, which indicated that the
performance and financial position of the Company and the Group would allow the
distribution of an interim dividend for 2011 equal to €0.10 per share, to be paid as from
November 24, 2011, with an ex dividend date of November 21, 2011.
EIB loan to finance investments by Enel Distribuzione On September 30, 2011 Enel Distribuzione signed an agreement with the European
Investment Bank (“EIB”) for a €350 million loan (called “Enel Efficienza Rete III”) to cover a
portion of its investments to improve the efficiency of the national electricity network, a
project envisaged in its 2012-2014 business plan.
The EIB also indicated its willingness to providing further funding for these investments up to
a total of €1 billion.
The 20-year “Enel Efficienza Rete III” financing agreement (maturing December 15, 2031)
has a 5-year grace period that runs until December 15, 2016. The funds will be disbursed by
the end of 2011 and secured with a parent company guarantee provided by Enel SpA.
The loan terms provide for the application of a spread of 70 basis points over Euribor.
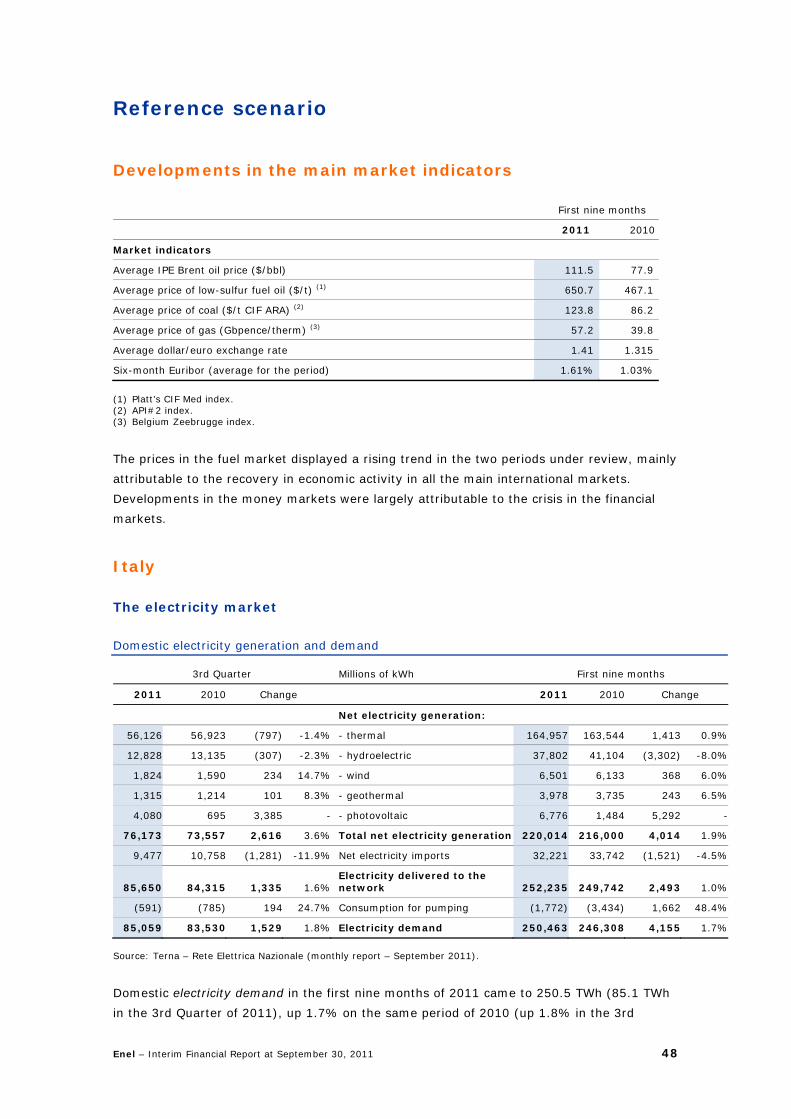
Enel – Interim Financial Report at September 30, 2011 48
Reference scenario
Developments in the main market indicators First nine months
2011 2010
Market indicators
Average IPE Brent oil price ($/bbl) 111.5 77.9
Average price of low-sulfur fuel oil ($/t) (1) 650.7 467.1
Average price of coal ($/t CIF ARA) (2) 123.8 86.2
Average price of gas (Gbpence/therm) (3) 57.2 39.8
Average dollar/euro exchange rate 1.41 1.315
Six-month Euribor (average for the period) 1.61% 1.03%
(1) Platt’s CIF Med index. (2) API#2 index. (3) Belgium Zeebrugge index.
The prices in the fuel market displayed a rising trend in the two periods under review, mainly
attributable to the recovery in economic activity in all the main international markets.
Developments in the money markets were largely attributable to the crisis in the financial
markets.
Italy
The electricity market Domestic electricity generation and demand
3rd Quarter Millions of kWh First nine months
2011 2010 Change 2011 2010 Change
Net electricity generation:
56,126 56,923 (797) -1.4% - thermal 164,957 163,544 1,413 0.9%
12,828 13,135 (307) -2.3% - hydroelectric 37,802 41,104 (3,302) -8.0%
1,824 1,590 234 14.7% - wind 6,501 6,133 368 6.0%
1,315 1,214 101 8.3% - geothermal 3,978 3,735 243 6.5%
4,080 695 3,385 - - photovoltaic 6,776 1,484 5,292 -
76,173 73,557 2,616 3.6% Total net electricity generation 220,014 216,000 4,014 1.9%
9,477 10,758 (1,281) -11.9% Net electricity imports 32,221 33,742 (1,521) -4.5%
85,650 84,315 1,335 1.6%Electricity delivered to the network 252,235 249,742 2,493 1.0%
(591) (785) 194 24.7% Consumption for pumping (1,772) (3,434) 1,662 48.4%
85,059 83,530 1,529 1.8% Electricity demand 250,463 246,308 4,155 1.7%
Source: Terna – Rete Elettrica Nazionale (monthly report – September 2011).
Domestic electricity demand in the first nine months of 2011 came to 250.5 TWh (85.1 TWh
in the 3rd Quarter of 2011), up 1.7% on the same period of 2010 (up 1.8% in the 3rd

Enel – Interim Financial Report at September 30, 2011 49
Quarter of 2011). Of this total, 87.1% was met by net domestic electricity generation for
consumption (86.3% in the first nine months of 2010), with the remaining 12.9% being met
by net electricity imports (13.7% in the first nine months of 2010).
Net electricity imports in the first nine months of 2011 decreased by 1.5 TWh (down 1.3 TWh
in the 3rd Quarter) as a result of the narrower electricity price differential between the
domestic market and the other European countries in the two periods, mainly in the 3rd
Quarter of 2011 (down 11.9%).
Net electricity generation in the first nine months of 2011 increased by 1.9% or 4.0 TWh,
mainly attributable to an increase in photovoltaic generation (up 5.3 TWh) and thermal
generation (up 1.4 TWh). These factors were only partially offset by a decline in hydroelectric
generation (down 3.3 TWh), attributable to better water availability conditions in the year-
earlier period. A similar pattern was seen in the 3rd Quarter of 2011, with the exception of
thermal generation, which fell by 0.8 TWh or 1.4%.
The gas market Domestic gas demand
3rd Quarter Billions of m3 First nine months
2011 2010 Change 2011 2010 Change
2.1 2.0 0.1 5.0% Residential and civil 20.0 21.9 (1.9) -8.7%
3.9 3.7 0.2 5.4% Industrial and services 12.8 12.4 0.4 3.2%
7.2 7.8 (0.6) -7.7% Thermal generation 21.5 22.2 (0.7) -3.2%
0.5 0.6 (0.1) -16.7% Other (1) 1.5 1.7 (0.2) -11.8%
13.7 14.1 (0.4) -2.8% Total 55.8 58.2 (2.4) -4.1%
(1) Includes other consumption and losses. Source: Enel based on data from the Ministry for Economic Development and Snam Rete Gas.
Domestic demand for natural gas in the first nine months of 2011 decreased by 4.1% to 55.8
billion cubic meters compared with the year-earlier period.
The decline involved all categories of consumption, with the exception of the industrial and
services segment, which rose by 3.2%. Residential and civil consumption diminished,
essentially due to colder weather in the 1st Quarter of 2010. A similar pattern was seen in the
3rd Quarter of 2011.
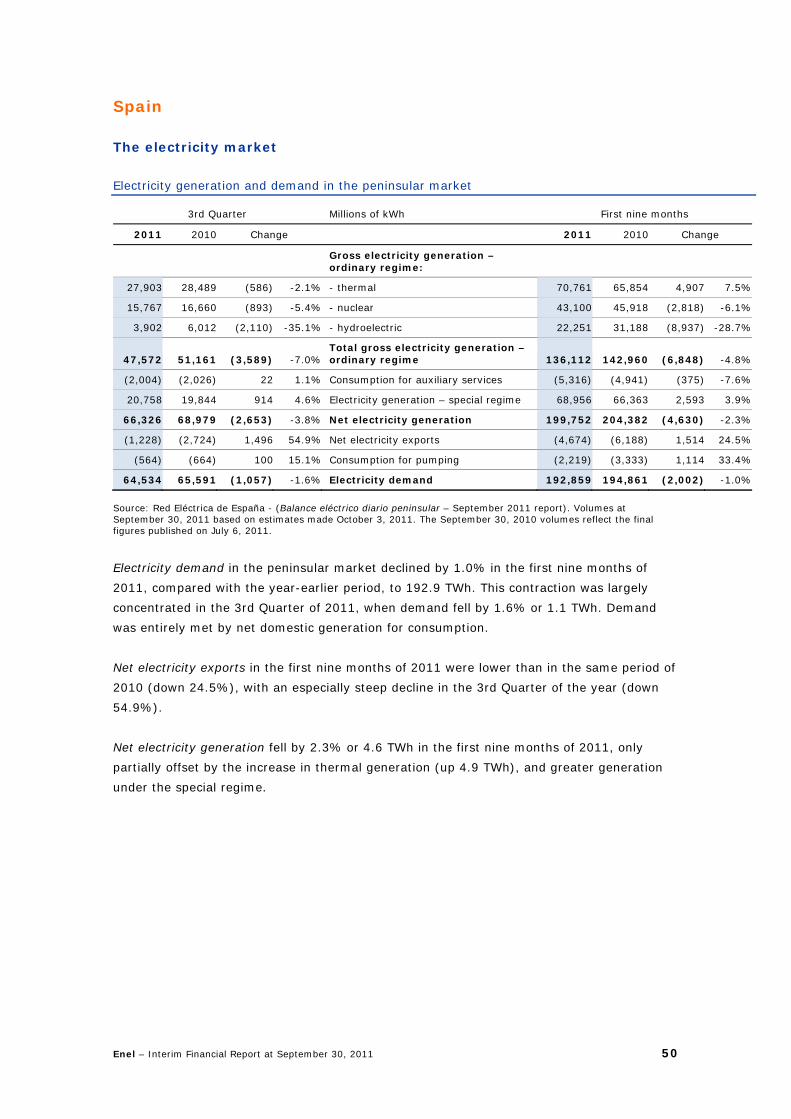
Enel – Interim Financial Report at September 30, 2011 50
Spain
The electricity market Electricity generation and demand in the peninsular market
3rd Quarter Millions of kWh First nine months
2011 2010 Change 2011 2010 Change
Gross electricity generation – ordinary regime:
27,903 28,489 (586) -2.1% - thermal 70,761 65,854 4,907 7.5%
15,767 16,660 (893) -5.4% - nuclear 43,100 45,918 (2,818) -6.1%
3,902 6,012 (2,110) -35.1% - hydroelectric 22,251 31,188 (8,937) -28.7%
47,572 51,161 (3,589) -7.0%Total gross electricity generation – ordinary regime 136,112 142,960 (6,848) -4.8%
(2,004) (2,026) 22 1.1% Consumption for auxiliary services (5,316) (4,941) (375) -7.6%
20,758 19,844 914 4.6% Electricity generation – special regime 68,956 66,363 2,593 3.9%
66,326 68,979 (2,653) -3.8% Net electricity generation 199,752 204,382 (4,630) -2.3%
(1,228) (2,724) 1,496 54.9% Net electricity exports (4,674) (6,188) 1,514 24.5%
(564) (664) 100 15.1% Consumption for pumping (2,219) (3,333) 1,114 33.4%
64,534 65,591 (1,057) -1.6% Electricity demand 192,859 194,861 (2,002) -1.0%
Source: Red Eléctrica de España - (Balance eléctrico diario peninsular – September 2011 report). Volumes at September 30, 2011 based on estimates made October 3, 2011. The September 30, 2010 volumes reflect the final figures published on July 6, 2011.
Electricity demand in the peninsular market declined by 1.0% in the first nine months of
2011, compared with the year-earlier period, to 192.9 TWh. This contraction was largely
concentrated in the 3rd Quarter of 2011, when demand fell by 1.6% or 1.1 TWh. Demand
was entirely met by net domestic generation for consumption.
Net electricity exports in the first nine months of 2011 were lower than in the same period of
2010 (down 24.5%), with an especially steep decline in the 3rd Quarter of the year (down
54.9%).
Net electricity generation fell by 2.3% or 4.6 TWh in the first nine months of 2011, only
partially offset by the increase in thermal generation (up 4.9 TWh), and greater generation
under the special regime.
Enel – Interim Financial Report at September 30, 2011 51
Regulatory and rate issues
Third Energy Package Under the regulatory framework set out in the Third Energy Package, approved in April 2009,
the European Commission gave the Agency for the Cooperation of Energy Regulators (ACER)
the task of preparing Framework Guidelines (FG) to be used by ENTSO-E, and eventually the
national network operators, in preparing network codes.
During the summer, the FG on Capacity Allocation Mechanisms for the European Gas
Transmission Networks; the FG on Electricity Grid Connections and the FG on Capacity
Allocation and Congestion Management for Electricity were issued. The following FG are
currently in the consultation stage: the FG on System Operation, the FG on Gas Balancing in
Transmission Systems and the FG on Interoperability Rules for European Gas Transmission
Networks.
The deadline for transposing the Third Energy Package into national legislation expired on
March 3, 2011. The new regulations contain measures for completely liberalizing the
electricity and gas market and strengthening the energy security and competitiveness of the
European Union.
The Third Energy Package is comprised of 2 directives and 3 regulations:
> Directive 2009/72/EC (Common rules for the internal market in electricity);
> Directive 2009/73/EC (Common rules for the internal market in natural gas);
> Regulation (EC) no. 714/2009 (Conditions for access to the network for cross-border
exchanges in electricity);
> Regulation (EC) no. 715/2009 (Conditions for access to the natural gas transmission
networks);
> Regulation (EC) no. 713/2009 establishing an Agency for the Cooperation of Energy
Regulators (ACER).
The Member States have lagged considerably in transposing the Third Package. In its “Report
on progress in creating the internal gas and electricity market”, the European Commission
announced that as at June 1, 2011, no Member State had notified full transposition of the
Third Package, although four Member States had transmitted a partial notification.
On May 31, 2011, the Italian Government approved the draft legislative decree transposing
Directives 2009/72/EC and 2009/73/EC concerning electricity and gas. The decree
(Legislative Decree 93/2011) was published in the Gazzetta Ufficiale on June 28, 2011.
The main provisions include:
> unbundling of the Transmission System Operator (TSO). In the electricity sector, the
unbundling of ownership was confirmed and the TSO was expressly prohibited from
operating power plants. For the gas sector, an Independent Transmission Operator model
has been adopted, with a vertically integrated ownership structure, more stringent
functional separation rules and control and approval powers for the Authority for
Electricity and Gas (the Authority);
> integration of Renewable Energy Sources (RES) generation: the operator of the National
Transmission Grid and distribution companies may install storage systems on the
networks they operate in order to optimize generation from renewable resources. A
subsequent ministerial decree will be issued to define procedures for organizing tenders
Enel – Interim Financial Report at September 30, 2011 52
for the construction of new pumping plants in order to integrate renewables into the
electrical system more effectively;
> exemption from third-party access (TPA) obligation. In the electricity sector, the length of
the TPA obligation will now be set on a case-by-case basis, with the obligation lapsing if
the infrastructure has not entered service or has not been completed with the time limits
set in the Directive. In the gas sector, in addition to the time limits provided for with
regard to the electricity sector, the new rules provide for a cap of 25 years for the
duration of the exemption and for an open-season procedure to assess the interest of
third parties in the infrastructure.
Agency for the Cooperation of Energy Regulators (ACER) As envisaged in the Third Energy Package, in March 2011 the Agency for the Cooperation of
Energy Regulators (ACER) began operations. ACER replaces and strengthens the European
Regulators Group for Electricity and Gas (ERGEG). It will be headquartered in Ljubljana
(Slovenia).
ACER coordinates the actions of national regulatory authorities (NRAs) in the electricity area
and its main responsibilities are to:
> establish the rules governing European electricity and gas networks;
> evaluate the terms and conditions for access to and operational security for cross-border
infrastructures where the national authorities are in disagreement;
> prepare the Ten-Year Network Development Plan (TYNDP).
European Commission procedures concerning regulated prices On April 6, 2011, the European Commission sent reasoned opinions to Italy, Poland and
Romania urging them to bring their national legislation on end-user energy prices into line
with EU rules. The focus of the DG Energy’s concern regarded end-user prices for gas in
Poland, electricity in Italy and gas and electricity in Romania. Shortly thereafter, on May 9,
2011, the Commission took a similar step with Portugal concerning its end-user prices for
natural gas.
According to the Commission, regulated prices hinder the market access of new entrants and
deprive consumers and companies of the right to choose the best service on the market.
Proposal for an energy efficiency directive On June 22, 2011, the European Commission sent the Council and the European Parliament
a proposal for a new energy efficiency directive that is intended to set out a European
regulatory framework for achieving energy savings targets and to make binding a number of
the measures proposed in the Energy Efficiency Plan of March 8, 2011. The new energy
efficiency directive would replace the earlier directives on cogeneration (2004/8/EC) and
energy services (2006/32/EC).
Among its main measures, the Commission proposes to introduce an annual energy savings
requirement of 1.5% for each Member State. That objective can be achieved by introducing
an equivalent obligation for energy distributors or sales companies, or through alternative
measures (such as, for example, financing programs or voluntary agreements).
Through their own procurement policies and building renovation efforts, public bodies will
also play an active role in promoting energy efficient products and services.
Enel – Interim Financial Report at September 30, 2011 53
With regard to power generation, the Commission proposal provides for the Member States
to draft a national plan for the promotion of high-efficiency cogeneration and district heating
and air conditioning. In addition, while allowing a number of exemptions, the Commission
proposes that the Member States should require adoption of cogeneration equipment for
generation plants with a capacity of more than 20 MW.
Regulation on transparency in energy markets (REMIT) On September 14, 2001, the European Parliament approved in the first reading the
regulation on the transparency and integrity of wholesale energy markets proposed by the
European Commission in November 2010. The new regulation prohibits insider dealing and
market manipulation, giving the Agency for the Cooperation of Energy Regulators (ACER) a
key role in market supervision and identifying instances of market abuse. The final version of
the regulation must still be approved by the European Council.
Emissions trading On July 13, 2011, the new auction rules to take effect in October were approved. They
provide for the holding of early auctions for a total volume of 120 million CO2 emission
allowances (of which 11.3 million allowances allocated to Italy), starting from the final four
months of 2012. On September 14, 2011, the Member States and the European Commission
(EC) approved the draft versions of two joint agreements to appoint the Single Auction
Monitor and for launching the Common Auction Platform.
On September 26, 2011, the EC published the benchmark values for allocating allowances
free of charge to aircraft operators included in the Emission Trading Schemes (ETS) starting
from January 1, 2012. On October 6, 2011, the European Court of Justice, in an initial
opinion, stated that imposing the carbon cap on non-European airlines does not infringe the
sovereignty of other states nor does it violate international law. The final decision in this suit
brought by a number of US airlines is expected in early 2013.
The Registries Regulations are scheduled to come into force in October. Some of the security
measures contained in the Regulations will take immediate effect, such as those pertaining
to non-disclosure of the serial numbers of the emission allowances and the possibility of
“freezing” allowances and accounts in the event of suspected fraud. The other provisions will
take effect on a rolling basis starting from January 1, 2012.
On October 5, 2011, the European Investment Bank published the details on the
monetization of the NER 300 allowances. EU emission allowances (EUAs) will be sold in two
tranches (200 million and 100 million) starting from December 2011 through the over-the-
counter (OTC) market and regulated markets (allowances are also expected to be
auctioned). Funding for the winning projects is expected to be decided in December 2013.
Given the lack of an adequate framework of rules for oversight and control of the carbon
spot market, the Commission is considering extending the markets in financial instruments
directive (MiFID), currently being revised, to this market.
Green certificates On March 30, 2011, the Energy Services Operator (ESO) announced the guaranteed
withdrawal price for green certificates issued for generation in 2008, 2009 and 2010 (with
the exception of those regarding cogeneration plants connected with district heating) at
Enel – Interim Financial Report at September 30, 2011 54
€87.38/MWh, corresponding to the weighted average price in green certificate trading on the
market run by the Energy Markets Operator (EMO) in 2008-2010.
In addition, the price for green certificates held by the ESO for 2011 is €113.10/MWh. This
price is equal to the difference between the price of €180/MWh in the 2008 Finance Act
(Article 2, paragraph 148) and the annual average sales price for electricity in 2010 of
€66.90/MWh, established by the Authority in Resolution ARG/elt no. 5/11.
Legislative Decree 28/2011, transposing Directive 2009/28/EC on the promotion of the use
of energy from renewable resources, repealed Article 45 of the decree law containing budget
adjustment measures, which had established that as from 2011 the charges incurred by the
ESO for the withdrawal of expiring green certificates shall be 30% less than those for 2010.
Long-term electricity import contracts Enel has a contract for the import of electricity with Alpiq (formerly Atel) on the Swiss border
expiring on December 31, 2011. The power imported under the contract with Alpiq is sold to
the Single Buyer at a set price and is used to supply the enhanced protection market.
On December 14, 2010, the decree of the Minister for Economic Development governing the
import procedures for the long-term contract for 2011 was published. The decree set the
price for the 1st Quarter of 2011 at €66.3/MWh, confirming the mechanism for updating the
price for the subsequent quarters based on the indexing of the Single National Price (SNP).
In line with the previous decree, it gave the Single Buyer the right to not draw the electricity
under the long-term contract if prices are not consistent with its forecast for average
provisioning costs. However, the Single Buyer confirmed its intention to draw the electricity
governed by the contract for 2011. The price for the 2nd Quarter of 2011 was set at
€68.84/MWh and for the 3rd Quarter at €70.73/MWh.
Sales
Commercial quality of sales services
With Resolution ARG/com no. 82/11 the Authority postponed the entry into force of the
standard for the time limits for the transmission of end-user service requests by sales
companies to distributors for one year (to July 1, 2012).
Electricity
Sales
With Resolution ARG/gas no. 99/11, the Authority adopted new measures for containing the
credit risk of sellers, including prohibiting customers whose service is cancelled due to non-
payment from automatically being admitted to the enhanced protection system.
Inquiries and fact-finding investigations
On July 6, 2009, with Resolution VIS no. 64/09, the Authority launched a formal inquiry into
imposing sanctions against Enel Servizio Elettrico for violation of its disclosure obligations
during the initial period of operation of the safeguard services market. On September 30,
2011, the Authority closed the inquiry, ordering Enel Servizio Elettrico to pay a fine of
€330,000.
Enel – Interim Financial Report at September 30, 2011 55
On February 24, 2011, the Council of State denied Enel Distribuzione’s appeal to revoke
ruling no. 2507/2010, which upheld the levying of a fine of €11.7 million on the company for
having failed to meet the provisions of Resolution no. 55/00 concerning the transparency of
invoices. Enel Distribuzione’s appeal to the European Court of Human Rights is continuing.
On April 14, 2011, with Resolution VIS no. 49/11, the Authority launched a formal inquiry to
determine whether Enel Servizio Elettrico had violated the Integrated Service Quality Code
(TIQV).
Gas Integrated Gas Sales Code
With the Integrated Gas Sales Code (TIVG), the Authority has established the safeguards
and the structure of supply prices applied to end users in the natural gas market.
With Resolution ARG/gas no. 71/11, the Authority redefined the scope of the safeguards,
establishing regulated prices (which had already applied to residential customers and to
condominiums whose residential use does not exceed 200,000 cubic meters a year) to non-
residential customers with consumption levels below 50,000 cubic meters a year and to
users involved in providing public assistance services.
With Resolution ARG/gas no. 99/11, the Authority adopted a series of measures for
completing the protection services framework and introducing rules specifically addressing
the issue of non-payment.
In implementing Legislative Decree no. 93 of June 1, 2011, the Authority made the
distributor covering a certain territory responsible for balancing its network (“default
service”) at the withdrawal points for end users without a supplier.
The resolution also approved the Integrated Gas Payment Arrears Code (TIMG) regulating
the default service in the event of non-payment by the end user. The code also establishes
the process for administrative approval of service termination and the procedures and timing
for revoking switching for customers whose service is suspended due to non-payment.
In addition, the resolution modified the size of security deposits, adjusting the existing
amounts to reflect the estimated costs of one month of service delivery.
The new provisions are scheduled to enter into force starting January 1, 2012. Rates and rate updates
With Resolution ARG/gas no. 77/11, the Authority revised the formula for updating the QE
component (covering raw material provisioning costs) for the October 2011 - September
2012 gas year. The revision will raise the QE component by about 1% compared with the
previous gas year. In the same resolution, the Authority also initiated a proceeding for the
adjustment of natural gas supply prices for the safeguard service.
With Resolution ARG/gas no. 105/11, the Authority extended the validity of the value of the
QVD component (covering retail sales costs), currently about €43 per customer served, for
three months to December 31, 2011.
With its ruling no. 347/2011, the Lombardy Regional Administrative Court granted Enel
Energia’s appeal against Resolution ARG/gas no. 106/09 concerning the compensation
mechanism for charges that could not otherwise be recovered incurred by sales companies
as a result of the removal of the invariance threshold established by the Authority as from
January 1, 2009. The Authority has appealed the Court’s ruling before the Council of State.
Enel – Interim Financial Report at September 30, 2011 56
Supplier of last resort
With Resolution ARG/gas no. 116/11, the Authority established the procedure to be used by
the Single Buyer in selecting the supplier of last resort for natural gas for gas year 2011-
2012. On September 21, 2011, the Single Buyer published its list of suppliers of last resort
for the five areas covered by the tender. Enel Energia ranked second in three of the areas
and will act as supplier of last resort in the event the first-ranked companies exhaust their
supplies of gas allocated for this function.
Generation and Energy Management
Emissions trading
On June 27, 2011, the national committee for the management of Directive 2003/87/EC
assigned the emissions allowances for 2010 to units 2 and 3 of the Torrevaldaliga Nord plant,
which had been ineligible for the “New Entrant Reserve”.
It is estimated that Enel Produzione will received a reimbursement of €340 million (out of a
national total of €650 million) for the 2009-2012 period. Under the provisions of Legislative
Decree 72 of 2010, the credits will be reimbursed using the proceeds from the phase III ETS
auctions.
With Resolution ARG/elt no. 111/11 of August 4, 2011, the Authority set the amount to be
reimbursed to Enel Produzione for 2010 at €63.3 million, corresponding to 4.4 million metric
tons.
At an aggregate level, emissions produced by Enel Produzione amounted to 26.8 million
metric tons of CO2 at September 30, 2011. Considering that the allowances assigned under
the national allocation plan (calculated based on the projected emissions for that period)
were equal to 27.6 million metric tons, there was a surplus of 0.8 million metric tons.
Electricity
New mechanism for remunerating productive capacity
With Resolution ARG/elt no. 98/11, the Authority announced that, starting from 2017,
generation capacity will be remunerated using the reliability options mechanism. This
requires generators, in exchange for a premium established through a competitive process,
to make their capacity available on the Day-Ahead Market (DAM) and the Ancillary Services
Market (ASM), repaying Terna any positive difference between the market price and the
strike price set in the contract. The strike price for the reliability options will be established
by Terna based on the variable costs of the leading technology. The auctions will be held four
years prior to the three-year delivery period. To ensure the selection of existing capacity
during the auction process, a minimum premium will be payable to existing plants.
Reimbursement of generation costs on grids not interconnected with the NTN
With its ruling no. 1737 filed on July 4, 2011, the Milan Regional Administrative Court
rejected the appeal lodged by UNIEM (Unione Nazionale Imprese Elettriche Minori) against
Resolution ARG/elt no. 89/09. The resolution in question introduced new rules governing the
recognition of generation costs incurred by plants on non-interconnected grids similar to
those envisaged for plants essential to the security of the electrical system. On the basis of
Resolution ARG/elt no. 89/09, which has been upheld by the ruling, Enel Produzione is
Enel – Interim Financial Report at September 30, 2011 57
entitled to receive reimbursement of generation costs incurred by plants on grids not
interconnected with the NTN (those on the smaller islands) as from 2009.
Gas
Promoting investment in storage
Pursuant to Legislative Decree 130 of August 13, 2010, the Ministry for Economic
Development issued a decree on January 31, 2011 approving Eni’s plan for investment in
storage. The plan calls for the gradual introduction of 4 billion cubic meters of new storage
capacity no later than September 1, 2015.
Of the total new storage capacity, as of April, 1.7 billion cubic meters of physical storage
capacity is available for the 2011-2012 gas storage year. In allocating storage capacity
following the procedures and timetables set out in Resolution ARG/gas no. 40/11, priority
was given to industrial customers.
Daily balancing market
With Resolution ARG/gas no. 45/11, the Authority established the rules for merit-order
balancing for the gas market. With Resolution ARG/gas no. 81/11, the Authority postponed
the start of the balance service from July 1 to December 1, 2011.
Late metering adjustments
With Resolution ARG/gas no. 182/09, the Authority established the criteria for adjustment
payments arising in respect of late adjustments of metering data for the transport network.
The settlement of payments was suspended after the Regional Administrative Court granted
the appeal of a transport network user against the resolution in its ruling no. 1/2011, a
decision that also affected Enel Trade. The Authority appealed the Regional Administrative
Court’s decision to the Council of State, which upheld the suspension.
Infrastructure and Networks
Active network connections
With Resolution ARG/elt no. 73/11, the Authority suspended until December 31, 2011 the
provisions on the guarantees, which is currently being challenged before the Lombardy
Regional Administrative Court, that generation companies must provide to grid operators for
connections in “critical areas”. The Authority also started a consultation process with a view
to introducing new measures to remove the problem of the virtual saturation of grids.
Metering equalization
With Resolutions ARG/elt no. 74/11 and ARG/elt no. 97/11, the Authority set the amounts
for equalization of revenues for low-voltage metering services for 2009 and for the
adjustment for 2008 for each distribution company. On September 20, 2011, Enel
Distribuzione received about €21.5 million from the Electricity Equalization Fund.
Inquiries and fact-finding investigations
On July 6, 2009, with Resolution VIS no. 65/09, the Authority initiated a formal inquiry for
the adoption of sanctions against Enel Distribuzione for non-compliance with the time limits
Enel – Interim Financial Report at September 30, 2011 58
for switching customers, as well as a small number of disclosure omissions during the initial
operation of the safeguard service market. On April 7, 2011, the Authority closed its inquiry
and fined Enel Distribuzione €169,000.
On August 2, 2011, the Authority, with Resolution VIS no. 81/11, initiated a proceeding for
the adoption of sanctions against Enel Distribuzione for non-compliance with energy
efficiency requirements for the year 2010.
Smart Grids
With Resolution ARG/elt no. 12/11, the Authority approved the pilot smart grid project
submitted by Enel Distribuzione for receipt of a higher rate of remuneration as established
under the Integrated Rate Code (Annex A to Resolution no. 348/07).
Electric cars
With Resolution ARG/elt no. 96/11, the Authority approved two pilot projects submitted by
Enel Distribuzione and Enel Energia for receipt, under Resolution ARG/elt no. 242/10, of a
subsidy of €728 per year for each charging station installed through the end of 2015. Energy efficiency
With its ruling of July 21, 2011, the Council of State granted the appeal of Enel.si against the
Authority’s decision (confirmed with Resolution EEN 11/10) to not recognize energy savings
achieved through the free distribution of compact fluorescent lamps to residential customers
in 2007 and the 1st Half of 2008.
On October 6, 2011, the Authority sent Enel.si a letter specifying the amount of white
certificates accrued through that date, equal to around 350,000 certificates.
Iberia and Latin America
Spain
Rate updates
On April 29, 2011, the government published Ministerial Order 1068/2011, amending
Ministerial Order 3353/2010, allocated among system costs for 2010 the portion of the rate
deficit for 2009 that exceeded the legal limit.
On March 31, 2011, Ministerial Order 688/2011 was published, revising the access rates in
effect starting from April 2011. The projected average increase for Tarifa de Ultimo Recurso
(TUR) customers is 10.85% (equivalent to the average decrease in the electricity component
of the TUR for the 2nd Quarter of 2011) while the rate for high-voltage customers was raised
by 2% on average.
On September 30, 2011, the Ministerial Resolution of September 29, 2011 was published
establishing the amount of the electricity component of the TUR, as well as Ministerial Order
ITC/2585/2011, which reduces the Tarifa de Acceso so as to keep the final price of the TUR
the same despite the increase in the electricity component.
Supplier of last resort
The May 19, 2011 decision of the Tribunal Supremo voided the regulation granting the sales
companies of the major vertically-integrated electricity operators the exclusive right to
supply customers on the regulated market.
Enel – Interim Financial Report at September 30, 2011 59
CESUR auctions
On March 5, 2011, Royal Decree 302/2011 was published. It requires Comercializadores de
Ultimo Recurso (CURs) to purchase contracts for differences (CFD) for a maximum amount of
electricity equal to the difference between the volume required and that awarded via the
CESUR auctions. The CFDs were sold by plants in the special regime eligible for feed-in rates.
The measure establishes that the CURs can obtain supplies at the price set by the CESUR
auctions, even for electricity covered by CFDs, thereby reducing their exposure to price risk.
Rate deficit
On January 11, 2011, the first securities were issued under the deficit securitization process
governed by Royal Decree 437/2010. The Fondo de Titulización raised €2 billion from the
issue, which were used to pay the receivables assigned by the electricity companies (Endesa
received €1,040 million).
With a Ministerial Resolution of January 20, 2011, published on January 26, 2011, the total
amount at December 31, 2010 of receivables in respect of financing the rate deficit that can
be securitized was established at €16,694 million (of which €8,467 million assigned to
Endesa).
On February 15 and March 22, the second and third tranches of securities, respectively, were
issued to securitize the deficit. The two operations raised €4 billion (Endesa received about
€2 billion).
The fourth tranche of securities was issued on May 11, 2011, raising about €1 billion (Endesa
received about €500 million).
On March 16, 2011, the Tribunal Supremo granted Endesa’s appeal arguing that the interest
rate on the financing of the deficit rate for 2006 requires an additional spread beyond
Euribor. The court recognized that Euribor by itself is not sufficient to cover the financial
expense incurred.
On July 7, 2011, the Interministerial Committee decided to extend the deadline for the
complete securitization of the first tranche of receivables that the electricity companies are
required to assign to the fund until July 7, 2012.
On September 26, 2011, the fifth issue of securities was made, raising €1.5 billion (around
€780 million of which received by Endesa). At present €8,500 million out of a total of
€16,694 million have been securitized.
On October 11, 2011, Royal Decree no. 1037/2011 was published, amending Royal Decree
no. 437/2010 and allowing the Fondo de Titulización to place a portion of the deficit with
private investors. The decree also recognizes the new restrictions on securitization set by
Royal Decree Law no. 14/2010 of December 23, 2010.
Incentives to use domestic coal
On February 10, 2011, the Resolution of the Ministry for Industry of February 8, 2011 was
published, establishing the main parameters for application of the Resolución de restrictiones
por garantía de suministro process for 2011. In particular, the mechanism will regard
consumption of about 10 million metric tons of domestic coal and a maximum electricity
output of 23.3 TWh. The measure also sets out the regulated prices of the electricity
produced by each plant involved in the process. The mechanism has been applied starting
from February 26, 2011.
Enel – Interim Financial Report at September 30, 2011 60
Economic Sustainability Law
The Ley de Economía Sostenible was published on March 5, 2011. Among the main measures
concerning the energy sector were the following:
> operation of nuclear power plants: there is no time limit on plant operation. Under the
indicative energy plan, the government will determine the percentage that nuclear energy
must contribute to the generation mix by 2020, in accordance with the calendar of
operations of existing plants and with the license renewals sought by plant operators,
taking into consideration the opinion of the Nuclear Safety Board (CSN), with changes in
demand, the development of new technologies, the safety of electricity supplies,
generation costs and greenhouse gas emissions;
> transposition of European efficiency, energy savings and renewables targets:
- 20% of final gross consumption of energy must be generated from renewable
resources by 2020;
- cut energy demand by 20% by 2020 as compared with the business-as-usual scenario;
> photovoltaic power plants:
- extension of the right to receive incentives up to 30 years for plants receiving
remuneration based on Royal Decree no. 661/2007;
- prohibition against retroactive application of any changes to the limits on hours
entitled to incentives imposed by Royal Decree Law no. 14/2010. The changes only
affect plants listed in the pre-asignación registry following the entry into force of the
Royal Decree Law.
Nuclear safety
On March 16, 2011, in line with discussions occurring at the European level, the Spanish
government asked the CSN to review the safety systems in place at Spanish nuclear power
plants. Specifically, it was asked to perform additional seismic studies and studies on the
threat posed by flooding.
On September 15, 2011, the CSN sent a preliminary report on tests conducted on the
durability of nuclear power plants to the European Union. All the plants were found to comply
with security specifications.
Civil liability of nuclear plant operators
On May 28, 2011, Law 12/2011 governing the new system of civil liability for nuclear plant
operators was published. The law raises the mandatory minimum liability for operators in the
event of an accident to €1,200 million (previously €700 million). The law also expands the
concept of “nuclear damage” to include environmental damage, restoration measures and
loss of profits and extends the time limit for bringing claims for personal injury from 10 to 30
years.
Emissions trading
In the first nine months of 2011, Endesa produced emissions totaling around 26.4 million
metric tons. Allowances assigned under the national allocation plan on a pro rata basis for
the same period amounted to about 17.8 million metric tons.
Enel – Interim Financial Report at September 30, 2011 61
Antitrust proceeding
On May 13, 2011, the Comisión Nacional de la Competencia (CNC) imposed a fine of €26.6
million on Endesa for engaging in anti-competitive behavior designed to prevent end users
from switching providers and setting the prices for large consumers. Four other companies
and the UNESA industry association were also fined.
Endesa filed an appeal of the measure on May 31, 2011.
On September 15, the Audencia Nacional granted Endesa’s motion presented on May 31,
2011 to suspend the sanction against it.
Argentina
Mecanismo de Monitoreo de Costos
As required by the Acta de Acuerdo between the government and the electricity companies,
Edesur submitted to the regulator, ENRE, its half-yearly request for recognition of the
increases in the Mecanismo de Monitoreo de Costos (MMC – an indicator of price
developments introduced by the Acta de Acuerdo in 2005), equal to 6.34% for the period
from November 2010 to April 2011. Recognition of 50% of the cost increases so far is still
pending; however, a portion of these increases was recovered through the PUREE (Programa
de Uso Racional de la Energía Eléctrica) mechanism. The distribution companies were
authorized to withhold the difference between the PUREE penalties and incentives to offset
their higher costs when the increases for the MMC are not incorporated into rates.
In the coming weeks, the Argentine government is expected to pass a resolution that
recognizes the pending increases in the MMC for Edesur and to create a special fund for
financing the distribution projects proposed by the company. The next rate revision will
incorporate the actual distribution costs as a result of the formal recognition of the MMC
increases.
Wholesale market
As provided for in the agreement signed with electricity generators (Endesa, Duke and
Sadesa) in November 2010, the government approved the plan for the “Vuelta de Obligado”
800 MW combined-cycle plant. Endesa, Duke and Sadesa formed the company VOSA (Vuelta
de Obligado Sociedad Anonima) and signed a trust agreement for the project on May 16,
2011. Finally, the tender process for awarding the contract to build the plant was recently
begun. Ansaldo, GE, Alstom and Siemens plan to take part in the tender.
Brazil
Distribution rates
On September 10, 2010, Brazilian regulator ANEEL formally initiated the process of reviewing
the distribution rates (third rate cycle), proposing to change the method and reference
parameters used (such as WACC, Regulatory Asset Base – RAB, non-technical losses and the
X efficiency factor).
ANEEL, with its Resolution no. 433/2011 of April 12, 2011, established that the current
distribution rates will remain in effect pending the adoption of the new rate calculation
method and that retroactive adjustments will be made only once the new method is
approved.
Enel – Interim Financial Report at September 30, 2011 62
On April 26, 2011, ANEEL presented a second rate revision proposal, marking an
improvement over its initial position, mainly with regard to WACC, the X efficiency factor,
operating costs and other revenues.
The rate review process should be completed by the end of autumn 2011.
Coelce will be the first Brazilian distribution company subject to review for the April 2011 –
April 2015 period. For this reason, the process of revising the company’s RAB was recently
completed and ANEEL announced its decision at the end of September 2011, setting the net
value of its assets at a higher amount than originally proposed. The review of Ampla is
expected for the 2014-2019 period.
Argentina-Brazil interconnection line (CIEN)
On April 5, 2011, Ministerial Orders 201/2011 and 211/2011 were published in Brazil,
treating the interconnection line between Brazil and Argentina (CIEN) (managed by Endesa)
as a regulated interconnection line with annual remuneration of R$248 million, with a
mechanism for an annual adjustment based on Brazilian inflation and reviewed every four
years. On June 28, 2011, ANEEL raised the annual remuneration to R$265 million.
With the signing of contracts with the Brazilian market operator, ONS, CIEN can start
receiving a regulated remuneration in line with that of the Brazilian transmission system.
Luz para Todos
On July 8, 2011, the Brazilian government published Decree no. 7520, launching a new
program called Luz para Todos for the 2011-2014 period. The Luz para Todos program aims
to bring electricity service to all Brazilians. Coelce estimates that there will be around 15
thousand new connections in the Cearà area over the next few years.
Chile
CADE and development of the transmission network
A temporary “Energy Development Evaluation Committee” (CADE), composed of electricity-
industry experts, was recently formed in Chile. The committee is tasked with formulating
proposals for reforming the Chilean electricity sector to ensure its long-term sustainability,
addressing issues such as high generation prices, possible measures for improving
competition in the wholesale market, the development of transport networks and competition
in sales to small end users. CADE is also responsible for promoting the development of a
national public transmission network to which all of the country’s generation plants and
distribution networks will be able to connect.
Regulations governing emissions by thermal power plants
The Contraloría General de la República approved the decree containing rules on emissions
by thermal power plants. The main changes compared with the version initially debated in
Parliament include the elimination of the principle of convergence between standards for
existing and new plants by 2020, the recognition of plants under construction as existing
plants and the extension of the period for adapting plants to the new rules.
Enel – Interim Financial Report at September 30, 2011 63
“Racionamiento” Decree
On February 17, 2011, Ministerial Decree no. 26 containing operational measures to prevent,
reduce and manage electricity shortages in the Central Interconnection System (reducing
voltages, maintaining hydroelectric reserves, etc.) was published. Due to the lack of
improvement in water-supply conditions, the validity of the ministerial decree has been
extended to April 30, 2012 (instead of August 31, 2011).
Review of sub-transmission rates
The process of reviewing Chilectra’s sub-transmission rates is currently under way, with the
new four-year rates to come into effect retroactively starting from November 2010.
On February 21, March 16 and May 13, 2011, the regulator CNE published three successive
versions of its technical report on the proposed sub-transmission rates. The panel of sub-
transmission experts issued its opinion on the report on August 8, 2011. The final rate
decree is expected to be published in December 2011.
Bankruptcy of Campanario
On September 13, 2011, generation company Campanario formally declared bankruptcy as a
result of being unable to generate or purchase electricity at prices competitive with its sales
contracts. A few weeks earlier, on August 26, 2011, the Superintendencia de Electricidad y
Combustibles published resolution no. 2288, setting out temporary measures to limit the
effects of the bankruptcy on end users, suspending Campanario’s participation in the
electricity market and designating other generators to ensure electricity supplies that
Campanario cannot guarantee.
Colombia
Rate for sales to regulated-market customers
On March 28, 2011, Colombian regulator CREG presented its proposal for revising the
productivity factor in the course of revising the sales rate. The CREG’s proposal reduces the
productivity factor from its current level.
The process should be completed by the end of 2011.
Network losses
On April 13, 2011, CREG published the definitive model for quantifying the investments
required to reduce the level of network losses for voltage level I for distribution companies
that exceed a certain loss limit. The final regulation will be published in the coming months.
Of the two distribution companies controlled by Endesa, only Cundinamarca is required to
submit a plan of investments for reducing losses to CREG.
Mercado organizado regulado
On August 19, 2011, CREG opened resolution no. 090/2011 for consultation. It contains a
new proposal for creating a centralized market for purchasing electricity to supply the
regulated market (MOR – Mercado organizado regulado). The main changes contained in the
proposal relate to the mechanism of guarantees provided by electricity suppliers to be able
to participate in the MOR. Specifically, the proposal calls for eliminating risk criteria in
determining the guarantees to be submitted for supplying electricity to regulated users.

Enel – Interim Financial Report at September 30, 2011 64
Peru
Auction for supplying regulated-market customers
On March 20, 2011, the Ministry of Energy and Mines published Supreme Decree 008-2011
containing certain changes to the preceding Supreme Decree 003-2011, which gives the
regulator, OSINERGMIN, the power to set the rules for the auctions and lifts the restriction
on distribution companies from holding or participating in auctions when the capacity of
auctions held by Proinversion (public agency for promoting private investment in Peru) is not
completely covered.
Remuneration for secondary transmission
As part of the process of reviewing the remuneration of the secondary transmission network
(part of the distribution network), on September 1, 2011, in accordance with Resolution no.
049/2011, Edelnor submitted its investment plan for the May 2013 – April 2017 period. This
plan will be examined by OSINERGMIN prior to its approval (expected by August 2012). The
regulator will not review the recognized costs for the existing network, but rather will only
analyze the projected network expansion costs. Once approved, the investment plan will be
binding upon Edelnor.
Regulation of the spot market
Supreme Decree 027-2011-EM, published on July 11, 2011, governs the electricity spot
market (Mercado de Corto Plazo – MCP). The decree will come into force on January 1, 2014
when Decreto de Urgencia no. 049-2008 (recently extended by Decreto de Urgencia no. 079-
2010) expires. The decree sets out the rules for the operation of the MCP and for trading
electricity at marginal pricing, as well as establishes the requirements and guarantees
generation and distribution companies and large customers must meet to take part in the
MCP.
Indigenous peoples law
On August 23, 2011, the Peruvian government enacted Law no. 27.985 (Ley del Derecho a la
Consulta Previa a los Pueblos Indígenas u Originarios). This law recognizes the right of
indigenous peoples to be consulted on measures, programs and projects that could
potentially have an impact on their existence and culture.
The Comisión Multisectorial was recently set up to prepare the regulations for the Ley
indigena, expected to be issued by December 2011.
International
France
NOME Act
On December 7, 2010, the NOME (Nouvelle Organization du Marché de l’Electricité) Act was
officially published. It sets out the main recommendations of the Champsaur Commission
(2009) and contains the reform measures that will gradually open up the French electricity
market to competition and lead to the elimination of the TaRTAM rate.
Enel – Interim Financial Report at September 30, 2011 65
The ARENH (“Accès Régulé à l’Electricité Nucléaire Historique”) mechanism, introduced by
the NOME Act, provides access to nuclear-generated base electricity for alternative suppliers
at regulated prices for a 15 year period, with volumes calculated annually with a ceiling of
100 TWh. Subsequently, implementing decrees for the ARENH mechanism and the draft of
the framework agreement between EDF and the individual alternative suppliers for delivery
of the ARENH volumes were published. As envisaged, the ARENH mechanism started on July
1, 2011 at a price of €40/MWh for the 2nd Half of 2011 and €42/MWh for 2012.
The NOME Act also calls for the creation of a capacity market. On July 7, 2011, RTE
published a draft proposal on the operation of the capacity market, including the
recommendation for a decentralized market and for making foreign interconnection capacity
ineligible for remuneration.
Russia
Capacity market
The capacity auction for 2012 was held in September 2011, with the results expected to be
announced by November 1. There are 25 market zones subject to the price cap (out of a
total of 27). For Enel OGK-5, the price cap applies only to the capacity offered by
Nevinnomysskaya and is equal to that for 2011 (RUB 118,125). The new gas combined-cycle
plants in Nevinnomiskaya and Sredneuralskaya (410 MW each) do not take part in the
capacity market. In fact, the new Nevinnomysskaya plant began commercial operations on
July 1, 2011, while the Sredneuralskaya plant is expected to begin operations in the final
quarter of 2011. They shall receive a remuneration on the basis of capacity contracts (DPM)
that provide guaranteed remuneration (capacity payment) for 10 years. Due to a delay in the
start-up of operations, the two plants were not be able to make their capacity available as
scheduled in the contract and therefore are forced to pay a fine. The penalty is expected to
be RUB 63 million/month for Sredneuralskaya and RUB 55 million/month for
Nevinnomysskaya. The final amount to be paid will be decided by the Market Council.
Wholesale market
The government appointed a working group comprised of industry experts to prepare a
proposal for reforming the wholesale market, also involving the major market players
(including Enel OGK-5). The new proposed model (which is not expected to come into force
before 2013) envisages the transition from a centralized market to a system of bilateral
contracts. Ideas being considered by the working group include eliminating capacity
remuneration mechanisms and introducing an energy-only market capable of ensuring
adequate remuneration of generation assets and providing incentives for investing in
modernization.
Slovakia
New regulatory policy for 2012-2016
In March 2011, Slovakian regulator URSO issued a new regulatory policy for the 2012-2016
period, which was approved by the Ministry for the Economy in May 2011. The new policy
introduces a general framework and targets for the next regulatory cycle. The main points
contained in the regulatory policy can be summarized as follows:
Enel – Interim Financial Report at September 30, 2011 66
> a five-year regulatory period;
> incorporation of Third Energy Package principles;
> changes in drawing electricity generated from renewable resources and through co-
generation (organized by market operator OKTE);
> emphasis on quality standards.
The complete secondary legislation resulting from the new regulatory policy will be issued by
the end of 2011.
Emissions trading
In the first nine months of 2011, Slovenské elektrárne produced about 2.26 million metric
tons of emissions, while the allowances assigned by the allocation plan on a pro rata basis
for the same period amounted to about 4 million metric tons.
Order of the Ministry for the Environment concerning taxation of CO2
Based on the approval of the amendment to Decree 595/2003 on the taxation of profits at
the end of December 2010, which introduced taxation of CO2 for 2011 and 2012, the Ministry
for the Environment issued a decree on reducing the impact of taxation of CO2 set in
December 2010 following a consultation on the issue.
The ministerial decree, which was approved on June 14, 2011 and entered into force on June
20, 2011, sets out the formula for calculating the reduction in the taxes to be paid for
surplus CO2 as the difference between the maximum annual consumption of CO2 between
2007 and 2010 and the consumption reported for 2011 and 2012. The potential impact of
taxation of CO2 for 2011 and 2012 will be around €10.5 million per year.
URSO Decree 225/2011, repealing URSO Decree 2/2008
The new decree, published on July 20, 2011, incorporates the principles set out by the new
energy policy for the 2012-2016 regulatory period and sets the criteria for regulating prices
for residential customers.
The decree establishes the methods and principles for the following areas:
> determination of eligible costs, returns on investments, WACC, calculation of the RAB;
> support for renewable energy and determination of the feed-in tariffs;
> support for domestic coal use (ENO must-run plants);
> determination of the calculation method for transmission and distribution rates;
> regulation of sales to domestic customers;
> regulation of the supplier of last resort.
New Energy Law and Regulatory Act no. 276/2001
On August 16, 2011, the Ministry for the Economy proposed a new Energy Law and changes
to Regulatory Act no. 276/2001. The main goal of the two proposals is to implement the
Third Energy Package nationally. The changes include:
> Energy Act:
- introduces or defines in greater detail concepts such as vulnerable customers and
universal service;
- establishes the new responsibilities and activities of the Ministry for the Economy and
URSO;
Enel – Interim Financial Report at September 30, 2011 67
- calls for the installation of digital meters (after completion of a cost/benefit analysis by
the Ministry for the Economy and URSO);
- requires sellers to publish the mix of electricity sold;
- requires unbundled accounting.
> Regulatory Act:
- covers a regulatory period of at least four years;
- bars the Ministry for the Economy from setting electricity rates;
- gives URSO more independence;
- provides for parliamentary appointment of the Chairman and Vice-Chairman of URSO
to six-year terms.
The final version of the two drafts will be published by the end of the year.
Proposed amendments to National Nuclear Fund decree no. 238/2006
On September 2, 2011, the Ministry for the Economy proposed an amendment to the
National Nuclear Fund decree no. 238/2006 to increase the contribution from €11,618 to
€13,428.26/MW of installed capacity per year. This will have a negative impact on Slovenské
elektrárne of about €4.3 million in 2012. The final version of the decree is expected to be
ready in October 2011.
Romania
Reform of the electricity market
The plan to reform the electricity market unveiled by the Romanian government in April
2009, involving the restructuring of generation assets through the creation of two state-
controlled generation companies (Electra and Hidroenergetica), was blocked by decision of
the Bucharest Court of Appeal in March 2011.
On October 12, 2011, the government approved a new plan to reform the sector through the
formation of two new companies (Oltenia and Hunedoara) that will be privatized by June
2012 in order to open up the generation market to private investors.
Renewable Energy Division
Italy
Transposition of Directive 2009/28/EC
Legislative Decree 28 of March 3, 2011, transposing Directive 2009/28/EC, introduced new
incentives for plants that generate electricity from renewable resources that will enter into
service starting from January 1, 2013. More specifically, under the decree and the
implementing acts to be issued within six months of its entry into force, plants with a
nominal capacity of up to an amount that differs based on the resource employed (although
these amounts have not yet been set, they will not be less than 5 MW) will be eligible for
incentives in the form of fixed rates. The incentives will be determined via a Dutch auction
run by the ESO for all plants with a nominal capacity that exceeds the above value.
As to the total or partial renovation of the plants, the incentive is granted, based on capacity
class, in an amount up to 25% and 50%, respectively, of the incentive due for generation by
Enel – Interim Financial Report at September 30, 2011 68
new plants (for plants that generate electricity from biomass, these percentages are set at
80% and 90%), provided that the plant undergoing the work has been in service for at least
two-thirds of its conventional useful life.
The decree also provides for a period of transition from the current green certificate
mechanism to the auction and rate mechanism. This transitional period will involve a
reduction in the mandatory percentage of green certificates starting from the figure set in
the 2008 Finance Act for 2012 until it is fully phased out in 2015. The green certificates
issued for generation from 2011 to 2015 will be withdrawn by the ESO at a price equal to
78% of the reference value stated in Article 2, paragraph 148, of the 2008 Finance Act
(€180/MWh, net of the average price for the sale of electricity during the previous year set
by the Authority). The right to use green certificates after 2015 will be converted into the
right to receive the fixed rates described above for the remainder of the incentive period.
Finally, the legislative decree introduces important changes pertaining to incentives for
photovoltaic systems, which are described in more detail in the following section. Energy Account
In implementation of Legislative Decree 28 of March 3, 2011, the Minister for Economic
Development issued a decree on May 5, 2011, approving the new incentive mechanism for
photovoltaic plants (“Fourth Energy Account”) applicable to plants that enter service as from
June 1, 2011, with the exception of the plants referred to in Law 129/2010 (the “Alcoa
Rescue Act”). The growth target for photovoltaics was set at 23 GW by 2016, with an annual
expenditure cap of €6 billion. If the cap is exceeded, a new decree will be issued to revise
the incentive mechanism while continuing to provide support for further growth in the sector.
The ministerial decree of May 5, 2011 also establishes:
> a transitional period from June 1, 2011 to December 31, 2012, during which “large”
plants (the decree defines such plants as ground installations of between 200 kW and 1
MW and all installations over 1 MW) will be eligible for subsidized rates up to an
expenditure cap to be set every six months; small plants (all those other than “large”
installations and all plants on government buildings and land) are eligible for incentives
without any expenditure ceiling;
> an operational period from 2013 to 2016 during which an adjustment mechanism will
apply to the subsidized rates on the basis of installed capacity in the previous monitoring
period.
Finally, the decree significantly reduces the level of the support (a bonus rate for 2011-2012
and a comprehensive rate for 2013-2016) in order to align them gradually with European
levels, with reductions compared with those under the Third Energy Account of between 22%
and 31% for 2011 and between 23% and 44% for 2012.
On July 8, 2011, Enel Distribuzione challenged the portion of the decree regarding the
automatic indemnity established by the Authority through resolution ARG/elt no. 225/10
before the Lazio Regional Administrative Court. This measure has already been challenged
before the Lombardy Regional Administrative Court.
Energy efficiency
With its decision of July 21, 2011, the Council of State granted Enel.si’s appeal against the
Authority’s failure to certify (confirmed by resolution EEN no. 11/10) the energy savings it
achieved through the free distribution of compact fluorescent light bulbs to residential
customers in 2007 and the 1st Half of 2008.
Enel – Interim Financial Report at September 30, 2011 69
Brazil
Renewable and conventional energy auctions
On April 1, 2011, with Portaria 197/2011, the Ministry for Energy and Mining (MEM)
approved the rules for auctions for reserve and A-3 standard capacity. The capacity contracts
will have a term of 30 years for hydroelectric plants and 20 years for other plants (wind,
biomass and thermoelectric).
Colombia
Remuneration for wind plant capacity
On July 26, 2011, Colombian regulator CREG issued Resolution no. 92/11 for consultation.
The resolution sets out the methodology for awarding Energía Firme (ENFICC) to wind
plants, distinguishing between whether information is available on wind output for more or
less than 10 years. This is the first time that the regulator has introduced an explicit
alternative to calculating Energía Firme for renewable resources.
France
New remuneration rates for photovoltaic systems
On March 4, 2011, the Ministry for the Environment published a decree governing the new
incentive rates for photovoltaic systems that enter into operation starting from March 10,
2011. The basic rates are:
> €460/MWh and €288/MWh for systems integrated or partially integrated, respectively,
into residential buildings of less than 100 kW;
> €406/MWh and €288/MWh for systems integrated or partially integrated, respectively,
into healthcare facilities and schools of less than 100 kW;
> €352/MWh and €288/MWh for systems integrated or partially integrated, respectively,
into other types of buildings of less than 100 kW;
> €120/MWh for other types of systems of less than 12 MW.
The rates will also be adjusted downward on a quarterly basis using the following
parameters:
> a coefficient based on the concentration of systems in the same land parcel or building;
> a coefficient based on the number of projects registered during the previous quarter.
On July 1, 2011, the basic rates for the July-September 2011 quarter were published:
> €425/MWh and €261/MWh for systems integrated or partially integrated, respectively,
into residential buildings of less than 100 kW;
> €367/MWh and €261/MWh for systems integrated or partially integrated, respectively,
into healthcare facilities and schools of less than 100 kW;
> €318/MWh and €261/MWh for systems integrated or partially integrated, respectively,
into other types of buildings of less than 100 kW;
> €117/MWh for other types of systems of less than 12 MW.
The French government also initiated the first auctions in the photovoltaic sector. The first
auction notice was published on August 1, 2011, with the deadline set for January 20, 2012;
it relates solely to systems integrated into buildings of between 100 kW and 250 kW. The

Enel – Interim Financial Report at September 30, 2011 70
second auction, opened on September 15, 2011 and set to conclude in February 2012,
relates to systems of more than 250 kW.
Greece
Renewable energy support measures
The Ministry for Energy and the Environment and the Ministry for the Economy agreed in
March 2011 to approve the transfer of 95% of the revenues derived from the sale of 10
million metric tons of CO2 allowances not used between 2008 and 2012 to the Transmission
System Operator (TSO). The revenues will be used by the TSO to cover the costs of the
incentive rates for the generation of electricity from renewable resources.
Mexico
Renewable energy support law
On February 4, 2011, the Ministry for Energy (SENER) announced a 300 MW reduction in the
2012 target (from 2,564 MW to 2,264 MW).
Despite this reduction, on March 1, 2011, the Mexican President released a document on the
national strategic energy plan for 2011-2025, establishing that 35% of electricity demand
should be met by renewable resources. The Senate is currently examining the draft in
preparation for its final approval.
Meanwhile, on March 2, 2011, the Parliament amended the renewable energy support law by
extending the incentives for hydroelectric plants with a capacity of more than 30 MW with a
catchment basin of less than 50,000 cubic meters or with existing dams covering less than 1
hectare.
On August 8, 2011, the Mexican Energy Authority (CRE) published its call for participation in
the “Open Season” procedure for awarding transport capacity for wind plants (in Oaxaca,
Tamaulipas and Baja California) and hydroelectric plants (in Puebla).
Romania
Renewable energy support law
On June 3, 2011, the Romanian government formally transmitted the notification to the
Competition Directorate General for the purposes of approval of the renewable energy
support law, which was approved by the European Commission on July 13, 2011.
On October 12, 2011, the Romanian government approved Law 220/2008 concerning
support for renewable energy.
Spain
Remuneration for photovoltaic plants
On July 20, 2011, the Spanish government published the results of the second convocatoria
of 2011. Based on the capacity registered, the quarterly rates that will apply to plants
registered in the third convocatoria of 2011 were recalculated as follows: for integrated
plants, €281.3/MWh for those of less than or equal to 20 kW and €198.4/MWh for those of
more than 20 kW; for ground installations, €130.3/MWh.

Enel – Interim Financial Report at September 30, 2011 71
The Ministry of Industry, Tourism and Trade published the consultation on the new National
Energy Plan introducing a revised target for generation from renewable resources by 2020
under the National Renewable Energy Action Plan.
Peru
Renewable energy auctions
On March 23, 2011, the Ministry for Energy and Mineral Resources published Supreme
Decree 012-2011, which amends the rules for renewable resource auctions in order to
improve the operation of the auctions in the light of the results achieved in 2010. Under the
provisions of the decree, on April 28, 2011, a new auction was undertaken for the award of
nearly 2,000 GWh of renewable output.
Distributed and renewables generation
On July 6, 2011, the Ministry of Energy and Mines published a draft regulation on distributed
generation from renewable resources and from non-renewable resources up to 20 MW.
In addition, on July 21, 2011, the tax benefit (accelerated depreciation) for hydroelectric and
renewables plants, originally introduced by Decree Law no. 1058 of 2008, was extended
through the end of 2020.
United States
Renewable energy support law
On January 13, 2011, the California Public Utilities Commission voted to authorize the
trading of tradable renewable energy credits in order to reach the target of 33% of electricity
generation from renewable resources by 2020. The utilities have until December 31, 2013 to
use credits to satisfy up to 25% of their obligation. On April 12, 2011, the governor of
California signed a law requiring all utilities to meet the 33% target by 2020.

Enel – Interim Financial Report at September 30, 2011 72
Outlook
Developments in the first nine months of 2011 confirmed the rapid growth in demand for
electricity in Latin America, Eastern Europe and Russia. By contrast, the macroeconomic
situation in Europe was characterized by a high degree of uncertainty in the financial markets
and a weakening of economic activity, which in the euro area are expected produce
downward revisions of growth forecasts.
In this environment, Enel’s scale and geographical diversification continue to be crucial
factors in the Group’s pursuit of is strategic objectives.
More specifically, Enel will continue to benefit from rising margins thanks to new generation
capacity in Russia, in the Iberian peninsula and in renewables, as well as from the
contribution of efficiency enhancement programs and improvements in operating cash flow.
All of this, together the other programs introduced to improve operations, enables us to
confirm the results expected for 2011 as a whole, excluding the effects of the changes in the
rules governing the so-called “Robin Hood Tax” in Italy.
Enel – Interim Financial Report at September 30, 2011 73
Consolidated financial statements
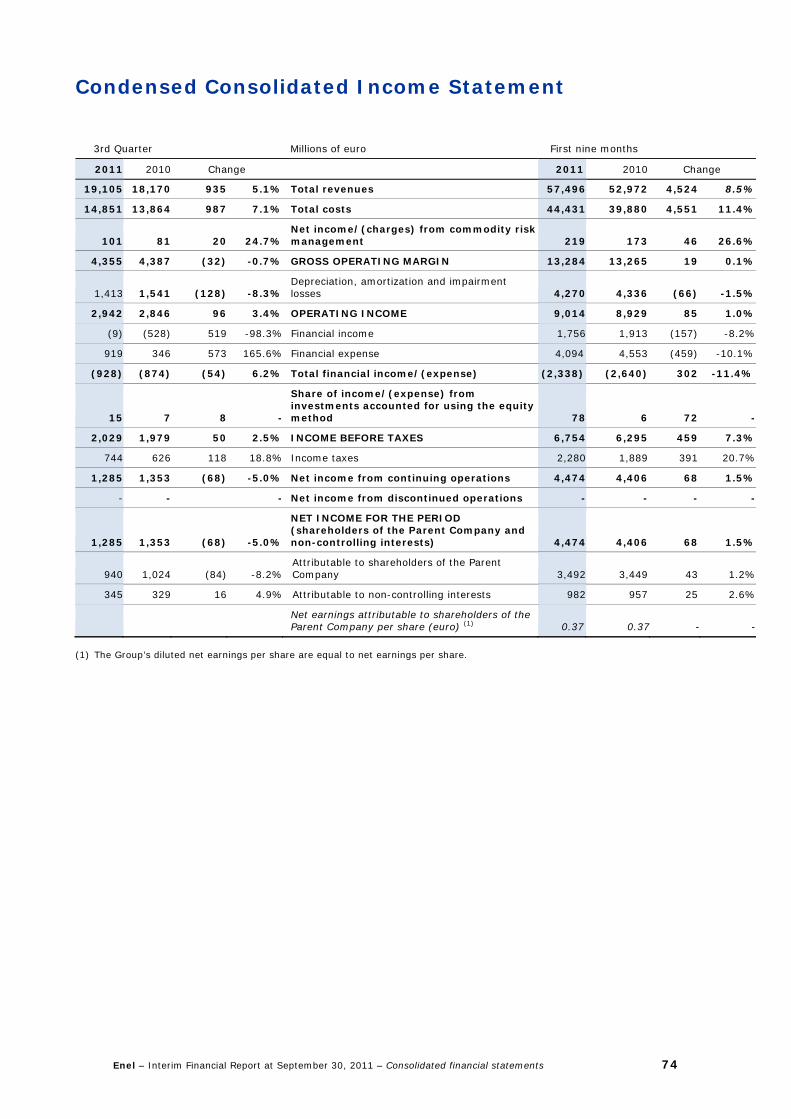
Condensed Consolidated Income Statement
3rd Quarter Millions of euro First nine months
2011 2010 Change 2011 2010 Change
19,105 18,170 935 5.1% Total revenues 57,496 52,972 4,524 8.5%
14,851 13,864 987 7.1% Total costs 44,431 39,880 4,551 11.4%
101 81 20 24.7%Net income/(charges) from commodity risk management 219 173 46 26.6%
4,355 4,387 (32) -0.7% GROSS OPERATING MARGIN 13,284 13,265 19 0.1%
1,413 1,541 (128) -8.3%Depreciation, amortization and impairment losses 4,270 4,336 (66) -1.5%
2,942 2,846 96 3.4% OPERATING INCOME 9,014 8,929 85 1.0%
(9) (528) 519 -98.3% Financial income 1,756 1,913 (157) -8.2%
919 346 573 165.6% Financial expense 4,094 4,553 (459) -10.1%
(928) (874) (54) 6.2% Total financial income/(expense) (2,338) (2,640) 302 -11.4%
15 7 8 -
Share of income/(expense) from investments accounted for using the equity method 78 6 72 -
2,029 1,979 50 2.5% INCOME BEFORE TAXES 6,754 6,295 459 7.3%
744 626 118 18.8% Income taxes 2,280 1,889 391 20.7%
1,285 1,353 (68) -5.0% Net income from continuing operations 4,474 4,406 68 1.5%
- - - Net income from discontinued operations - - - -
1,285 1,353 (68) -5.0%
NET INCOME FOR THE PERIOD (shareholders of the Parent Company and non-controlling interests) 4,474 4,406 68 1.5%
940 1,024 (84) -8.2%Attributable to shareholders of the Parent Company 3,492 3,449 43 1.2%
345 329 16 4.9% Attributable to non-controlling interests 982 957 25 2.6%
Net earnings attributable to shareholders of the Parent Company per share (euro) (1) 0.37 0.37 - -
(1) The Group’s diluted net earnings per share are equal to net earnings per share.
Enel – Interim Financial Report at September 30, 2011 – Consolidated financial statements 74
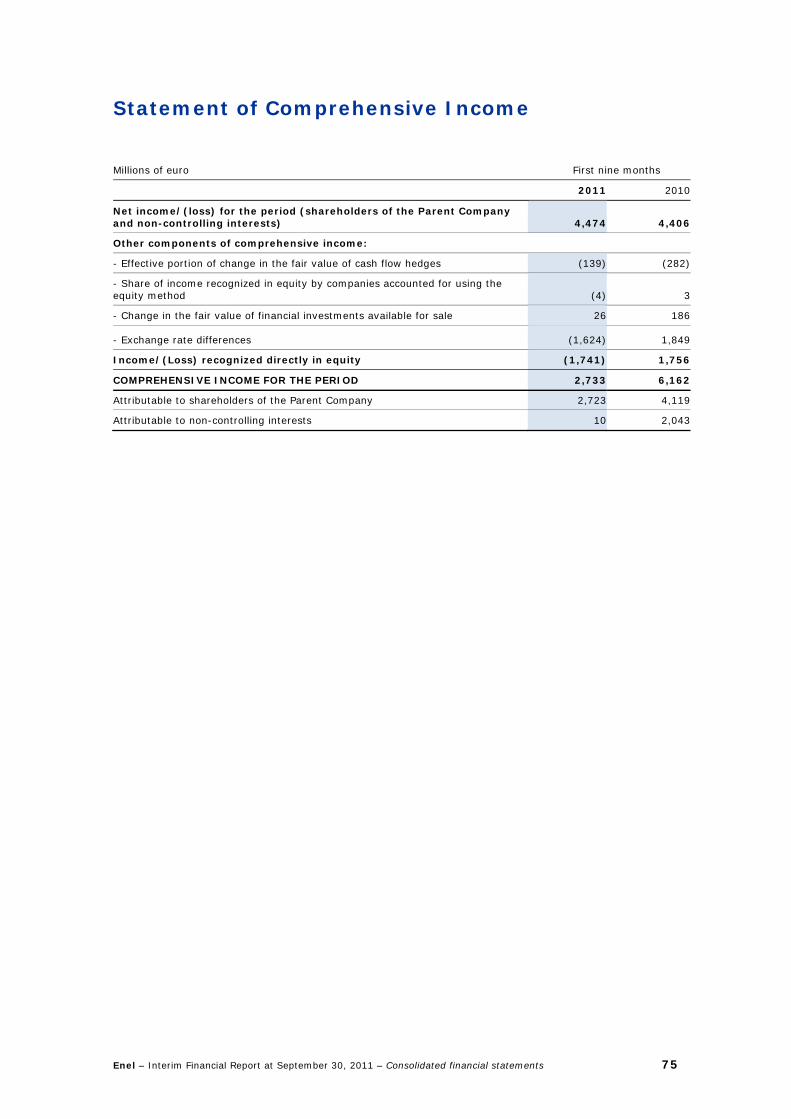
Enel – Interim Financial Report at September 30, 2011 – Consolidated financial statements 75
Statement of Comprehensive Income
Millions of euro First nine months
2011 2010
Net income/(loss) for the period (shareholders of the Parent Company and non-controlling interests) 4,474 4,406
Other components of comprehensive income:
- Effective portion of change in the fair value of cash flow hedges (139) (282)
- Share of income recognized in equity by companies accounted for using the equity method (4) 3
- Change in the fair value of financial investments available for sale 26 186
- Exchange rate differences (1,624) 1,849
Income/(Loss) recognized directly in equity (1,741) 1,756
COMPREHENSIVE INCOME FOR THE PERIOD 2,733 6,162
Attributable to shareholders of the Parent Company 2,723 4,119
Attributable to non-controlling interests 10 2,043
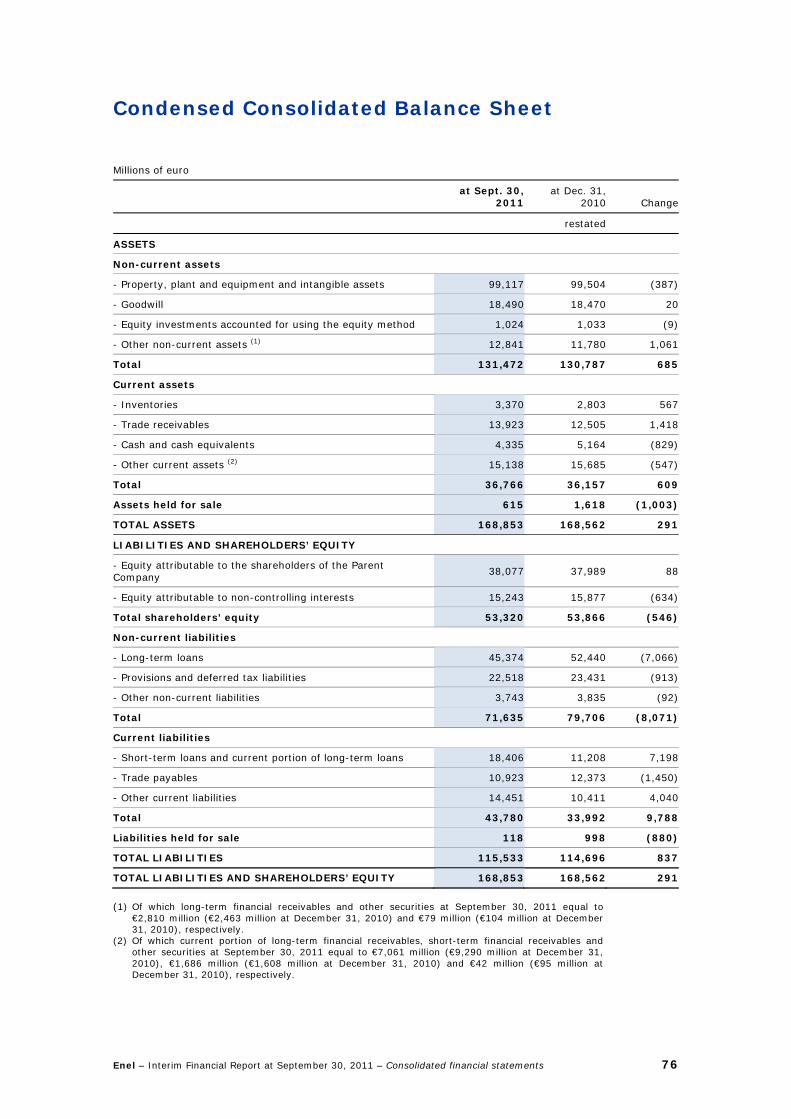
Enel – Interim Financial Report at September 30, 2011 – Consolidated financial statements 76
Condensed Consolidated Balance Sheet
Millions of euro
at Sept. 30,
2011at Dec. 31,
2010 Change
restated
ASSETS
Non-current assets
- Property, plant and equipment and intangible assets 99,117 99,504 (387)
- Goodwill 18,490 18,470 20
- Equity investments accounted for using the equity method 1,024 1,033 (9)
- Other non-current assets (1) 12,841 11,780 1,061
Total 131,472 130,787 685
Current assets
- Inventories 3,370 2,803 567
- Trade receivables 13,923 12,505 1,418
- Cash and cash equivalents 4,335 5,164 (829)
- Other current assets (2) 15,138 15,685 (547)
Total 36,766 36,157 609
Assets held for sale 615 1,618 (1,003)
TOTAL ASSETS 168,853 168,562 291
LIABILITIES AND SHAREHOLDERS’ EQUITY
- Equity attributable to the shareholders of the Parent Company
38,077 37,989 88
- Equity attributable to non-controlling interests 15,243 15,877 (634)
Total shareholders’ equity 53,320 53,866 (546)
Non-current liabilities
- Long-term loans 45,374 52,440 (7,066)
- Provisions and deferred tax liabilities 22,518 23,431 (913)
- Other non-current liabilities 3,743 3,835 (92)
Total 71,635 79,706 (8,071)
Current liabilities
- Short-term loans and current portion of long-term loans 18,406 11,208 7,198
- Trade payables 10,923 12,373 (1,450)
- Other current liabilities 14,451 10,411 4,040
Total 43,780 33,992 9,788
Liabilities held for sale 118 998 (880)
TOTAL LIABILITIES 115,533 114,696 837
TOTAL LIABILITIES AND SHAREHOLDERS’ EQUITY 168,853 168,562 291
(1) Of which long-term financial receivables and other securities at September 30, 2011 equal to
€2,810 million (€2,463 million at December 31, 2010) and €79 million (€104 million at December 31, 2010), respectively.
(2) Of which current portion of long-term financial receivables, short-term financial receivables and other securities at September 30, 2011 equal to €7,061 million (€9,290 million at December 31, 2010), €1,686 million (€1,608 million at December 31, 2010) and €42 million (€95 million at December 31, 2010), respectively.
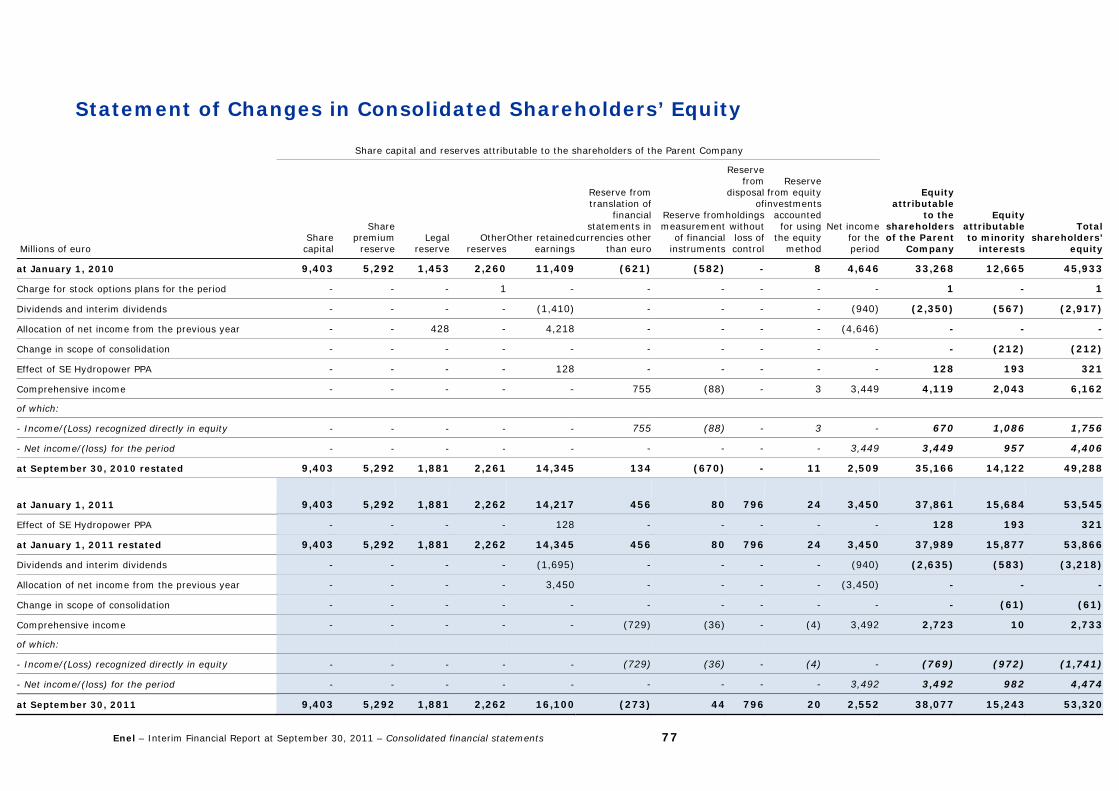
Enel – Interim Financial Report at September 30, 2011 – Consolidated financial statements 77
Statement of Changes in Consolidated Shareholders’ Equity
Share capital and reserves attributable to the shareholders of the Parent Company
Millions of euro Sharecapital
Share premium
reserveLegal
reserveOther
reservesOther retained
earnings
Reserve from translation of
financial statements in
currencies other than euro
Reserve from measurement
of financial instruments
Reserve from
disposal of
holdings without loss of control
Reserve from equity investments
accounted for using
the equity method
Net income for the period
Equity attributable
to the shareholders of the Parent
Company
Equity attributable to minority
interests
Total shareholders’
equity
at January 1, 2010 9,403 5,292 1,453 2,260 11,409 (621) (582) - 8 4,646 33,268 12,665 45,933
Charge for stock options plans for the period - - - 1 - - - - - - 1 - 1
Dividends and interim dividends - - - - (1,410) - - - - (940) (2,350) (567) (2,917)
Allocation of net income from the previous year - - 428 - 4,218 - - - - (4,646) - - -
Change in scope of consolidation - - - - - - - - - - - (212) (212)
Effect of SE Hydropower PPA - - - - 128 - - - - - 128 193 321
Comprehensive income - - - - - 755 (88) - 3 3,449 4,119 2,043 6,162
of which:
- Income/(Loss) recognized directly in equity - - - - - 755 (88) - 3 - 670 1,086 1,756
- Net income/(loss) for the period - - - - - - -- - 3,449 3,449 957 4,406
at September 30, 2010 restated 9,403 5,292 1,881 2,261 14,345 134 (670) - 11 2,509 35,166 14,122 49,288
at January 1, 2011 9,403 5,292 1,881 2,262 14,217 456 80 796 24 3,450 37,861 15,684 53,545
Effect of SE Hydropower PPA - - - - 128 - - - - - 128 193 321
at January 1, 2011 restated 9,403 5,292 1,881 2,262 14,345 456 80 796 24 3,450 37,989 15,877 53,866
Dividends and interim dividends - - - - (1,695) - - - - (940) (2,635) (583) (3,218)
Allocation of net income from the previous year - - - - 3,450 - - - - (3,450) - - -
Change in scope of consolidation - - - - - - - - - - - (61) (61)
Comprehensive income - - - - - (729) (36) - (4) 3,492 2,723 10 2,733
of which:
- Income/(Loss) recognized directly in equity - - - - - (729) (36) - (4) - (769) (972) (1,741)
- Net income/(loss) for the period - - - - - - - - - 3,492 3,492 982 4,474
at September 30, 2011 9,403 5,292 1,881 2,262 16,100 (273) 44 796 20 2,552 38,077 15,243 53,320
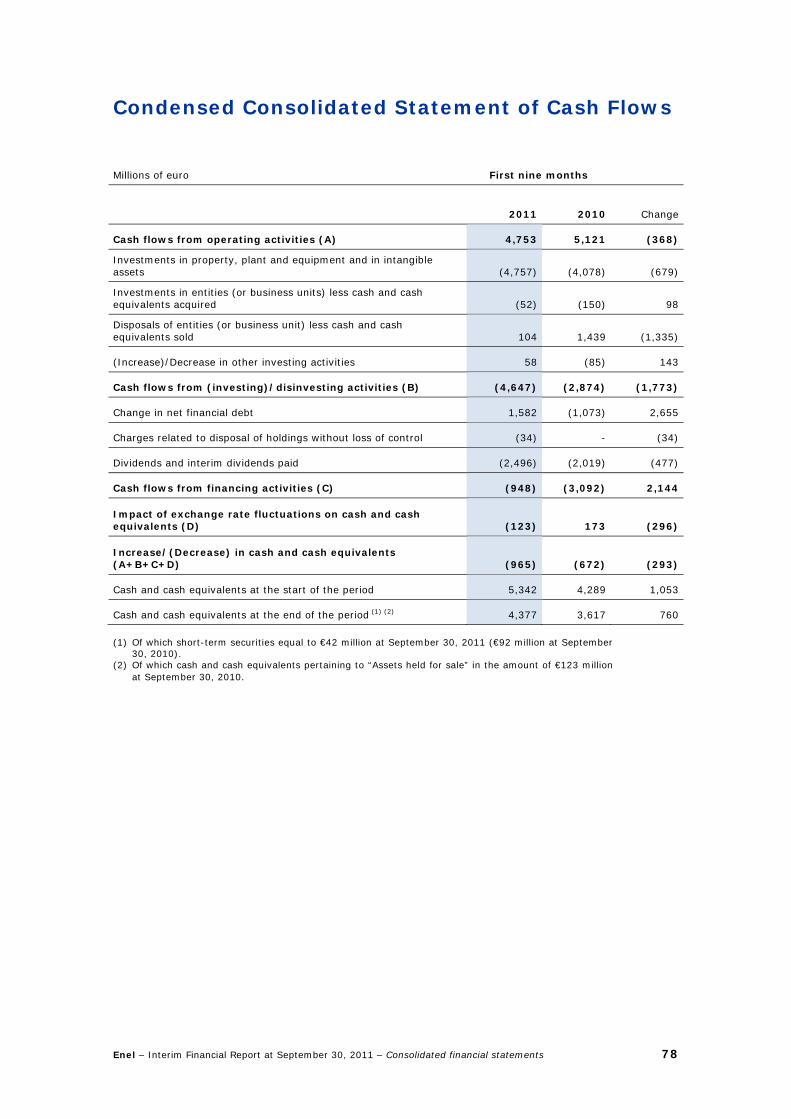
Enel – Interim Financial Report at September 30, 2011 – Consolidated financial statements 78
Condensed Consolidated Statement of Cash Flows
Millions of euro First nine months
2011 2010 Change
Cash flows from operating activities (A) 4,753 5,121 (368)
Investments in property, plant and equipment and in intangible assets (4,757) (4,078) (679)
Investments in entities (or business units) less cash and cash equivalents acquired (52) (150) 98
Disposals of entities (or business unit) less cash and cash equivalents sold 104 1,439 (1,335)
(Increase)/Decrease in other investing activities 58 (85) 143
Cash flows from (investing)/disinvesting activities (B) (4,647) (2,874) (1,773)
Change in net financial debt 1,582 (1,073) 2,655
Charges related to disposal of holdings without loss of control (34) - (34)
Dividends and interim dividends paid (2,496) (2,019) (477)
Cash flows from financing activities (C) (948) (3,092) 2,144
Impact of exchange rate fluctuations on cash and cash equivalents (D) (123) 173 (296)
Increase/(Decrease) in cash and cash equivalents (A+B+C+D) (965) (672) (293)
Cash and cash equivalents at the start of the period 5,342 4,289 1,053
Cash and cash equivalents at the end of the period (1) (2) 4,377 3,617 760
(1) Of which short-term securities equal to €42 million at September 30, 2011 (€92 million at September
30, 2010). (2) Of which cash and cash equivalents pertaining to “Assets held for sale” in the amount of €123 million
at September 30, 2010.
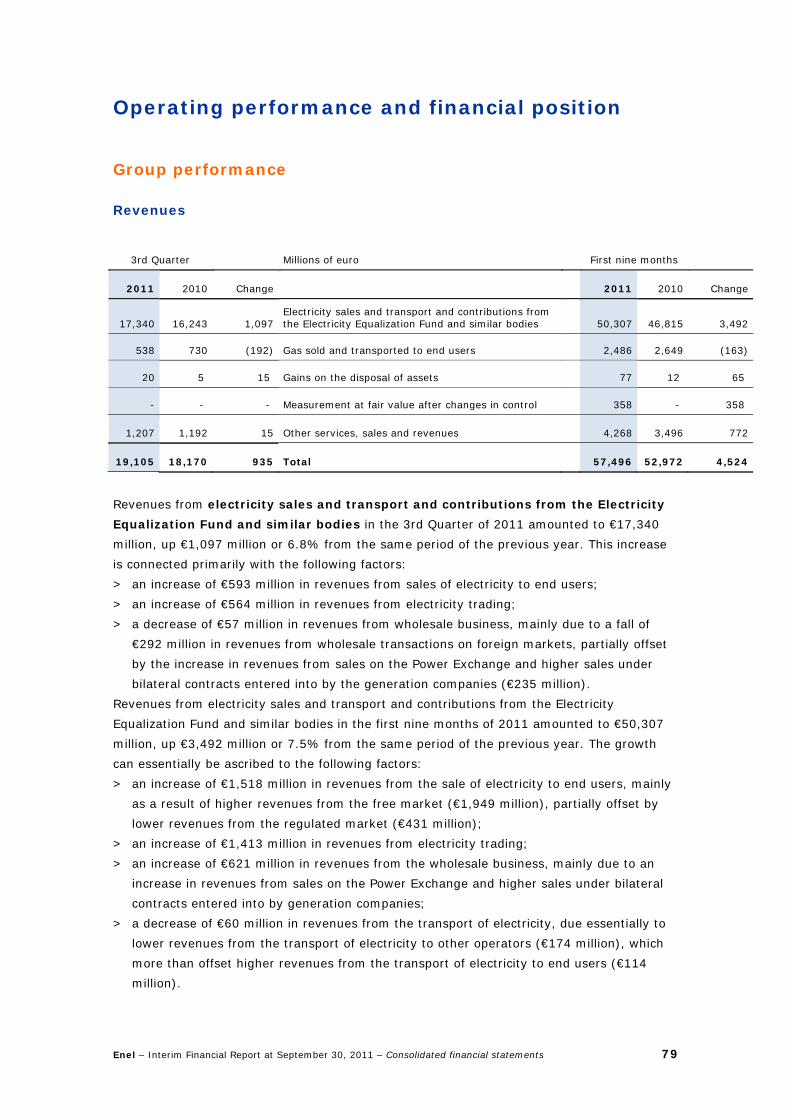
Enel – Interim Financial Report at September 30, 2011 – Consolidated financial statements 79
Operating performance and financial position
Group performance
Revenues
3rd Quarter Millions of euro First nine months
2011 2010 Change 2011 2010 Change
17,340 16,243 1,097 Electricity sales and transport and contributions from the Electricity Equalization Fund and similar bodies
50,307 46,815 3,492
538 730 (192) Gas sold and transported to end users 2,486 2,649 (163)
20 5 15 Gains on the disposal of assets 77 12 65
- - - Measurement at fair value after changes in control 358 - 358
1,207 1,192 15 Other services, sales and revenues 4,268 3,496 772
19,105 18,170 935 Total 57,496 52,972 4,524
Revenues from electricity sales and transport and contributions from the Electricity
Equalization Fund and similar bodies in the 3rd Quarter of 2011 amounted to €17,340
million, up €1,097 million or 6.8% from the same period of the previous year. This increase
is connected primarily with the following factors:
> an increase of €593 million in revenues from sales of electricity to end users;
> an increase of €564 million in revenues from electricity trading;
> a decrease of €57 million in revenues from wholesale business, mainly due to a fall of
€292 million in revenues from wholesale transactions on foreign markets, partially offset
by the increase in revenues from sales on the Power Exchange and higher sales under
bilateral contracts entered into by the generation companies (€235 million).
Revenues from electricity sales and transport and contributions from the Electricity
Equalization Fund and similar bodies in the first nine months of 2011 amounted to €50,307
million, up €3,492 million or 7.5% from the same period of the previous year. The growth
can essentially be ascribed to the following factors:
> an increase of €1,518 million in revenues from the sale of electricity to end users, mainly
as a result of higher revenues from the free market (€1,949 million), partially offset by
lower revenues from the regulated market (€431 million);
> an increase of €1,413 million in revenues from electricity trading;
> an increase of €621 million in revenues from the wholesale business, mainly due to an
increase in revenues from sales on the Power Exchange and higher sales under bilateral
contracts entered into by generation companies;
> a decrease of €60 million in revenues from the transport of electricity, due essentially to
lower revenues from the transport of electricity to other operators (€174 million), which
more than offset higher revenues from the transport of electricity to end users (€114
million).
Enel – Interim Financial Report at September 30, 2011 – Consolidated financial statements 80
Revenues from gas sold and transported to end users in the 3rd Quarter of 2011
amounted to €538 million, a decrease of €192 million or 26.3% from the same period of the
previous year, reflecting lower residential and commercial consumption. In the first nine
months of 2011 revenues from gas sold and transported amounted to €2,486 million, down
€163 million or 6.2% on the year-earlier period, mainly due to the decrease in volumes sold
as a result of warmer weather, which more than offset the increase in average sales prices.
Gains on the disposal of assets in the first nine months of 2011 were mainly accounted
for by the gain from the sale of a portion of the assets of Enel Unión Fenosa Renovables to
Gas Natural (€44 million), the gains on the disposals of Compañía Americana de
Multiservicios (CAM) and Synapsis IT Soluciones y Servicios (Synapsis) (€15 million) and the
gains on the sales of Enel Maritza East 3, Enel Operations Bulgaria and their parent holding
companies (€12 million).
Gains from measurement at fair value after changes in control came to €358 million in
the first nine months of 2011 (no such item for the corresponding period of 2010). The gain
was generated by the adjustment (in the 1st Half of 2011) of the value of Group assets and
liabilities to their fair value, specifically: (i) after the loss of control of Hydro Dolomiti Enel as
a result in the change in the corporate governance structure, the residual assets and
liabilities pertaining to the Group (€237 million); (ii) with respect to those assets and
liabilities already owned by Enel prior to obtaining complete control of Enel Unión Fenosa
Renovables (€76 million), Sociedad Eólica de Andalucía (€23 million) and TP - Sociedade
Térmica Portuguesa – TP (€22 million).
Revenues from other services, sales and revenues came to €1,207 million in the 3rd
Quarter of 2011, virtually unchanged compared with the year-earlier period.
In the first nine months of 2011 revenues from other services, sales and revenues totaled
€4,268 million, up €772 million on the year-earlier period.
This increase was mainly due to a rise in sales of fuel for trading, including shipping services
(€344 million), the increase in connection fees (€155 million), an increase in revenues from
engineering activities in the Iberian peninsula (€115 million), as well as the grant for
recognition of unit 4 of the Torrevaldaliga Nord power plant as a “new entrant” to the
emissions trading scheme.
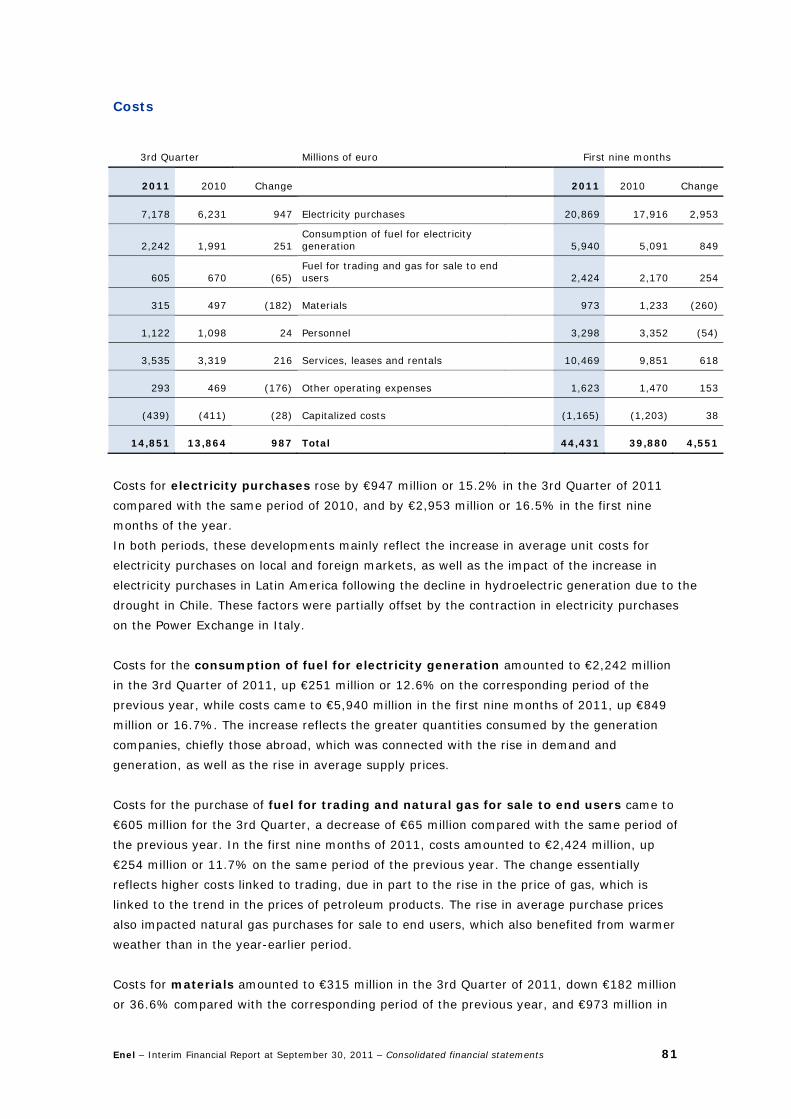
Enel – Interim Financial Report at September 30, 2011 – Consolidated financial statements 81
Costs
3rd Quarter Millions of euro First nine months
2011 2010 Change 2011 2010 Change
7,178 6,231 947 Electricity purchases 20,869 17,916 2,953
2,242 1,991 251 Consumption of fuel for electricity generation 5,940 5,091 849
605 670 (65) Fuel for trading and gas for sale to end users 2,424 2,170 254
315 497 (182) Materials 973 1,233 (260)
1,122 1,098 24 Personnel 3,298 3,352 (54)
3,535 3,319 216 Services, leases and rentals 10,469 9,851 618
293 469 (176) Other operating expenses 1,623 1,470 153
(439) (411) (28) Capitalized costs (1,165) (1,203) 38
14,851 13,864 987 Total 44,431 39,880 4,551
Costs for electricity purchases rose by €947 million or 15.2% in the 3rd Quarter of 2011
compared with the same period of 2010, and by €2,953 million or 16.5% in the first nine
months of the year.
In both periods, these developments mainly reflect the increase in average unit costs for
electricity purchases on local and foreign markets, as well as the impact of the increase in
electricity purchases in Latin America following the decline in hydroelectric generation due to the
drought in Chile. These factors were partially offset by the contraction in electricity purchases
on the Power Exchange in Italy.
Costs for the consumption of fuel for electricity generation amounted to €2,242 million
in the 3rd Quarter of 2011, up €251 million or 12.6% on the corresponding period of the
previous year, while costs came to €5,940 million in the first nine months of 2011, up €849
million or 16.7%. The increase reflects the greater quantities consumed by the generation
companies, chiefly those abroad, which was connected with the rise in demand and
generation, as well as the rise in average supply prices.
Costs for the purchase of fuel for trading and natural gas for sale to end users came to
€605 million for the 3rd Quarter, a decrease of €65 million compared with the same period of
the previous year. In the first nine months of 2011, costs amounted to €2,424 million, up
€254 million or 11.7% on the same period of the previous year. The change essentially
reflects higher costs linked to trading, due in part to the rise in the price of gas, which is
linked to the trend in the prices of petroleum products. The rise in average purchase prices
also impacted natural gas purchases for sale to end users, which also benefited from warmer
weather than in the year-earlier period.
Costs for materials amounted to €315 million in the 3rd Quarter of 2011, down €182 million
or 36.6% compared with the corresponding period of the previous year, and €973 million in
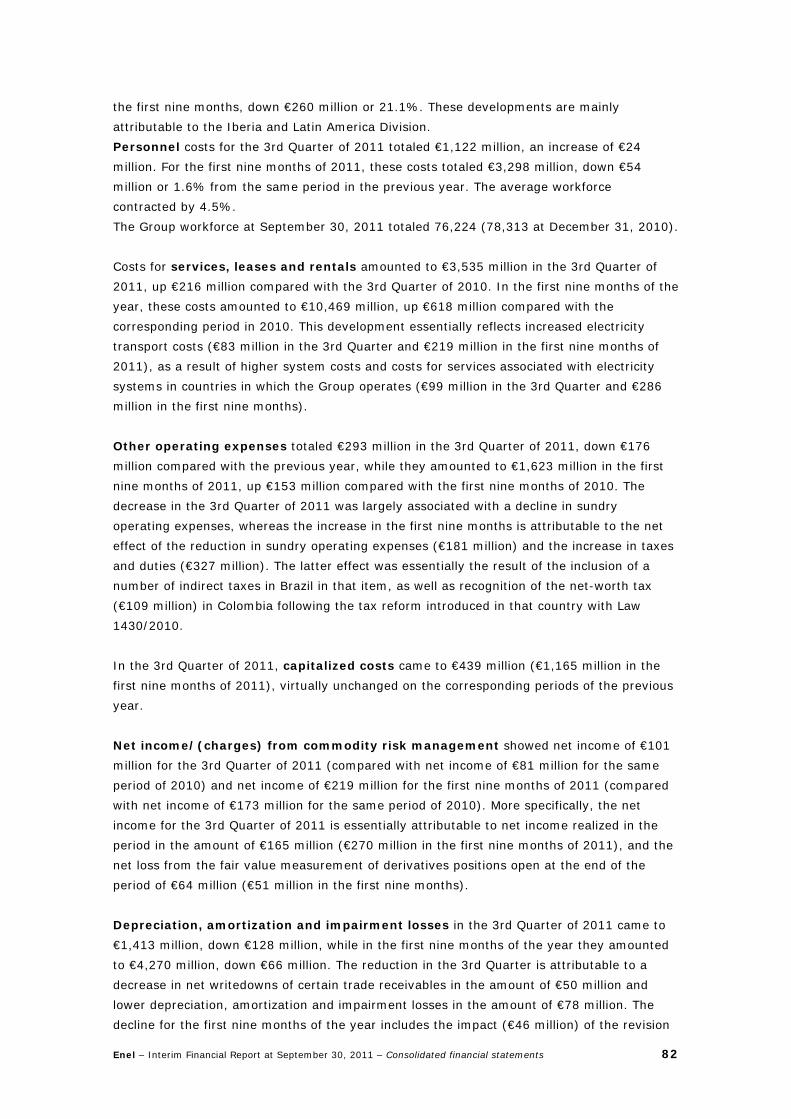
Enel – Interim Financial Report at September 30, 2011 – Consolidated financial statements 82
the first nine months, down €260 million or 21.1%. These developments are mainly
attributable to the Iberia and Latin America Division.
Personnel costs for the 3rd Quarter of 2011 totaled €1,122 million, an increase of €24
million. For the first nine months of 2011, these costs totaled €3,298 million, down €54
million or 1.6% from the same period in the previous year. The average workforce
contracted by 4.5%.
The Group workforce at September 30, 2011 totaled 76,224 (78,313 at December 31, 2010).
Costs for services, leases and rentals amounted to €3,535 million in the 3rd Quarter of
2011, up €216 million compared with the 3rd Quarter of 2010. In the first nine months of the
year, these costs amounted to €10,469 million, up €618 million compared with the
corresponding period in 2010. This development essentially reflects increased electricity
transport costs (€83 million in the 3rd Quarter and €219 million in the first nine months of
2011), as a result of higher system costs and costs for services associated with electricity
systems in countries in which the Group operates (€99 million in the 3rd Quarter and €286
million in the first nine months).
Other operating expenses totaled €293 million in the 3rd Quarter of 2011, down €176
million compared with the previous year, while they amounted to €1,623 million in the first
nine months of 2011, up €153 million compared with the first nine months of 2010. The
decrease in the 3rd Quarter of 2011 was largely associated with a decline in sundry
operating expenses, whereas the increase in the first nine months is attributable to the net
effect of the reduction in sundry operating expenses (€181 million) and the increase in taxes
and duties (€327 million). The latter effect was essentially the result of the inclusion of a
number of indirect taxes in Brazil in that item, as well as recognition of the net-worth tax
(€109 million) in Colombia following the tax reform introduced in that country with Law
1430/2010.
In the 3rd Quarter of 2011, capitalized costs came to €439 million (€1,165 million in the
first nine months of 2011), virtually unchanged on the corresponding periods of the previous
year.
Net income/(charges) from commodity risk management showed net income of €101
million for the 3rd Quarter of 2011 (compared with net income of €81 million for the same
period of 2010) and net income of €219 million for the first nine months of 2011 (compared
with net income of €173 million for the same period of 2010). More specifically, the net
income for the 3rd Quarter of 2011 is essentially attributable to net income realized in the
period in the amount of €165 million (€270 million in the first nine months of 2011), and the
net loss from the fair value measurement of derivatives positions open at the end of the
period of €64 million (€51 million in the first nine months).
Depreciation, amortization and impairment losses in the 3rd Quarter of 2011 came to
€1,413 million, down €128 million, while in the first nine months of the year they amounted
to €4,270 million, down €66 million. The reduction in the 3rd Quarter is attributable to a
decrease in net writedowns of certain trade receivables in the amount of €50 million and
lower depreciation, amortization and impairment losses in the amount of €78 million. The
decline for the first nine months of the year includes the impact (€46 million) of the revision
Enel – Interim Financial Report at September 30, 2011 – Consolidated financial statements 83
of the useful lives of the plants of Compañía de Interconexión Energética (CIEN), a company
providing interconnection services between Brazil and Argentina, as well as the effect of the
change in the scope of consolidation (essentially attributable to the disposal of the Spanish
high-voltage grid) in the amount of €41 million. The decrease was partially offset by
increased depreciation as a result of the rise in the installed capacity of renewables plants.
Operating income for the 3rd Quarter of 2011 amounted to €2,942 million, up €96 million
or 3.4% compared with the corresponding period of the previous year. For the first nine
months of 2011, operating income amounted to €9,014 million, an increase of €85 million or
1.0%.
Net financial expense increased by a total of €54 million in the 3rd Quarter of 2011 and
decreased by €302 million in the first nine months of the year. More specifically,
developments in interest rates and exchange rates (net of hedges) and the change in
average net financial debt between the two periods under review did not have a significant
impact on net financial expense overall. The decline in the first nine months is therefore
mainly attributable to the impact of the adjustment recognized in the 2010 in respect of
interest for the deficit of the Spanish peninsular and extra-peninsular electrical system (€104
million), the overall reduction in charge in respect of the accretion of provisions (€62
million), as well as the recognition in the 1st Half of 2011 of default interest relating to a
decision resolving a tax dispute in the Group’s favor in Spain (€63 million).
The share of income/(expense) from investments accounted for using the equity
method showed net income of €78 million in the first nine months of 2011, up €72 million
compared with the first nine months of the previous year.
Income taxes for the 3rd Quarter of 2011 amounted to €744 million, while the tax liability
for the first nine months of 2011 was an estimated €2,280 million, equal to 33.8% of taxable
income, compared with 30.0% in the first nine months of 2010. This reflects the adjustment
of current and deferred tax following the change to the rules governing the “Robin Hood
Tax”.
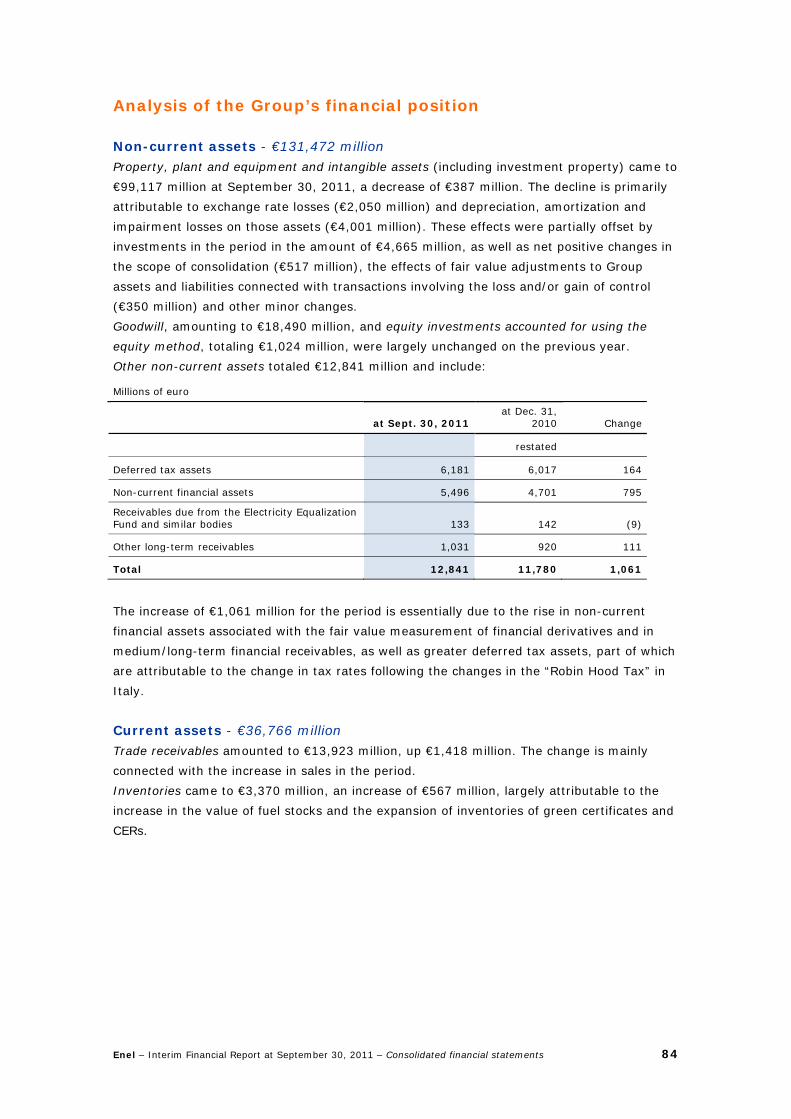
Enel – Interim Financial Report at September 30, 2011 – Consolidated financial statements 84
Analysis of the Group’s financial position
Non-current assets - €131,472 million Property, plant and equipment and intangible assets (including investment property) came to
€99,117 million at September 30, 2011, a decrease of €387 million. The decline is primarily
attributable to exchange rate losses (€2,050 million) and depreciation, amortization and
impairment losses on those assets (€4,001 million). These effects were partially offset by
investments in the period in the amount of €4,665 million, as well as net positive changes in
the scope of consolidation (€517 million), the effects of fair value adjustments to Group
assets and liabilities connected with transactions involving the loss and/or gain of control
(€350 million) and other minor changes.
Goodwill, amounting to €18,490 million, and equity investments accounted for using the
equity method, totaling €1,024 million, were largely unchanged on the previous year.
Other non-current assets totaled €12,841 million and include:
Millions of euro
at Sept. 30, 2011 at Dec. 31,
2010 Change
restated
Deferred tax assets 6,181 6,017 164
Non-current financial assets 5,496 4,701 795
Receivables due from the Electricity Equalization Fund and similar bodies 133 142 (9)
Other long-term receivables 1,031 920 111
Total 12,841 11,780 1,061
The increase of €1,061 million for the period is essentially due to the rise in non-current
financial assets associated with the fair value measurement of financial derivatives and in
medium/long-term financial receivables, as well as greater deferred tax assets, part of which
are attributable to the change in tax rates following the changes in the “Robin Hood Tax” in
Italy.
Current assets - €36,766 million Trade receivables amounted to €13,923 million, up €1,418 million. The change is mainly
connected with the increase in sales in the period.
Inventories came to €3,370 million, an increase of €567 million, largely attributable to the
increase in the value of fuel stocks and the expansion of inventories of green certificates and
CERs.

Enel – Interim Financial Report at September 30, 2011 – Consolidated financial statements 85
Other current assets, which total €15,138 million, break down as follows:
Millions of euro
at Sept. 30,
2011 at Dec. 31, 2010 Change
restated
Current financial assets 10,544 11,922 (1,378)
Tax receivables 2,049 1,587 462
Receivables due from the Electricity Equalization Fund and similar bodies 1,153 630 523
Other short-term financial receivables 1,392 1,546 (154)
Total 15,138 15,685 (547)
The decrease of €547 million in the period is attributable to the following main factors:
> a decrease of €1,378 million in current financial assets, mainly due to the reimbursement
(for a total of €4,329 million) of financial receivables in respect of the rate deficit under
the securitization plan launched by the Spanish government. This decrease was partially
offset by an increase in such receivables accruing in 2011 (€1,961 million) and the rise of
€841 million in financial assets in respect of derivatives;
> an increase of €462 million in tax receivables, mainly arising in respect of tax payments
on account;
> an increase of €523 million in receivables due from the Electricity Equalization Fund and
similar bodies, attributable to an increase in receivables associated with the application of
equalization mechanisms.
Assets held for sale - €615 million The item essentially reports certain assets held by Endesa in Ireland and the assets of Deval
and Vallenergie, which in view of the decisions taken by management meet the requirements
of IFRS 5 for classification here. The change compared with the situation at December 31,
2010 reflects the sale of Enel Maritza East 3, Enel Operations Bulgaria, CAM and Synapsis
and the part of the assets of Enel Unión Fenosa Renovables sold to Gas Natural.
Equity attributable to the shareholders of the Parent Company - €38,077 million The change in the first nine months of 2011 in equity attributable to the shareholders of the
Parent Company reflects the recognition of net income for the period (€3,492 million) and
the result for the first nine months of 2011 recognized directly in equity (a negative €769
million).
Non-current liabilities - €71,635 million Long-term loans totaled €45,374 million (€52,440 million at December 31, 2010), consisting
of bonds and preference shares in the amount of €34,807 million (€35,875 million at
December 31, 2010) and bank and other loans in the amount of €10,567 million (€16,565
million at December 31, 2010).
Provisions and deferred tax liabilities came to €22,518 million at September 30, 2011
(€23,431 million at December 31, 2010) and include post-employment and other employee
benefits totaling €3,085 million (€3,069 million at December 31, 2010), provisions for risks
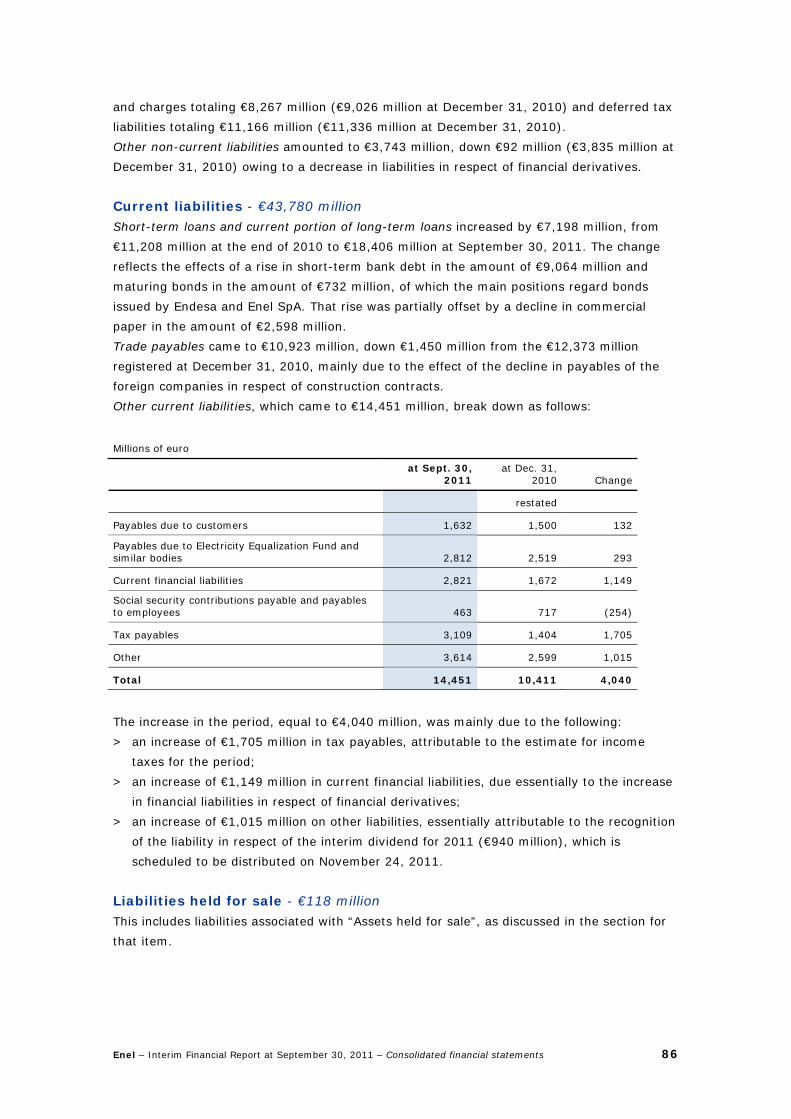
Enel – Interim Financial Report at September 30, 2011 – Consolidated financial statements 86
and charges totaling €8,267 million (€9,026 million at December 31, 2010) and deferred tax
liabilities totaling €11,166 million (€11,336 million at December 31, 2010).
Other non-current liabilities amounted to €3,743 million, down €92 million (€3,835 million at
December 31, 2010) owing to a decrease in liabilities in respect of financial derivatives.
Current liabilities - €43,780 million Short-term loans and current portion of long-term loans increased by €7,198 million, from
€11,208 million at the end of 2010 to €18,406 million at September 30, 2011. The change
reflects the effects of a rise in short-term bank debt in the amount of €9,064 million and
maturing bonds in the amount of €732 million, of which the main positions regard bonds
issued by Endesa and Enel SpA. That rise was partially offset by a decline in commercial
paper in the amount of €2,598 million.
Trade payables came to €10,923 million, down €1,450 million from the €12,373 million
registered at December 31, 2010, mainly due to the effect of the decline in payables of the
foreign companies in respect of construction contracts.
Other current liabilities, which came to €14,451 million, break down as follows:
Millions of euro
at Sept. 30,
2011 at Dec. 31,
2010 Change
restated
Payables due to customers 1,632 1,500 132
Payables due to Electricity Equalization Fund and similar bodies 2,812 2,519 293
Current financial liabilities 2,821 1,672 1,149
Social security contributions payable and payables to employees 463 717 (254)
Tax payables 3,109 1,404 1,705
Other 3,614 2,599 1,015
Total 14,451 10,411 4,040
The increase in the period, equal to €4,040 million, was mainly due to the following:
> an increase of €1,705 million in tax payables, attributable to the estimate for income
taxes for the period;
> an increase of €1,149 million in current financial liabilities, due essentially to the increase
in financial liabilities in respect of financial derivatives;
> an increase of €1,015 million on other liabilities, essentially attributable to the recognition
of the liability in respect of the interim dividend for 2011 (€940 million), which is
scheduled to be distributed on November 24, 2011.
Liabilities held for sale - €118 million This includes liabilities associated with “Assets held for sale”, as discussed in the section for
that item.
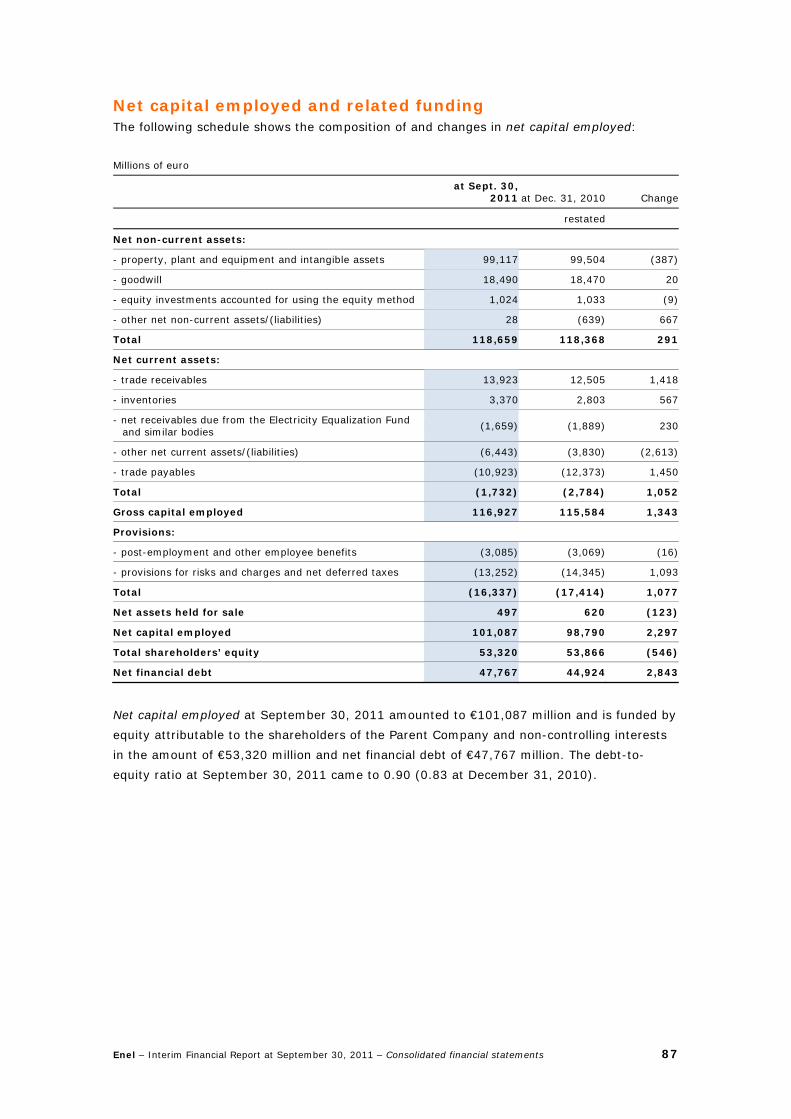
Enel – Interim Financial Report at September 30, 2011 – Consolidated financial statements 87
Net capital employed and related funding The following schedule shows the composition of and changes in net capital employed:
Millions of euro
at Sept. 30,
2011 at Dec. 31, 2010 Change
restated
Net non-current assets:
- property, plant and equipment and intangible assets 99,117 99,504 (387)
- goodwill 18,490 18,470 20
- equity investments accounted for using the equity method 1,024 1,033 (9)
- other net non-current assets/(liabilities) 28 (639) 667
Total 118,659 118,368 291
Net current assets:
- trade receivables 13,923 12,505 1,418
- inventories 3,370 2,803 567
- net receivables due from the Electricity Equalization Fund and similar bodies
(1,659) (1,889) 230
- other net current assets/(liabilities) (6,443) (3,830) (2,613)
- trade payables (10,923) (12,373) 1,450
Total (1,732) (2,784) 1,052
Gross capital employed 116,927 115,584 1,343
Provisions:
- post-employment and other employee benefits (3,085) (3,069) (16)
- provisions for risks and charges and net deferred taxes (13,252) (14,345) 1,093
Total (16,337) (17,414) 1,077
Net assets held for sale 497 620 (123)
Net capital employed 101,087 98,790 2,297
Total shareholders’ equity 53,320 53,866 (546)
Net financial debt 47,767 44,924 2,843
Net capital employed at September 30, 2011 amounted to €101,087 million and is funded by
equity attributable to the shareholders of the Parent Company and non-controlling interests
in the amount of €53,320 million and net financial debt of €47,767 million. The debt-to-
equity ratio at September 30, 2011 came to 0.90 (0.83 at December 31, 2010).
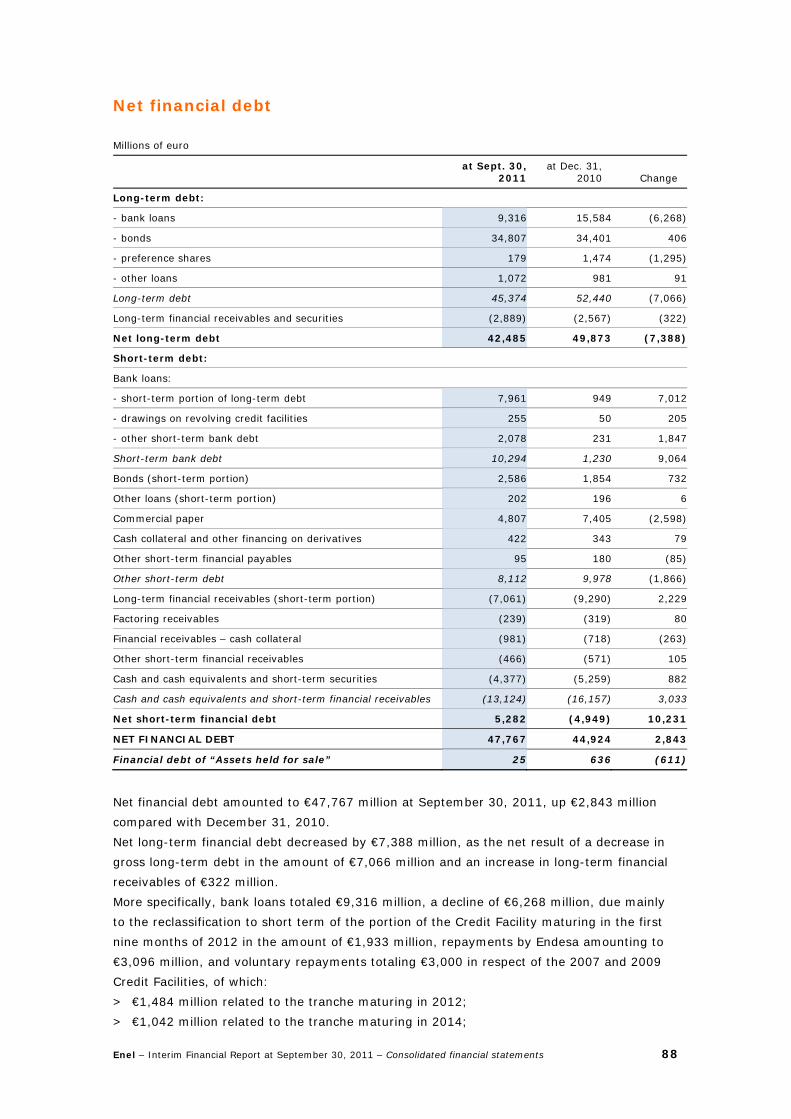
Enel – Interim Financial Report at September 30, 2011 – Consolidated financial statements 88
Net financial debt Millions of euro
at Sept. 30,
2011at Dec. 31,
2010 Change
Long-term debt:
- bank loans 9,316 15,584 (6,268)
- bonds 34,807 34,401 406
- preference shares 179 1,474 (1,295)
- other loans 1,072 981 91
Long-term debt 45,374 52,440 (7,066)
Long-term financial receivables and securities (2,889) (2,567) (322)
Net long-term debt 42,485 49,873 (7,388)
Short-term debt:
Bank loans:
- short-term portion of long-term debt 7,961 949 7,012
- drawings on revolving credit facilities 255 50 205
- other short-term bank debt 2,078 231 1,847
Short-term bank debt 10,294 1,230 9,064
Bonds (short-term portion) 2,586 1,854 732
Other loans (short-term portion) 202 196 6
Commercial paper 4,807 7,405 (2,598)
Cash collateral and other financing on derivatives 422 343 79
Other short-term financial payables 95 180 (85)
Other short-term debt 8,112 9,978 (1,866)
Long-term financial receivables (short-term portion) (7,061) (9,290) 2,229
Factoring receivables (239) (319) 80
Financial receivables – cash collateral (981) (718) (263)
Other short-term financial receivables (466) (571) 105
Cash and cash equivalents and short-term securities (4,377) (5,259) 882
Cash and cash equivalents and short-term financial receivables (13,124) (16,157) 3,033
Net short-term financial debt 5,282 (4,949) 10,231
NET FINANCIAL DEBT 47,767 44,924 2,843
Financial debt of “Assets held for sale” 25 636 (611)
Net financial debt amounted to €47,767 million at September 30, 2011, up €2,843 million
compared with December 31, 2010.
Net long-term financial debt decreased by €7,388 million, as the net result of a decrease in
gross long-term debt in the amount of €7,066 million and an increase in long-term financial
receivables of €322 million.
More specifically, bank loans totaled €9,316 million, a decline of €6,268 million, due mainly
to the reclassification to short term of the portion of the Credit Facility maturing in the first
nine months of 2012 in the amount of €1,933 million, repayments by Endesa amounting to
€3,096 million, and voluntary repayments totaling €3,000 in respect of the 2007 and 2009
Credit Facilities, of which:
> €1,484 million related to the tranche maturing in 2012;
> €1,042 million related to the tranche maturing in 2014;
Enel – Interim Financial Report at September 30, 2011 – Consolidated financial statements 89
> €474 million related to the tranche maturing in 2016.
Bonds amounted to €34,807 million, up €406 million from December 31, 2010, mainly as a
result of the issue of a €1,750 million multi-tranche bond for institutional investors,
structured as follows:
> €1,000 million fixed-rate 4.125% bond maturing July 12, 2017;
> €750 million fixed-rate 5% bond maturing July 12, 2021;
offset by the redemption of a bond issued by Enel SpA in 2004 in the amount of €750 million
and a bond issued by Slovenské elektrárne in 2004 totaling €195 million, as well as the
reclassification to current liabilities of the portion of bonds maturing within 12 months.
Preference shares amounted to €179 million at September 30, 2011, reflecting the early
redemption of preference shares totaling €1,295 million.
The €10 billion five-year revolving credit line established in April 2010 by Enel SpA and Enel
Finance International, was drawn in the amount of €1,000 million at September 30, 2011. At
the same date, the committed credit lines established by Enel SpA and Enel Finance
International had been drawn in the amount of €2,250 million.
Net short-term financial debt came to €5,282 million at September 30, 2011, a change of
€10,231 million from the net creditor position registered at end of 2010. This was the result
of a rise in short-term bank debt of €9,064 million, a decrease in other short-term debt of
€1,866 million and a decrease of €3,033 million in cash and cash equivalents and short-term
financial receivables.
Specifically, short-term bank debt rose by €9,064 million compared with December 31, 2010,
mainly as a result of the previously mentioned reclassification to short term of the portion of
the Credit Facility maturing in the first nine months of 2012 (€1,933 million) and the
utilization of committed and uncommitted credit lines by Enel SpA (€3,705 million).
Other short-term loans, totaling €8,112 million, include the issuance of commercial paper by
Enel Finance International, Internacional Endesa, Endesa Capital and Sociedade Térmica
Portuguesa in the amount of €4,807 million, as well as bonds maturing within 12 months in
the amount of €2,586 million.
Finally, cash collateral paid to counterparties in over-the-counter derivatives transactions on
interest rates, exchange rates and commodities totaled €981 million, while cash collateral
received from such counterparties amounted to €422 million.
Cash and cash equivalents and short-term financial receivables came to €13,124 million,
down €3,033 million from the end of 2010, due mainly to the securitization plan launched by
the Spanish government in 2011 for the reimbursement of the rate deficit, which led to the
receipt of about €4.3 billion.
Cash flows Cash flows from operating activities in first nine months of 2011 were positive at €4,753
million, down €368 million from the same period of the year as a result of decreased use of
cash connected with the change in net current assets and the improvement in the gross
operating margin. These factors were more than offset by the effect of exchange rate
variations on items denominated in foreign currency.
Enel – Interim Financial Report at September 30, 2011 – Consolidated financial statements 90
Cash flows from investing/disinvesting activities in the first nine months of 2011 show funds
absorbed in the amount of €4,647 million, while in the corresponding period of 2010 such
activities had absorbed liquidity totaling €2,874 million.
In particular, investments in property, plant and equipment and in intangible assets totaling
€4,757 million increased by €679 million compared with the corresponding period of the
previous year.
Investments in entities or business units, net of cash and cash equivalents acquired,
amounted to €52 million and are essentially accounted for by the acquisition by Enel Green
Power España of Sociedad Eólica de Andalucía – SEA and a further 50% stake in Sociedade
Térmica Portuguesa SA (TP). Investments in entities in the first nine months of 2010, also
net of cash and cash equivalents acquired, mainly included the effects of the acquisition by
Enel Green Power of a number of companies operating in the generation of electricity from
renewable resources in Italy, the acquisitions of Enel Longanesi Development and Padoma
Wind Power and a number of smaller acquisitions by Endesa.
In the first nine months of 2011, the disposal of entities and business units, net of cash and
cash equivalents sold, generated cash flows of €104 million, attributable to the sale of CAM
and Synapsis by Endesa and the sale of Enel Maritza East 3, Enel Operations Bulgaria and the
related holding companies by Enel Investment Holding. In the first nine months of 2010, the
item reported cash flows from the collection of the final installment in respect of the sale of
51% of SeverEnergia and advances received by Endesa for the sale of the power
transmission grids.
Cash needs generated by other investing activities in the first nine months of 2011 totaled
€17 million, essentially attributable to the acquisition of an additional stake in CESI, the
effect of which was more than offset by disposals for the period amounting to €75 million.
Cash flows from financing activities show cash absorbed in the amount of €948 million; such
activities absorbed cash in the amount of €3,092 million in the first nine months of 2010. The
change is essentially the result of the greater outlay for dividends and the increase in
financial debt, the latter being mainly associated with recent bond issues.
In the first nine months of 2011, cash flows from operating activities in the amount of
€4,753 million were used to cover the cash requirements of investing activities in the amount
of €4,647 and of financing activities in the amount of €948 million. The difference is reflected
in the decrease in cash and cash equivalents, which at September 30, 2011 came to €4,377
million, compared with €5,342 million at the end of 2010. This decrease also reflects the
negative effect of exchange rate fluctuations (€123 million).

Enel – Interim Financial Report at September 30, 2011 – Consolidated financial statements 91
Other information
Related parties As an operator in the field of generation, distribution, transport and sale of electricity, the
Enel Group provides services to a number of companies controlled by the Italian State, Enel
SpA’s controlling shareholder. In the current regulatory framework, the Enel Group concludes
transactions with Terna – Rete Elettrica Nazionale (Terna), the Single Buyer, the Energy
Services Operator, and the Energy Markets Operator (each of which is controlled either
directly or indirectly by the Ministry for the Economy and Finance).
Fees for the transport of electricity payable to Terna and certain charges paid to the Energy
Markets Operator are determined by the Authority for Electricity and Gas.
Transactions relating to purchases and sales of electricity concluded with the Energy Markets
Operator on the Power Exchange and with the Single Buyer are settled at market prices.
In particular, companies of the Sales Division acquire electricity from the Single Buyer and
settle the contracts for differences related to the allocation of CIP 6 energy with the Energy
Services Operator, in addition to paying Terna fees for the use of the national transmission
network. Companies that are a part of the Generation and Energy Management Division, in
addition to paying fees for the use of the national transmission network to Terna, carry out
electricity transactions with the Energy Markets Operator on the Power Exchange and sell
electricity to the Single Buyer. The companies of the Renewable Energy Division that operate
in Italy sell electricity to the Energy Markets Operator on the Power Exchange.
The Enel Group also acquires fuel for generation and gas for distribution and sale from Eni, a
company controlled by the Ministry for the Economy and Finance.
In November 2010, the Board of Directors of Enel SpA approved a procedure governing the
approval and execution of transactions with related parties undertaken by Enel SpA either
directly or indirectly through its subsidiaries. The procedure sets out rules designed to ensure
the transparency and procedural and substantive propriety of transactions with related
parties. It was adopted in implementation of the provisions of Article 2391-bis of the Italian
Civil Code and the implementing rules established by CONSOB. It replaced, with effect from
January 1, 2011, the rules governing transactions with related parties approved by the Board
of Directors of Enel SpA on December 19, 2006 in implementation of the recommendations
of the Corporate Governance Code for Listed Companies, the provisions of which were in
effect until December 31, 2010.

Enel – Interim Financial Report at September 30, 2011 – Consolidated financial statements 92
The following table summarizes the relationships:
Balance sheet Income statement
Millions of euro Receivables Payables Revenues Costs
at Sept. 30, 2011 First nine months
2011
Single Buyer 65 1,007 940 4,453
Energy Markets Operator 753 493 3,089 2,029
Terna 321 524 420 1,453
Eni 3 36 306 155
Electricity Services Operator 14 603 245 24
Italian Post Office 1 114 - 108
Other 56 204 457 625
Total 1,213 2,981 5,457 8,847
The following table shows transactions with associated companies outstanding at September
30, 2011 and carried out during the first nine months of the year, respectively.
Balance sheet Income statement
Millions of euro Receivables Payables Revenues Costs
at Sept. 30, 2011 First nine months
2011
Enel Rete Gas 20 41 51 200
SeverEnergia 88 - 3 1
Elica 2 2 - - -
CESI - 5 - 12
Other companies 27 10 16 -
Total 137 56 70 213
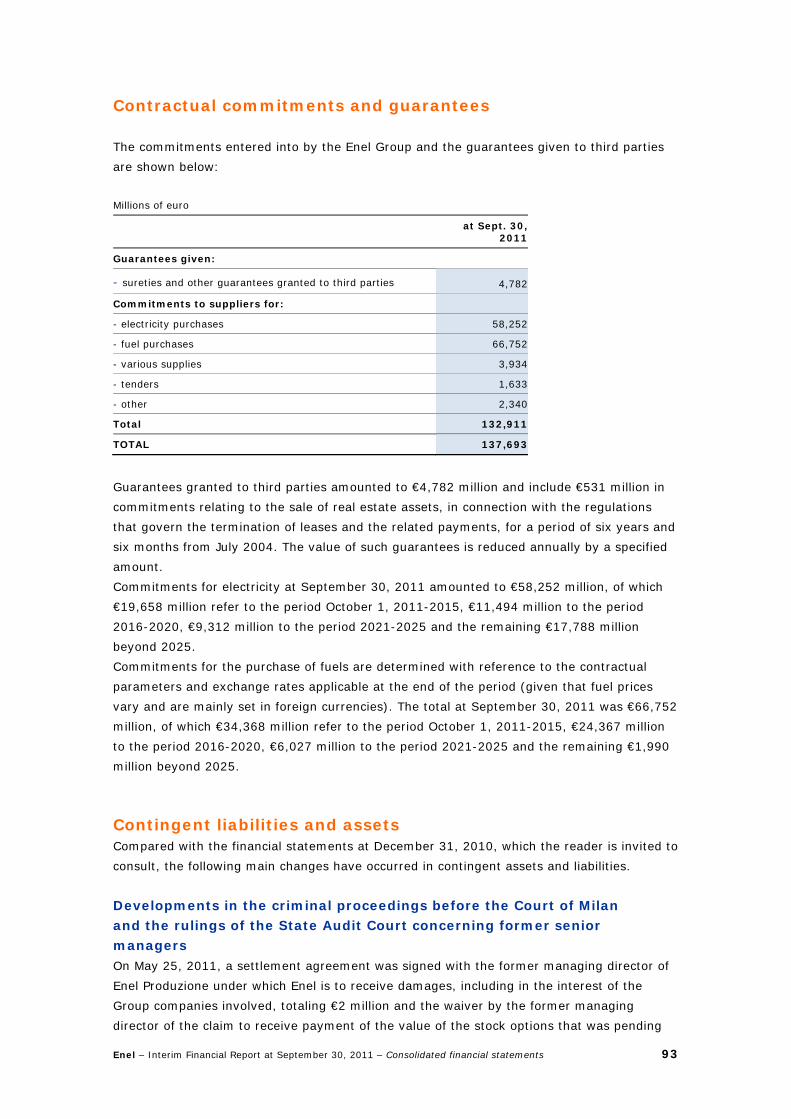
Enel – Interim Financial Report at September 30, 2011 – Consolidated financial statements 93
Contractual commitments and guarantees
The commitments entered into by the Enel Group and the guarantees given to third parties
are shown below:
Millions of euro
at Sept. 30,
2011
Guarantees given:
- sureties and other guarantees granted to third parties 4,782
Commitments to suppliers for:
- electricity purchases 58,252
- fuel purchases 66,752
- various supplies 3,934
- tenders 1,633
- other 2,340
Total 132,911
TOTAL 137,693
Guarantees granted to third parties amounted to €4,782 million and include €531 million in
commitments relating to the sale of real estate assets, in connection with the regulations
that govern the termination of leases and the related payments, for a period of six years and
six months from July 2004. The value of such guarantees is reduced annually by a specified
amount.
Commitments for electricity at September 30, 2011 amounted to €58,252 million, of which
€19,658 million refer to the period October 1, 2011-2015, €11,494 million to the period
2016-2020, €9,312 million to the period 2021-2025 and the remaining €17,788 million
beyond 2025.
Commitments for the purchase of fuels are determined with reference to the contractual
parameters and exchange rates applicable at the end of the period (given that fuel prices
vary and are mainly set in foreign currencies). The total at September 30, 2011 was €66,752
million, of which €34,368 million refer to the period October 1, 2011-2015, €24,367 million
to the period 2016-2020, €6,027 million to the period 2021-2025 and the remaining €1,990
million beyond 2025.
Contingent liabilities and assets Compared with the financial statements at December 31, 2010, which the reader is invited to
consult, the following main changes have occurred in contingent assets and liabilities.
Developments in the criminal proceedings before the Court of Milan and the rulings of the State Audit Court concerning former senior managers On May 25, 2011, a settlement agreement was signed with the former managing director of
Enel Produzione under which Enel is to receive damages, including in the interest of the
Group companies involved, totaling €2 million and the waiver by the former managing
director of the claim to receive payment of the value of the stock options that was pending
Enel – Interim Financial Report at September 30, 2011 – Consolidated financial statements 94
before Labor Court in the amount of €4 million. As part of the agreement, the companies of
the Enel Group have revoked – solely with respect to the Enel Produzione managing director
– their status as injured parties in the related criminal proceedings and will abandon the
revocatory and enforcement actions undertaken against said managing director.
The trial on the charges of criminal conspiracy was concluded on September 20, 2011 with a
ruling that the statute of limitations had run out. Enelpower, Enel Produzione and Enel SpA
are taking civil action to recover damages for the harm caused by the conspiracy conducted
by the former managers.
BEG litigation As regards the legal proceedings in Albania, in a ruling of March 7, 2011, the Albanian Court
of Cassation denied the appeal submitted by Enelpower and Enel SpA against the ruling of
the Albanian Court of Appeal, which on April 28, 2010 had upheld the decision of the Court of
Tirana awarding Albania BEG Ambient tortious damages of about €25 million for 2004 as well
as an unspecified amount of other tortious damages for subsequent years. In a letter of April
26, 2011, Albania BEG Ambient, referring to the above ruling of the Albanian court,
requested payment of more than €430 million. Enelpower and Enel SpA replied to the
request, on April 28 and 29 respectively, strongly challenging legitimacy of both the
foundation of the claim and the amount and filed a request with the Albanian Court of
Cassation for the Court of Tirana’s ruling in first instance to be revoked for conflict with the
ruling of the Italian Court of Cassation. In a ruling dated June 17, 2011, and announced on
July 7, the Albanian Court of Cassation upheld the ruling of the court of first instance.
In addition, proceedings continued in Italy in the suit lodged by Enelpower and Enel SpA
against BEG SpA with the Court of Rome asking the Court to ascertain the liability of BEG for
having evaded compliance with the ruling issued in Italy in favor of Enelpower on December
6, 2002, having its subsidiary Albam take legal action in Albania against Enelpower and Enel.
With this action, Enelpower and Enel are asking the Court to find BEG liable and order it to
pay damages to Enelpower (contractual and tortious) and to Enel (tortious) in the amount
that one or the other could be required to pay to Albania BEG Ambient in the event of the
enforcement of the sentence issued by the Albanian courts. The next hearing is scheduled for
October 25, 2011.
Out-of-court disputes and litigation connected with the blackout of September 28, 2003 To date, pending cases concerning the blackout have fallen to just over 50,000 due to Court
decisions as well as abandonment of suits by the plaintiffs or joinder of proceedings, while
the flow of new claims has essentially come to a halt in view of the rulings in Enel's favor by
both the Court of Appeal and the Court of Cassation.
Litigation concerning free bill payment procedures On February 24, 2011, the Council of State denied the appeal filed by Enel Distribuzione
asking for it to revoke ruling no. 2507/2010, granting the appeal of the Authority for
Electricity and Gas against ruling no. 321/08 of the Lombardy Regional Administrative Court
voiding Resolution no. 66/07. With the latter, the Authority had fined Enel Distribuzione
€11.7 million for violation of the provisions of Resolution no. 55/2000 concerning the
transparency of invoices.
Enel – Interim Financial Report at September 30, 2011 – Consolidated financial statements 95
Porto Tolle thermal plant – Air pollution – Criminal proceedings against Enel directors and employees – Damages for environmental harm In a ruling on January 11, 2011, the Court of Cassation granted the appeal, overturning the
decision of the Venice Court of Appeal, and referred the case to the civil section of the Venice
Court of Appeal to rule as regards payment of damages and the division of such damages
among the accused. As regards amounts paid to a number of public entities, the Group has
already made payment under a settlement agreement reached in 2008.
With a suit lodged in July 2011, the Ministry for the Environment and a number of public
entities asked the Venice Court of Appeal to order Enel SpA and Enel Produzione to pay civil
damages for harm caused by the emissions from the Porto Tolle power station.
The amount of damages requested for economic and environmental losses is about €100
million, which Enel has contested in full as unfounded.
In August 2011, the Public Prosecutor’s Office of Rovigo asked that a number of directors
and employees of Enel Produzione be remanded for trial on the charge of willful omission to
take precautionary actions to prevent a disaster in respect of the alleged emissions from the
Porto Tolle plant. The next hearing has been set for November 22, 2011.
Contingent liabilities of the Endesa Group As regards the dispute between Endesa Distribución Eléctrica and Josel SL concerning the
withdrawal from the contract for the sale of several buildings due to changes in their zoning
status, on May 9, 2011, the court granted the request to permit withdrawal from the contract
and ordered Endesa to repay the amounts paid for the sale plus interest and costs. Endesa
has appealed the ruling.
Enel – Interim Financial Report at September 30, 2011 – Consolidated financial statements 96
Subsequent events
Revision of Enel rating by Moody’s On October 5, 2011, Moody’s rating agency announced that it had lowered its long-term
rating for Enel SpA to “A3” (previously “A2”) and its short-term rating to “Prime-2”
(previously “Prime-1”). It also issued a negative outlook.
The change in Enel’s rating is linked to the recent decision by Moody’s to lower its rating for
Italian government debt.
Issue of €2,250 million bond on European market On October 17, 2011, Enel SpA, acting through its subsidiary Enel Finance International NV,
placed on the European market a multi-tranche bond issue totaling €2,250 million targeted
at institutional investors under the Global Medium Term Notes program. The bond issue was
authorized by Enel’s Board of Directors on June 16, 2011.
The operation, led by a pool of banks comprising Barclays, BNP Paribas and Deutsche Bank
(as global coordinators) and Banca Imi, BBVA, Santander and UniCredit (as joint book
runners) generated orders totaling over €12 billion and was structured into the following
tranches (all guaranteed by Enel SpA):
- €1,250 million at a rate of 4.625%, maturing June 24, 2015;
- €1,000 million at a rate of 5.750%, maturing in October 24, 2018.
New loan in Romania On October 21, 2011 Enel Green Power International BV signed an agreement with the
Danish government’s Export Credit Agency and Citigroup (as agent and arranger) for a 12-
year loan of €112 million, guaranteed by Enel Green Power. This loan will be used to cover
a portion of the investments required to build and expand Enel Green Power Romania’s
Moldova Noua and Corugea wind plants, which will have a total installed capacity of 118
MW.

Enel – Interim Financial Report at September 30, 2011 – Consolidated financial statements 97
Declaration of the officer responsible for the preparation of the company’s financial reports pursuant to the provisions of Article 154-bis, paragraph 2, of Legislative Decree 58/1998
The officer responsible for the preparation of the company’s financial reports, Luigi Ferraris,
declares, pursuant to Article 154-bis, paragraph 2, of the Consolidated Law on Financial
Intermediation, that the accounting information contained in the Interim Financial Report at
September 30, 2011 corresponds with that contained in the accounting documentation,
books and records.

Disclaimer This Report issued in Italian has been translated into English solely for the convenience of international readers Enel Società per azioni Registered office in Rome Viale Regina Margherita, 137