INTERIM ADVICE NOTE 185/15 noise advice on the … · INTERIM ADVICE NOTE 185/15 ... the criteria...
23
INTERIM ADVICE NOTE 185/15 Updated traffic, air quality and noise advice IAN 185/15 Page 1 of 23 Jan 15 INTERIM ADVICE NOTE 185/15 Updated traffic, air quality and noise advice on the assessment of link speeds and generation of vehicle data into ‘speed-bands’ for users of DMRB Volume 11, Section 3, Part 1 ‘Air Quality and Volume 11, Section 3. Part 7 Noise Summary This IAN provides supplementary advice to users of DMRB Volume 11, SECTION 3, PART 1 (HA207/07) and PART 7 (HD213/11). Advice is provided on the assessment of link speeds and generation of speed-band vehicle emissions Instructions for Use This guidance is supplementary to existing guidance given in DMRB Volume 11, Section 3, Part 1 (HA207/07) and Part 7 (HD213/11)
Transcript of INTERIM ADVICE NOTE 185/15 noise advice on the … · INTERIM ADVICE NOTE 185/15 ... the criteria...

INTERIM ADVICE NOTE 185/15
Updated traffic, air quality and noise advice
IAN 185/15 Page 1 of 23 Jan 15
INTERIM ADVICE NOTE 185/15 Updated traffic, air quality and noise advice on the assessment of link speeds and generation of vehicle data into ‘speed-bands’ for users of DMRB Volume 11, Section 3, Part 1 ‘Air Quality and Volume 11, Section 3. Part 7 Noise Summary This IAN provides supplementary advice to users of DMRB Volume 11, SECTION 3, PART 1 (HA207/07) and PART 7 (HD213/11). Advice is provided on the assessment of link speeds and generation of speed-band vehicle emissions Instructions for Use This guidance is supplementary to existing guidance given in DMRB Volume 11, Section 3, Part 1 (HA207/07) and Part 7 (HD213/11)
INTERIM ADVICE NOTE 185/15
Updated traffic, air quality and noise advice
IAN 185/15 Page 2 of 23 Jan 15
Table of Contents 1. Introduction 1 2. Background Information 2 3. Speed Pivoting Methodology 3 3.1 Introduction 3 3.2 Data Collection 3 3.3 Speed Pivoting 4 3.4 Assessing the Performance of Speed Pivoting 4 3.5 Speed Pivoting Forecast Traffic Speeds 5 3.6 Infilling 5 4. Speed-Bands for Air Quality 6 4.1 Background 6 4.2 Identifying and Selecting a Speed-Band Category 6 4.3 Allocating an Emission Rate to a Speed-Band 6 4.4 Junctions 7 4.5 Air Quality Modelling 7 5. Speed-Bands for Noise 8 5.1 Background 8 5.2 Identifying and Selecting a Speed-Band Category 8 5.3 Calculating the 18 Hour Annual Weekday Traffic Speed 8 5.4 Noise Consideration of Alleviating Congestion 8 5.5 Junctions 9 Annex A Motorways Speed-Band Descriptors 12 Urban / Rural (Non-Motorway) Road Speed-Band Descriptors 13 Annex B Worked Example 14 Annex C C1 NOx Emissions (g/km per vehicle) 19 C2 PM10 Emissions (g/km per vehicle) 21 C3 CO2 Emissions (g/km per vehicle) 23

INTERIM ADVICE NOTE 185/15
Updated traffic, air quality and noise advice
IAN 185/15 Page 3 of 23 Jan 15
1. Introduction This IAN provides updated advice to support Highways Agency (HA) scheme assessments to:
Analyse the performance of modelled traffic speeds on individual road links compared against observed speeds on the same road links
Adjust, where required, modelled traffic speeds on individual road links to better reflect observed speeds; this is known as the “Speed Pivoting” approach
Assign individual road links into a speed-band category and identify the corresponding NOx, PM10 and CO2 emission rates
Use of the speed-band categories within air quality and noise modelling and assessment
1.1 Relationship This IAN provides updated air quality advice for users of DMRB Volume 11, Section 3, Part 1 ‘Air Quality’ (HA207/07) and Part 7 ‘Noise’ (HD213/11) and supports the preparation of traffic data for use in environmental assessments. 1.2 Implementation This guidance should be used forthwith on relevant projects in England, where traffic and air quality assessments are undertaken and where such projects have yet to be submitted for statutory process, including Determination of the need for a statutory Environmental Impact Assessment.

INTERIM ADVICE NOTE 185/15
Updated traffic, air quality and noise advice
IAN 185/15 Page 4 of 23 Jan 15
2. Background Information Historically traffic models have been developed with a focus on providing information to inform the scheme’s economic assessment. Whilst the traffic flows have been used to inform environmental assessments and scheme design, the increased risks around air quality has presented challenges on the accuracy and suitability of traffic data required at the link level as opposed to more strategic flows. Air quality and noise assessments require link based traffic flows (total flows and number of HDVs) and speeds provided by a traffic model (where one is available) to enable a calculation of the absolute pollutant concentrations at individual properties. Whilst there are validation criteria for modelled traffic flows at the link level, the criteria for journey times is based on discrete journeys through the model area and not at the individual link level. A review of journey times undertaken as part of scheme assessments has shown that the accuracy of journey times does not reflect speeds well on individual links. As part of the analysis of journey times and also to support the aspirations of Smart motorways i.e. alleviating congestion, it was evident that it was not possible to describe the impacts of congested conditions within air quality and noise assessments. The HA has been undertaking research into congestion, primarily on motorways, over the last few years. The research indicates that congestion tends to occur when speeds drop below 50mph (80kph). Above 50mph the motorway tends to be is a state of free flow driving. This research has identified that during periods of congestion on the motorway traffic emissions per vehicle increase comparative to free flow conditions. Currently the vehicle emissions from Defra’s Emission Factor Toolkit v6 suggest that emissions decrease as speed decreases from 70mph down to 50mph and emissions continue to decrease as speeds drop below 50mph. At speeds below 25mph, emissions start to increase rapidly as speed continues to decrease. Previously the impacts and benefits associated with introducing or removing periods of congestion within the air quality assessment were not accurately represented. As the outcomes and decisions on the air quality impacts for a scheme are informed by the link level traffic data, any discrepancy in the traffic data and emissions could have significant ramifications for the overall judgement of the scheme’s air quality impacts. It is also recognised that significant emphasis is placed on the absolute traffic speed on an individual link and the consequent vehicle emissions. It is recognised that neither the traffic model nor vehicle emissions projections have this level of certainty. Consequently the development of the speed-band categories provides a pragmatic and robust approach to support air quality and noise assessments and is not unduly influenced by artificial precision.

INTERIM ADVICE NOTE 185/15
Updated traffic, air quality and noise advice
IAN 185/15 Page 5 of 23 Jan 15
3. Speed Pivoting Methodology 3.1 Introduction The traffic model validation criteria are based on both link and screenline flows and route journey times (speeds). While traffic models may fulfil Department for Transport Web Transport Appraisal Guidance (WebTAG) Unit M3.1 ‘Highway Assignment Modelling’ validation criteria for link flows and route journey times, it is quite likely that they do not validate well against individual link speeds. Work is ongoing by the HA to improve the validation of link speeds. In the interim, work has been carried out to develop a cost effective method to better represent modelled speeds on individual links from the traffic model, by comparing them to observed traffic data. A methodology has been developed which uses observed vehicle speeds from the base year. This allows for a comparison with the modelled base year speeds and provides an indication of the performance of the speeds from traffic model. This information can then be used to adjust the individual base year link speeds output from the traffic model, where required. As it is not possible to measure forecast traffic speeds, the adjustments applied to the base year model are applied to the opening and design year forecasts in the same way. The speed pivoting methodology should only be applied to those road links which are included in the Traffic Reliability Area (TRA)1. 3.2 Data Collection The following data sources provide information suitable to support the Speed Pivoting methodology. Data Source Motorway Urban / Rural
Roads Available from
HA Journey Time Database
https://www.hatris.co.uk/
GPS data from DfT Make the request through the Overseeing Organisation
GPS data from other suppliers
Further details available from the Overseeing Organisation
Mobile phone data Further details available from the Overseeing Organisation
This is not a definitive list and where alternative sources of data are suggested to support this approach, then this should be agreed with the Overseeing Organisation prior to commencing this work. In addition to observed speed data outputs from the traffic model on a link-by-link basis and by direction are required. This information should be provided by period of the day i.e. AM Morning Peak period, Inter Peak (IP) period and Evening Peak (PM) period for at least the weekday. In some instances weekend traffic data may also be required to support scheme assessments and in these instances the Overseeing Organisation should be contacted to clarify the approach for weekend traffic modelling. It is assumed for all roads, that overnight that the link is operating in free flow conditions and the speeds for a given link should reflect this, although this may not necessarily be the speed
1 The TRA defines the sub-set of traffic data from the traffic model, that has been identified as suitable for informing the Environmental Assessment

INTERIM ADVICE NOTE 185/15
Updated traffic, air quality and noise advice
IAN 185/15 Page 6 of 23 Jan 15
limit for the road. Where evidence is available to suggest that overnight that a particular link is not operating at free flow speed then this should be recorded with a brief note setting out the reason and the appropriate speed. Traffic data should be collected for either a neutral month (April, May (avoiding Bank Holidays), June, September, October and November (light permitting)) or corresponding to the data collection period used to inform the traffic model. 3.3 Speed Pivoting The approach set out in Steps 1 to 4 describes how to undertake Speed Pivoting for individual road links and corresponding time periods. The method calculates the relative difference between the observed and modelled traffic speeds for each road link. This relative difference can then be used to adjust i.e. ‘pivot’ the Base Year, Do-Minimum (DM) i.e. without scheme scenario and Do-Something (DS) i.e. with scheme scenario speeds for the relevant forecast year e.g. opening year and design year.
Step 1: Observed traffic speed along the road link in the base year (SObsBY) Where the observed speed used to support speed pivoting should be the average speed for the corresponding period e.g. for the AM period the average speed for the 3 hours covering the AM Peak period should be used.
Step 2: Modelled traffic speed along the corresponding road link in the base year (SModBY)
Step 3: Calculate the Speed Pivot adjustment factor (SP): SObsBY / SModBY Step 4: Applying the Speed Pivoting
For the base year and corresponding forecast years multiply the modelled speed by the Speed Pivoting Adjustment Factor
Base Year: SPBY = SModBY * SP Steps 1 to 4 should be repeated for each road included in the traffic model where observed speed data is available. For those road links and / or times of day when observed speeds are not available please see Section 3.6. 3.4. Assessing Performance of the Speed Pivoting Once speed pivoting has been completed for all links with observed speed data then the performance of the adjustment should be evaluated. At the end of the analysis you should be able to:
1. Identify the number and percentage of links where the modelled speed are representative of observed speeds i.e. the modelled speeds are within 15% of observed.
2. Identify those road links that are within +/- 10mph (+/- 16kph) of the free flow and light congestion band for motorways and high speed and free flow on non-motorway roads (see Section 4 and Annex A). Particular attention should be provided to these road links to ensure that they are assigned to the appropriate speed band category
3. Identify location and type of links that need to be adjusted In all instance professional judgement should be applied to the analysis and any adjustments made to the modelled traffic speeds must be reported.

INTERIM ADVICE NOTE 185/15
Updated traffic, air quality and noise advice
IAN 185/15 Page 7 of 23 Jan 15
3. 5. Speed Pivoting Forecast Traffic Speeds Where the analysis of the Speed Pivoting (Section 3.3) indicates that either all modelled roads, or a subset of the modelled roads, need to adjusted then the following equations should be applied to the corresponding roads in the Do-Minimum and Do-Something for all forecast years.
Forecast Year DM: SPDM = SModDM * SP Forecast Year DS: SPDS = SModDS * SP Where: SMod = Modelled traffic speed
SP = Speed Pivot Where a scheme would change the nature of the existing road e.g.a bypass, then professional judgement on the performance of the traffic model should be used to consider whether the modelled speed is reasonable. In these circumstances, a note should be provided to the Overseeing Organisation justifying the identified speed. 3.6. Infilling It is recognised that observed speed data may not be available for every road link in the traffic model and consequently an ‘infilling’ process will be required to pivot the modelled traffic speeds on these road links. The infilling process can be informed by considering for example:
The speed pivoting performance on adjacent links The speed pivoting performance on roads with similar characteristics either in the
local area or globally across the TRA if available e.g. motorways, urban centre roads, single carriageways, rural roads;
When there is no observed speed data available or where it is difficult to relate complex observed data e.g. traffic master data in a proportionate and pragmatic way to the traffic model then the modelled speeds should be used.
As techniques develop to integrate observed traffic speeds with modelled speeds then the Overseeing Organisation may provide supplementary guidance on how to best relate complex observed traffic data to traffic models. For each road link where infilling is required, then the source of infill data should be recorded along with a brief statements setting out the reasons.

INTERIM ADVICE NOTE 185/15
Updated traffic, air quality and noise advice
IAN 185/15 Page 8 of 23 Jan 15
4. Speed-Bands for Air Quality 4.1. Background Over the last few years the HA has been investigating the impact of observed congestion and non-congested traffic conditions on measured levels of nitrogen dioxide (NO2) concentrations. The purpose of this research is to help inform the corresponding emission information required to support air quality modelling; which is also informed by traffic data. There is little in the way of reported research in this area, other than the emission values developed by NPL [Dutch Roads Authority] which include a description of congested and free flow conditions on motorways and urban roads and corresponding emission rates. The initial outcome of the HA research (to be published) indicates from the air quality monitoring and traffic data that there are different air quality responses to different driving states. These are split in to 3 categories for motorways and 4 categories for urban roads (Tables 3 and 4 respectively) and have been informed by the speed: emissions categories presented in the Dutch Concentrations reports2 for urban roads and motorways. 4.2. Identifying and Selecting a Speed-Band Category Following completion of the speed pivoting approach set out in Section 3, for each road link and period (AM, IP, PM and OP3), assign the road link to a corresponding speed-band as set out in Annex A. Separate speed-band categories are provided for motorways and non-motorway roads. Descriptors of the speed ranges, general characteristics and example of the road traffic characteristics anticipated for each category are provided in Annex A, which are different for motorway and non-motorway roads. Where the speed in a period for an individual link is on the cusp of two categories, i.e. within +/-10mph (+/-16kph) of the band and/or where a road link changes category between Do-Minimum and Do-Something scenarios, then the traffic data should be reviewed to clarify which speed-band it resides within, with a supporting brief statement justifying the reason for the category selected or the rationale for the change respectively. A percentage variation in speed statistic is included in the Motorway Table in Annex A. This is not a key determinant for identifying the relevant speed-band category as there is only observed data available for the base year, and it is not possible to model the variance in future speed. However, the statistic can be used as supporting evidence to help clarify which speed-band category a road link may be in. 4.3. Allocating an Emission Rate to a Speed-Band Annex C1, C2 and C3 contains a list of emission rates for NOx, PM10 and CO2 respectively. The emissions are split by LDV and HDV for 2011 to 2030 inclusive, for each of the speed band categories for motorways and non-motorway links. These categories are further split for emissions for different road types e.g. free flow motorway, light congestion motorway, heavy congestion urban, high speed rural. Speed-Bands are also provided for London Inner, Outer, Central and London motorway, split again by different driving conditions. Once the correct speed-band category and assessment year has been identified, the corresponding vehicle emission factors for a single LDV and single HDV can be obtained
2 Rijksinstituut voor Volksgezondheid en Milieu (RIVM), Grootschalige concentratie- en depositiekaarten Nederland Rapportage 2009, 2010, 2011, 2012, 2013
3 AM – Morning Peak 7-10; IP – Inter Peak 10-16; PM- Evening Peak 16-19; OP- Off Peak 19-7

INTERIM ADVICE NOTE 185/15
Updated traffic, air quality and noise advice
IAN 185/15 Page 9 of 23 Jan 15
from the tables in Annex C. This emission rate in conjunction with the traffic flow for each individual link can then be used to calculate the total emission for the various periods or daily conditions for that road link. Where only AADT or AAWT traffic information is available it is recommended to select the free flow speed band, unless advice is provided to the contrary for any given link. In these instances notes should be recorded justifying the reason for this selection. Outcomes of the HA’s congestion research (available on request from the HA) identified very limited occurrence of heavy congestion traffic conditions. Whilst the HA has been able to derive an emission value for heavy congestions, it is clear from our analysis that periods of heavy congestion are limited in locations around the network and the likelihood of their occurrence is also limited. Where motorway links are identified as being in the Heavy Congestion speed-band category then contact the overseeing organisation for further advice. 4.4. Junctions Driving styles close to junctions are associated with increased periods of acceleration associated with traffic starting and clearing the junction. To account for this increase in engine load it is recommended that within a 100m radius of the centre of the junction in all directions that at least the light congestion emissions, and in some instances heavy congestion emissions should be used depending on the driving conditions during that period of the day. 4.5. Air Quality Modelling Annex B presents a worked example of determining the speed-band category and subsequent emissions calculations for use in the air quality assessment. The published version of the DMRB air quality spreadsheet model (v1.03c) cannot be used to calculate emissions and concentrations in congested conditions.
The updated version of the DMRB air quality spreadsheet model in development already contains all the emissions information for different speed-bands and calculates the emissions
for total LDV and HDV, based on the inputted traffic data

INTERIM ADVICE NOTE 185/15
Updated traffic, air quality and noise advice
IAN 185/15 Page 10 of 23 Jan 15
5. Speed-Bands for Noise 5.1. Background A change in traffic characteristics is not as influential for noise as it is for changes in vehicle emissions and the consequent changes in air quality. Changes in speed begin to become significant for noise with changes of around 10 kph or more. However, it is recognised that there is a need to minimise the influence of artificially precise speeds from the traffic model, and ensure a consistency of approach as set out for the air quality assessments. 5.2. Identifying and Selecting a Speed-band Category Following completion of the speed pivoting approach set out in Section 3, for each road link and period (AM, IP, PM and OP4), assign the road link to a corresponding noise speed-band as set out in Annex A. For example, if the pivoted speed from the traffic model for the AM peak period is identified as residing within the light congestion on the motorway, then the corresponding speed would be 55kph. Speed-band categories are provided for motorways and non-motorway roads. The descriptors provided in Annex A can also be used to inform which noise speed-band to assign an individual link. Where the speed in a period for an individual link is on the cusp of two categories i.e. within +/-10mph (+/-16kph) of the band and/or where a road link changes category between Do-Minimum and Do-Something scenarios, then the traffic data should be reviewed to clarify which speed-band it resides within, with supporting brief statement justifying the reason for the category selected or the rationale for the change respectively. 5.3. Calculating the 18 hour Annual Average Weekday Traffic Speed Once the speed-band has been assigned for each one hour period, then the 18 hour Annual Average Weekday Traffic speed needs to be calculated. The speed is based on the weighted average of the different periods over the course of the day and is to be calculated as follows:
18hr AAWT speed =
(AM period speed x 3) + (IP period speed x 6) + (PM period speed x 3) + (OP period speed x 6) 18
Based on this calculated value an overall speed-band is then assigned to the road link for use in the noise assessment. 5.4. Noise Consideration of Alleviating Congestion There is a potential where a scheme alleviates periods of congestion and the traffic moves into free flow conditions that noise levels could increase by approximately 3dB(A) during individual peak periods. Professional judgement of the noise specialist should consider whether the impact of noise during these periods needs to be assessed separately and if necessary any mitigation measures are required.
4 AM – Morning Peak 7-10; IP – Inter Peak 10-16; PM- Evening Peak 16-19; OP- Off Peak 19-7

INTERIM ADVICE NOTE 185/15
Updated traffic, air quality and noise advice
IAN 185/15 Page 11 of 23 Jan 15
5.5. Junctions Driving styles close to junctions are associated with increased periods of acceleration associated with traffic starting and clearing the junction. To account for this increase in engine load it is recommended that within a 100m radius of the centre of the junction in all directions, at least the speeds set out in Annex A for light congestion, and in some instances heavy congestion depending on the driving conditions during that period of the day are used.

INTERIM ADVICE NOTE 185/15
Updated traffic, air quality and noise advice
IAN 185/15 Page 12 of 23 Jan 15
6. Withdrawal Conditions This IAN will be withdrawn when an updated Volume 11, Section 3, Part 1 ‘Air Quality’ and Part 7 ‘Noise’ have been published and / or if Defra’s advice is changed. 7. Contacts Any queries regarding this IAN should be addressed to either: Andrew Bean Peter Grant Principal Air Quality Advisor Team Leader, TAME Highways Agency Piccadilly Gate Store Street Manchester M1 2WD
Highways Agency Piccadilly Gate Store Street Manchester M1 2WD
Email: [email protected] Email: [email protected] Tel: (0161) 930 5526 or GTN 4315 5526 Tel: (0161) 930 5830 or GTN 4315 5830 Ian Homes Principal Noise Advisor Highways Agency Piccadilly Gate Store Street Manchester M1 2WD
Email: [email protected] Tel: (0161) 930 5555 or GTN 4315 5555

INTERIM ADVICE NOTE 185/15
Updated traffic, air quality and noise advice
IAN 185/15 Page 13 of 23 Jan 15
8. References Design Manual for Roads and Bridges, Volume 11, Section 3, Part 1, Air Quality (HA207/07) May 2007 Design Manual for Roads and Bridges, Volume 11, Section 3, Part 7, Noise (HD213/11) Department for Transport (2014) WebTAG M3.1 Highway Assignment Modelling https://www.gov.uk/government/publications/webtag-tag-unit-m3-1-highway-assignment-modelling 9. Additional Reading Department for Environment, Food and Rural Affairs, Local Air Quality Management, Technical Guidance (LAQM.TG09), February 2009 [as updated by Defra] http://laqm.defra.gov.uk/review-and-assessment/tools/modelling.html#ProjectingNO2Note Rijksinstituut voor Volksgezondheid en Milieu (RIVM), Grootschalige concentratie- en depositiekaarten Nederland Rapportage 2009, 2010, 2011, 2012, 2013 Further information on the Journey Time Database (JTDB) can be found at: https://www.hatris.co.uk/

INTERIM ADVICE NOTE 185/15
Updated traffic, air quality and noise advice
IAN 185/15 Page 14 of 23 Jan 15
Annex A Motorway Speed-Band Descriptors
Category Speed Range General Description Examples of Possible Characteristics Noise Speed-band
(kph) Heavy Congestion
<30kph(#) Traffic with a high degree of congestion and stop: start driving behaviour
Junction merges and diverges during morning and evening rush hours
Slip roads with queuing traffic High variation in traffic speeds (represented by a
standard deviation in speed of >32 kph )* (>20mph)
20
Light Congestion
30(#)-80kph (50mph)
Traffic with some degree of flow breakdown,
Normally experience during the morning or evening peak periods.
Typically volume/capacity (V/C) would be >80%. Normal operating regime for all slip roads Medium variation in traffic speeds (represented by a
standard deviation in speed of 15 kph -32kph)* (10-20mph)
55
High Speed ≥80kph (50mph)
Motorway with free flow driving conditions with no flow breakdown.
V/C <80% Low variation in traffic speeds (represented by a standard
deviation in speed on < 15 kph)* (<10mph)
97
(#) Represents the current uncertainty associated with the speed threshold between light and heavy congestion * Currently, this can only be applied for the base year where the data is available. Further work is required to see how it can be applied to forecast speeds and whether the observed traffic data requires a different standard deviation in speed for heavy and light congestion

INTERIM ADVICE NOTE 185/15
Updated traffic, air quality and noise advice
IAN 185/15 Page 15 of 23 Jan 15
Urban / Rural (Non-Motorway) Roads Speed-Band Descriptors
Category Speed Range General Description Examples of Possible Characteristics Noise Speed-band
(kph) Heavy Congestion
<20kph (12mph)
Traffic with a high degree of congestion. Within a 100m radius of road junction with a high degree of congestion.
Typically 10 stops per km* RFC of (to be agreed)
20
Light Congestion
20-45kph (12-27mph)
Typical urban traffic with a reasonable degree of congestion. Within a 100m radius of road junction.
On average of 1.5 to 2 stops per km*. Travelling to and from work during the morning and
evening rush hours.
33
Free Flow 45-80kph (27-50mph)
Typical urban traffic with limited or no congestion.
Possibly experiencing 1 stop per km* 63
High Speed Urban Road
>80kph (50mph)
High speed urban single or dual carriageway
Low likelihood of any stops per km. RFC of (to be agreed)
97
* The number of stops per km is taken from the Dutch work and the HA are keeping this under review to whether this metric is appropriate to the GB network or whether a metric based on, say, RFC is more appropriate.

INTERIM ADVICE NOTE 185/15
Updated traffic, air quality and noise advice
IAN 185/15 Page 16 of 23 Jan 15
Annex B Worked Example Traffic, air quality and noise modelling is being undertaken in support of a proposed scheme. The example focuses on one road in the base year (2012) to help illustrate the methodology described in this IAN. A section of motorway has the following characteristics (Table C1) for the morning peak period (7-10am): Table C1
Northbound Southbound Modelled (SMod) Observed (SObs) Modelled (SMod) Observed (SObs)
Flow 10,214 9,832 %HDV 17 14
Speed (kph) 87 62 91 102 Speed Pivoting
1. Calculate the Speed Pivot adjustment factor (SP) by dividing SObsBY by the link’s modelled vehicle speed from the base year model (SModBY); Northbound SP = 62 ÷ 87 = 0.71 Southbound SP = 102 ÷ 91 = 1.12
2. Apply the northbound and southbound SP adjustment factor respectively to adjust the speeds in the base year traffic model.
3. The northbound and southbound SP adjustment factors can then be used to adjust speeds in the future year forecast to derive the link’s average AM vehicle speed for use in the road scheme’s various forecast scenarios as such: Forecast Speed = Modelled speed x SP
4. For example, if a traffic model identified that the particular link’s average vehicle speed was 101km/h in a future scenario for the northbound direction, the SP adjustment factor (0.71) can be applied to that speed, resulting in a pivoted speed of 71kph (101 x 0.71).

INTERIM ADVICE NOTE 185/15
Updated traffic, air quality and noise advice
IAN 185/15 Page 17 of 23 Jan 15
Assigning a Speed Band
5. Once the speeds have been adjusted for all links in the traffic model, the speed can then be used to determine which speed-band they are assigned to. The northbound and southbound speeds are presented in Table C2, with the associated speed bands and corresponding NOx emissions and equivalent speed for use in the air quality and noise modelling respectively. Table C2
SP Speed (kph)
Speed Band Air Quality (NOx Emission g/km)
Noise (Speed kph)
Northbound 62 Light Congestion LDV: 0.64 HDV: 4.02
55
Southbound 102 Free Flow LDV: 0.47 HDV: 2.96
97
INTERIM ADVICE NOTE 185/15
Updated traffic, air quality and noise advice
IAN 185/15 Page 18 of 23 Jan 15
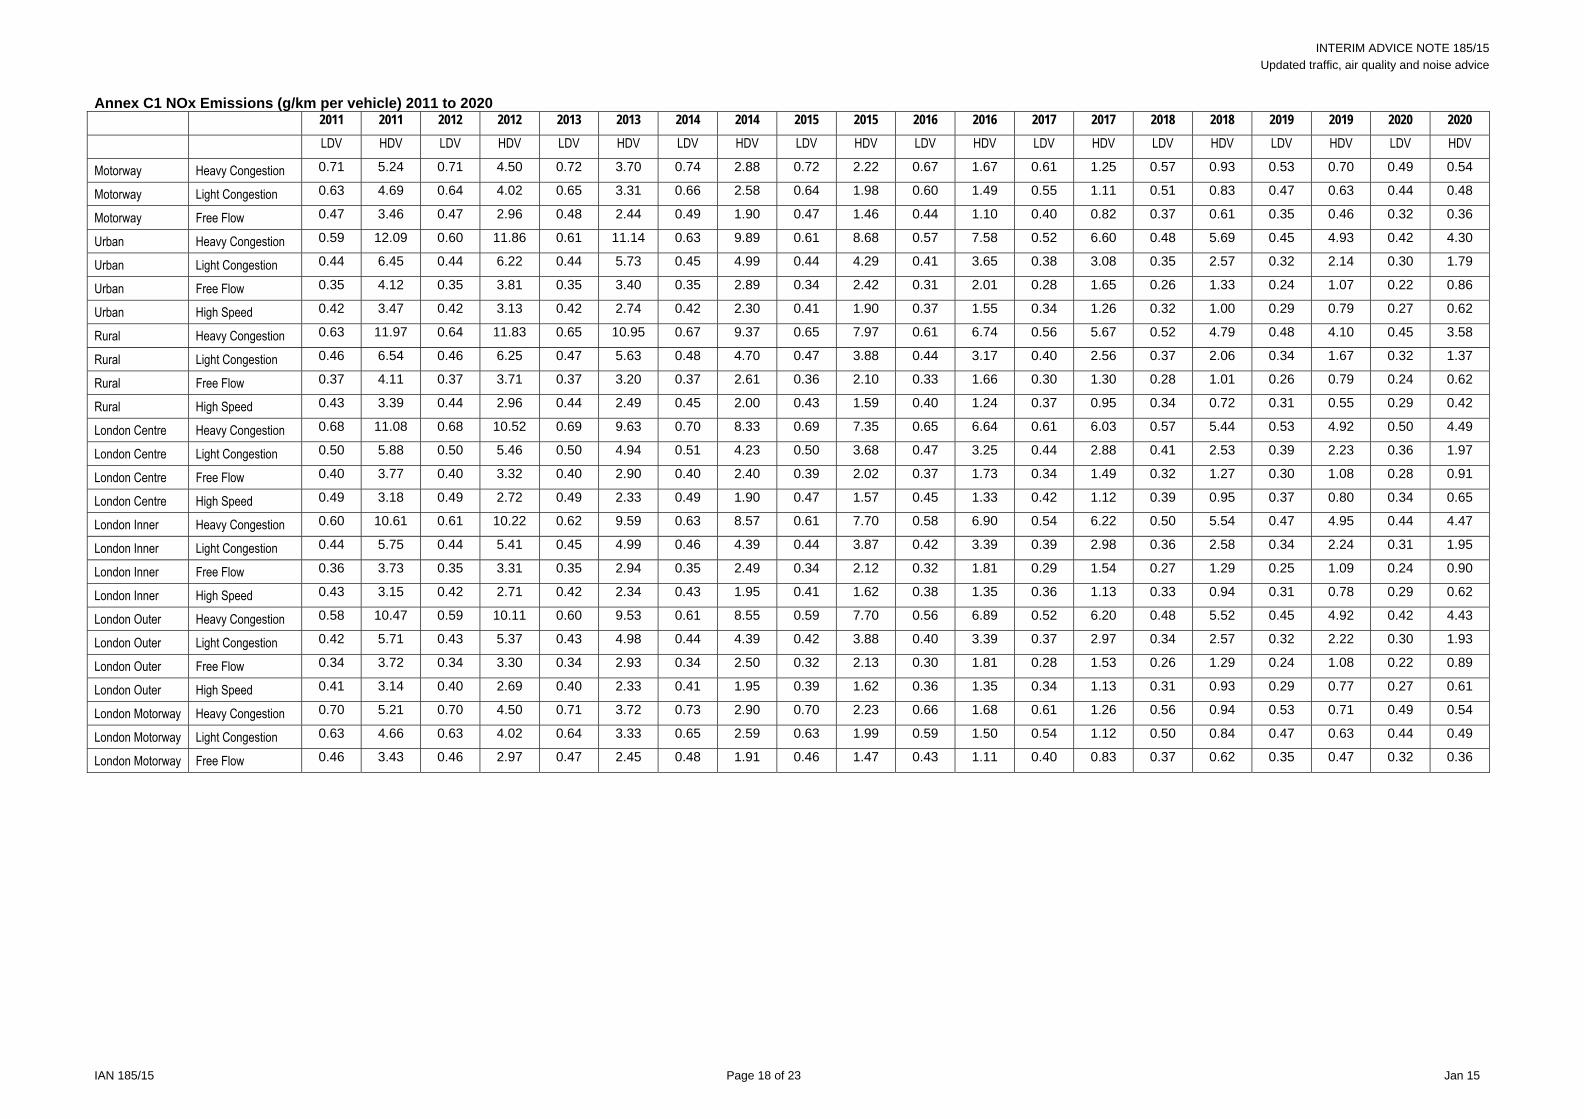
Annex C1 NOx Emissions (g/km per vehicle) 2011 to 2020 2011 2011 2012 2012 2013 2013 2014 2014 2015 2015 2016 2016 2017 2017 2018 2018 2019 2019 2020 2020
LDV HDV LDV HDV LDV HDV LDV HDV LDV HDV LDV HDV LDV HDV LDV HDV LDV HDV LDV HDV
Motorway Heavy Congestion 0.71 5.24 0.71 4.50 0.72 3.70 0.74 2.88 0.72 2.22 0.67 1.67 0.61 1.25 0.57 0.93 0.53 0.70 0.49 0.54
Motorway Light Congestion 0.63 4.69 0.64 4.02 0.65 3.31 0.66 2.58 0.64 1.98 0.60 1.49 0.55 1.11 0.51 0.83 0.47 0.63 0.44 0.48
Motorway Free Flow 0.47 3.46 0.47 2.96 0.48 2.44 0.49 1.90 0.47 1.46 0.44 1.10 0.40 0.82 0.37 0.61 0.35 0.46 0.32 0.36
Urban Heavy Congestion 0.59 12.09 0.60 11.86 0.61 11.14 0.63 9.89 0.61 8.68 0.57 7.58 0.52 6.60 0.48 5.69 0.45 4.93 0.42 4.30
Urban Light Congestion 0.44 6.45 0.44 6.22 0.44 5.73 0.45 4.99 0.44 4.29 0.41 3.65 0.38 3.08 0.35 2.57 0.32 2.14 0.30 1.79
Urban Free Flow 0.35 4.12 0.35 3.81 0.35 3.40 0.35 2.89 0.34 2.42 0.31 2.01 0.28 1.65 0.26 1.33 0.24 1.07 0.22 0.86
Urban High Speed 0.42 3.47 0.42 3.13 0.42 2.74 0.42 2.30 0.41 1.90 0.37 1.55 0.34 1.26 0.32 1.00 0.29 0.79 0.27 0.62
Rural Heavy Congestion 0.63 11.97 0.64 11.83 0.65 10.95 0.67 9.37 0.65 7.97 0.61 6.74 0.56 5.67 0.52 4.79 0.48 4.10 0.45 3.58
Rural Light Congestion 0.46 6.54 0.46 6.25 0.47 5.63 0.48 4.70 0.47 3.88 0.44 3.17 0.40 2.56 0.37 2.06 0.34 1.67 0.32 1.37
Rural Free Flow 0.37 4.11 0.37 3.71 0.37 3.20 0.37 2.61 0.36 2.10 0.33 1.66 0.30 1.30 0.28 1.01 0.26 0.79 0.24 0.62
Rural High Speed 0.43 3.39 0.44 2.96 0.44 2.49 0.45 2.00 0.43 1.59 0.40 1.24 0.37 0.95 0.34 0.72 0.31 0.55 0.29 0.42
London Centre Heavy Congestion 0.68 11.08 0.68 10.52 0.69 9.63 0.70 8.33 0.69 7.35 0.65 6.64 0.61 6.03 0.57 5.44 0.53 4.92 0.50 4.49
London Centre Light Congestion 0.50 5.88 0.50 5.46 0.50 4.94 0.51 4.23 0.50 3.68 0.47 3.25 0.44 2.88 0.41 2.53 0.39 2.23 0.36 1.97
London Centre Free Flow 0.40 3.77 0.40 3.32 0.40 2.90 0.40 2.40 0.39 2.02 0.37 1.73 0.34 1.49 0.32 1.27 0.30 1.08 0.28 0.91
London Centre High Speed 0.49 3.18 0.49 2.72 0.49 2.33 0.49 1.90 0.47 1.57 0.45 1.33 0.42 1.12 0.39 0.95 0.37 0.80 0.34 0.65
London Inner Heavy Congestion 0.60 10.61 0.61 10.22 0.62 9.59 0.63 8.57 0.61 7.70 0.58 6.90 0.54 6.22 0.50 5.54 0.47 4.95 0.44 4.47
London Inner Light Congestion 0.44 5.75 0.44 5.41 0.45 4.99 0.46 4.39 0.44 3.87 0.42 3.39 0.39 2.98 0.36 2.58 0.34 2.24 0.31 1.95
London Inner Free Flow 0.36 3.73 0.35 3.31 0.35 2.94 0.35 2.49 0.34 2.12 0.32 1.81 0.29 1.54 0.27 1.29 0.25 1.09 0.24 0.90
London Inner High Speed 0.43 3.15 0.42 2.71 0.42 2.34 0.43 1.95 0.41 1.62 0.38 1.35 0.36 1.13 0.33 0.94 0.31 0.78 0.29 0.62
London Outer Heavy Congestion 0.58 10.47 0.59 10.11 0.60 9.53 0.61 8.55 0.59 7.70 0.56 6.89 0.52 6.20 0.48 5.52 0.45 4.92 0.42 4.43
London Outer Light Congestion 0.42 5.71 0.43 5.37 0.43 4.98 0.44 4.39 0.42 3.88 0.40 3.39 0.37 2.97 0.34 2.57 0.32 2.22 0.30 1.93
London Outer Free Flow 0.34 3.72 0.34 3.30 0.34 2.93 0.34 2.50 0.32 2.13 0.30 1.81 0.28 1.53 0.26 1.29 0.24 1.08 0.22 0.89
London Outer High Speed 0.41 3.14 0.40 2.69 0.40 2.33 0.41 1.95 0.39 1.62 0.36 1.35 0.34 1.13 0.31 0.93 0.29 0.77 0.27 0.61
London Motorway Heavy Congestion 0.70 5.21 0.70 4.50 0.71 3.72 0.73 2.90 0.70 2.23 0.66 1.68 0.61 1.26 0.56 0.94 0.53 0.71 0.49 0.54
London Motorway Light Congestion 0.63 4.66 0.63 4.02 0.64 3.33 0.65 2.59 0.63 1.99 0.59 1.50 0.54 1.12 0.50 0.84 0.47 0.63 0.44 0.49
London Motorway Free Flow 0.46 3.43 0.46 2.97 0.47 2.45 0.48 1.91 0.46 1.47 0.43 1.11 0.40 0.83 0.37 0.62 0.35 0.47 0.32 0.36

INTERIM ADVICE NOTE 185/15
Updated traffic, air quality and noise advice
IAN 185/15 Page 19 of 23 Jan 15
Annex C1 (continue) NOx Emissions (g/km per vehicle) 2021 to 2030 2021 2021 2022 2022 2023 2023 2024 2024 2025 2025 2026 2026 2027 2027 2028 2028 2029 2029 2030 2030
LDV HDV LDV HDV LDV HDV LDV HDV LDV HDV LDV HDV LDV HDV LDV HDV LDV HDV LDV HDV
Motorway Heavy Congestion 0.46 0.43 0.43 0.36 0.40 0.31 0.38 0.29 0.36 0.27 0.34 0.26 0.33 0.25 0.32 0.25 0.31 0.25 0.30 0.25
Motorway Light Congestion 0.41 0.38 0.39 0.32 0.36 0.28 0.34 0.26 0.32 0.24 0.31 0.23 0.29 0.23 0.28 0.22 0.28 0.22 0.27 0.22
Motorway Free Flow 0.30 0.28 0.28 0.23 0.27 0.20 0.25 0.19 0.24 0.18 0.23 0.17 0.22 0.17 0.21 0.16 0.20 0.16 0.20 0.16
Urban Heavy Congestion 0.39 3.78 0.37 3.37 0.34 3.05 0.32 2.80 0.30 2.60 0.29 2.47 0.28 2.37 0.27 2.31 0.26 2.27 0.25 2.24
Urban Light Congestion 0.28 1.50 0.26 1.27 0.25 1.10 0.23 0.97 0.22 0.87 0.21 0.80 0.20 0.74 0.19 0.71 0.19 0.69 0.18 0.67
Urban Free Flow 0.21 0.69 0.20 0.57 0.18 0.47 0.17 0.40 0.16 0.35 0.16 0.31 0.15 0.28 0.14 0.26 0.14 0.25 0.14 0.25
Urban High Speed 0.26 0.49 0.24 0.39 0.22 0.32 0.21 0.27 0.20 0.23 0.19 0.20 0.18 0.18 0.18 0.16 0.17 0.15 0.17 0.15
Rural Heavy Congestion 0.42 3.19 0.39 2.91 0.37 2.71 0.35 2.57 0.33 2.46 0.31 2.39 0.30 2.34 0.29 2.31 0.28 2.30 0.28 2.29
Rural Light Congestion 0.30 1.15 0.28 1.00 0.27 0.89 0.25 0.81 0.24 0.76 0.23 0.72 0.22 0.69 0.21 0.68 0.21 0.67 0.20 0.67
Rural Free Flow 0.22 0.49 0.21 0.41 0.20 0.35 0.19 0.31 0.18 0.29 0.17 0.27 0.16 0.26 0.16 0.25 0.15 0.24 0.15 0.24
Rural High Speed 0.27 0.33 0.26 0.26 0.24 0.22 0.23 0.20 0.22 0.18 0.21 0.17 0.20 0.16 0.19 0.15 0.19 0.15 0.19 0.15
London Centre Heavy Congestion 0.47 4.05 0.44 3.65 0.41 3.20 0.38 2.76 0.36 2.20 0.34 1.85 0.33 1.76 0.31 1.72 0.30 1.67 0.29 1.64
London Centre Light Congestion 0.34 1.72 0.32 1.51 0.30 1.27 0.28 1.05 0.26 0.77 0.25 0.60 0.24 0.55 0.23 0.53 0.22 0.51 0.21 0.50
London Centre Free Flow 0.26 0.77 0.24 0.65 0.23 0.54 0.21 0.44 0.20 0.31 0.19 0.23 0.18 0.21 0.17 0.20 0.17 0.19 0.16 0.18
London Centre High Speed 0.32 0.54 0.30 0.46 0.28 0.38 0.26 0.30 0.25 0.21 0.24 0.14 0.23 0.13 0.21 0.12 0.21 0.11 0.20 0.11
London Inner Heavy Congestion 0.41 4.02 0.38 3.60 0.35 3.17 0.33 2.78 0.31 2.33 0.30 2.05 0.28 1.96 0.27 1.92 0.26 1.88 0.25 1.85
London Inner Light Congestion 0.29 1.69 0.27 1.46 0.25 1.23 0.24 1.03 0.23 0.80 0.21 0.65 0.20 0.61 0.20 0.59 0.19 0.57 0.18 0.56
London Inner Free Flow 0.22 0.75 0.21 0.62 0.19 0.51 0.18 0.42 0.17 0.32 0.16 0.25 0.15 0.23 0.15 0.22 0.14 0.20 0.14 0.20
London Inner High Speed 0.27 0.50 0.25 0.41 0.23 0.34 0.22 0.27 0.21 0.20 0.20 0.15 0.19 0.14 0.18 0.13 0.17 0.12 0.17 0.12
London Outer Heavy Congestion 0.39 3.98 0.36 3.57 0.34 3.14 0.32 2.77 0.30 2.34 0.28 2.06 0.27 1.98 0.26 1.94 0.25 1.90 0.24 1.88
London Outer Light Congestion 0.28 1.66 0.26 1.44 0.24 1.21 0.23 1.02 0.22 0.80 0.20 0.66 0.19 0.62 0.19 0.60 0.18 0.58 0.17 0.57
London Outer Free Flow 0.21 0.74 0.19 0.61 0.18 0.50 0.17 0.41 0.16 0.31 0.15 0.25 0.15 0.23 0.14 0.22 0.14 0.21 0.13 0.20
London Outer High Speed 0.25 0.49 0.24 0.40 0.22 0.33 0.21 0.27 0.20 0.19 0.19 0.15 0.18 0.13 0.17 0.13 0.16 0.12 0.16 0.12
London Motorway Heavy Congestion 0.46 0.43 0.43 0.36 0.41 0.31 0.38 0.28 0.36 0.26 0.34 0.25 0.33 0.24 0.31 0.24 0.30 0.24 0.30 0.24
London Motorway Light Congestion 0.41 0.38 0.39 0.32 0.36 0.27 0.34 0.25 0.32 0.24 0.30 0.23 0.29 0.22 0.28 0.21 0.27 0.21 0.26 0.21
London Motorway Free Flow 0.30 0.28 0.29 0.23 0.27 0.20 0.25 0.19 0.24 0.17 0.22 0.17 0.21 0.16 0.21 0.16 0.20 0.16 0.20 0.16

INTERIM ADVICE NOTE 185/15
Updated traffic, air quality and noise advice
IAN 185/15 Page 20 of 23 Jan 15
Annex C2 PM10 Emissions (g/km per vehicle) 2011 to 2020 2011 2011 2012 2012 2013 2013 2014 2014 2015 2015 2016 2016 2017 2017 2018 2018 2019 2019 2020 2020
LDV HDV LDV HDV LDV HDV LDV HDV LDV HDV LDV HDV LDV HDV LDV HDV LDV HDV LDV HDV
Motorway Heavy Congestion 0.05 0.19 0.04 0.18 0.04 0.17 0.04 0.15 0.04 0.14 0.03 0.13 0.03 0.13 0.03 0.12 0.03 0.12 0.03 0.11
Motorway Light Congestion 0.04 0.17 0.04 0.16 0.04 0.15 0.03 0.14 0.03 0.13 0.03 0.12 0.03 0.11 0.03 0.11 0.03 0.10 0.02 0.10
Motorway Free Flow 0.03 0.13 0.03 0.12 0.03 0.11 0.03 0.10 0.02 0.09 0.02 0.09 0.02 0.08 0.02 0.08 0.02 0.08 0.02 0.08
Urban Heavy Congestion 0.05 0.30 0.04 0.28 0.04 0.26 0.04 0.23 0.04 0.21 0.04 0.19 0.04 0.18 0.03 0.16 0.03 0.15 0.03 0.14
Urban Light Congestion 0.04 0.21 0.04 0.20 0.04 0.19 0.04 0.18 0.04 0.17 0.03 0.16 0.03 0.15 0.03 0.14 0.03 0.13 0.03 0.13
Urban Free Flow 0.04 0.18 0.04 0.17 0.04 0.16 0.04 0.16 0.03 0.15 0.03 0.14 0.03 0.14 0.03 0.13 0.03 0.13 0.03 0.12
Urban High Speed 0.04 0.17 0.04 0.17 0.04 0.16 0.04 0.15 0.04 0.14 0.03 0.14 0.03 0.13 0.03 0.13 0.03 0.13 0.03 0.12
Rural Heavy Congestion 0.04 0.27 0.04 0.25 0.03 0.22 0.03 0.20 0.03 0.17 0.03 0.15 0.03 0.14 0.03 0.13 0.03 0.12 0.02 0.11
Rural Light Congestion 0.03 0.18 0.03 0.17 0.03 0.16 0.03 0.14 0.03 0.13 0.03 0.12 0.03 0.11 0.02 0.11 0.02 0.10 0.02 0.10
Rural Free Flow 0.03 0.15 0.03 0.14 0.03 0.13 0.03 0.13 0.03 0.12 0.03 0.11 0.02 0.11 0.02 0.10 0.02 0.10 0.02 0.10
Rural High Speed 0.04 0.14 0.03 0.14 0.03 0.13 0.03 0.12 0.03 0.11 0.03 0.11 0.03 0.10 0.02 0.10 0.02 0.10 0.02 0.10
London Centre Heavy Congestion 0.06 0.19 0.06 0.18 0.06 0.17 0.05 0.16 0.05 0.15 0.05 0.14 0.05 0.13 0.04 0.13 0.04 0.12 0.04 0.12
London Centre Light Congestion 0.04 0.16 0.04 0.15 0.04 0.14 0.04 0.13 0.04 0.12 0.04 0.12 0.04 0.11 0.03 0.11 0.03 0.11 0.03 0.11
London Centre Free Flow 0.04 0.14 0.04 0.13 0.04 0.13 0.04 0.12 0.04 0.11 0.04 0.11 0.03 0.11 0.03 0.10 0.03 0.10 0.03 0.10
London Centre High Speed 0.05 0.14 0.05 0.13 0.04 0.12 0.04 0.12 0.04 0.11 0.04 0.11 0.04 0.11 0.04 0.10 0.03 0.10 0.03 0.10
London Inner Heavy Congestion 0.05 0.21 0.05 0.19 0.05 0.18 0.04 0.17 0.04 0.16 0.04 0.15 0.04 0.14 0.04 0.14 0.04 0.13 0.03 0.12
London Inner Light Congestion 0.04 0.16 0.04 0.15 0.04 0.15 0.04 0.14 0.04 0.13 0.03 0.13 0.03 0.12 0.03 0.12 0.03 0.12 0.03 0.11
London Inner Free Flow 0.04 0.15 0.04 0.14 0.04 0.13 0.04 0.13 0.03 0.12 0.03 0.12 0.03 0.11 0.03 0.11 0.03 0.11 0.03 0.11
London Inner High Speed 0.04 0.14 0.04 0.13 0.04 0.13 0.04 0.12 0.04 0.12 0.04 0.12 0.03 0.11 0.03 0.11 0.03 0.11 0.03 0.11
London Outer Heavy Congestion 0.05 0.21 0.04 0.19 0.04 0.18 0.04 0.17 0.04 0.16 0.04 0.15 0.04 0.14 0.03 0.14 0.03 0.13 0.03 0.13
London Outer Light Congestion 0.04 0.16 0.04 0.15 0.04 0.15 0.04 0.14 0.04 0.13 0.03 0.13 0.03 0.12 0.03 0.12 0.03 0.12 0.03 0.11
London Outer Free Flow 0.04 0.15 0.04 0.14 0.04 0.13 0.04 0.13 0.03 0.12 0.03 0.12 0.03 0.12 0.03 0.11 0.03 0.11 0.03 0.11
London Outer High Speed 0.04 0.14 0.04 0.13 0.04 0.13 0.04 0.12 0.04 0.12 0.03 0.12 0.03 0.11 0.03 0.11 0.03 0.11 0.03 0.11
London Motorway Heavy Congestion 0.05 0.19 0.04 0.18 0.04 0.16 0.04 0.15 0.04 0.14 0.03 0.13 0.03 0.12 0.03 0.12 0.03 0.11 0.03 0.11
London Motorway Light Congestion 0.04 0.17 0.04 0.16 0.04 0.15 0.03 0.13 0.03 0.12 0.03 0.12 0.03 0.11 0.03 0.11 0.03 0.10 0.02 0.10
London Motorway Free Flow 0.03 0.12 0.03 0.12 0.03 0.11 0.03 0.10 0.02 0.09 0.02 0.09 0.02 0.08 0.02 0.08 0.02 0.08 0.02 0.07

INTERIM ADVICE NOTE 185/15
Updated traffic, air quality and noise advice
IAN 185/15 Page 21 of 23 Jan 15
Annex C2 (continue) PM10 Emissions (g/km per vehicle) 2021 to 2030 2021 2021 2022 2022 2023 2023 2024 2024 2025 2025 2026 2026 2027 2027 2028 2028 2029 2029 2030 2030 LDV HDV LDV HDV LDV HDV LDV HDV LDV HDV LDV HDV LDV HDV LDV HDV LDV HDV LDV HDV
Motorway Heavy Congestion 0.03 0.11 0.03 0.11 0.03 0.11 0.03 0.11 0.03 0.11 0.03 0.11 0.03 0.11 0.03 0.11 0.03 0.11 0.03 0.11
Motorway Light Congestion 0.02 0.10 0.02 0.10 0.02 0.10 0.02 0.10 0.02 0.10 0.02 0.10 0.02 0.10 0.02 0.10 0.02 0.10 0.02 0.10
Motorway Free Flow 0.02 0.07 0.02 0.07 0.02 0.07 0.02 0.07 0.02 0.07 0.02 0.07 0.02 0.07 0.02 0.07 0.02 0.07 0.02 0.07
Urban Heavy Congestion 0.03 0.14 0.03 0.13 0.03 0.13 0.03 0.13 0.03 0.13 0.03 0.12 0.03 0.12 0.03 0.12 0.03 0.12 0.03 0.12
Urban Light Congestion 0.03 0.13 0.03 0.12 0.03 0.12 0.03 0.12 0.03 0.12 0.03 0.12 0.03 0.12 0.03 0.12 0.03 0.12 0.03 0.12
Urban Free Flow 0.03 0.12 0.03 0.12 0.03 0.12 0.03 0.12 0.03 0.12 0.03 0.12 0.03 0.12 0.03 0.12 0.03 0.12 0.03 0.12
Urban High Speed 0.03 0.12 0.03 0.12 0.03 0.12 0.03 0.12 0.03 0.12 0.03 0.12 0.03 0.12 0.03 0.12 0.03 0.12 0.03 0.12
Rural Heavy Congestion 0.02 0.10 0.02 0.10 0.02 0.10 0.02 0.10 0.02 0.10 0.02 0.10 0.02 0.10 0.02 0.10 0.02 0.10 0.02 0.10
Rural Light Congestion 0.02 0.10 0.02 0.10 0.02 0.10 0.02 0.09 0.02 0.09 0.02 0.09 0.02 0.09 0.02 0.09 0.02 0.09 0.02 0.09
Rural Free Flow 0.02 0.09 0.02 0.09 0.02 0.09 0.02 0.09 0.02 0.09 0.02 0.09 0.02 0.09 0.02 0.09 0.02 0.09 0.02 0.09
Rural High Speed 0.02 0.09 0.02 0.09 0.02 0.09 0.02 0.09 0.02 0.09 0.02 0.09 0.02 0.09 0.02 0.09 0.02 0.09 0.02 0.09
London Centre Heavy Congestion 0.04 0.11 0.04 0.11 0.03 0.11 0.03 0.10 0.03 0.10 0.03 0.09 0.03 0.09 0.03 0.09 0.03 0.09 0.03 0.09
London Centre Light Congestion 0.03 0.10 0.03 0.10 0.03 0.10 0.03 0.10 0.03 0.09 0.03 0.09 0.03 0.09 0.03 0.09 0.03 0.09 0.03 0.09
London Centre Free Flow 0.03 0.10 0.03 0.10 0.03 0.10 0.03 0.09 0.03 0.09 0.03 0.09 0.03 0.09 0.03 0.09 0.03 0.09 0.03 0.09
London Centre High Speed 0.03 0.10 0.03 0.10 0.03 0.09 0.03 0.09 0.03 0.09 0.03 0.09 0.03 0.09 0.03 0.09 0.03 0.09 0.03 0.09
London Inner Heavy Congestion 0.03 0.12 0.03 0.12 0.03 0.11 0.03 0.11 0.03 0.11 0.03 0.10 0.03 0.10 0.03 0.10 0.03 0.10 0.03 0.10
London Inner Light Congestion 0.03 0.11 0.03 0.11 0.03 0.11 0.03 0.10 0.03 0.10 0.03 0.10 0.03 0.10 0.03 0.10 0.03 0.10 0.03 0.10
London Inner Free Flow 0.03 0.11 0.03 0.10 0.03 0.10 0.03 0.10 0.03 0.10 0.03 0.10 0.03 0.10 0.03 0.10 0.03 0.10 0.03 0.10
London Inner High Speed 0.03 0.11 0.03 0.10 0.03 0.10 0.03 0.10 0.03 0.10 0.03 0.10 0.03 0.10 0.03 0.10 0.03 0.10 0.03 0.10
London Outer Heavy Congestion 0.03 0.12 0.03 0.12 0.03 0.11 0.03 0.11 0.03 0.11 0.03 0.11 0.03 0.10 0.03 0.10 0.03 0.10 0.03 0.10
London Outer Light Congestion 0.03 0.11 0.03 0.11 0.03 0.11 0.03 0.11 0.03 0.10 0.03 0.10 0.03 0.10 0.03 0.10 0.03 0.10 0.03 0.10
London Outer Free Flow 0.03 0.11 0.03 0.11 0.03 0.10 0.03 0.10 0.03 0.10 0.03 0.10 0.03 0.10 0.03 0.10 0.03 0.10 0.03 0.10
London Outer High Speed 0.03 0.11 0.03 0.11 0.03 0.10 0.03 0.10 0.03 0.10 0.03 0.10 0.03 0.10 0.03 0.10 0.03 0.10 0.03 0.10
London Motorway Heavy Congestion 0.03 0.11 0.03 0.11 0.03 0.11 0.03 0.11 0.03 0.11 0.02 0.11 0.02 0.11 0.02 0.11 0.02 0.11 0.02 0.11
London Motorway Light Congestion 0.02 0.10 0.02 0.10 0.02 0.10 0.02 0.10 0.02 0.10 0.02 0.10 0.02 0.10 0.02 0.10 0.02 0.10 0.02 0.10
London Motorway Free Flow 0.02 0.07 0.02 0.07 0.02 0.07 0.02 0.07 0.02 0.07 0.02 0.07 0.02 0.07 0.02 0.07 0.02 0.07 0.02 0.07

INTERIM ADVICE NOTE 185/15
Updated traffic, air quality and noise advice
IAN 185/15 Page 22 of 23 Jan 15
Annex C3 CO2 Emissions (g/km per vehicle) 2011 to 2020 2011 2011 2012 2012 2013 2013 2014 2014 2015 2015 2016 2016 2017 2017 2018 2018 2019 2019 2020 2020
LDV HDV LDV HDV LDV HDV LDV HDV LDV HDV LDV HDV LDV HDV LDV HDV LDV HDV LDV HDV
Motorway Heavy Congestion 249.44 1262.58 244.74 1247.99 240.47 1234.14 236.31 1220.96 230.54 1208.28 224.73 1207.82 219.51 1207.76 214.89 1207.89 210.75 1208.20 206.74 1208.65
Motorway Light Congestion 222.97 1128.59 218.77 1115.54 214.95 1103.16 211.23 1091.38 206.08 1080.04 200.88 1079.63 196.22 1079.58 192.08 1079.70 188.38 1079.97 184.79 1080.38
Motorway Free Flow 164.43 832.29 161.33 822.67 158.52 813.54 155.77 804.85 151.97 796.49 148.14 796.19 144.70 796.15 141.65 796.24 138.92 796.44 136.28 796.74
Urban Heavy Congestion 402.14 1731.60 396.53 1725.83 391.40 1718.11 386.14 1711.75 379.78 1706.36 373.59 1707.13 367.78 1707.93 362.29 1708.17 356.93 1708.85 351.28 1710.20
Urban Light Congestion 180.09 843.43 176.93 839.69 174.01 835.20 171.11 831.76 167.09 829.19 162.99 828.89 159.15 828.76 155.56 828.67 152.17 828.80 148.75 829.18
Urban Free Flow 150.65 636.77 147.53 633.76 144.61 630.20 141.73 627.48 137.75 625.42 133.74 624.86 130.02 624.51 126.61 624.23 123.47 624.17 120.41 624.35
Urban High Speed 165.56 663.24 162.45 660.27 159.47 656.74 156.51 654.04 152.44 652.02 148.42 651.39 144.69 651.01 141.26 650.70 138.10 650.64 134.98 650.83
Rural Heavy Congestion 404.42 1730.22 399.08 1712.71 393.76 1695.56 388.62 1679.29 382.49 1663.70 376.68 1665.76 371.39 1667.62 366.54 1669.23 362.00 1670.89 357.35 1672.71
Rural Light Congestion 180.90 957.38 177.88 942.96 174.96 929.12 172.18 916.17 168.34 903.98 164.47 904.42 160.89 905.01 157.62 905.70 154.60 906.51 151.62 907.47
Rural Free Flow 151.13 721.50 148.51 711.05 145.64 701.08 142.87 691.83 139.05 683.18 135.24 683.14 131.77 683.31 128.64 683.59 125.83 684.02 123.14 684.58
Rural High Speed 165.25 753.23 164.34 742.75 161.49 732.76 158.65 723.52 154.77 714.89 150.99 714.76 147.54 714.86 144.43 715.09 141.65 715.49 138.97 716.03
London Centre Heavy Congestion 412.03 636.20 407.56 640.53 403.38 655.47 399.10 674.64 392.02 692.35 379.64 704.93 365.80 710.24 353.64 715.49 342.35 720.80 330.86 726.44
London Centre Light Congestion 181.49 357.31 178.97 358.11 176.56 366.10 174.17 376.50 170.14 386.09 163.95 392.73 157.29 395.41 151.38 398.07 145.94 400.84 140.48 403.87
London Centre Free Flow 154.52 277.74 152.03 278.08 149.62 284.15 147.24 292.10 143.33 299.42 137.51 304.45 131.33 306.45 125.88 308.44 120.93 310.54 116.04 312.84
London Centre High Speed 176.46 295.10 173.97 295.43 171.52 301.85 169.09 310.26 164.93 318.00 158.31 323.33 151.14 325.43 144.85 327.53 139.12 329.75 133.46 332.18
London Inner Heavy Congestion 398.37 888.30 393.15 892.13 388.22 906.93 383.18 925.34 375.35 942.09 362.60 953.70 348.60 958.65 336.21 963.44 324.66 968.26 312.87 973.43
London Inner Light Congestion 178.89 500.23 175.94 500.20 173.12 507.99 170.31 517.88 165.77 526.85 159.21 532.86 152.27 535.26 146.08 537.60 140.35 540.06 134.60 542.81
London Inner Free Flow 149.87 387.36 146.94 386.95 144.12 392.78 141.34 400.26 136.91 407.03 130.70 411.53 124.22 413.27 118.48 414.99 113.25 416.82 108.10 418.88
London Inner High Speed 165.36 410.74 162.41 410.27 159.54 416.41 156.69 424.30 152.01 431.44 145.04 436.17 137.63 438.00 131.10 439.80 125.14 441.73 119.25 443.90
London Outer Heavy Congestion 395.01 937.55 389.50 941.14 384.28 955.31 378.95 972.85 370.94 988.71 358.45 999.91 344.89 1004.77 332.84 1009.47 321.57 1014.19 310.05 1019.26
London Outer Light Congestion 178.46 528.07 175.35 527.79 172.37 535.18 169.41 544.54 164.72 552.97 158.18 558.74 151.33 561.09 145.20 563.37 139.51 565.78 133.80 568.49
London Outer Free Flow 148.70 408.79 145.61 408.17 142.63 413.71 139.70 420.79 135.11 427.16 128.90 431.45 122.48 433.14 116.78 434.80 111.58 436.58 106.46 438.58
London Outer High Speed 162.05 433.41 158.93 432.71 155.89 438.55 152.88 446.02 148.06 452.75 141.15 457.26 133.87 459.01 127.44 460.74 121.57 462.61 115.77 464.71
London Motorway Heavy Congestion 246.01 1146.05 241.15 1142.84 236.57 1142.95 232.17 1144.44 226.17 1146.23 220.03 1146.45 214.48 1145.95 209.54 1145.68 205.11 1145.57 200.81 1145.60
London Motorway Light Congestion 219.90 1024.42 215.55 1021.55 211.46 1021.65 207.53 1022.98 202.17 1024.58 196.67 1024.77 191.72 1024.33 187.30 1024.09 183.34 1023.99 179.50 1024.02
London Motorway Free Flow 162.17 755.47 158.96 753.35 155.95 753.43 153.05 754.41 149.09 755.59 145.04 755.73 141.39 755.41 138.13 755.23 135.21 755.15 132.37 755.18

INTERIM ADVICE NOTE 185/15
Updated traffic, air quality and noise advice
IAN 185/15 Page 23 of 23 Jan 15
Annex C3 (continue) CO2 Emissions (g/km per vehicle) 2021 to 2030 2021 2021 2022 2022 2023 2023 2024 2024 2025 2025 2026 2026 2027 2027 2028 2028 2029 2029 2030 2030 LDV HDV LDV HDV LDV HDV LDV HDV LDV HDV LDV HDV LDV HDV LDV HDV LDV HDV LDV HDV
Motorway Heavy Congestion 203.36 1209.72 200.44 1210.96 197.89 1212.15 195.68 1213.28 193.72 1214.39 191.70 1213.98 190.26 1213.57 188.95 1213.17 187.76 1212.77 186.64 1212.38
Motorway Light Congestion 181.78 1081.33 179.16 1082.44 176.89 1083.51 174.91 1084.51 173.16 1085.51 171.36 1085.14 170.07 1084.77 168.90 1084.42 167.84 1084.06 166.83 1083.71
Motorway Free Flow 134.06 797.44 132.13 798.26 130.45 799.05 128.99 799.79 127.70 800.52 126.37 800.25 125.42 799.98 124.55 799.72 123.77 799.46 123.03 799.19
Urban Heavy Congestion 345.98 1710.04 341.26 1709.71 336.82 1708.97 332.62 1708.06 328.68 1707.23 323.90 1706.05 320.09 1704.93 316.29 1704.02 312.54 1702.92 308.70 1701.59
Urban Light Congestion 145.67 829.64 142.94 830.26 140.43 830.86 138.12 831.41 136.00 831.98 133.59 832.21 131.67 832.44 129.84 832.68 128.08 832.88 126.35 833.01
Urban Free Flow 117.68 624.65 115.29 625.12 113.12 625.58 111.17 626.02 109.39 626.47 107.44 626.70 105.90 626.94 104.44 627.20 103.05 627.42 101.68 627.59
Urban High Speed 132.20 651.17 129.74 651.70 127.52 652.22 125.50 652.72 123.66 653.23 121.64 653.53 120.04 653.83 118.51 654.15 117.03 654.43 115.56 654.67
Rural Heavy Congestion 353.14 1674.86 349.48 1676.98 346.22 1678.89 343.26 1680.64 340.55 1682.39 337.32 1681.87 334.99 1681.38 332.71 1680.95 330.50 1680.48 328.26 1679.94
Rural Light Congestion 149.00 908.95 146.71 910.58 144.67 912.16 142.86 913.66 141.22 915.14 139.41 915.19 138.05 915.23 136.79 915.28 135.62 915.32 134.49 915.33
Rural Free Flow 120.80 685.54 118.77 686.65 117.00 687.72 115.45 688.75 114.08 689.76 112.63 689.82 111.57 689.88 110.60 689.95 109.72 690.00 108.88 690.05
Rural High Speed 136.62 716.97 134.60 718.07 132.83 719.14 131.28 720.16 129.91 721.17 128.50 721.26 127.49 721.34 126.56 721.43 125.72 721.51 124.92 721.58
London Centre Heavy Congestion 321.24 732.12 313.52 737.29 306.10 742.39 300.26 747.85 295.37 752.89 290.01 758.36 285.79 764.11 281.87 769.95 278.37 775.88 275.20 781.91
London Centre Light Congestion 135.91 406.96 132.19 409.82 128.67 412.65 125.86 415.69 123.48 418.49 120.96 421.53 118.98 424.73 117.17 427.98 115.57 431.27 114.15 434.62
London Centre Free Flow 111.98 315.19 108.69 317.39 105.60 319.57 103.16 321.92 101.13 324.09 99.03 326.45 97.38 328.92 95.90 331.44 94.60 333.99 93.46 336.58
London Centre High Speed 128.77 334.67 125.01 336.99 121.45 339.31 118.70 341.81 116.42 344.11 114.08 346.61 112.23 349.24 110.58 351.91 109.14 354.62 107.89 357.37
London Inner Heavy Congestion 302.90 978.56 294.81 983.19 287.07 987.65 280.84 992.38 275.55 996.72 269.62 1001.43 264.98 1006.36 260.64 1011.34 256.71 1016.37 253.10 1021.44
London Inner Light Congestion 129.75 545.58 125.76 548.14 122.01 550.63 118.95 553.27 116.33 555.68 113.51 558.31 111.30 561.06 109.27 563.83 107.47 566.64 105.84 569.47
London Inner Free Flow 103.79 420.98 100.26 422.93 96.97 424.83 94.32 426.87 92.09 428.73 89.75 430.76 87.92 432.88 86.27 435.02 84.81 437.18 83.52 439.37
London Inner High Speed 114.35 446.10 110.37 448.16 106.64 450.18 103.68 452.34 101.21 454.31 98.63 456.46 96.61 458.71 94.78 460.98 93.18 463.27 91.77 465.58
London Outer Heavy Congestion 300.25 1024.26 292.24 1028.78 284.58 1033.12 278.34 1037.68 272.99 1041.88 266.93 1046.45 262.19 1051.22 257.75 1056.03 253.70 1060.89 249.94 1065.79
London Outer Light Congestion 128.96 571.20 124.96 573.71 121.19 576.13 118.09 578.69 115.41 581.04 112.51 583.60 110.24 586.27 108.16 588.97 106.29 591.70 104.59 594.45
London Outer Free Flow 102.16 440.62 98.61 442.51 95.32 444.36 92.64 446.32 90.36 448.13 87.96 450.09 86.09 452.14 84.39 454.20 82.88 456.29 81.53 458.39
London Outer High Speed 110.91 466.84 106.95 468.84 103.24 470.79 100.27 472.86 97.77 474.76 95.13 476.83 93.07 479.00 91.21 481.18 89.56 483.38 88.10 485.60
London Motorway Heavy Congestion 197.18 1145.90 194.01 1146.33 191.22 1146.74 188.79 1147.16 186.61 1147.52 184.25 1147.75 182.47 1148.01 180.83 1148.28 179.33 1148.55 177.89 1148.83
London Motorway Light Congestion 176.25 1024.28 173.42 1024.67 170.93 1025.04 168.75 1025.41 166.80 1025.73 164.69 1025.94 163.10 1026.17 161.64 1026.41 160.30 1026.65 159.01 1026.90
London Motorway Free Flow 129.98 755.37 127.89 755.65 126.05 755.93 124.45 756.20 123.01 756.44 121.46 756.59 120.28 756.76 119.21 756.94 118.21 757.12 117.27 757.30