Interest Rate and Foreign Exchange Sensitivity of Bank ... · Interest Rate and Foreign Exchange...
39
1 Interest Rate and Foreign Exchange Sensitivity of Bank Stock Returns: Evidence from China 1 Xiangnan Meng Centre for Regulation and Market Analysis, School of Commerce, University of South Australia, Australia GPO Box 2471, Adelaide, SA 5001, Australia Tel: 61-8-83020231 Fax: 61-8-83020992 Email: [email protected] Xin Deng Centre for Regulation and Market Analysis, School of Commerce, University of South Australia, Australia GPO Box 2471, Adelaide, SA 5001, Australia Tel: 61-8-83020743 Fax: 61-8-83020992 Email: [email protected] Abstract: This study employs a GARCH model to investigate the effects of interest rate and foreign exchange rate changes on Chinese banks’ stock returns. The results suggest that market movement and foreign exchange rate changes are statistically significant in explaining banks’ stock returns, despite different reactions from different bank portfolios in regard to risks. Interest rate fluctuations, on the other hand, appear to be insignificant factors in equity pricing. The results confirm the link between market risks and stock returns and highlight the need for further interest rate liberalization. Keywords: risks, GARCH, banking industry, China JEL: G1, G2 1 We would like to thank two anonymous referees for their constructive suggestions, and Dr. Kerrie Round for her editorial assistance. All mistakes and errors remain to be our own responsibility.
Transcript of Interest Rate and Foreign Exchange Sensitivity of Bank ... · Interest Rate and Foreign Exchange...

1
Interest Rate and Foreign Exchange Sensitivity of Bank Stock Returns: Evidence from China1
Xiangnan Meng
Centre for Regulation and Market Analysis,
School of Commerce, University of South Australia, Australia
GPO Box 2471, Adelaide, SA 5001, Australia
Tel: 61-8-83020231 Fax: 61-8-83020992
Email: [email protected]
Xin Deng
Centre for Regulation and Market Analysis,
School of Commerce, University of South Australia, Australia
GPO Box 2471, Adelaide, SA 5001, Australia
Tel: 61-8-83020743 Fax: 61-8-83020992
Email: [email protected]
Abstract: This study employs a GARCH model to investigate the effects of interest rate and foreign
exchange rate changes on Chinese banks’ stock returns. The results suggest that market movement
and foreign exchange rate changes are statistically significant in explaining banks’ stock returns,
despite different reactions from different bank portfolios in regard to risks. Interest rate fluctuations,
on the other hand, appear to be insignificant factors in equity pricing. The results confirm the link
between market risks and stock returns and highlight the need for further interest rate liberalization.
Keywords: risks, GARCH, banking industry, China
JEL: G1, G2
1 We would like to thank two anonymous referees for their constructive suggestions, and Dr. Kerrie Round for her editorial assistance. All mistakes and errors remain to be our own responsibility.

2
1. Introduction
As financial intermediaries, banks’ sensitivity to risk is crucial to the stability and health of the
financial system (Barth, Caprio and Levine (2004)). Economic theory and empirical evidence indicate
that instability in the banking sector is associated with instability in the macro economy (Kaufman
(2004)). A crisis in the banking sector often leads to economic turmoil that may trigger further crises
(Demirgüç-Kunt and Detragiache (1998)). In recent years, financial liberalization has reduced barriers
to competition and exposed the banking sector to many sources of risk (Wilson et al. (2010)). Among
these, interest rate risk and foreign exchange risk are of particular interest to researchers and policy
makers (Wetmore and Brick (1994), Elyasiani and Mansur (2004), Kasman, Vardar and Tunc (2011)).
The emphasis on interest rate risk exposure is primarily rooted in the nature of banks (Choi, Elyasiani
and Kopecky (1992)). The fundamental model of stock pricing suggests that stock prices depend on
their discounted stream of expected cash flows (Kwan (1991)). The share prices of industrial firms
fluctuate with the cash flow that is generated by real assets. These firms are therefore less sensitive to
interest rate changes compared with banks, whose cash flow depends on nominal assets that are fixed
in nominal terms, such as debt, cash and account receivables (Saunders and Yourougou (1990),
Yourougou (1990), Kwan (1991)). With an increased exposure of the international banking business,
swings in foreign exchange rates also influence bank performance, making it one of the common risk
factors (Viale, Kolari and Fraser (2009)).
In China, the banking industry has undergone a series of reforms foremost among these being
liberalization and deregulation (Lo and Chan (2000), García-Herrero, Gavilá and Santabárbara
(2006)). The policy initiatives that have impacted most strongly on the banking industry are the
gradual removal of government controls on interest rates and, from 2005, the adoption of a managed
floating regime of foreign exchange rates. As a result of the reforms, Chinese banks are facing
increasing competition and are operating in a more volatile environment as well as being subject to
greater market discipline. Deregulation has produced opportunities for Chinese banks but exposed
them to new risk factors. Table 1 demonstrates the key steps in China’s interest rate liberalization.

3
Commercial banks were given more autonomy in setting their lending rates, but they are not allowed
to charge a rate that is lower than the official lending rates or higher than the official deposit rates set
by the central bank (Porter and Xu (2009)).
In China’s dual-track interest rate system, interest rates in monetary and bonds markets are market-
determined and lending and deposit rates are controlled by the central bank. In a free market, a change
of the interest rate in the money market will lead to a change of the primary lending rate. Through the
expected channels, the movement of interest rates is transformed into different maturities (Geiger
(2008)). In a partially liberalized financial system, changes in the market interest rate and the
regulated interest rate have segmented impacts on commercial banks. In China’s current financial
system, changes in the market-determined interest rates tend to influence the refinancing costs of
commercial banks; changes in controlled interest rates tend to influence the funds which have been
already at the banks’ disposal.
Insert Table 1 here
As shown in Figure 1, 2005 marks the beginning of the gradual appreciation of the Chinese currency
against the US dollar. Fluctuations in the foreign exchange rate may directly bring in uncertainty to
banks’ un-hedged foreign assets and liabilities (Wong, Wong and Leung (2009)). Even when banks
hedge their exposure to foreign assets and liabilities, exchange risk may arise due to indirect channels
through their clients (Chamberlain, Howe and Popper (1997)). In addition to the reform of the
exchange rate regime, the central bank of China launched the qualified domestic institutional investor
(QDII) program in May 2006 (Tian (2008)). Accredited Chinese banks are now allowed to invest in
offshore securities, but are subsequently subject to a larger foreign exchange risk exposure.
From a corporate perspective, it is worthwhile to evaluate the biggest risks for further risk
management activities (Bartram (2005)). From an industry perspective, a better understanding of risk
factors will provide insights for future reform and is crucial in maintaining a stable banking industry
that functions well as a part of a financial market. In addition, a rise in off-balance sheet business
makes banks’ exposure to interest rate risk and foreign exchange risk far greater than the banks’

4
foreign assets show. Rapid growth of investment banking operations makes risk identification and
evaluating and controlling risk-taking behaviors important and urgent. Accommodating market factors
for regulatory control over risk-taking behaviors is in accordance with market discipline, as a major
regulatory device under the second Basel Accord (Viale, Kolari and Fraser (2009)). Therefore,
identifying the risk factors of a bank’s stock is essential to banking regulation and risk management.
Insert Figure 1 here
The impact of interest rate and foreign exchange rate movements on the risks of banking institutions
has been well researched for developed countries (Akella and Chen (1990), Choi, Elyasiani and
Kopecky (1992), Brooks, Faff and Ho (1997), Elyasiani and Mansur (2004)), but few studies have
explicitly investigated emerging and transitional economies. This paper investigates Chinese banks’
exposure to interest rate and exchange rate risks by using a GARCH model. It explores the banking
sector of the largest emerging economy in a period of gradual financial liberalization, which changes
the bank’s role from a fiscal agent under a planned economy to a financial intermediary. Banks in
China have acquired significant autonomy of operation, but liberalization of interest and foreign
exchange rates are not yet complete. An evaluation of the impact of risk exposure on banks’ returns
and volatility will shed light on future reform and regulation.
The contribution of this paper is three-fold. First, unlike existing studies that are limited to the signs
and magnitude of risk contributors, this paper investigates the speed with which banking stock returns
incorporate external shocks. Instant response to market information is less evident in this study
compared with studies on developed markets. Second, the impact of monetary policies on bank stock
volatility is simultaneously examined. Unlike most developed economies, China’s monetary policy
and bank supervision are managed by different government departments. Since 2003, the supervisory
functions have been carved out from the central bank to a newly established body, the China Banking
Regulatory Commission (CBRC). The risk control objectives of the CBRC will be influenced by
monetary policy. Third, to the authors’ best knowledge, this is the first study to draw a comprehensive
picture of the joint exposure of the market and extra-market risk factors of Chinese banks. The use of

5
equity data can reflect underlying economic features without being influenced by possible accounting
disaccord (Stiroh (2006)). The daily data can provide stronger evidence for the identification of risk
factors than less frequent data (Kasman, Vardar and Tunc (2011)).
The structure of the paper is as follows. First, the theoretical and empirical literature on banks’ risks is
reviewed, embedding different operating environments that direct the characteristics of banking
practices. The banking industries of different countries have their own particular features, being
products of conditions of financial systems that shape the wider contexts of practices. The GARCH
model is then presented and the variables are explained. After summarizing data statistics, the ways in
which Chinese banks’ stock returns are influenced by interest rate and foreign exchange rate changes
are further examined. The paper concludes with discussions on policy implications.
2. Literature review
Empirical studies on the risk factors of bank stocks have expanded dramatically since the
establishment of the theoretical foundation based on the capital asset pricing model (CAPM) and the
arbitrage pricing theory (APT), which evolved from the modern portfolio theory. Risk is measured by
the conditional variance of returns or conditional covariance of returns with markets (Sharpe (1964),
Lintner (1965), Mossin (1966), Elyasiani and Mansur (1998), Lo and Chan (2000)). Under the
assumption of invariant variance in error terms, much of the literature examines market, interest rate
and foreign exchange rate factors using the single- or two-index or multi-factor linear regression.
Despite a large body of literature in this area, researchers are yet to agree on the magnitude and
direction of interest sensitivity. Stone (1974) was the first to propose the two-index model (market
and interest rate) and introduce the interest rate as an extra-market factor in the theoretical model of
capital pricing. Early studies employ Stone’s model to examine empirically the sensitivity of financial
intermediaries’ stock returns towards interest rate changes using US data. Lloyd and Shick (1977) and
Chance and Lane (1980) find that interest rate changes have little explanatory power on the stock
pricing process. The results, however, have been challenged by several studies (Lynge and Zumwalt
(1980), Flannery and James (1984), Booth and Officer (1985), Scott and Peterson (1986), Bae (1990)).

6
These studies show a significant relationship between stock returns and changes in interest rates,
despite both negative and positive interest rate sensitivity being reported. Bae (1990) argues that the
conflicting results may come from various interest rate indices and measures of their changes. For
example, current interest rate changes are used by Chance and Lane (1980) and Lynge and Zumwalt
(1980), unanticipated interest rate changes are adopted by Flannery and James (1984), and both
current and unanticipated changes are considered by Booth and Officer (1985). Akella and Chen
(1990) attribute the differences in magnitude and direction of such sensitivity to the various
procedures of orthogonalizing interest rates and market returns, sample period selection, and
structural shifts of monetary policy.
Yourougou (1990) contrasts the interest rate sensitivity between banks and non-banking firms during
a relatively stable interest rate period (pre-October 1979) and a highly fluctuating period (post-
October 1979). Interest rate sensitivity has been shown empirically to vary dramatically over time.
While after 1979 the interest rate has explanatory power in bank stock returns, before 1979 the
influence of interest rate movement has not been proved for either financial intermediaries or
industrial firms. Over the period 1979–1990, Neuberger (1991) discovers that systematic risk,
measured by the coefficient of market effect, is increasing, while the magnitude of interest rate
sensitivity is declining and no evidence of interest rate impact is shown in the late 1980s. The
increased systematic risks have been confirmed by a study on Canadian banks, which also reports
significant interest rate sensitivity (Adjaoud and Rahman (1996)). In addition, large banks seem to be
riskier than small ones. In an international study, Madura and Zarruk (1995) demonstrate a disparity
of interest rate sensitivity among five countries. In the study of European Union, Stevenson (2002)
shows that bank stocks tend to be influenced by cross-border information of interest rate changes.
With the globalization of financial markets and the fast growth of the international banking business,
foreign exchange risk becomes the other market risk. Early studies suggest that risks related to foreign
exchange exposure may arise from divergent investors’ consumption patterns (Solnik (1974)),
imperfect hedging of asset positions (Grammatikos, Saunders and Swary (1986)), and a close
association with market conditions (Choi (1986), Flood Jr and Lessard (1986)). The findings imply a

7
potential impact of foreign exchange exposure on bank stock returns. Adler and Dumas (1983)
propose that foreign exchange sensitivity could be measured by firms’ stock returns. Choi, Elyasiani
and Kopecky (1992) extend the two-index model into a multi-factor model to examine the impact of
market, interest and foreign exchange rates on bank stock returns. Market and interest rate sensitivity
are found regardless of the use of actual or unexpected values, and foreign exchange innovation is
found to significantly influence bank stock returns, especially for large banks.
The studies of Kane and Unal (1988), Saunders and Yourougou (1990), Kwan (1991), Song (1994),
Adjaoud and Rahman (1996), Flannery, Hameed and Harjes (1997), Girard and Sinha (2006) provide
evidence of the violation of two assumptions: time-independent stock returns and time-invariant
conditional variance of the returns, bringing methods of dealing with time-dependent stock returns
and time-varying risk premium to the forefront. Song (1994) employs an ARCH-type model to
capture the time-varying stock volatility in the banking sector. The results suggest that market and
interest rate risks vary significantly from 1976 to 1987 in the US. Both risks increase around 1983
when borrowed reserves are targeted by the federal fund rate. Likewise, Elyasiani and Mansur (1998)
use a GARCH-M model to explore the impact of long-term interest rate changes on the stock pricing
process. Their findings show a positive impact on the first moment, but the volatility of interest rates
negatively influences the second moment of the stock return distribution. Tai (2000) explores the
sensitivity of market, interest and foreign exchange rate exposure of banks using three econometric
models. A nonlinear seemingly unrelated regression model identifies interest rate risk as the only
price factor, a ‘pricing kernel’ approach confirms the evidence of foreign exchange rate risk, and a
multivariate GARCH-M model provides evidence of a time-varying market and two further extra-
market risk premiums.
Similarly, Ryan and Worthington (2010), using a sample of Australian banks, find that market risk,
short- and medium-term interest rate risk and interest rate volatility are important explanatory factors
in bank stock returns. Long-term interest rates and foreign exchange rates seem to be insignificant
factors in Australian bank stock pricing processes. Elyasiani and Mansur (2004) use a more general
multivariate GARCH approach to investigate the impact of short- and long-term interest rate changes

8
and their volatility on the first and second moment of US banking stock return distribution. The
results suggest that short- and long-term interest rates and their volatility have a significant influence
on the return generation process.
Despite the voluminous literature on the risk sensitivity of banks in developed countries, few studies
have been conducted in emerging markets. The impact of interest and foreign exchange rate
movements on banks’ stock in Malaysia has been investigated by using a GARCH-M model over the
time period of the Asian financial crisis (Hooy, Tan and Nassir (2004)). They argue that the crisis is
insignificant in influencing the risk exposure of banks. The sensitivity of financial risk factors
increases after a series of regulatory policies, such as capital control, a fixed exchange rate regime and
a forced banking consolidation program. Kasman, Vardar and Tunc (2011) find that interest and
foreign rate movement are negatively related to bank stock returns in Turkey.
The banking industry of the countries mentioned in the above studies is more market oriented than the
banking industry in China. Both the United States and Australia have mature financial markets and
long history of a market-oriented banking industry. Turkey’s and Malaysia’s markets are also more
integrated with the international market. However, China is still in the process of a transition that is
witnessing the most rapid transformation of a country’s banking sector in history. In the context of
ongoing reforms, the fast development and the great changes in China’s banking sector make previous
studies on the US and other emerging markets ineffective to explain the risk sensitivity of Chinese
banks. Risks borne by Chinese banks hold more uncertainty in such a dramatic transition. Wong,
Wong and Leung (2009) use the equity price data of 14 listed Chinese banks for the period 21 July
2005 to February 2008 to investigate the foreign exchange exposure of Chinese banks and find a
positive relationship between bank size and foreign exchange exposure. Apart from that study, we
have not identified any paper discussing market returns, exchange rates or interest rates. Wong, Wong
and Leung (2009) focus on exchange rate risks. As listed banks are individually examined, it is
difficult to tell from the results whether the different sensitivity of individual banks is caused by the
idiosyncratic characteristics of individual banks or by the factor examined. Although they take interest

9
rate risk into consideration, the determination of the risk-free rate and the calculation of the excess
return of the interest rate may be arbitrary since the interest rate is not totally market determined.
As the largest emerging economy with a bank-dominated financial system, China has gradually
liberalized interest rates and introduced money and capital markets, which are playing an increasingly
important role in the financial system. While the reform is still ongoing, it is worth investigating the
impact of deregulation on banks’ risk sensitivity and comparing the more recent situation with what
has been identified in previous studies.
3. Model specifications
The GARCH ( p , q ) is considered in capturing the time-varying sensitivities of the banking stocks’
returns to the market, interest and foreign exchange rate rates. The model is described by three
equations:
, , , , e, ,1 1 1 1
n n n n
j t i j t i i M t i i r t i i t i j ti i i i
R c b R m R r R e R
, 5n (1)
2, 0 1 , 1 , 1 1 2 3j t j t j t t t th h d ANN d RD d VD (2)
, 1 1 (0, )j t t tN h (3)
The variables in mean equation (1) are as follows:
,j tR is the return on bank portfolio j at time t , and ,M t iR , ,r t iR and e,t iR are the returns on the
stock market, interest rate and foreign exchange rate at time t i , respectively. th is the conditional
variance of the error term, denoting the stock return volatility or risk. , 1i t is the error term with a
normal distribution of zero mean and variance th , shown by equation (3), and is the information
set. The conditional variance th is denoted by equation (2), determined by the past squared error term
21t , or the ARCH effect, and past behavior of variance 1th , or the GARCH process. 0 captures the
time-invariant risk factor, and 1 and are parameters of the ARCH and GARCH effects. The non-

10
negativity of parameters 0 , 1 and ensure the robustness of the model. The sum of 1 and
should be less than unity ( 1 1 ).
ANN is an announcement dummy that takes 1 for the trading days when the central bank announces
the adjustment of benchmark interest rates and 0 otherwise. RD is also an announcement dummy that
takes 1 when the central bank announces the adjustment of the ratio of bank reserve requirement. VD
is a dummy variable equaling to 1 on the dates when the adjusting reserve-requirement ratio comes
into effect.
With respect to exogenous variables ,M t iR , ,r t iR and e,t iR , contemporaneous percentage changes of
risk factors are excluded in the mean equation. According to previous studies of Elyasiani and Mansur
(1998), Ryan and Worthington (2010), this exclusion avoids the correlation between the error term
and explanatory variables, probably resulting from the shocks that contemporaneously influence the
financial markets and independent variables. In addition, investors may not instantly react to news and
may take time to reassess and restructure their portfolio (Chiang, Chen and So (2007)). By assessing
the lagged effect of the market and extra-market risk factors on bank portfolio returns, the speed with
which stock returns of bank portfolios incorporate the news contents can also be examined. Five-day
lags have been chosen, i.e. whether the lagged impacts of market, interest and foreign exchange rates
fade within five days was tested. The lagged effect of risk factors is captured by parameters im , ir , ie ,
where 5i .
4. Data description
4.1 Bank stock return specifications
In this study, the daily close of stock prices of 14 listed Chinese banks in the Shanghai and Shenzhen
stock exchanges are used. Daily percentage change is used as the return for the stock, interest rate and
foreign exchange rate markets. Based on Bankscope’s data, the total assets of the 14 banks accounted
for about 56.6 per cent of total Chinese banking assets at the end of 2008, with SOCB, JSCB and
CCB’s asset’s share of 43 per cent, 13 per cent and 0.6 per cent respectively, thus they provide

11
representative information on the market. Following previous studies of Song (1994), Elyasiani and
Mansur (1998), Ryan and Worthington (2010), the 14 banks are aggregated by size into three
portfolios—the Big State-owned Banks (SOCB) (four banks), the Joint-Stock Commercial Banks
(JSCB) (seven banks) and the City Commercial Banks (CCB) (three banks). The returns of each
portfolio are calculated based on equal weight. Value-weighted portfolios are also constructed, and
the empirical results are consistent. For space restriction, they are not reported, but are available upon
request.
According to Elyasiani and Mansur (1998), banking portfolio returns are preferred over individual
stock returns because the information on portfolios not only draws a picture of banking behavior but
smooths out the noise arising from any idiosyncratic shocks to a single bank. However, characteristics
of each bank could not be traced in this approach. The equity price data are obtained from the
Datastream database. All other data in this study, including the market index, interest rates and
foreign exchange rates, are from the Wind database.
Continuously compounded returns for all series are chosen since these have two major advantages
over discrete returns. First, the natural logarithm series results in lower value and reduces the
influence from outliers and error data. Second, compared with simple returns, continuously
compounded returns are more likely to follow a normal distribution. Statistical properties of log
returns are more tractable (Tsay (2005)).
4.2 Market index specification
One of the unique features of the Chinese stock market is the two types of shares, A and B shares. A
shares are denominated in Chinese currency, and B shares are denominated in US dollars on the
Shanghai Exchange and in Hong Kong dollars on the Shenzhen Exchange (Martin, Cai and Sun
(1997)). Of the 14 banks, eight are listed in domestic stock exchanges only and six are dual-listed in
both the Shanghai and Hong Kong stock markets. In this research, only A-share stock prices are
considered. Among the banks, 12 are listed on the Shanghai Exchange and the remaining two are on
12
the Shenzhen Exchange. Therefore, the market index is proxied by the A-share index, which
aggregates the information of A-share listing firms on both markets.
4.3 Interest rate and foreign exchange rate specification
Although key interest rates remain regulated, interbank interest rates and bond yields are market-
driven (Porter and Xu (2009)). The impact of market-determined interest rates on asset pricing for
Chinese listed banks is examined. Yield data on 3-month and 5-year government bonds are employed
to proxy the short- and long-term interest rates. The impact of the interbank interest rate, proxied by
the 7-day interbank interest rate, is also investigated to understand the cost of interbank borrowing for
the banking industry. US dollar against Chinese currency (USD/RMB) spot rates denote the foreign
exchange rate.
4.4 Sample period
The sample period is from September 2007 to September 2010. The justification of this time span is
as follows. First, most studies investigating risk impact consider a period with volatile changes of
factors which may arise from deregulation of financial markets and changes in macroeconomic
conditions (Ryan and Worthington (2010)). The period between 2005 and 2010 covers the whole
interest rate cycle. From 2005 to 2008 China experienced an uptrend of interest rates, followed by a
decline from September 2008. In addition, China abandoned a fixed foreign exchange regime—US
dollar peg—and adopted a managed floating exchange rate policy in July 2005. Second, only three of
the big four banks in China were listed on the domestic stock exchange before September 2007. A
sample period from September 2007 allows the inclusion of most of the largest banks. There are 734
observations, which is well above the required minimum of 300 observations for a reliable estimation
of results from ARCH regression models (McClain, Humphreys and Boscan (1996), Ryan and
Worthington (2010)). Table 2 lists the specification and notation of dependent and independent
variables.
Insert Table 2 here
4.5 Descriptive statistics

13
Table 3 presents the descriptive statistics of the stock returns of the three bank portfolios. The returns
of all portfolios are consistently negative and highly volatile during the sample period, reflecting the
impact of turbulence in the global and domestic financial markets. The signs of skewness for joint-
stock and city commercial banks are negative, suggesting that distributions have long left tails, while
the series of state-owned banks with a positive skew has a long right tail. Kurtosis of all three series is
larger than 3, indicating leptokurtic distribution. The hypothesis of normal distribution of the sample
is also rejected from the Jarque–Bera test statistics. Augmented Dickey–Fuller (ADF) test t-statistics
show that the three series are stationary. The value of the Ljung–Box test cannot reject the null
hypothesis of the white noise process for the 1st through the 36th order autocorrelation, indicating there
is no autocorrelation in all the series. The normality assumption of linear and constant conditional
variance has been violated, thus it is appropriate to use ARCH-type models.
Insert Table 3 here
Table 4 summarizes the descriptive statistics for daily returns (daily percentage changes) of the stock
market, the interest rates and the foreign exchange rate markets: A-share index, 3-month Chinese
government bond yield (GB3m), 5-year government bond yield (GB5y), 7-day interbank interest rate
(IBR7d), and the foreign exchange rate against US dollars (EX). Statistics are presented in the three
sub-periods from 2007 to 2010. Means of daily changes of the long-term interest rate and exchange
rate are negative in the whole sample period. Daily mean returns for the five series are negative
between 2007 and 2010. As shown by standard deviation, daily changes in the stock market, 3-month
and 5-year government bonds fluctuate more intensively between 2008 to 2009, while the more
volatile period occurred in the interbank interest rate and foreign exchange rate in the first sub-period,
2007–2008. Negative skewness for five variables (except for GB5y in 2008–2009) indicates long left
tails and asymmetric distributions. Except for the exchange rate in the first sub-period, kurtosis of all
the risk factors exceeds 3, suggesting the distribution is leptokurtic and sharper than the normal
distribution. The reported Jarque–Bera statistics show that the null hypothesis of normal distribution
has been rejected at the 1 per cent significance level. Augmented Dickey–Fuller (ADF) test t-statistics
are also reported. The null hypothesis of unit root existence has been rejected at the 1 per cent

14
significance level, which suggests that all the daily changes of the five explanatory variables are
stationary.
Insert Table 4 here
5. Empirical results
Tables 5 to 7 report the regression results for the three portfolios respectively, which include the
estimated coefficients of maximum likelihood for the mean and the conditional variance models.
Several hypotheses of the autoregressive process, risk exposure and return volatility are developed
and tested by the Wald test. The statistics are presented in tables 7 to 9. For each portfolio, all possible
regressions that contain all the lagged combinations of explanatory variables are first estimated. The
optimal model is selected after excluding some lagged variables with insignificant explanatory power.
The selection is based on the Akaike information criterion (AIC) and maximum likelihood statistics.
Therefore, the optimal model specification varies a great deal across the three banking portfolios and
interest rate specifications. Lagged variables with blank coefficient estimates are not included in the
optimal models. In addition, the autoregressive process of stock returns of the city commercial bank
portfolio has not been identified in the estimation, and thus coefficient estimates are not presented in
table 7.
Insert Tables 5 to 7 here
First, the model diagnostics are reported to examine the general adequacy of the GARCH model. The
validity of the model depends on its capability to capture all ARCH effects in the dataset and the
consistency with the assumption that the standardized residuals are independently and identically
distributed; in other words, the series of standardized residuals is a white-noise process without any
autocorrelation and follows a normal distribution. The reported LB (10) is the Ljung–Box (Q) statistic
to test randomness for the 1st through 10th order autocorrelation. The insignificant Ljung–Box (Q)
statistic for either the standardized or the squared standardized residuals suggest the absence of
autocorrelation. The Lagrange multiplier is also insignificant, which is not reported in the tables. The
robustness of conclusions has not been influenced by the different interest rates used as proxies for the

15
interest rate variable. However, the assumption of normal distribution is violated. Non-normality was
found in most of the similar studies (Elyasiani and Mansur (1998), Elyasiani and Mansur (2004),
Ryan and Worthington (2010)). These argue that the violation of the normal distribution assumption
will not disrupt the robustness of the model and that non-normality is probably due to the failure of
the model to consider the ‘leptokurtic disturbances of market excess returns’ (Ryan and Worthington
(2010), p. 92). Therefore, the performance of the GARCH model seems to be reasonable based on
these statistics.
Insert Tables 8 to 10 here
The sensitivity of Chinese banks to interest and foreign exchange rate risk is the major concern. The
coefficient estimates and chi-square statistics present the explanatory power of independent variables
and related hypotheses tests. First, the significance level of coefficient im suggests that stock returns
for all three portfolios are highly sensitive to the movement of the stock market, regardless of the
interest rate specification. However, the market influence fades instantly. The lagged effect of more
than one trading day has not been identified. The results are confirmed by the hypothesis test, and the
null hypothesis of no market risk ( 1 0m ) is rejected at the 0.01 level.
Compared with the high sensitivity of market risk, the sensitivity of interest rate risk varies a great
deal among the three banking portfolios, on the basis of signs and significance of the coefficient ir .
No significant relationship has been identified between stock returns and the long-term interest rate
for all the portfolios. The results are verified by the hypothesis test that the null hypothesis of no
interest rate risk ( 0ir ) cannot be rejected. The finding is different from some previous studies (Unal
and Kane (1986), Akella and Chen (1990)), but is consistent with Booth and Officer ((1985)), Bae
((1990)) and Ryan and Worthington ((2010)). Weak sensitivity of the short-term interest rate is found
for the joint-stock banks and the city commercial banks, with a 4-day delay. For the state-owned
commercial bank portfolio, the coefficients on the interest rate are insignificant at all levels within the
5-day time frame. However, the hypothesis test does not confirm such findings. The null hypothesis

16
of no short-term interest rate sensitivity cannot be rejected at any significance levels. A negative
relationship between interbank interest rate movement and bank stock returns has been identified for
all the portfolios, with a 5-day delay. However, the null hypothesis of no interbank interest rate
sensitivity cannot be rejected.
The insignificant impact of interest rate risk on stock returns contrasts to many other studies
identifying a significant link between them. Insensitivity to interest rate risk may attribute to two
contrary possibilities—lack of risk exposure, or sophisticated risk management. We argue the first
scenario is likely to be the case. First, risk management is not a strength of Chinese banks. The
concept for risk management is relatively new and banks are gradually incorporating up-to-date
technology and know-how. The under-developed financial markets and the limited financial products
constrain banks from implementing precise hedging strategies to evade risk exposure. As well, the
implicit government guarantee weakens banks’ risk control impetus. Second, tightly regulated lending
and deposit rates prevent banks from extensive risk exposure. Interest rate risk mainly arises from
maturities mismatch between the borrowing and the lending business. Since China’s lending and
deposit rates are regulated, the central bank usually adjusts both rates simultaneously, and the official
rates cover lending and deposits of different maturities. On the one hand, a commercial bank’s ability
to attract more deposits via higher rates is restricted; on the other hand, a bank’s profit margin is
hardly affected by rate changes. As shown in Table 11, the difference between the official lending and
deposit rates declined slightly between 2007 and 2008, but the change is marginal. With further
relaxation on lending rates, the difference between the official rates only represents a lower boundary
of banks’ profit margins. In other words, the change of official rates has little impact on banks’
profitability. Third, the interbank lending rate is the rate that is subject to the interaction of market
forces. However, it only accounts for a minor proportion of funding sources for the banks. The size of
interbank borrowing is only 1 to 2 per cent of total deposit, which is unlikely to have much impact on
a bank’s profitability. In addition, the movement of the interest rate of interbank lending has been
consistent with that of the official rates. Consequently, valuing assets by using market interest rates
largely reflects the position of the regulated rates, which stays at a stable level. The lack of

17
commercialized business patterns and tightly controlled interest rates constrain banks’ sensitivity to
interest rate movement. Insignificant risk sensitivity does not necessarily imply nonexistence of risk
or competence of risk arbitrage. Chinese banks’ ability to manage higher risk arising from interest rate
liberalization is a major concern for future reform.
Insert Table 11 here
Another extra-market factor, the foreign exchange rate risk, has been identified as having a positive
impact on the banking stock returns for all the portfolios. For the portfolios of the state-owned banks
and the city commercial banks, a significant relationship has been identified with foreign exchange
rate return with a 1-day lag; for the joint-stock commercial bank portfolios, the impact of the foreign
exchange rate risk lasts five days. The null hypothesis of no foreign exchange rate effect ( 0ie ) is
rejected at the 0.01per cent level for all portfolios. The significant relationship between foreign
exchange rate movement and banks’ stock returns may result from the increasing participation in
international financial business during a period of globalization of financial markets. Among the 14
banks, only the SOCBs and one of the listed CCBs are accredited to invest in the international market.
As shown in Figure 2, the SOCBs have the largest scale of foreign assets. A downward trend occurred
after 2007, but their foreign businesses regained momentum after July 2009. The volume of foreign
assets of the JSCBs is stable from 2005 to 2009. The CCBs’ foreign business is the smallest but the
most volatile. The positive impact suggests that the appreciation of Chinese currency tends to reduce
equity values and therefore is more likely to hamper banks’ performance. This is plausible given that
China’s economy is export-oriented, and currency appreciation will affect export or the profits of a
bank’s clients. Similar findings were reported in Wong, Wong and Leung (2009). However, findings
of this study tend to suggest a consistent reaction across all bank portfolios, while Wong, Wong and
Leung (2009) suggest the impact on individual banks could be either negative or positive.
Insert Figure 2 here
In addition, the impact of a 1-day lag in foreign exchange rate movement is less significant on the
joint-stock banking portfolio compared with the other two portfolios, but lasts longer. By looking at

18
the coefficient, city commercial banks seem the most sensitive to foreign exchange movement,
followed by state-owned banks. This is also different from Wong, Wong and Leung (2009), who
suggested a positive relationship between bank size and foreign exchange exposure.
The time-invariant components ( 0 ) in the second moment of bank returns’ distribution are
significant for state-owned and city commercial banking portfolios and insignificant for the joint-
stock commercial banking portfolios. The insignificant time-invariant component and the estimates in
the variance equation suggest a significant time-varying component in the stock pricing process in the
joint-stock commercial banks. The ARCH ( 1 ) and GARCH ( ) effects are highly significant and
non-negative, irrespective of interest rate and portfolio specifications. The Wald test statistics reject
the null hypothesis of time-independent stock return volatility ( 1 0 ), regardless of any of the
portfolio and interest rate indicators under consideration. Therefore, the time-dependent model of
bank returns is appropriate. The magnitude of the ARCH effect ( 1 ) is smaller than that of the
GARCH effect ( ) for all cases. The previous shocks explain a much greater proportion of the
portfolio returns’ volatility than the last period’s shock. The finding suggests that bank stocks have a
longer memory and their volatility is more sensitive to their own previous volatility than to new
shocks.
The total value of the shock persistence estimates ( 1 ) for state-owned commercial banks, joint-
stock commercial banks and city commercial banks is 0.9852, 0.9858 and 0.9449, respectively, under
the long-term interest rate estimation. Taking the city commercial banking portfolio as an example,
the shock persistence measure ( 1 ) is 0.9449, suggesting that the remaining proportion of the
initial shock impact after one week (five trading days) is (0.9449)5 or 75 per cent. For the other two
portfolios, the initial shock persistence is even higher. It seems that city commercial banks are
relatively better at absorbing shocks than are their larger counterparts. However, the greater shock
persistence may imply a larger sensitivity to market and extra-market risk exposure (Dickens and
Philippatos (1994)). Given the present state of China’s banking industry, larger banks are more likely

19
to expand their business range in nontraditional banking activities, both domestically and
internationally. However, the impact from market, interest and foreign exchange rate movements
tends to last longer for larger banks.
The impact of monetary policy varies across the three banking groups. The Pacific Basin markets of
Hong Kong, Singapore, South Korea and Taiwan are found to be less efficient in responding to
macroeconomic policies than the markets of industrialized countries (Lee (1997)). Harun, Hassan and
Zaher (2005) discovered that the different effects of monetary policy are associated with bank size,
leverage and profitability. In the context of China’s banking system, the announcement of benchmark
interest rate adjustment merely tends to increase the volatility of the city commercial banks’ stock.
Their stock volatility, on the contrary, seems to be insensitive to the announcement of reserve
requirement adjustment. However, the announcement of reserve requirement adjustment appears to
increase the volatility of stock returns for their larger counterparts, the state-owned banks and joint-
stock banks. Another interesting finding is that the stock returns of state-owned and city commercial
banks tend to be less volatile when the adjustments to the reserve requirement ratio come into effect.
6. Conclusions
Using the equity data of 14 listed Chinese banks and a time-varying risk model, this paper investigates
the impact of the joint interaction of interest and foreign exchange rates’ risk on bank stock returns.
This study depicts the equity return generating process and the impact of potential risk factors on this
process. Findings from this study will not only assist bank managers to frame risk management
strategies and market participants to design investing and hedging strategies, but will also provide
useful information for regulators in formulating policies.
This study reveals several interesting findings. First, Chinese banks are subject to both market and
extra-market risks. It is evident that banks are subject to market risks irrespective of which portfolio
they belong to. The impact of the foreign exchange rate risk has also been found in both state-owned
and city commercial bank portfolios. The influence of interest rates is not significant, especially for

20
long-term interest rates, but some connection between the interbank interest rate and bank stock
returns has been detected for all portfolios.
Second, market risk is the major risk faced by the banks. The returns of banking stocks of all three
portfolios are closely related to stock market performance. However, the empirical results cannot
support the link between interest rate movement and banks’ share returns. Similarly, the central
bank’s announcements on interest rate changes have little impact on the volatility of bank shares.
Foreign exchange rate sensitivity varies across different portfolios. The different sensitivity to foreign
exchange fluctuations is interesting. State-owned banks’ sensitivity can be explained by their
exposure to international markets due to overseas investments and a large number of clients who are
involved in international business. Such rationale does not apply to the other two portfolios. The
difference in foreign exchange sensitivity may be attributed to the various exposures of the
international market and the different capacity to deal with such risk. Further research is necessary to
investigate the factors behind this.
Third, bank stock returns display different sensitivity to interest rates and exchange rates despite the
fact that both rates are controlled by the government. The insensitivity to interest rate changes and
varied sensitivity to exchange rate changes suggest that government control is not the only
explanation. The way the control is implemented and the structure of the bank can also lead to
different sensitivity. Given the insensitivity of bank stock returns on interest rate changes, regulators
may need to further liberalize interest rates if they wish to use interest rates as a powerful tool to
implement monetary policy. Removing the ceiling on deposit rates and the floor on lending rates can
be the first step of liberalization.
Last, distinctive features of the three portfolios in terms of risk sensitivity have been observed.
Different portfolios react differently to monetary policy as well as to foreign exchange movement.
While none of the three portfolios is sensitive to interest rate announcements, SOCBs and JSCBs are
sensitive to policies on reserve requirements. Interestingly, CCBs are insensitive to reserve
requirement changes. Nevertheless, the findings suggest that the central bank’s monetary policy

21
depends heavily on reserve adjustment. Open market operations (OMOs) are employed as a monetary
policy supplement. Considering the increasing importance of OMOs and financial deregulation,
different scenarios of interest rate movement should still be closely monitored. As discussed above,
different sensitivities to foreign exchange rate movements have also been found among the three
portfolios.
Findings in the paper also provide some insights for policy makers. The different impacts of interest
rate and foreign exchange rate movements on banking stock returns raise some issues for regulators
and policy makers, given that both are heavily controlled by the government. On the one hand, the
findings suggest that further reform, especially liberalization of interest rates, is necessary. Allowing
banks more autonomy in setting their own interest rates will provide them with more experience in
managing risks related to interest rate fluctuations and will ensure that interest rates are an effective
tool for monetary policy. On the other hand, regulators need to pay more attention to the foreign
exchange risk on banks, identifying their exposure as well as their capacity for risk management.
Apart from the different impact of the two rates, policy makers need to recognize the different
reactions of the banking portfolios to the same policy tool and to design targeted tools to effectively
achieve policy objectives.

22
References
Adjaoud, F., Rahman, A. 1996. A note on the temporal variability of Canadian financial services stock
returns. Journal of Banking & Finance 20(1): 165‐177.
Adler, M., Dumas, B. 1983. International portfolio choice and corporation finance: A synthesis.
Journal of Finance 38(3): 925‐984.
Akella, S. R., Chen, S. J. 1990. Interest rate sensitivity of bank stock returns: specification effects and
structural changes. Journal of Financial Research 13(2): 147.
Bae, S. C. 1990. Interest rate changes and common stock returns of financial institutions: Revisited.
Journal of Financial Research 13(1): 71‐79.
Barth, J. R.; Caprio, G.; Levine, R. 2004. Bank regulation and supervision: what works best? Journal of
Financial intermediation 13(2): 205‐248.
Bartram, S. M. 2005. The Impact of Commodity Price Risk on Firm Value ‐ An Empirical Analysis of
Corporate Commodity Price Exposures. Multinational Finance Journal 9(3/4): 161‐187.
Booth, J. R., Officer, D. T. 1985. Expectations, interest rates, and commercial bank stocks. Journal of
Financial Research 8(1): 51–58.
Brooks, R. D.; Faff, R. W.; Ho, Y. K. 1997. A new test of the relationship between regulatory change in
financial markets and the stability of beta risk of depository institutions. Journal of Banking &
Finance 21(2): 197‐219.
Chamberlain, S.; Howe, J. S.; Popper, H. 1997. The exchange rate exposure of US and Japanese
banking institutions. Journal of Banking & Finance 21(6): 871‐892.
Chance, D. M., Lane, W. R. 1980. A re‐examination of interest rate sensitivity in the common stocks
of financial institutions. Journal of Financial Research 3(1): 49–56.
Chiang, T. C.; Chen, C. W. S.; So, M. K. P. 2007. Asymmetric Return and Volatility Responses to
Composite News from Stock Markets. Multinational Finance Journal 11(3/4): 179‐210.

23
Choi, J. J. 1986. A model of firm valuation with exchange exposure. Journal of International Business
Studies 17(2): 153‐160.
Choi, J. J.; Elyasiani, E.; Kopecky, K. J. 1992. The sensitivity of bank stock returns to market, interest
and exchange rate risks. Journal of Banking & Finance 16(5): 983‐1004.
Demirgüç‐Kunt, A., Detragiache, E. 1998. The determinants of banking crises in developing and
developed countries. IMFStaff Papers 45(1): 81‐109.
Dickens, R. N., Philippatos, G. C. 1994. The impact of market contestability on the systematic risk of
US bank stocks. Applied Financial Economics 4(5): 315‐322.
Elyasiani, E., Mansur, I. 1998. Sensitivity of the bank stock returns distribution to changes in the level
and volatility of interest rate: A GARCH‐M model. Journal of Banking & Finance 22(5): 535‐563.
Elyasiani, E., Mansur, I. 2004. Bank stock return sensitivities to the long‐term and short‐term interest
rates: a multivariate GARCH spproach. Managerial Finance 30(9): 32‐55.
Flannery, M. J., James, C. M. 1984. The effect of interest rate changes on the common stock returns
of financial institutions. Journal of Finance 39(4): 1141‐1153.
Flannery, M. J.; Hameed, A. S.; Harjes, R. H. 1997. Asset pricing, time‐varying risk premia and interest
rate risk. Journal of Banking & Finance 21(3): 315‐335.
Flood Jr, E., Lessard, D. R. 1986. On the measurement of operating exposure to exchange rates: A
conceptual approach. Financial Management 15(1): 25‐36.
García‐Herrero, A.; Gavilá, S.; Santabárbara, D. 2006. China's banking reform: an assessment of its
evolution and possible impact. CESifo Economic Studies 52(2): 304‐363.
Geiger, M. 2008. Instruments of monetary policy in China and their effectiveness: 1994‐2006.
UNCTAD Discussion Paper no.187.
Girard, E., Sinha, A. 2006. Does Total Risk Matter? The Case of Emerging Markets. Multinational
Finance Journal 10(1/2): 117‐151.
Grammatikos, T.; Saunders, A.; Swary, I. 1986. Returns and risks of US bank foreign currency
activities. Journal of Finance 41(3): 671‐682.

24
Harun, S. M.; Hassan, M. K.; Zaher, T. S. 2005. Effect of Monetary Policy on Commercial Banks Across
Different Business Conditions. Multinational Finance Journal 9(1/2): 99‐128.
Hooy, C. W.; Tan, H. B.; Nassir, A. M. 2004. Risk sensitivity of bank stocks in Malaysia: Empirical
evidence across the Asian financial crisis. Asian Economic Journal 18(3): 261‐276.
Kane, E. J., Unal, H. 1988. Change in market assessments of deposit‐institution riskiness. Journal of
Financial Services Research 1(3): 207‐229.
Kasman, S.; Vardar, G.; Tunc, G. 2011. The impact of interest rate and exchange rate volatility on
banks' stock returns and volatility: Evidence from Turkey. Economic Modelling 28(3): 1328‐1334.
Kaufman, G. 2004. Macroeconomic Stability, Bank Soundness, and Designing Optimum Regulatory
Structures. Multinational Finance Journal 8(3/4): 141‐171.
Kwan, S. H. 1991. Re‐examination of interest rate sensitivity of commercial bank stock returns using
a random coefficient model. Journal of Financial Services Research 5(1): 61‐76.
Lee, U. 1997. Stock market and macroeconomic policies: New evidence from Pacific Basin countries.
Multinational Finance Journal 1(4): 273‐289.
Lintner, J. 1965. The valuation of risk assets and the selection of risky investments in stock portfolios
and capital budgets. The Review of Economics and Statistics 47(1): 13‐37.
Lloyd, W. P., Shick, R. A. 1977. A test of Stone's two‐index model of returns. Journal of Financial and
Quantitative Analysis 12(3): 363‐376.
Lo, W. C., Chan, W. S. 2000. Diagnosing shocks in stock market returns of Greater China.
Multinational Finance Journal 4(3/4): 269‐288.
Lynge, M. J., Zumwalt, J. K. 1980. An empirical study of the interest rate sensitivity of commercial
bank returns: A multi‐index approach. Journal of Financial and Quantitative Analysis 15(3): 731‐742.
Madura, J., Zarruk, E. R. 1995. Bank exposure to interest rate risk: A global perspective. Journal of
Financial Research 18(1): 1‐13.
Martin, L.; Cai, F.; Sun, Q. 1997. Weak‐form efficiency and causality tests in Chinese stock markets.
Multinational Finance Journal 1(4): 291‐307.
25
McClain, K. T.; Humphreys, H. B.; Boscan, A. 1996. Measuring risk in the mining sector with ARCH
models with important observations on sample size. Journal of Empirical Finance 3(4): 369‐391.
Mossin, J. 1966. Equilibrium in a capital asset market. Econometrica: Journal of the Econometric
Society 34(4): 768‐783.
Neuberger, J. 1991. Risk and return in banking: Evidence from bank stock returns. Economic Review
(Fall): 18‐30.
Porter, N. J., Xu, T. T. 2009, What drives China's interbank market? IMF working paper no.
WP/09/189.
Ryan, S. K., Worthington, A. C. 2010. Market, interest rate and foreign exchange rate risk in
Australian banking: A GARCH‐M approach. International Journal of Applied Business and Economic
Research 2(2): 81‐103.
Saunders, A., Yourougou, P. 1990. Are banks special? The separation of banking from commerce and
interest rate risk. Journal of Economics and Business 42(2): 171‐182.
Scott, W. L., Peterson, R. L. 1986. Interest rate risk and equity values of hedged and unhedged
financial intermediaries. Journal of Financial Research 9(4): 325–329.
Sharpe, W. F. 1964. Capital asset prices: A theory of market equilibrium under conditions of risk.
Journal of Finance 19(3): 425‐442.
Solnik, B. H. 1974. An equilibrium model of the international capital market. Journal of Economic
Theory 8(4): 500‐524.
Song, F. M. 1994. A two‐factor ARCH model for deposit‐institution stock returns. Journal of Money,
Credit & Banking 26(2): 323‐340.
Stevenson, S. 2002. The sensitivity of European bank stocks to German interest rates changes.
Multinational Finance Journal 6(3): 223‐249.
Stiroh, K. 2006. A portfolio view of banking with interest and noninterest activities. Journal of Money,
Credit and Banking 38(5): 1351‐1361.

26
Stone, B. K. 1974. Systematic interest‐rate risk in a two‐index model of returns. Journal of Financial
and Quantitative Analysis 9(5): 709‐721.
Tai, C. S. 2000. Time‐varying market, interest rate, and exchange rate risk premia in the US
commercial bank stock returns. Journal of Multinational Financial Management 10(3/4): 397‐420.
Tian, G. G. 2008. Equity Market Price Interactions Between China and the Other Markets Within the
Chinese States Equity Markets. Multinational Finance Journal 12(1/2): 105‐126.
Tsay, R. S. 2005, Analysis of Financial Time Series. 2nd edn, Hoboken, N.J.: Wiley‐Interscience
Unal, H., Kane, E. J. 1986, Two Approaches to Assessing the Interest‐Rate Sensitivity of Deposit‐
Institutions' Equity Returns. Ohio State University, Columbus: College of Business.
Viale, A.; Kolari, J.; Fraser, D. 2009. Common risk factors in bank stocks. Journal of Banking & Finance
33(3): 464‐472.
Wetmore, J. L., Brick, J. R. 1994. Commercial bank risk: Market, interest rate, and foreign exchange.
Journal of Financial Research 17(4): 585.
Wilson, J. O. S.; Casu, B.; Girardone, C.; Molyneux, P. 2010. Emerging themes in banking: Recent
literature and directions for future research. The British Accounting Review 42(3): 153‐169.
Wong, T. C.; Wong, J.; Leung, P. 2009. The foreign exchange exposure of Chinese banks. China
Economic Review 20(2): 174‐182.
Yourougou, P. 1990. Interest‐rate risk and the pricing of depository financial intermediary common
stock: Empirical evidence. Journal of Banking & Finance 14(4): 803‐820.

27
TABLE 1 Interest Rate Deregulation in China
Year Actions Late 1990s Interbank repo lending rates and bond market yields were liberalized June 1996 Upper limits on interbank lending rates were removed
June 1997 Repos and the outright cash settlement of secondary transactions were introduced and the interest rates were determined by the market
1998 The rates on financial bonds issued by policy banks were liberalized 1998–2004 The upper limit on lending rates was gradually increased
1999 The rates on Treasury bonds were allowed to be market determined Rates on more than RMB 30 million deposits with over 5-year maturity were allowed to be negotiated
2000–2004 Foreign currency lending and deposit rates were gradually liberalized
2004 Upper limit on all lending rates were removed, except for urban and rural credit cooperatives Floor on all deposit rates was removed
2005 Requirement on interbank deposits was removed The interest rates on corporate fixed income financing were gradually liberalized
2007 Corporate bond yields began to be liberalized 2008 Interest rates in medium-term corporate note were market determined Sources: The People’s Bank of China (2005); Porter and Xu (2009).

28
TABLE 2 Independent and Dependent Variables Variables Measure Notation Dependent variables Returns of Bank portfolios
State-owned commercial bank portfolio Joint-stock commercial bank portfolio City commercial bank portfolio
SOCB JSCB CCB
Explanatory variables Market index A-share index Interest rates 3-month government bond yield GB3m 5-year government bond yield GB5y 7-day interbank interest rate IBR7d Foreign exchange rate US dollar against RMB EX (USD/RMB)

29
TABLE 3 Descriptive statistics on daily bank portfolio returns
Bank portfolios
SOCB JSCB CCB
No. of observations 734 734 734 Mean –0.0010 –0.0014 –0.0009 Median –0.0012 –0.0008 0.0002 Maximum 0.0956 0.0955 0.0954 Minimum –0.1027 –0.1051 –0.1046 Std. Dev. 0.0226 0.0303 0.0283 Skewness 0.0200 –0.1134 –0.0454 Kurtosis 5.4404 4.2064 4.1411 Jarque–Bera 181.9348 *** 44.7048 *** 41.3385 *** ADF –26.6418 *** –27.3758 *** –29.4616 *** Q(12) 4.1977 10.0780 11.8400 Q(24) 23.2440 20.7560 26.3700 Q(36) 40.3220 37.4990 43.3740 Note: *, **, and *** denote significance at the 10, 5, and 1 per cent levels.

30
TABLE 4 Descriptive statistics of market, interest and foreign exchange rates returns 2007–2008 2008–2009 2009–2010 Market return Mean –0.0035 0.0004 –0.0001 Std. Dev 0.0026 0.0239 0.0149 Skewness –0.0130 –0.0425 –0.3611 Kurtosis 3.9905 4.1927 4.1512 Jarque–Bera 9.5307*** 14.5371*** 19.6997*** ADF –15.6941*** –14.8123*** –15.7956*** GB3m Mean 0.0005 –0.0038 0.0013 Std. Dev 0.0158 0.0320 0.0174 Skewness –0.3131 –1.3320 –1.0422 Kurtosis 26.3787 16.0949 10.0602 Jarque–Bera 5310.0500*** 1815.4980*** 578.0429*** ADF –13.2275*** –14.4120*** –7.7913*** GB5y Mean –0.0002 –0.0012 –0.0003 Std. Dev 0.0058 0.0198 0.0081 Skewness –0.0495 –0.1843 0.5583 Kurtosis 6.8681 8.5194 8.6796 Jarque–Bera 145.4002*** 311.0966*** 357.3784*** ADF –7.5538*** –11.2351*** –12.5545*** IBR7d Mean –0.0027 –0.0030 0.0021 Std. Dev 0.1995 0.0634 0.0725 Skewness –1.3075 –0.5805 –1.8004 Kurtosis 10.6465 7.6915 22.6032 Jarque–Bera 634.0217*** 237.4718*** 4237.333*** ADF –13.1987*** –21.50008*** –13.35573*** RMB/USD Mean –0.0004 –0.000002 –0.000007 Std. Dev 0.0012 0.0005 0.0006 Skewness –0.1258 –2.0909 –1.5313 Kurtosis 2.8947 25.0679 20.2747 Jarque–Bera 0.7224 5128.8750*** 3283.1240*** ADF –15.0471*** –6.8362*** –14.2676*** Note: *, **, and *** denote significance at the 10, 5, and 1 per cent levels.

31
TABLE 5 Impact of market, interest and foreign exchange rates on stock returns of the SOCB
portfolio
Interest rates GB5y Z GB3m Z IBR7d Z c –0.0003 –0.4395 –0.0002 –0.2745 –0.0003 –0.4707
1b –0.2365*** –3.0230 0.2424*** –3.0535 0.2337*** –2.9117
1m –0.2815*** –3.9878 –0.2852*** –4.0464 –0.2800*** –3.9359
1r –0.0883 –1.1045 –0.0078 –0.2112 –0.0014 –0.2128
2r –0.0188 –0.2458 –0.0386 –0.9662 –0.0121* –1.6792
3r –0.0136 –0.1842 –0.0362 –0.8434 –0.0116* –1.7556
4r -0.0451 -0.5748 -0.0545 -1.3827 -0.0002 -0.0375
5r -0.0246 -0.3136 –0.0127 –0.3313 –0.0115** –2.1709
1e -2.9178*** -3.0069 -2.9034*** -2.8317 -2.9589*** -3.1171
0 5.38 10–6*** 2.7094 5.95 10–6*** 3.1194 5.80 10–6*** 3.2739
1 -0.0534*** -4.8081 -0.0515*** -4.7495 -0.0572*** -4.8677
-0.9319*** 76.9566 -0.9328*** 74.7034 -0.9299*** 75.9509
1d -8.95 10–5 -1.1611 -0.0001 -1.3365 -5.53 10–5 -0.7517
2d -0.0003*** -2.5828 -0.0003*** -2.8606 -0.0003** -2.4466
3d –0.00013** –2.1661 –0.0001** –2.4483 –0.0001*** –2.7873
1
-0.9852 -0.9843 -0.9871
Model diagnostics for Standardized Residuals Mean –0.013759 –0.0107 –0.0145 Maximum -3.698037 -3.6416 -3.6043 Minimum –4.622596 –4.8232 –4.7554 Std. Dev. -1.002812 -1.0029 -1.0028 Skewness –0.109716 –0.1290 –0.1527 Kurtosis -4.420482 -4.6335 -4.4152 LB(10) for Zi,t -7.0244(0.723) -7.0191(0.724) -5.6895(0.841) LB(10) for Z2
i,t -5.3500(0.867) -4.2681(0.934) -5.4853(0.856)
Note: The GARCH(1,1) models are estimated as follows:
, , , , e, ,1 1 1 1
n n n n
j t i j t i i M t i i r t i i t i j ti i i i
R c b R m R r R e R
2, 0 1 , 1 , 1 1 2 3 4j t j t j t t t t th h d ANN d RD d VD d Mon
, 1 1 (0, )j t t tN h
where Rj,t is the return on the state-owned bank portfolio at time t, and Rj,t-I is the lagged return. Three exogenous variables RM, t-i, Rr, t-i and Re,t-i are the lagged returns of market, interest and foreign exchange rates. All possible regressions that
contain all the lagged combinations of explanatory variables are first estimated. The optimal lag structure for autoregressive process, market, interest rates and foreign exchange rates is determined
to be 1, 1, 5 and 1. Figures in parentheses are p-
values. *, **, and *** denote significance at the 10, 5, and 1 per cent levels.

32
TABLE 6 Impact of market, interest and foreign exchange rates on stock returns of the JSCB portfolio Interest rates GB5y Z GB3m Z IBR7d Z c -0.0002 -0.2080 -0.0002 -0.1899 -0.0002 -0.1417
1b -0.2209*** -3.4928 -0.2231*** -3.5209 -0.2250*** -3.5214
1m –0.3912*** –4.8996 –0.3887*** –4.9117 –0.3973*** –4.8689
1r -0.0653 -0.5886 –0.0391 –0.7515 –0.0002 –0.0247
2r –0.1037 –0.8894 -0.0533 -1.0891 –0.0131 –1.5595
3r -0.0051 -0.0497 –0.0478 –0.8236 –0.0041 –0.4713
4r -0.1256 -1.1224 -0.0898* -1.7154 -0.0083 -1.0576
5r -0.0305 -0.2796 –0.0123* –1.8085
1e -2.4196* -1.7286 -2.6394* -1.8961 -2.3150* -1.6610
2e -1.8541 -1.4344 -1.7196 -1.3216 -1.6145 -1.2630
3e
-2.9834** -2.3782 -3.0507** -2.3945 -3.1192** -2.4311
4e
–0.4057 –0.3247 –0.5109 –0.4119 –0.2229 –0.1775
5e
-2.5229* -1.9417 -2.3642* -1.8081 -2.5948** -1.9848
0 7.75 10–6 1.5864 9.06 10–6* 1.8398 6.68 10–6 1.5242
1 -0.0465*** -3.5703 -0.0457*** -3.4822 -0.0462*** -3.5029
-0.9393*** 67.1176 -0.9386*** 65.1288 -0.9416*** 69.6873
1d -6.20 10–5 -0.4474 -6.12 10–5 -0.4279 -5.16 10–5 -0.7069
2d -0.0006* -0.4474 -0.0006* -1.8672 -0.0006* -0.0775
3d –2.69 10–5 –0.2235 –4.35 10–5 –0.3634 –3.43 10–5 -0.7800
1
-0.9858 -0.9843 -0.9877
Model diagnostics for Standardized Residuals Mean –0.0129 –0.0137 –0.0115 Maximum -3.0883 -3.0422 -3.0562 Minimum –3.8452 –3.8900 –3.8573 Std. Dev. -1.0026 -1.0024 -1.0024 Skewness –0.1203 –0.1370 –0.1843 Kurtosis -3.7296 -3.7836 -3.7015 LB(10) for Zi,t -7.8371(0.65) -7.6285(0.66) -6.6163(0.76) LB(10) for Z2
i,t -8.2970(0.60) -6.9867(0.73) -8.7094(0.56)

33
TABLE 7 Impact of market, interest and foreign exchange rates on stock returns of the CCB portfolio
Interest rates GB5y Z GB3m Z IBR7d Z c –0.0004 –0.3282 –0.0004 –0.3455 –0.0002 –0.1834
1m –0.1214** –2.5163 –0.1186** –2.4690 –0.1254*** –2.6003
1r -0.0269 -0.2888 –0.0362 –0.7381 –0.0033 –0.4206
2r –0.0598 –0.5951 -0.0479 -0.9599 –0.0108 –1.2483
3r –0.0679 –0.7776 –0.0370 –0.8074 -0.0032 -0.3974
4r -0.1118 -1.1442 -0.0833* -1.8970 -0.0063 -0.8051
5r -0.0423 -0.4382 –0.0120* –1.6820
1e -3.4888*** -2.8568 -3.8042*** -3.0297 -3.5140*** -2.8549
0 -3.16 10–5*** -2.9931 -2.96 10–5*** -2.8328 -3.1510–5*** -2.9351
1 -0.0634*** -3.7500 -0.0596*** -3.7284 -0.0594*** -3.6331
-0.8815*** 30.71 -0.8917*** 32.7135 -0.8872*** 31.9181
1d -0.0004** -2.1066 -0.0002** -2.2235 -0.0004** -2.0540
2d -0.0003 -1.2069 -0.0002 -1.1290 -0.0004 -1.5518
3d –0.0003*** –3.2388 –0.0002*** –2.6947 –0.0003** –2.4098
1
-0.9449 -0.9513 -0.9465
Model diagnostics for Standardized Residuals Mean –0.0292 –0.0293 –0.0252 Maximum -3.4443 -3.5280 -3.1036 Minimum –4.5331 –4.4151 –4.5620 Std. Dev. -1.0003 -0.9998 -1.0004 Skewness –0.1380 –0.1489 –0.1695 Kurtosis -4.1680 -4.2181 -4.1155 LB(10) for Zi,t -5.4584(0.86) -6.1284(0.80) -4.0359(0.95) LB(10) for Z2
i,t -6.0433(0.81) -5.7879(0.83) -7.3704(0.69)

34
TABLE 8 The 2 statistics for various hypotheses tests: the SOCB portfolio
Hypotheses Interest rates
GB5y GB3m IBR7d
There is no auto regressive process: b1=0 9.13*** 9.32*** 8.47*** There is no market effect: m1=0 15.90*** 16.37*** 15.49*** There is no interest rate level effect: r1=r2=r3=r4=r5=0 1.87 3.30 7.14 There is no foreign exchange effect: e1=0 9.04*** 8.02*** 9.50*** Return volatility is time invariant: α1=β=0 24706.81*** 24097.25*** 26572.32***Return generating process follows an ARCH specification: β=0
7561.45*** 7174.65*** 7387.54***
Return generating process follows a GARCH specification: α1=0
23.11*** 22.55*** 23.69***
35
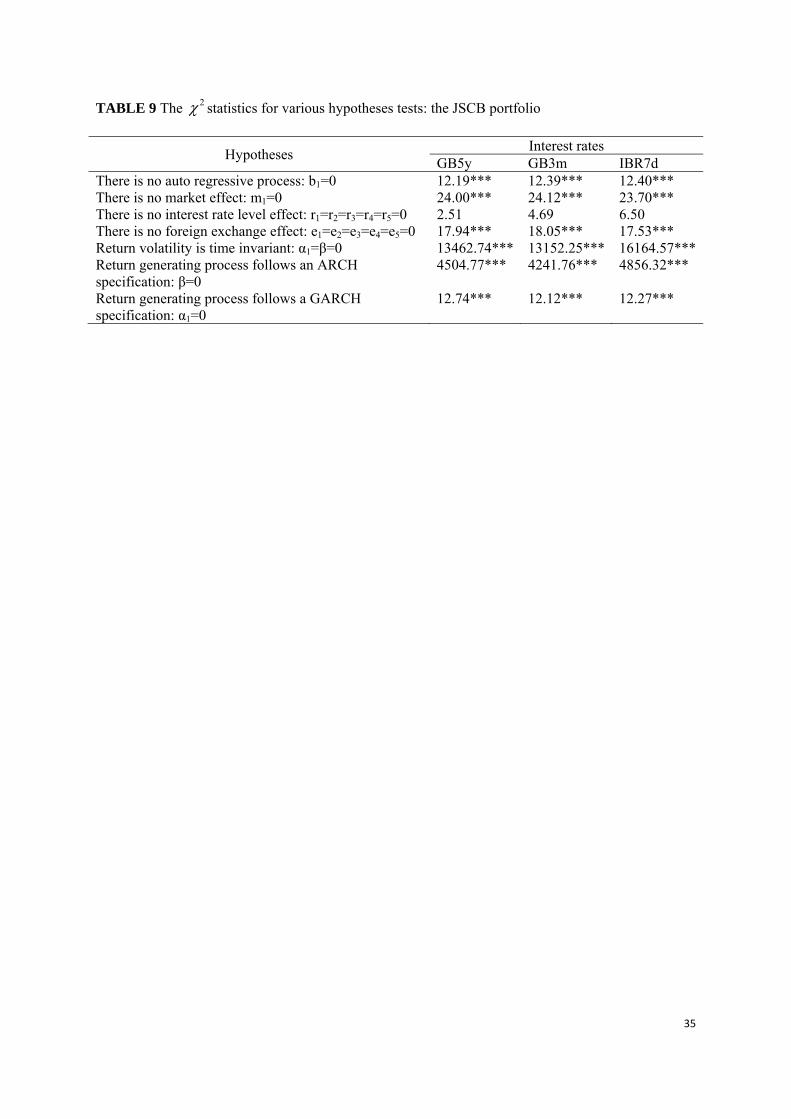
TABLE 9 The 2 statistics for various hypotheses tests: the JSCB portfolio
Hypotheses Interest rates
GB5y GB3m IBR7d There is no auto regressive process: b1=0 12.19*** 12.39*** 12.40*** There is no market effect: m1=0 24.00*** 24.12*** 23.70*** There is no interest rate level effect: r1=r2=r3=r4=r5=0 2.51 4.69 6.50 There is no foreign exchange effect: e1=e2=e3=e4=e5=0 17.94*** 18.05*** 17.53*** Return volatility is time invariant: α1=β=0 13462.74*** 13152.25*** 16164.57***Return generating process follows an ARCH specification: β=0
4504.77*** 4241.76*** 4856.32***
Return generating process follows a GARCH specification: α1=0
12.74*** 12.12*** 12.27***

36
TABLE 10 The 2 statistics for various hypotheses tests: the CCB portfolio
Hypotheses Interest rates
GB5y GB3m IBR7d There is no market effect: m1=0 6.33** 6.09** 6.76*** There is no interest rate level effect: r1=r2=r3=r4=r5=0 2.87 5.26 7.55 There is no foreign exchange effect: e1=0 8.16*** 9.17*** 8.15*** Return volatility is time invariant: α1=β=0 2570.87*** 3002.10*** 2713.81*** Return generating process follows an ARCH specification: β=0
943.44*** 1070.17*** 1018.76***
Return generating process follows a GARCH specification: α1=0
14.06*** 13.90*** 13.19***

37
TABLE 11 Difference between official lending and deposit rates between 2007 and 2008
Date 6m 1 yr 3 yr
18/03/2007 3.24 3.6 2.6119/05/2007 3.24 3.51 2.3421/07/2007 3.15 3.51 2.3422/08/2007 3.06 3.42 2.2515/09/2007 3.06 3.42 2.2521/12/2007 2.79 3.33 2.1616/09/2008 2.43 3.06 1.899/10/2008 2.61 3.06 1.89
30/10/2008 2.79 3.06 1.9827/11/2008 2.8 3.06 2.0723/12/2008 2.88 3.06 2.1
Source: http://data.bank.hexun.com/ll/dkll.aspx

38
Figure 1 Weekly exchange rate: RMB/US Dollar
Note: RMB is Chinese Currency Renminbi
Source: Bloomberg
6,5
6,7
6,9
7,1
7,3
7,5
7,7
7,9
8,1
8,3
8,5

39
Figure 2 Scale of foreign assets in three portfolios from 2005 to 2009 (billion RMB)
Source: dX Database, Emerging Markets Economic Data
0
2
4
6
8
10
12
14
16
0
200
400
600
800
1000
1200
1400
1600
1800
Μαρ‐05
Ιουλ‐05
Νοε‐05
Μαρ‐06
Ιουλ‐06
Νοε‐06
Μαρ‐07
Ιουλ‐07
Νοε‐07
Μαρ‐08
Ιουλ‐08
Νοε‐08
Μαρ‐09
Ιουλ‐09
Νοε‐09
socb (left axis)
jscb (left axis)
ccb (right axis)