INTERCO Indicators of territorial cohesion · 2019-07-08 · C.5.5. Files.....165 Annexes to the...
70
ESPON 2013 INTERCO Indicators of territorial cohesion Scientific Platform and Tools Project 2013/3/2 Final Report Part B| Report
Transcript of INTERCO Indicators of territorial cohesion · 2019-07-08 · C.5.5. Files.....165 Annexes to the...

ESPON 2013
INTERCO Indicators of territorial cohesion
Scientific Platform and Tools Project 2013/3/2
Final Report
Part B| Report

ESPON 2013
This report presents the final results of a
“Scientific Platform and Tools” Project
conducted within the framework of the ESPON
2013 Programme, partly financed by the
European Regional Development Fund.
The partnership behind the ESPON Programme
consists of the EU Commission and the Member
States of the EU27, plus Iceland, Liechtenstein,
Norway and Switzerland. Each partner is
represented in the ESPON Monitoring
Committee.
This report does not necessarily reflect the
opinion of the members of the Monitoring
Committee.
Information on the ESPON Programme and
projects can be found on www.espon.eu
The web site provides the possibility to
download and examine the most recent
documents produced by finalised and ongoing
ESPON projects.
This basic report exists only in an electronic
version.
© ESPON & University of Geneva, 2012.
Printing, reproduction or quotation is authorised
provided the source is acknowledged and a
copy is forwarded to the ESPON Coordination
Unit in Luxembourg.
.

ESPON 2013
List of authors University of Geneva (Lead Partner)
- Hy DAO
- Pauline PLAGNAT
- Vanessa ROUSSEAUX
National Technical University of Athens (Partner)
- Minas ANGELIDIS
- Spyridoula BATZIKOU
- Vivian BAZOULA
- Epameinontas TSIGKAS
Nordregio - Nordic Centre for Spatial Development (Partner)
- Lisa VAN WELL
- José STERLING
RRG Spatial Planning and Geoinformation (Expert)
- Carsten SCHÜRMANN
Spatial Foresight GmbH (Expert)
- Kai BÖHME
- Erik GLØERSEN
- Susan BROCKETT

ESPON 2013
Part B | Report (ne pas effacer ce texte (requis pour la table des matières) => à colorer en blanc tout
quand le rapport est terminé)

ESPON 2013 i
Table of contents
Part A | Executive summary1
Introduction ....................................... ...............................................................................1 Objectives.......................................................................................................................1 Territorial cohesion, the impossible definition .................................................................1 From a fuzzy concept to synthetic presentations of a few single indicators.....................1
The indicators..................................... ..............................................................................3 Cohesion indicators : an approach by territorial objectives .............................................3 Results by territorial objectives .......................................................................................3 Presentation of the indicators .........................................................................................8 Conclusions..................................................................................................................10
Part B | Report
B.1. Territorial cohesion, territorial indicators .. .............................................................4 B.1.1. Challenges of the project......................................................................................4 B.1.2. Territorial cohesion as a multidimensional and political concept ...........................5 B.1.3. Making the indicators territorial.............................................................................6
B.2. Key analysis .................................. ............................................................................8 B.2.1. Selecting the indicators ........................................................................................8 B.2.2. Reasoning scheme for the final set of indicators ................................................17 B.2.3. Analytical framework ..........................................................................................28 B.2.4. Key findings at the European level .....................................................................30 B.2.5. Other scales .......................................................................................................38 B.2.6. GIS database / GIS tools....................................................................................41
B.3. Links to other ESPON projects ................. .............................................................43
B.4. Further work and research ..................... ................................................................46 B.4.1. Wishlist...............................................................................................................46 B.4.2. Extended exploitation of the indicators ...............................................................56 B.4.3. Communication plan...........................................................................................57
Conclusions........................................ ............................................................................59
Part C | Scientific report
C.1. Territorial cohesion.......................... .........................................................................1
C.2. Indicator selection and calculation........... ...............................................................7 C.2.1. The selection of the “headline” and “core” indicators ............................................7 C.2.2. The selection of top indicators..............................................................................9 C.2.3. Calculation of the indicators ...............................................................................11
C.3. Indicators presentation ....................... ...................................................................19 C.3.1. Strong local economies ensuring global competitiveness...................................19 C.3.2. Innovative territories...........................................................................................40 C.3.3. Fair access to services, markets and jobs..........................................................53

ESPON 2013 ii
C.3.4. Inclusion and Quality of Life ...............................................................................71 C.3.5. Attractive regions of high ecological values and strong territorial capital ............97 C.3.6. Integrated polycentric territorial development ...................................................111 C.3.7. Further ideas for analyses................................................................................124
C.4. Other scales and territories.................. ................................................................135 C.4.1. Territorial Cohesion: Extension to Global Level ................................................135 C.4.2. Territorial Cohesion: Extension to Local Level..................................................141 C.4.3. Western Balkans and Turkey ...........................................................................150
C.5. GIS Data & Tools.............................. .....................................................................154 C.5.1. Structure of the INTERCO Geodatabase .........................................................154 C.5.2. Scripts and Tools .............................................................................................158 C.5.3. Mapping and cartography.................................................................................159 C.5.4. Indicator coding system....................................................................................162 C.5.5. Files .................................................................................................................165
Annexes to the Scientific report
Bibliography
Annex 1. The classification scheme
Annex 2. Inventory of indicators
Annex 3. Top indicators - data availability
Annex 4. INTERCO Indicators at Global Level
Annex 5. Case Study Sydsverige-Eastern Denmark
Annex 6. Case Study Piedmont
Annex 7. Case Study Thessalia
Annex 8. Western Balkans and Turkey
Annex 9. ESPON INTERCO GIS Tools and Database CD-RO M/DVD
Annex 10. Indicator metadata
Annex 11. Acronyms
Annex 12. INTERCO Tools User Manual
ESPON 2013 iii
List of figures Figure 1. Example sigma convergence graphs by type of region (accessibility by rail).................................................................................................................................. 8 Figure 2. Level of disparities for 4 indicators under territorial objective "strong local economies ensuring global competitiveness" (St. dev. / Mean) ................................. 9 Figure 3. The INTERCO process for the selection of indicators................................. 8 Figure 4. Process to refine the themes of the indicators .......................................... 15 Figure 5. The sustainable development framework ................................................. 15 Figure 6. INTERCO analysis framework for territorial cohesion............................... 29 Figure 7. Mortality risk from tropical cylcones, floods and landslides ....................... 48 Figure 8. Raster indicator on availability of secondary schools for Baltic Sea case study (tentative working map taken from ESPON TRACC project; input data still need to be finalized)......................................................................................................... 49 Figure 9. Car travel times to next hospital in southern Norway: Raster (left), municipalities (right) (Arnesen et al., 2010, 61; 66).................................................. 50 Figure 10. Percentage of population within certain travel times to hospitals in Southern Norway: 30 min (top left), 45 minutes (top right), 60 minutes threshold (bottom) (Arnesen et al., 2010, 71).......................................................................... 51 Figure 11. Principle of measurement of polycentricity.............................................. 53 Figure 12. Number of FUA centres accessible within a generally accepted maximum daily commuting time of 45 minutes ........................................................................ 55 Figure 13. Cohesion, well-being and sustainability .................................................... 5 Figure 14. Example of simple statistical indicators (NUTS 3 values by country : minimum, maximum, mean) .................................................................................... 12 Figure 15. Example of sigma convergence graphs.................................................. 13 Figure 16. Example of beta convergence graphs .................................................... 14 Figure 17. Disparities (standard deviation / average)............................................... 15 Figure 18. Bar chart of sigma convergences ........................................................... 16 Figure 19. Disparities for territorial objective "Inclusion and quality of life" (standard deviation / average)................................................................................................. 17 Figure 20. Disparities for territorial objective "Strong local economies ensuring global competitiveness" (standard deviation / average) ..................................................... 18 Figure 21. GDP per capita in PPS by country – Minima, maxima and averages...... 22 Figure 22. GDP per capita in PPS by type of region – development of disparities 2001-2010............................................................................................................... 22 Figure 23. GDP per capita in PPS by type of region – beta convergence................ 23 Figure 24. Indicator – GDP per capita 2008 (PPS). ................................................. 24 Figure 25. Unemployment rates by country – Minima, maxima and averages ......... 26 Figure 26. Unemployment rate by type of regions - development of disparities 2006-2009........................................................................................................................ 26 Figure 27. Unemployment rate – beta convergence ................................................ 27 Figure 28. Indicator – Unemployment rate (%). ....................................................... 28 Figure 29. Old-age dependency ratio by country – minima, maxima and averages . 30 Figure 30. Old age dependency ratio – development of disparities 2007-2009........ 30 Figure 31. Indicator – Old age dependency ratio. .................................................... 31 Figure 32. Labour productivity in industry and services by country – minima, maxima and averages .......................................................................................................... 33 Figure 33. Labour productivity (NUTS 0) – development of disparities 1998-2010 .. 33 Figure 34. Labour productivity (NUTS 0) – beta convergence ................................. 34 Figure 35. Indicator – Labour productivity per person employed (NUTS 0).............. 35 Figure 36. Indicator – Labour productivity in industry and services (NUTS 2) .......... 36 Figure 37. Degree of convergence (slope) for indicators under Territorial Objective “Strong local economies ensuring global competitiveness”...................................... 38
ESPON 2013 iv
Figure 38. Degree of actual disparities for indicators under Territorial Objective “Strong local economies ensuring global competitiveness”...................................... 38 Figure 39. Tertiary education – minima, mean and maxima .................................... 41 Figure 40. Tertiary education – development of disparities 2008-2010.................... 41 Figure 41. Tertiary education – beta convergence................................................... 42 Figure 42. Indicator – Population aged 25-64 with tertiary education....................... 43 Figure 43. Intramural R&D expenditures – Minima, mean and maxima ................... 45 Figure 44. Indicator – Intramural R&D expenditures. ............................................... 46 Figure 45. Employment rate 2009 – minima, mean and maximum by country ......... 48 Figure 46. Employment rate – development of disparities 2007-2010 ..................... 48 Figure 47. Employment rate – beta convergence .................................................... 49 Figure 48. Indicator – Employment rate 20-64 years ............................................... 50 Figure 49. Access to compulsory schools in 2008 – proportion of population reporting access difficulties (5th Cohesion Report, 97)........................................................... 55 Figure 50. Access to primary health care services in 2008 – proportion of population reporting access difficulties (5th Cohesion Report, 97)............................................ 57 Figure 51. Access to grocery services in 2007 – proportion of population reporting access difficulties (EU-SILC survey)........................................................................ 59 Figure 52. Accessibility potential by road – Min, mean and max.............................. 61 Figure 53. Accessibility potential by road – development of disparities 2001-2006.. 61 Figure 54. Indicator – Accessibility potential by road ............................................... 62 Figure 55. Accessibility potential by rail – min, mean and max ................................ 64 Figure 56. Accessibility potential by rail – development of disparities 2001-2006 .... 64 Figure 57. Indicator – Accessibility potential by rail.................................................. 65 Figure 58. Accessibility by air – min, mean and max ............................................... 67 Figure 59. Accessibility by air – development of disparities 2001-2006 ................... 67 Figure 60. Indicator – Accessibility potential by air. ................................................. 68 Figure 61. Disposable household income – Minima, maxima and averages............ 72 Figure 62. Disposable household income – development of disparities 2000-2007 . 72 Figure 63. Disposable household income – beta convergence................................ 73 Figure 64. Indicator – disposable household income............................................... 74 Figure 65. Life expectancy at birth by country – Minima, maxima and averages ..... 76 Figure 66. Life expectancy at birth – development of disparities 2002-2008............ 76 Figure 67. Life expectancy at birth – beta convergence........................................... 77 Figure 68. Indicator – Life expectancy at birth ......................................................... 78 Figure 69. Early school leavers by country – minima, maxima and averages .......... 80 Figure 70. Early school leavers – development of disparities 2006-2010................. 80 Figure 71. Early school leavers – beta convergence ............................................... 81 Figure 72. Indicator – early school leavers. ............................................................. 82 Figure 73. Gender imbalances by country – minima, maxima and averages ........... 84 Figure 74. Gender imbalances – development of disparities 2003-2008.................. 84 Figure 75. Gender imbalances – beta convergence. ............................................... 85 Figure 76. Indicator – Gender imbalances............................................................... 86 Figure 77. Female/male unemployment by country – minima, maxima and averages................................................................................................................................ 88 Figure 78. Indicator – Female/male unemployment rate.......................................... 89 Figure 79. Ageing index by country – minima, maxima and averages. .................... 91 Figure 80. Indicator – Ageing index. ........................................................................ 92 Figure 81. Degree of convergence for indicators under Territorial Objective “Inclusion and quality of life” .................................................................................................... 94 Figure 82. Degree of actual disparities for indicators under Territorial objective “Inclusion and quality of life” .................................................................................... 95 Figure 83. Potential vulnerability to climate change - min. mean and max............... 98 Figure 84. Indicator - potential vulnerability to climate change................................. 99 Figure 85. PM10 air pollution – minima, mean and maxima .................................. 101
ESPON 2013 v
Figure 86. Indicator – PM10 air pollution. .............................................................. 102 Figure 87. Indicator – PM10 air pollution at grid level (EEA, 2011) ........................ 103 Figure 88. Air pollution: Ozone concentration exceedances – Minima, mean and maxima ................................................................................................................. 105 Figure 89. Indicator – Ozone concentration (EEA, 2011). Ozone 26th highest maximum daily 8-hour average 2004..................................................................... 105 Figure 90. Indicator – Ozone concentration exceedances ..................................... 106 Figure 91. Soil sealing by country – minima, mean and maximum by country ....... 108 Figure 92. Indicator – Soil sealing per capita. ........................................................ 109 Figure 93. Population potential within 50 km – minimum, mean and maximum. .... 113 Figure 94. Indicator –Population potential within 50 km......................................... 114 Figure 95. Net migration rates by country – minimum, mean and maximum.......... 116 Figure 96. Indicator – Net migration rate ............................................................... 117 Figure 97. Cooperation intensity by country – minimum, mean and maximum ...... 118 Figure 98. Indicator – Cooperation intensity (ESPON TERCO) ............................. 119 Figure 99. Cooperation degree by country – minimum, mean and maximum. ....... 121 Figure 100. Indicator – Cooperation degree (ESPON TERCO) ............................. 122 Figure 101. Typology of Unemployment and Tertiary educated people (TED) rates per NUTS 2 regions of the ESPON space 2009 .................................................... 126 Figure 102. Difference of the Unemployment rates from that “expected” from the Tertiary educated people (TED) rates per NUTS 2 regions of the ESPON space 2009.............................................................................................................................. 127 Figure 103. Unemployment rate (%) 2007 classes and GDP 2007 classes per NUTS 2 regions of the ESPON space.............................................................................. 129 Figure 104. Unemployment rate (%) normalised by population 2007 per NUTS 2 regions of the ESPON space: relative difference to the unemployment rate "expected" from the GDP rate normalised by population ....................................... 130 Figure 105: Unemployment rate (%) 2009 per NUTS 2 regions: Moran’s I index and Z-score.................................................................................................................. 132 Figure 106. Unemployment rate (%) normalised by population 2007 per NUTS 2 regions: Moran’s I index and Z-score .................................................................... 133 Figure 107. ESPON urban-rural typology by NUTS 3 regions and the three INTERCO case studies .......................................................................................................... 142 Figure 108. Piedmont: Ageing rate % (persons aged 65+ years / Total population) per NUTS 3 (provinces) and LAU 2 (comuni) 2001...................................................... 146 Figure 109. Thessalia region: Population with tertiary education in % 2001 in NUTS 3 (prefectures) and LAU 1 (municipalities): mountainous, semi-mountainous, lowland, Functional Urban Areas (FUAs) population 2001 .................................................. 148 Figure 110. NUTS 2 and 3 units of the Western Balkans countries and Turkey (CC/PCC).............................................................................................................. 151 Figure 111. INTERCO_DB PGDB structure and contents (excerpts)..................... 156 Figure 112. INTERCO tools in ArcGIS Toolbox ..................................................... 157 Figure 113. Enhanced INTERCO Map Template................................................... 160 Figure 114. LYR files constituting the base map in thumbnails view (sample of all available layer files)............................................................................................... 161 Figure 115. The INTERCO indicator coding scheme (TtOYS structure to code variables) .............................................................................................................. 161 Figure 116. Indicator codes as field names in data tables of INTERCO_DB geodatabase ......................................................................................................... 164
ESPON 2013 vi
List of tables Table 1. Territorial objectives and top indicators - territorial cohesion analysis .......... 7 Table 2. Territorial challenges, policy priorities and issues (after the Project Specification)........................................................................................................... 10 Table 3. Territorial Agenda 2020 : challenges and priorities .................................... 11 Table 4. Policy evaluation levels.............................................................................. 16 Table 5. Criteria applied for the selection of indicators ............................................ 17 Table 6. Final list of indicators (wish indicators in italic)........................................... 19 Table 7. Territorial objectives and top indicators - territorial cohesion analysis ........ 37 Table 8. Linkages with other ESPON projects ......................................................... 45 Table 9. Example of a data table (gender imbalance).............................................. 11 Table 10. Categories and sub-categories of the ESPON DB ................................. 155 Table 11. Abbreviations indicating the spatial level in the indicator code............... 162 Table 12. Data type abbreviations used in the indicator code................................ 163 Table 13. Sub-directories under CARTO, EXCEL, LYRS and MAPS folders according to territorial objectives ........................................................................................... 165

ESPON 2013 4
B.1. Territorial cohesion, territorial indicators
B.1.1. Challenges of the project
The aim of the INTERCO project was to develop indicators and indices that can be used to measure territorial cohesion , but also complex territorial development,
structural issues, territorial challenges and opportunities as well as territorial effects
at different geographical levels and types of regions.
Indeed, the Project Specification listed many aspects that the INTERCO indicators
should cover. From the start, the TPG faced several challenges :
- Many EC and ESPON reports have produced indicators relevant to territorial
cohesion. In particular, two ESPON reports, "3.1 Integrated Tools for
European Spatial" and "4.1.3 Feasibility study on monitoring territorial
development" have provided an overall indicators approach of the European
territory : how to provide an added-value to the wealth of information that has
been and continue to be produced on territorial cohesion ?
- At the core of these studies, the concept of "territorial cohesion" lacks a
unique definition : how to find a shared understanding of territorial cohesion
(TC) as well as of the means to achieve it ?
- Given the many aspects mentioned in Project Specification and the fuzziness
of the "territorial cohesion" concept, how to define what to measure ?
Furthermore, an interactive approach with the stakeholders was proposed for the
selection of the indicators. The inclusion of many voices in the selection of the
indicators implies a risk of receiving many different and sometimes contradictory
requirements that might not be reconcilable. But this participatory component of the
project is necessary to capture the policy demand. It is essential to clarify to whom
the results of the project are targeted and the technical capacity and needs of the
latter. In our opinion, the results of the project are addressed to three main categories
of users / stakeholders:
a) the scientific community of ESPON and other researchers on territorial
cohesion analysis and planning;
b) ESPON Coordination Unit, DG Regio, Eurostat and other EC instances;
c) Policy makers at different levels (EU, national and local authorities) and the
technical staff of these organisations.
The third category of stakeholders needs a list of TC indicators easily
understandable, easily usable and very well related to TA 2020 objectives (as well as
to Europe 2020 and other relevant policy objectives).
An additional challenge is the empirical requirement : the TPG had to produce the
indicators, not only select and design them. The data constraint is a very important
component : data must be available for the relevant spatial and temporal resolution,
at the highest possible level of quality. The possibility to update the data with the

ESPON 2013 5
lowest possible effort must also be considered for the future exploitation of the
indicators.
In brief the INTERCO indicators must be scientifically robust, policy relevant and
easy to calculate and to use. Before moving to the methodology of the selection of
indicators, theoretical considerations on the territorial cohesion and territorial
indicators are presented in the two next chapters.
B.1.2. Territorial cohesion as a multidimensional a nd political concept
As a cross-cutting territorial dimension of EU policies, territorial cohesion has been a
priority in the ESPON research framework from the beginning. Policy documents,
actions and funding of the EU during the previous decades have already dealt with
territorial issues, but the current crisis and its asymmetric territorial impacts have
increased the importance of the territorial approach. As such, it should be at the
centre of the new Cohesion policy, which represents the second biggest envelop of
EU budget and whose key role in the recovery from the crisis is recognised by the
Commission.
The concept of territorial cohesion has been e.g. disseminated by the Green Paper
(EC, 2008a), which presented a comprehensive approach and did further foster the
debate around its different understandings. Highlighting the rich diversity of European
territory, territorial cohesion aims at turning this diversity into an asset for all places,
thus ensuring a harmonious and balanced territorial development and contributing to
a sustainable Europe. Territorial capital and potential are at the centre of these broad
objectives, but the scale and the territory considered may change the way to achieve
them. Thus, it appears as a twofold concept with the contradictory objective to
increase equity and balance through more diversity as source of comparative
advantages.
In a polycentric perspective, the focus is put on the potential of major inter-connected
economic centres, seen as urban drivers supporting smart growth and leading to
more balanced territorial development through positive diffusion effects. A more
inclusive understanding of territorial cohesion points out fair access to services and
knowledge through appropriate infrastructures, stating that everyone should have the
same development opportunities no matter where he lives. Thus, territorial cohesion
can be considered as the territorial dimension of the European social model, taking
into account socio-economic disparities at all levels and strengthening both solidarity
and competitiveness. Helping specific territories identified in article 174 TFEU
belongs to the same tendency, since territorial cohesion in this sense means to
enable every territory to find out its own path of development, thanks to its
comparative advantages. Innovation, here also, has a key role to play in finding ways
of preserving a rich and healthy environment, especially in vulnerable areas. Finally,
territorial cohesion is not conceivable without a high degree of cooperation between
territories and between actors, at each step of the policy process.

ESPON 2013 6
These different issues, linked to several territorial challenges Europe has to face
simultanously (global economic competition, ageing, migration processes, population
decline in many parts, climate change, energy supply), require coordinated policy
responses at different territorial levels, including functional areas. Therefore,
territorial cohesion implies not only place-based policies but also real territorial
governance.
A first characteristic of territorial cohesion as a policy objective is that it consists of an
harmonisation of different development paradigms, namely regional competitiveness,
convergence and sustainability (TSP 2011). In line with Europe 2020 Strategy to
which it has to contribute, future Cohesion policy will give even more weight to urban
issues and specific territories (EC, 2011c), concentrating its efforts to improve
competitiveness and efficiency. Thus, territorial cohesion is serving the objectives of
smart, inclusive and sustainable growth of the Europe 2020 Strategy and more
broadly it can be considered as the territorial dimension of sustainable development.
This long-term and global vision includes territorial cohesion in the overarching
questions of well-being and progress, i.e. an economic and social well-being that is
sustainable (Stiglitz, Sen, Fitoussi, 2009).
Knowing its different facets, its close links to quality of life issues and its temporal
dimension, the second key feature of territorial cohesion is that different ways of
measuring it are needed. This is why INTERCO project has decided to focus on
outcomes and impacts indicators, which are much more able to measure the
expected added value of territorial Cohesion policy .
B.1.3. Making the indicators territorial
Territorial cohesion indicators must be different from those elaborated for measuring
social/economic cohesion, sustainable development or territorial development. In
particular, emphasis should be given to the spatial, i.e. territorial dimension (in a strict
sense this condition will exclude all indicators that can only be calculated at national
level).
In brief, the indicators can be considered as territorial (and innovative) if :
- they provide improved spatial resolution , i.e. they are calculated at
subnational level, possibly at NUTS 3 level or below;
- they are based on intrinsic spatial components such as distance, area, e.g.
the population potential within a given distance;
- they are put in contexts, i.e. they give some measure of intra-European or inter-regional differences (e.g. differences to the European mean values,
standard deviations);
- they are calculated by types of areas (e.g. the urban-rural typology and the
typology of metropolitan regions from the ESPON regional typologies);
- they include a temporal dimension , i.e. they show trends (directions of
change). This is important when territorial cohesion is seen as a process;

ESPON 2013 7
- they can be interpreted in relation to the territorial objectiv es expressed in
policy documents such as the Territorial Agenda (i.e. having a clear desired
direction of change);
- they can be linked together logically speaking (through a reasonning), or
even ultimately combined into synthetic indicators, in order to provide a
coherent multidimensional view on the European territory.
The next sections will present how the indicators of territorial cohesion were selected
in the INTERCO project.

ESPON 2013 8
B.2. Key analysis
B.2.1. Selecting the indicators
B.2.1.1. General approach
Considering the multiple and evolving viewpoints on territorial cohesion, as shown in
the previous section, it was decided to adopt an approach that should:
- cover the main themes relevant to territorial cohesion, both from a policy and
theoretical point of view;
- build on existing data and indicators, as much as possible.
The approach is inspired by ESPON Project 4.1.3. It is iterative since it allows for a
continuous update of the list of indicators. It is also a mix of analytical/theoretical
work by the INTERCO team and participatory interaction with stakeholders in order
to capture their needs.
Figure 3 illustrates the various components of the INTERCO approach. The upper
horizontal layer represents the existing indicators, as found in various reports (box 1). The middle part concerns on one hand the thematic definition of the indicators (box 2), based on challenges, policy and issues considerations as identified from the
literature, the policy documents as well as from the stakeholders points of view. On the other hand it concerns practical assessment based on criteria of usability (box
3). The INTERCO territorial objectives (box 4) allow a synthesis of these two aspects and indicators have to measure these objectives. The next layer is the data basis for
the calculation of indicators (box 5). At the bottom are the final selected indicators
(box 6), which must be both relevant and feasible . If they are not feasible, they
move to the wishlist (box 7).
Data
UsabilityPolicy relevance INTERCO Territorial objectives
Final set of indicators
EU key / territorial strategies
Well-being Framework
Easy to communicate
and to use
Sub-national level, time series, coverage
Wishlist
Initial set of indicators (>600)
(3)(2)
(4)
(1)
(6) (7)
(5)
Theoretical & participatory approach
Figure 3. The INTERCO process for the selection of indicators

ESPON 2013 9
The several components of the process, boxes 1 to 7, are described below while
presenting the criteria for the selection of indicators.
B.2.1.2. Inventory of indicators and data
In the first phase of the project, an initial inventory of indicators (box 1) was carried
out on the basis of the work done in previous projects as well as on policy initiatives.
An analysis of the data situation was also done (box 5), which was subsequently
refined for the Interim Report. The indicators in the inventory are grouped according to a thematic and hierarchical (two levels) classification scheme based on the
ESPON Database thesaurus (Annex 1). This classification scheme is to facilitate the
browsing of the indicators, but has no particular meaning in terms of territorial
cohesion.
The selection of indicators had to comply with three main constraints.
First , the indicators have to reflect the territorial challenges, policy priorities and
issues identified in the Project Specification. They are presented in Table 2 below:

ESPON 2013 10
Territorial challenges Policy priorities Issues to be measured
Global economic competition: Increasing global pressure to restructure and modernise, new emerging markets and technological development
Climate change: New hazard patterns, new potentials
Energy supply and efficiency: Increasing energy prices
Demography: Ageing and migration processes
Transport and accessibility / mobility: Saturation of euro-corridors, urban transport
Geographic structure of Europe: Territorial concentration of economic activities in the core area of Europe, and in capital cities in Member States of 2004, further EU enlargements.
Balanced territorial development
Strengthening a polycentric development by networking of city regions and cities
Urban drivers (large European cities, small and medium sized cities, suburbanisation, inner city imbalances)
Development of the diversity of rural areas
Emphasis on ultra-peripheral, northern sparsely populated, mountain areas, islands
Creating new forms of partnership and territorial governance between urban and rural areas
Promoting competitive and innovative regional clusters
Strengthening and extending the Trans-European Networks
Promoting trans-European risk management including impacts of climate change
Strengthening ecological structures and cultural resources.
Population and migration
Economic development and potentials
Social issues
Environmental issues
Cultural factors.
Balance and polycentricity
Urban sprawl
Proximity to services of general interest
Border discontinuities
Geographical specificities
Sub-regional disparities
(Potential) accessibility
Natural assets
Cultural assets
Land (sea) use issues
Territorial cooperation options (urban-urban, rural-urban), etc.
Climate change impact
Regional competitiveness
Territorial opportunities / potentials
Innovative creativity
Well-being standards, quality of live, etc.
Table 2. Territorial challenges, policy priorities and issues (after the Project Specification)
Those various elements reflect current spatial policy development which takes its
origins in ESDP and was then taken up in Cohesion Reports, relevant Commission’s
communications (EC, 2008a, 2010a, 2010b, 2011a) and Territorial Agenda of 2007.
The Territorial Agenda (TA) and its background document (Territorial State and
Perspectives of the European Union) have been recently updated, taking into
account new phenomena and challenges such as the European crisis and the
consequences of last and future enlargements. Thus, TA 2020 identifies six territorial
challenges, which are also potentials for development, and six territorial priorities:

ESPON 2013 11
Challenges and potentials for territorial development
Territorial priorities for the development of the European Union
Increased exposure to globalisation: structural changes after the global economic crisis
Challenges of EU integration and the growing interdependences of regions
Territorially diverse demographic and social challenges, segregation of vulnerable groups
Climate change and environmental risks: geographically diverse impacts
Energy challenges come to the fore and threaten regional competitiveness
Loss of biodiversity, vulnerable natural, landscape and cultural heritage
Promote polycentric and balanced territorial development
Encouraging integrated development in cities, rural and specific regions
Territorial integration in cross-border and transnational functional regions
Ensuring global competitiveness of the regions based on strong local economies
Improving territorial connectivity for individuals, communities and enterprises
Managing and connecting ecological, landscape and cultural values of regions
Table 3. Territorial Agenda 2020 : challenges and p riorities
Knowing that this document represents the most up to date territorial strategy of the
EU, our second constraint was to look for indicators that can show to what extent
European territories are meeting these objectives, which are included in a large
extend in INTERCO territorial objectives. It is both a thematic and technical
constraint, since indicators have to cover the dimensions contained in these
priorities, to measure issues liable to change, to be available at time series in order to
show trends and to show a clear direction of change. Moreover, to be considered as
“territorial”, their data should be collected at low level, i.e. NUTS 3 or below, such as
LAU or degree of urbanisation.
Thirdly , indicators should also reflect the close links between territorial cohesion and
the goals of Europe 2020 Strategy and Sustainable Development Strategy (SDS),
which both include clear mid- and long-term objectives and targets, through headline
indicators. Indeed, meeting the interrelated targets of Europe 2020 is seen as a
mean of reinforcing economic, social and territorial cohesion, while the reviewed SDS
(2009) constitutes the overarching policy framework for all Union policies and
strategies. As such, the sustainable, low carbon and low-input economy it advocates
has to be taken into account in our indicators selection.
To comply with these constraints, INTERCO has developed a theoretical and
participatory approach, through the creation of five storylines about territorial
cohesion (see below B.2.1.3.), the identification of its key thematic dimensions (see
below under B.2.1.4.) and the synthesis of both theoretical and political development
into 6 territorial objectives (box 4 – see also B.2.2.)
B.2.1.3. Workshops
The aim of the ESPON INTERCO project was to ensure high usability of the final
indicators by policy makers and scientists dealing with European territorial cohesion.

ESPON 2013 12
For this purpose two different types of stakeholder workshops have been conducted.
A first round of workshops aimed at getting a better understanding of the user
demands and potential areas of usage of the indicators. Altogether four workshops
have been conducted for this purpose:
• one workshop with the ESPON Monitoring Committee within the framework of
the ESPON MC meeting on 16.11.2010 in Liege;
• two workshops with the ESPON Community within the framework of the
ESPON seminar of in Liege, 17-18 November 2010;
• one workshop with participants from various domains of policy making on
14.01.2011 in Brussels.
These workshops captured the different understandings of territorial cohesion, mainly
by developing various possible storylines of territorial cohesion.
The storylines represent different facets of territorial cohesion and reveal the policy
debate and contradictory forces at stake. They have been the organising principles of
the workshops which aimed to capture the stakeholders’ understandings and
reactions (see below). They were presented thanks to a short text explaining those
five evocative titles:
• Smart growth in a competitive and polycentric Europe
• Inclusive, balanced development and fair access to services
• Local development conditions and geographical specificities
• Environmental dimension and sustainable development
• Governance, coordination of policies and territorial impacts
As they are more prone to debate, they have been updated during the workshops.
For example, the environmental dimension was not part of the first set of storylines;
we included it after the comments made by stakeholders. They were also a mean to
get first ideas of which indicators could be used to illustrate or measure the single
facets of territorial cohesion.
Consequently indicators showing whether Europe is moving towards territorial
cohesion need to be flexible enough to serve rather different understandings of what
territorial cohesion is. Other recurring issues of these workshops were:
• the need for flexible geographies and different levels of detail of geographical
information depending on the questions to be assessed. Most prominently
was the plea for data at the level of functional regions;
• it has also been debated at several occasions whether the most prominent
need is on indicator or on territorial typologies identifying and grouping
territories with similar development preconditions for further assessment of
performances of comparable territories;
• in many discussions about territorial cohesion, the focus was less on a
European-wide picture of a cohesive territory but rather on the different

ESPON 2013 13
preconditions for development, growth and contribution to the aims of Europe
2020 in the different areas;
• in addition to the rather strong growth emphasis of the European policy
debate at present, the discussion stressed the issue of quality. This
concerned the quality of infrastructure and services as well as the quality of
life and policy-making;
• when it comes to indicators allowing for measuring the overall state of play of
territorial cohesion at European level, the discussions revealed hesitation as
to whether such an indicator is meaningful and possible;
• last but not least it has been stressed that the policy makers rather demand
simple and useful indicators than complex indicators.
The results of the workshops assessing the demand side and potential future use of
territorial cohesion indicators were fed into the work on selecting and developing the
most useful indicators carried out by the ESPON INTERCO TPG.
In autumn 2011, one informal meeting and a workshop were organised to discuss
preliminary results with potential users. The informal meeting was held in Geneva on
7 September 2011 and provided an important input to the final selection of indicators.
The ESPON workshop with a wide range of potential final users was held on 20
October 2011 in Brussels. This workshop was a decisive step in the project work as
the potential users provided valuable and partly very detailed comments on the
proposed indicators.
All this has been taken on board in the final development stages of the project.
Overall, the workshops have been an important part of the project work, allowing the
TPG to understand the user perspective of the indicator work and build a bridge
between practice and science.
B.2.1.4. An iterative work on the themes to be covered
Refining the themes
During the work done with the storylines, the INTERCO team continued its internal
work for the selection of indicators. The results of the first workshops were very
useful for that, but what had to be measured was still imprecise. Therefore, after the
dead-end situation was reached while trying to cross all challenges, policy
orientations and issues between them, we focused on the identification of the major
territorial cohesion dimensions to be covered, in order to find indicators closely
related. The idea was to take some distance from the storylines and from the
formulation of territorial challenges, policy orientations and issues as from the Project
Specification, so to isolate the main relevant thematic dimensions that could be
relevant at each scale and for every territory, no matter its geographical
characteristics. These dimensions highlight the common themes shared by
challenges and territorial priorities (both of Project Specification and TA). The main
dimensions identified are the following:

ESPON 2013 14
• Territorial structure
• Connection
• Competitiveness
• Innovation
• Inclusion
• Quality of environment
• Energy
• Cooperation/governance
Their role is to be the crossing points between the relevant themes on one hand, and
the issues to be measured and the indicators on the other hand. As such, they
constitute a step to the selection of indicators and allow to check if the selected
indicators cover all these TC dimensions. TC dimensions and storylines were
subsequently merged into six territorial objectives that cover both thematic issues
and policy orientations:
• Strong local economies ensuring global competitiveness
• Innovative territories
• Fair access to services, markets and jobs
• Inclusion and quality of life
• Attractive regions of high ecological values and strong territorial capital
• Integrated polycentric territorial development
The process of thematic specification that lead from the Project Specification to the
territorial objectives is shown in Figure 4 below:

ESPON 2013 15
StorylinesSmart growth in a competitive and polycentric EuropeInclusive, balanced development and fair access to servicesLocal development conditions and geographical specificitiesEnvironmental dimension and sustainable developmentGovernance, coordination of policies and territorial impacts
Project SpecificationTerritorial challengesPolicy orientationsIssues to be measured
Thematic dimensionsTerritorial structureConnectionCompetitivenessInnovationInclusionQuality of environmentEnergy Cooperation / governance
Territorial objectivesStrong local economies ensuring global competitiveness Innovative territoriesFair access to services markets and jobsInclusion and quality of lifeAttractive regions of high ecological values and strong territorial capitalIntegrated polycentric territorial development
Figure 4. Process to refine the themes of the indic ators
Considering other frameworks
Finally, three key theoretical frameworks were also applied to the indicator selection.
The sustainable development (SD) framework was used to check that all relevant
dimensions of the territory were covered, i.e. environment, society, economy, and
their respective interrelations1. Figure 5 illustrates this.
economy
environment societyenvironment & societyenvironmental justice
territorial qualityquality of life
environment & economyviability
territorial efficiencyeco-efficiency
society & economyeffiquity
territorial identityinclusion, access
economy
environment societyenvironment & societyenvironmental justice
territorial qualityquality of life
environment & economyviability
territorial efficiencyeco-efficiency
society & economyeffiquity
territorial identityinclusion, access
Figure 5. The sustainable development framework
1 The terms "territorial quality", "territorial efficiency" and "territorial identity" are taken from Camagni et al. (2010); "viability", "environmental justice" and "effiquity" from Da Cunha (2005).

ESPON 2013 16
A special attention was also given to the components of well-being , as defined in the
Stiglitz, Sen, Fitoussi (2009) report: i. Material living standards (income, consumption and wealth) ii. Health iii. Education iv. Personal activities including work v. Political voice and governance vi. Social connections and relationships vii. Environment (present and future conditions) viii. Insecurity, of an economic as well as a physical nature.
Thirdly, we also took into consideration the policy evaluation framework (Table 4),
which offers an interesting categorisation of the level of analysis that indicators allow
(e.g. see EEA 2009, Camagni et al. 2010):
Evaluation level Example
Impacts : ultimate, overall goals of policies Air quality => human health
Effects (outcomes) of policies on their target
groups/objects, which will in turn eventually
result in impacts
Share and total amount of fossil
fuel consumption (to be reduced)
Policy outputs : direct results of policy
measures
Number of solar panels installed
Policy inputs : means put in place for policy
measures that have a territorial impact
Government grants for solar
panels
Table 4. Policy evaluation levels
The basic idea for using this framework is that indicators should reflect in priority on
the territorial impacts of policies. But in our case, it was found difficult to apply this
framework straightforward since many policies and policy instruments are concerned
directly or indirectly with territorial cohesion. Nevertheless, the indicators were
categorised according to this input/output/effect/impact framework, and the focus was
put on impacts and effects during the selection of indicators.
Prioritising the indicators
Thanks to this iterative and policy driven selection process, the potential TC indicators were classified into headline and core indicators (Annex 2), depending on
how well they fulfill the criteria. This allowed reducing their number from more than
600 to around 60, but this was still too much. Finally, following recent policy
developments (TA 2020, new Cohesion policy ) and answering the need of having a
small number of simple, meaningful and policy relevant indicators, we identified 6 sets of top indicators, corresponding to the 6 territorial objectives they measure
(chapter B.2.2. Reasoning scheme for the final set of indicators).
ESPON 2013 17
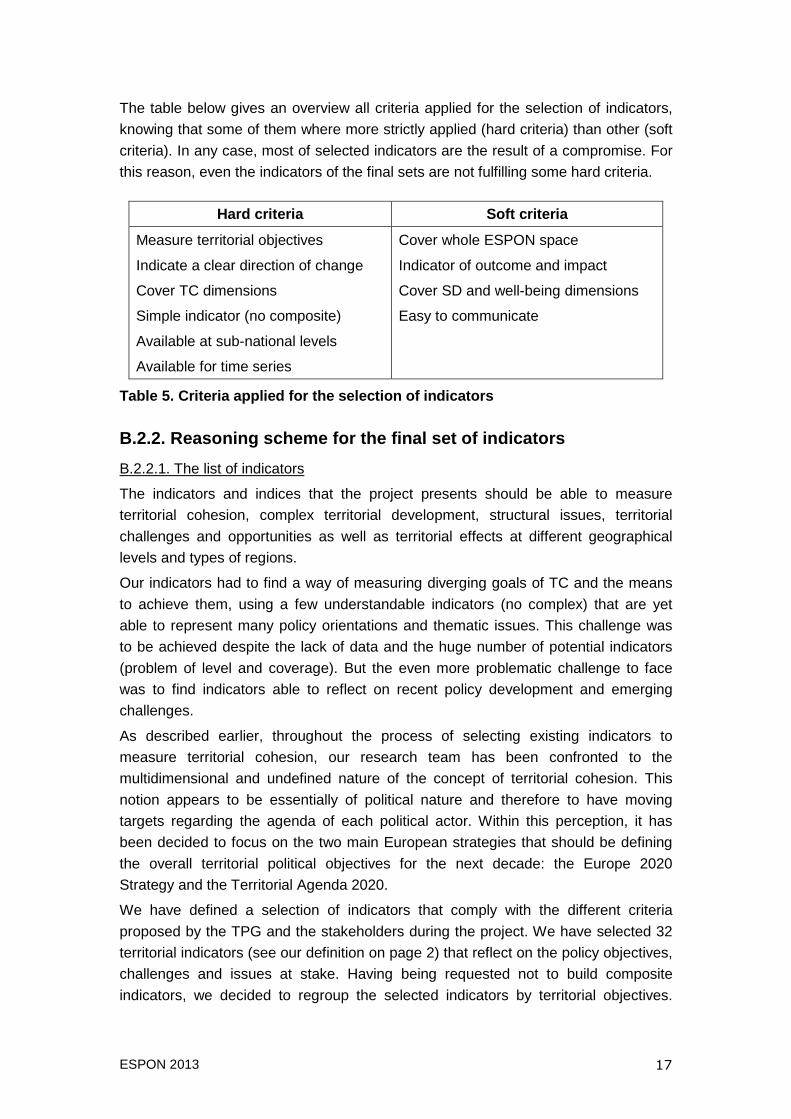
The table below gives an overview all criteria applied for the selection of indicators,
knowing that some of them where more strictly applied (hard criteria) than other (soft
criteria). In any case, most of selected indicators are the result of a compromise. For
this reason, even the indicators of the final sets are not fulfilling some hard criteria.
Hard criteria Soft criteria
Measure territorial objectives
Indicate a clear direction of change
Cover TC dimensions
Simple indicator (no composite)
Available at sub-national levels
Available for time series
Cover whole ESPON space
Indicator of outcome and impact
Cover SD and well-being dimensions
Easy to communicate
Table 5. Criteria applied for the selection of indi cators
B.2.2. Reasoning scheme for the final set of indica tors
B.2.2.1. The list of indicators
The indicators and indices that the project presents should be able to measure
territorial cohesion, complex territorial development, structural issues, territorial
challenges and opportunities as well as territorial effects at different geographical
levels and types of regions.
Our indicators had to find a way of measuring diverging goals of TC and the means
to achieve them, using a few understandable indicators (no complex) that are yet
able to represent many policy orientations and thematic issues. This challenge was
to be achieved despite the lack of data and the huge number of potential indicators
(problem of level and coverage). But the even more problematic challenge to face
was to find indicators able to reflect on recent policy development and emerging
challenges.
As described earlier, throughout the process of selecting existing indicators to
measure territorial cohesion, our research team has been confronted to the
multidimensional and undefined nature of the concept of territorial cohesion. This
notion appears to be essentially of political nature and therefore to have moving
targets regarding the agenda of each political actor. Within this perception, it has
been decided to focus on the two main European strategies that should be defining
the overall territorial political objectives for the next decade: the Europe 2020
Strategy and the Territorial Agenda 2020.
We have defined a selection of indicators that comply with the different criteria
proposed by the TPG and the stakeholders during the project. We have selected 32
territorial indicators (see our definition on page 2) that reflect on the policy objectives,
challenges and issues at stake. Having being requested not to build composite
indicators, we decided to regroup the selected indicators by territorial objectives.

ESPON 2013 18
Therefore, a coherent group of indicators were designed under each territorial
objective, which, by linking them one with the other, should represent the aim of
convergence for a coherent territorial policy. The research process led to 6 territorial
objectives: strong local economies ensuring global competitiveness; innovative
territories; fair access to services, market and jobs; inclusion and quality of life;
attractive regions of high ecological values and strong territorial capital; and
integrated polycentric territorial development. The list of desirable indicators is
presented by territorial objective in Table 6.
Unfortunately, these indicators are not all available as for today at the required
spatial level and/or for sufficient time series. As a result, it was not possible to
calculate some indicators and therefore it was decided to create a wishlist (cf.
chapter "B.4.1. Wishlist ", page 46 for the reasoning supporting the development of
this wishlist). A complete indicators table integrating also wishful indicators has been
set, hoping that in time these lacking data/indicators will be sufficiently developed in
order to better answer the focus.
If the first two territorial objectives seems to be rather well covered by indicators, the
third territorial objective would need a further development of the indicators of
accessibility. They would not need only to be aggregated by data from national level
or subdivided by degree of urbanisation, but rather by raster level or LAU 2 level and
then aggregated at NUTS 3, when they actually are available only for a few ESPON
regions. The fourth territorial objective is also rather complete, except for the
proportion of early school leavers that should be available at NUTS 3 level rather
than NUTS 1. However, the fifth one would need a better coverage on mortality, risks
and hazards, as well as biodiversity data and renewable energy potential. These
three indicators are actually not available at NUTS 3 levels and missing for too many
ESPON territories. For the few data available at satisfying level, there are no time
series to help analysing convergence. Therefore, using the existing indicators as
such would not be relevant for analysis due to the many gaps and differences in
scales availability for comparison. However, they are still important as they would
depict a number of important dimensions of territorial cohesion, through the indication
of natural assets and wealth of each territory. Notably, it will be important to
emphasis some aspects of these indicators underlying the environmental challenges
that will become more and more acute in the future years. As for the last territorial
objective, only the polycentricity index needs to be redefined with new FUAs.

ESPON 2013 19
Territorial objectives Indicators
GDP per capita in PPS
Overall unemployment rate
Old age dependency ratio
Labour productivity in industry and services
Strong local economies ensuring global competitiveness
Labour productivity per person employed
Population aged 25-64 with tertiary education
Intramural expenditures on R&D
Innovative territories
Employment rate 20-64
Access to compulsory school
Access to hospitals
Accessibility of grocery services
Access to universities
Accessibility potential by road
Accessibility potential by rail
Fair access to services, market and jobs
Accessibility potential by air
Disposable household income
Life expectancy at birth
Proportion of early school leavers
Gender imbalances
Difference in female-male unemployment rates
Inclusion and quality of life
Ageing index
Potential vulnerability to climate change (ESPON Climate)
Air pollution: PM10
Air pollution: Ozone concentrations
Soil sealing per capita
Mortality, hazards and risks
Biodiversity
Attractive regions of high ecological values and strong territorial capital
Renewable energy potential
Population potential within 50 km
Net migration rate
Cooperation intensity (number of common projects between partners, from ESPON TERCO)
Cooperation degree (the number of regions cooperating with each other, from ESPON TERCO)
Integrated polycentric territorial development
Polycentricity index
Table 6. Final list of indicators (wish indicators in italic)
The territorial objectives have been designed to better group indicators by set of
indicators. They are explicitly linked to TA 2020 and cover also the three dimensions
of Europe 2020 Strategy. The indicators assigned to each of these objectives are to
ESPON 2013 20
be meaningful not per se, but in relation to each other for the purpose of giving better
drive for Cohesion policy. When put all together, the territorial objectives should
shape tomorrow's cohesion between diverse territories building a strong, smart and
sustainable Europe. We strongly feel that this presentation of indicators allow
representing divergence or convergence of territories towards main EU territorial
policy priorities, by visualizing the regions that diverge clearly from average, thus
helping targetting the policy priorities. This leads to help classifying the regions by
results of policy actions, building new typologies. Meanwhile, the set of indicators are
flexible enough to follow policy future developments and data availability.
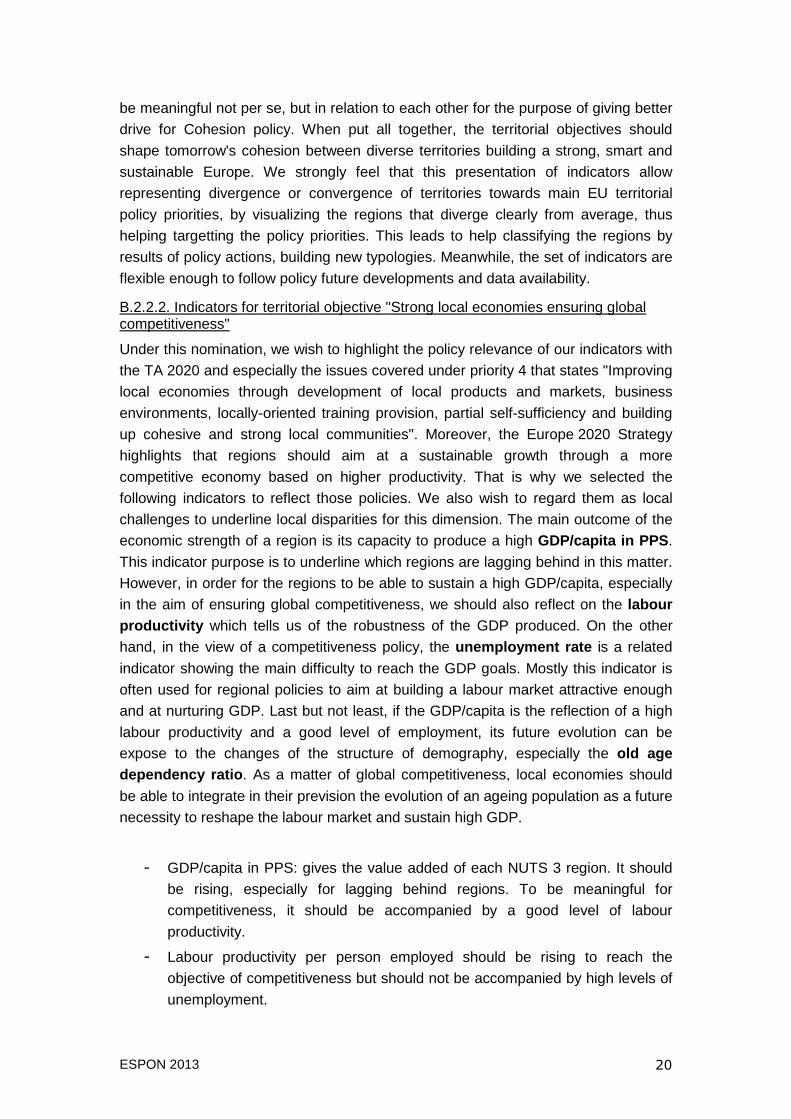
B.2.2.2. Indicators for territorial objective "Strong local economies ensuring global competitiveness"
Under this nomination, we wish to highlight the policy relevance of our indicators with
the TA 2020 and especially the issues covered under priority 4 that states "Improving
local economies through development of local products and markets, business
environments, locally-oriented training provision, partial self-sufficiency and building
up cohesive and strong local communities". Moreover, the Europe 2020 Strategy
highlights that regions should aim at a sustainable growth through a more
competitive economy based on higher productivity. That is why we selected the
following indicators to reflect those policies. We also wish to regard them as local
challenges to underline local disparities for this dimension. The main outcome of the
economic strength of a region is its capacity to produce a high GDP/capita in PPS .
This indicator purpose is to underline which regions are lagging behind in this matter.
However, in order for the regions to be able to sustain a high GDP/capita, especially
in the aim of ensuring global competitiveness, we should also reflect on the labour productivity which tells us of the robustness of the GDP produced. On the other
hand, in the view of a competitiveness policy, the unemployment rate is a related
indicator showing the main difficulty to reach the GDP goals. Mostly this indicator is
often used for regional policies to aim at building a labour market attractive enough
and at nurturing GDP. Last but not least, if the GDP/capita is the reflection of a high
labour productivity and a good level of employment, its future evolution can be expose to the changes of the structure of demography, especially the old age dependency ratio . As a matter of global competitiveness, local economies should
be able to integrate in their prevision the evolution of an ageing population as a future
necessity to reshape the labour market and sustain high GDP.
- GDP/capita in PPS: gives the value added of each NUTS 3 region. It should
be rising, especially for lagging behind regions. To be meaningful for
competitiveness, it should be accompanied by a good level of labour
productivity.
- Labour productivity per person employed should be rising to reach the
objective of competitiveness but should not be accompanied by high levels of
unemployment.

ESPON 2013 21
- Unemployment rate gives the counter figures for what may restraint
GDP/capita and competitiveness for each territories. It is a context indicator
that should be declining.
- Old age dependency ratio is a context indicator that is also representing a
possible constraint for future GDP growth and competitiveness. It should stay
stable.
B.2.2.3. Indicators for territorial objective "Innovative territories"
Innovation is at the centre of current EU strategies for recovery, growth and
sustainable development. This fundamental role was already described in the Lisbon
Strategy. Being the first flagship initiative of Europe 2020 Strategy, it permeates all
fields of European policies and most of territorial cohesion dimensions, as a
transversal mean to achieve it. Because knowledge and innovation are seen as
drivers of growth, they can help creating and distributing wealth, helping territories to
face current challenges. This is central for territories as it trigger them to find their
proper way to make good use of their assets. This allows building locally-oriented
development strategies based on innovation. For this particular reason, regional and
local efforts to assess each strengths and weaknesses are important for the
development of innovation strategies on a more national level. Especially, eco-
innovation is expected to deliver appropriate response to the need for energy
efficiency and low carbon economy, while innovation in the governance process will
help rationalising and improving the institutional framework for better territorial
governance. Thus, research and development should not be only for top class
territories and actors. The main purpose is to foster human capital by building
educational capacities in each territory across Europe to promote creativity and
innovative capacities in the private sector. In this case, the indicators chosen reflect much more on the political leverage possible such as the intramural R&D expenditures which should allow to sustain the population age 25-64 with tertiary education and the employment rate for the 20-64 years-old .
- Population aged 25-64 with tertiary education should also be rising for the
purpose of having more educated people for more innovative capacities.
- Intramural R&D expenditures should be expanding in order to reach the goal
of more innovation in a region.
- Employment rate 20-64 is the context indicator for this set of indicators and
should be rising.
B.2.2.4. Indicators for territorial objective "Fair access to services, market and jobs"
Though this objective is an overall well-being objective throughout any political
document, its territorial dimension is essential as it is indicated in TA 2020 under
priority 5: "fair and affordable accessibility to services of general interest, information,

ESPON 2013 22
knowledge and mobility are essential for territorial cohesion. Providing services and
minimising infrastructure barriers can improve competitiveness and the sustainable
and harmonious territorial development of the EU". Europe 2020 also focuses on this
objective that is needed since "ensuring access and opportunities for all throughout
the lifecycle is essential for territorial cohesion". In this set of indicators, we chose to
select the classical indicators of access to services that were available at this level
and joining the purposes of the other territorial objectives to underline lack of services
and clearly notify local government to take measures against such territorial
discriminations. In that spirit, we selected indicators of educational access such as compulsory schools which are more relevant in the European Union framework
than access to primary school. But to comply with innovative territories and
educational skills, the access to universities is certainly one major issue at stake to
create more cohesion in tertiary education and therefore to serve the innovative and
competitiveness of labour market among the diverse territories. The accessibility for
other services will be more completely described in the wishlist as their availability is
not yet sufficient for the pertinent spatial level required. Furthermore, the other major
issue to best serve access to jobs and market is certainly the connectivity within the
territory and among the regions that is represented through indicators of transportation services in place such as accessibility potential by road, by air and by rail .
- Access to compulsory schools must certainly be more important and should
reach 100% as a political objective per se. It is also a very important
component in terms of fair access to jobs. Thus, it also draws the inequalities
among regions in terms of business attractiveness to be able to provide an
essential educated labour force.
- Access to universities should get easier as it also plays an important role for
innovative economy and highly educated population. Thus the spatial level
could be seen larger than the access to compulsory schooling.
- Accessibilty potential by road, by air and by rail should be more numerous in
regions that are less connected to GDP and labour market for public and
private transportation .
B.2.2.5. Indicators for territorial objective "Inclusion and quality of life"
Again, this territorial objective certainly serves an overall objective that is the well-
being of population and should reflect the policy direction for erasing social
disparities among European territories. This territorial objective is about social
cohesion, but inequalities also represents a territorial issue when they reflect on
different territorial policies, constraints and assets. TA 2020 mentions under priority 2
that "territories facing severe depopulation should have long-term solutions to
maintain their economic activity by enhancing job creation, attractive living conditions
and public services for inhabitants and businesses". This objective is clearly linked

ESPON 2013 23
with the first objective as it is both a result of and an input for a good level of GDP
production. This objective is getting in line with the Europe 2020 Strategy's third
objective that promote "an inclusive growth through high levels of employment, a
balanced distribution of benefits of economic growth and full use of labour potential."
Specifically, the strategy aims at reducing poverty, promoting gender equality, facing
challenge of ageing population and decreasing early leavers from education. For this
purpose, the selection of indicators is very much focused on the basic social themes. They are represented by the disposable household income to reflect the level of
poverty. It is put in balance with the access to good health care given by the life expectancy at birth , and the quality of schooling represented by the proportion of early school leavers . The inclusion facet will focus more on the inequality of access
and the structure of population (contextual indicators) such as gender imbalances
and ageing index to reflect the demographic structures and the difference in female-male unemployment rates to ponder the inequality of access given each
regional contexts.
- Disposable household income should definitely get higher, with a more rapid
growth in region with higher level of poverty, and/or with lower female
employment rate (single wage household).
- Life expectancy at birth is desirable to rise, knowing that it should be counter
balanced with ageing index: a higher life expectancy at birth reflects a good
health system access. However, it should be increasing without misbalancing
the demographic structure that have serious impacts on social policies
projections. Indeed, the social policies are expected to adapt the evolution of
the ageing index by responding with the necessary caring system and
pensions system in order to avoid larger exclusion.
- Proportion of early school leavers should be dropping in order to rise the
expectation of access to labour market and not be excluded.
- Gender imbalance is a demographic context indicator that should be reduced
for the household income to rise, if the difference in female-male
unemployment is not too high.
- Ageing index, should stay stable or should allow social policies answering
the situation.
- Difference in female-male unemployment rates should be reduced, to ponder
inequality of access to income for female (for more inclusion) and to rise the
household income.
B.2.2.6. Indicators for territorial objective "Attractive regions of high ecological values and strong territorial capital"
This territorial objective seems at first of crucial importance regarding the local
contexts agenda and the policy directives of the main policy documents. Effectively,
TA 2020 mentions under priority 5 that: "We support decentralised, efficient, secure

ESPON 2013 24
and environmentally-friendly production and use of renewable and low carbon
energy" and Europe 2020 promotes "sustainable growth, which means building a
resource efficient and sustainable economy. The objective is to decouple growth from
energy use by reducing emissions and exploiting fully the potential of new
technologies and sequestration possibilities". However, the level of data collection on
such recent directives is not yet enough elaborated to be significant at local scales.
Thus, we cannot link properly all indicators one with the others as they are too many
missing data for this territorial objective. Notably, the indicators around renewable
energy use and potential are of primary importance in this matter, but the level of
recollection and the time series are not sufficient to draw an analysis. In the ReRisk
project, it has been strongly stated that energy was an issue for inequality among
Europan territories, due to economic vulnerabilities, region's dependance and social
vulnerrability. The indicator they developed is interesting but there are no time series
yet to be able to analyse convergence. The same can be said for biodiversity, which
represents the territorial capital and ecological values. It is neither available for all
ESPON regions, nor at local levels and most of the case with no time series (like
Natura 2000). We have also included the natural risks and hazards in the wishlist and
not in the final list of indicators as the data are not available at time series. The
ESPON 1.3.1 Project worked on data from 2004 and 2005 based on a delphi method
to assess risks. For a convergence analysis, the data is not enough developed
through time or in spatial resolution. We strongly wish that in the future time series
and avaibility for these indicators, through all territories, should be developed and be
included in our database. Despite this, to reflect these issues as best as we could,
we selected existing indicators capable of expressing concerns that are considered
to be global issue with local impacts, and that need interventions of local government
as well as coordination with upper and neighboring areas for a holistic approach in
order to have a coherent vision throughout the territories. This is particularly true for
the vulnerabilities to climate changes. This indicator, though not complete for all
ESPON territories and not available as time series, was chosen as the outcomes of
change changes can be potentially devastating for regions. It has been calculated through a new ESPON indicator, the potential vulnerability to climate change . The
ESPON Climate research allowed representing the social vulnerabilities in the
regions exposed to climate changes, including the levels of preparedness of local
government and their capacities to respond when confronted to cases of extreme
climatic events. On the same matter, we chose more contextualised indicators that
are bound to slow changes through policy directives. Air pollution, through PM 10 and ozone concentration , are very representative of the incoherent policies
between local levels, when they are managed by administrative bounds though
pollution meets no such circulation constraints and have a tremendous impact on public health. Last but not least, the soil sealing per capita is supposed to reflect on
the land use and therefore impact strongly on the territorial capital. Once again, it
should be put in reference to biodiversity data that are not available at the required

ESPON 2013 25
spatial level to able us to conduct a consistent analysis with the indicator of soil
sealing per capita.
- Potential vulnerability to climate change should be reduced, especially the
socio-economic sensitivity to exposure to extreme climatic events by rising
GDP, preparedness and caring system. And if possible it should be aiming at
lowering the levels of greenhouse gas emissions, pollutants and degradation
of environment that increase the degree of risks and hazards.
- Air pollution (PM10 and ozone concentration) should definitely be decreasing
at the level of WHO and European recommendations within ranges that are
not harmful for public health. The policies and regulation should be coherent
for each and every territories of ESPON, the emissions being by essence
transboundary. Policies are less efficient when conducte by solely few
regions.
- Soil sealing per capita should remain stable as much as for the permeability
and the chemio-biological properties of land than for the purpose of disposing
of a good balance between biodiversity value and well-being of population in
a built environment.
B.2.2.7. Indicators for territorial objective "Integrated polycentric territorial development"
This territorial objective is probably the most important one to reach for a truly
cohesive European territory. However, once again, existing data are lacking. We
have to be aware of the importance of developing better governance and political
achievement indicators at local level throughout the entire ESPON area. This
objective is strongly recommended through the various documents, notably in the TA 2020, priority 1, which states that "polycentric and balanced territorial
development of the EU is key element of achieving territorial cohesion". They
forecast a vision of Europe that would develop "a Polycentric pattern of the most
developed cities and regions; encouraging city networks and polycentric
development at macro-regional, cross-border and national and regional level; and
reducing the strong territorial polarisation". The reason why it is so important is
developed in priority 3: "Territorial integration and co-operation can create a critical
mass for development, diminishing economic, social and ecological fragmentation,
building mutual trust and social capital". These two goals of polycentricity and of
cooperation between regions are beginning to be measured. We also should include
the polycentricity index as soon as the new definition of Functional Urban Areas
(FUAs) will be integrated. In the mean time, we can try to measure it by including the population potential within 50 km to best describe the density of population within
a radius of 50 km as the crow flies to represent areas of dynamic potential. When
compared to net migration rate, this will certainly indicate the attractiveness of each
of this territories and how they will evolve. This will help policy makers to target better
the regions less attractive in terms of demography dynamism. On the other hand,

ESPON 2013 26
new ESPON indicators, deveeloped by TERCO project, allows us to measure the
capacity of regions to collaborate and cooperate, thanks to the indicator of
cooperation intensity (number of common projects within INTERREG IIIC) and the
indicator of cooperation degree (number of region cooperating with each other). It
seems to be the best existing indicators to reflect the governance cooperation
between territories to reach same political goals and therefore, to run more coherent
policies towards cohesion.
- Population potential within 50 km is a contextual indicator that is to be
compared to other data to be meaningful, such as net migration rate or
access to jobs and market. It represents regions that should remain stable
and other that are too populated compared to labour access and
opportunities, or too sparsely populated.
- Net migration rate should be used as a context indicator that can counter
balance the effect of an ageing population or a too sparsely populated area,
or even measure the attractiveness of a territory for the local government to
be able to adapt social and economic policies in relation to the demographic
situation.
- Cooperation intensity is reflecting on the capacity of a region to collaborate
with other regions. The fact that the regions should agree on a large number
of common project with others is a sign of a better cooperation and
coordination of policies, though it does not reflect the quality of cooperation.
- Cooperation degree reflects the number of regions who are coordinating their
effort on similar projects to reach similar policy goals. The more regions that
agree on partnership to target the same goal, should enhance coherent
policies across European territories. And a large number of territories who are
willing to collaborate on one goal, will allow a larger and more efficient
outcome.
B.2.2.8. Indicators for world and local scales, Western Balkans and Turkey
Global
While discussions are not (yet) focused on achieving the policy goal of territorial
cohesion at the global level, there are several attempts to measure development,
sustainable development and quality of life on a world-wide scale. The most pertinent
and vigorous examples include the Human Development Index (HDI) to measure
wealth, health and education and the World Development Indicators by the World
Bank (World Bank, 2012) to help monitor the process towards the Millennium
Development Goals (MDGs) which form a blueprint for achieving development world-
wide, and in particular alleviating the situation of the most disadvantaged countries.
ESPON 2013 27
Other databases in which the global indicators can be found are via UNESCO and
the ILO Labour Statistics Database.
Globalisation, like territorial cohesion is a multifaceted notion but the principal
underlying idea is the progressive integration of economies and societies according
to the World Commission on the Social Dimension of Globalisation (WCSDG) (ILO,
2004). The WCSDG report identifies a number of elements where the EU model has
contributed to success in improving living and working conditions. It also mentions
that the EU's economic and social model, and the Lisbon Strategy even though they
cannot simply be transposed to other parts of the world, contain a number of aspects
which may be of interest for global development, especially in terms of the processes
which are essential to the achievement of the balance between all the objectives at
stake.
Most of the global indicators are only available at NUTS 0, and thus lack an important
dimension of territoriality that the EU-level indicators have. Annex 4 presents the
INTERCO indicators transposed to the global level, using similar or equivalent
indicators.
Local
As defined in the Inception Report, the analysis of territorial cohesion on the basis of
the local level takes into consideration the headline indicators defined in the general
framework of INTERCO.
The analysis at the local scale required the compilation of data at LAU 1 and/or LAU
2 levels resulting in a set of selected local indicators relevant to the project calculated
for three specific case studies (Sydsverige-Eastern Denmark, Piedmont and
Thessalia). However the difficulties founded when trying to get available and
comprehensive data at the local level constitute a major constraint as there isn’t for
example a centralised database containing indicators at LAU level at a European
scale. The process of collection and harmonisation of data at this level becomes
challenging since often it is necessary to track the indicators among several sources
of data in each individual case study area. Limitations were found especially when
looking for INTERCO headline indicators at a local level associated to thematic sub-
categories on energy, poverty, environment, quality of life and governance
categories. However other INTERCO headline indicators in the sub-categories of
population, employment and education were feasible to be included in the analysis.
Therefore a set of selected and available local indicators in these categories is
calculated for the three mentioned local case studies (See Annex 5, Annex 6, Annex
7).
Western Balkans and Turkey
A first objective of this research was to assess the availability and quality of data for
the indicators which better reflect the territorial cohesion in the Western Balkans
countries and Turkey. Thus, interested stakeholders could extend their territorial

ESPON 2013 28
analyses in these countries, at least for the main facets of territorial cohesion. To this
end, we have used the indicators selected in INTERCO as top as well as the
headline and core ones4.
The data assessment showed that there are available data at sub-national level
(NUTS 2 or NUTS 3 – which could be aggregated at national level) for seven final indicators and for two others there is data only at national level. Regarding the
headline indicators there are available data at sub-national level for nine indicators
while for two other there are only country level data. Finally, there are data at national
and/or sub-national level for a small number of core indicators.
As the necessary data at sub-national level for the Potential Candidate Countries
(PCC): Albania (AL), Bosnia and Herzegovina (BA), Serbia (RS) and Kosovo under
UN Security Council Resolution 1244 (XK) are scarce, we have examined only six
indicators: GDP rate, GDP dispersion and unemployment rate, ageing index, life
expectancy and population density. Therefore, we have not made a complete
analysis of TC at this level. Inversely, we have analysed in more depth these few TC
indicators in order to see if the additional results bring important insights regarding
the TC patterns at national and sub-national level (NUTS 2-3) as well as on the
differences between these two last. This comparison complements the results of the
sections of the project which refer to the entire ESPON space and to the local level.
B.2.3. Analytical framework
Analysing the development of the ESPON space towards territorial cohesion is not
only a question of selecting the approproate indicators, but also a question of the
applied analytical framework. The analytical framework needs to account for both the
territorial and temporal dimension of cohesion. The territorial dimension looks at
disparities between regions at a given time, while the temporal dimension looks at
the development of these disparities over a certain time period. Disparities at a given
time should be minimal among Europe's regions, which can be analysed by applying
statistical measures. Existing disparities should furthermore decrease over time,
ideally towards a certain threshold or target value. In order to assess observed
temporal dynamics whether these developments contribute to cohesion, one needs
to know the desired direction of change of each single indicator. Sometimes a
decrease in indicator performance is desired, sometimes an increase or a
stabilisation over time. If possible, the temporal dimension (‘trend’) should be
analysed over a period of ten years.
The analysis framework for territorial cohesion assessments needs to reflect both
these dimensions (Figure 6): territorial disparities at a given time can be analysed by
using standard statistical measures such as minimum/maximum values, standard
deviations, Gini index, or by more complex approaches like spatial auto-correlation
analyses (e.g. Moran's I), regression analyses or construction of typologies. The
4 The second objective of this research, the analysis of the territorial cohesion pattern in these countries, is examined in the section B.2.3.

ESPON 2013 29
temporal dimension in its easiest form is implemented by simple change detection
(differences for two points in time expressed in absolute or relative terms) and by
detecting the change direction (trends). The disadvantage of simple change
detections between two points in time is that it is subject to the selection of the two
points – often change patterns differ significantly if two different reference years are
chosen.
Figure 6. INTERCO analysis framework for territoria l cohesion
It is also crucial to identify a so-called desired direction of change for every territorial
cohesion indicator. Ideally this direction of change is linked with a threshold or target
value that is set to reach for entire Europe, or for individual subsets of regions. Such
target values cannot be deduced from statistics, but need to be the outcome of a
political discussion process.
The INTERCO analysis framework applies sigma and beta convergence measures to
analyse both the territorial and temporal dimensions in single statistical measures.
- The beta convergence is the correlation between states and trends to
analyse whether badly performing regions catch up faster than good
performers. Even though the indicator development over time may lead to a
certain level of convergence, it is furthermore necessary to assess whether
this development leads towards a desired direction, or whether the observed
direction is, for different reasons, not desired.
- The sigma convergence measures applied at regional level calculates how
regional disparities evolved over time. The disparities are calculated using the
standard deviation of NUTS values divided by the average of the same values
(in order to compensate for changes in average values over time). It must be
noted that beta convergence is a condition for sigma convergence (reduction

ESPON 2013 30
of disparities can only occur if territories lagging behind are able to catch up
others).
The above statistical measures are applied on an indicator-by-indicator basis. In
reality, however, one can often observe that one indicator might develop into a
certain direction (for instance, towards convergence), while another indicator
developed into the opposite direction (see Table 7). An obvious solution to this
problem is to group the individual indicators by ‘themes’ or by ‘dimensions’ and to
look whether all indicators under a particular theme develop into the same direction.
This approach is followed in INTERCO. The themes of INTERCO are the territorial
objectives (see Chapter B.2.2.1. The list of indicators). More information on the
calculation and presentation of the indicators is provided in the Scientific Report,
chapter C.2.3. Calculation of the indicators).
From this analytical framework one can derive certain (technical) requirements that
an indicator candidate needs to fulfill in order to become a territorial cohesion
indicator (see chapter "B.1.3. Making the indicators territorial", page 6 for more
information):
- indicators must be available at a high spatial disaggregation; ideally at NUTS
3 level or below (LAU 2, raster);
- indicators must be available as time series (at least over the last ten years;
not just only for two points in time);
- indicators must be available for entire ESPON space;
- there should be no data gaps for individual regions or years;
- one must be able to define a desired direction of change;
- optionally, a target value or threshold should be available.
A summary of the data availability for the top indicators is provided in Annex 3.
In order to allow for a comparative illustration of the territorial cohesion indicators (the
list of territorial cohesion indicators finally selected is presented in page 17), the
INTERCO project furthermore developed so-called indicator fact sheets along with a
standardised map template (see chapter "C.5.3. Mapping and cartography", page
158 for more information).
B.2.4. Key findings at the European level
The analysis of the selected indicators with view on territorial cohesion revealed large
differences between the territorial objectives, but also between indicators of the same
objective. Wherever data availability allows it, sigma and beta convergence plots
were generated in order to analyse the temporal dimension of cohesion, in addition to
the cartographic analysis of the present state. The following paragraphs summarize
the main findings of the indicator analysis by territorial objective. The full results
including metadata and maps can be found in Chapter C.3. of the Scientific Report.

ESPON 2013 31
Strong local economies ensuring global competitiven ess
Over all four indicators under this objective, there is no general trend towards
convergence. While GDP per capita and unemployment rates only reveal slight
positive effects, opposite negative developments can be observed for the old age
dependency ratio. Only labour productivity showed clear trends towards cohesion,
albeit measured at national level.
The indicator GDP per capita revealed quite distinct developments of disparities,
with slight increase until 2001 for all type of regions, and slight trend of convergence
afterwards. As desired, results show that trend of convergence in remote regions
(intermediate and rural) was highest, while disparities in urban regions or regions
close to a city remained stable.
For all European regions, a slight trend towards convergence of unemployment rates could be observed over the recent past (2006-2009). Even though this overall
trend of convergence is appreciated, there is no harmonious trend of convergence for
all rural regions, as desired, since only those rural regions close to a city reduced
disparities in unemployment, while during the same period disparities for remote rural
areas increased. For urban regions, including the old industrialised ones, disparities
remained.
Despite slight convergence trends in the old age dependency ratio for rural regions,
increases in disparities for intermediate and urban regions led to an overall increase
in disparities. Thus, the desired direction of change is not met, neither in terms of
cohesion trends as a whole nor in terms of striving for a balanced age structure.
For labour productivity , remarkable trends toward cohesion at national level could
be observed with least performing regions catching up faster than good performing
ones. Thus, the indicator moved into the desired direction of change.
Notwithstanding the recent development trends, big disparities among regions for
GDP per capita and unemployment rates still remained stable, while disparities for
the old age dependency ratio is lowest, followed by labour productivity (at NUTS 0).
Innovative territories
Concerning tertiary education , convergence trends towards cohesion at regional
level could be observed since lagging regions developed stronger than those who
were already good performers; differences within countries are rather small
compared to the difference between countries, revealing fundamental differences in
the national education systems.
Due to poor data availability, no time series analysis was possible for intramural R&D expenditures . Great disparities still exist even within high-tech regions and
rural regions within countries, but there are obvious big gaps still existing between
the old and the new EU Member States.
Gaps in employment widened since 2007, because good performing regions
improved their employment rates at the expense of lagging regions, which

ESPON 2013 32
experienced a further fall in employment, making existing disparities permanent
between the East European and South European countries on the one hand, and the
remaining parts of Europe on the other hand.
Overall results for this objective show that there is no automatism in improving levels
of tertiary education and employment rates. It looks quite the opposite, trends of
convergence for one indicator does not necessarily imply the same development
trends for the other indicator. For entire Europe, this led to a convergence in tertiary
education, but to widened gaps in employment rates.
Fair access to services, market and jobs
Access to services has become a clear challenge during the last decade. Given the
current demographic and economic trends, ensuring a minimum access to services
such as compulsory schools, primary health care, hospitals, universities, etc.
becomes a real challenge in rural and sparsely populated areas and in areas with
other physical constraints (mountains, islands etc.). Partly up to 40% of the
population is facing severe access problems to such services, as the 5th Cohesion
Report revealed. There are not only big disparities between countries, but also within
countries between urbanized, intermediate and rural regions.
Large disparities of accessibility potential by road, rail and air exist, and continue
to exist in the European Union (Spiekermann and Schürmann, 2007). New transport
infrastructures built between 2001 and 2006 were not able to change the overall
European spatial patterns with good, moderate and low accessibility (Spiekermann
and Schürmann, 2007, 25), even though in the process of EU enlargement, many
new EU Member States significantly improved their road networks, and thus
improved their relative position. When looking at rail, the improvements of road
accessibility in the new Member States were counteracted by the implementation of
high-speed rail networks, linking city centres with each other.
Insofar regional deficits in competitiveness based location still remain; in different
types of regions disparities even increased due to the construction of high-level
transport infrastructures such as high-speed rail lines or motorways, connecting
urban centres with each other and bypassing rural or remote areas. The design of
the trans-European transport networks (TEN-Ts) outline plans obviously has a bias
towards improving the competitiveness of European agglomerations on the expense
of increasing disparities between rural and remote regions and highly-accessible
urban centres.
A detailed look at the transportation modes revealed that for the accessibility potential by road , one can observe a moderate trend towards cohesion across all
regions between 2001 and 2006; however, the development was quite
heterogeneous for different types of regions: while disparities for predominantly rural
remote regions increased, and stagnated for urban regions, disparities decreased for
all other types of regions. Disparities remained stable in this time period for the
indicator accessibility potential by rail , again with quite distinct developments for

ESPON 2013 33
different types of regions. While disparities for urban regions and for predominantly
rural regions close to a city increased, there was a clear trend towards convergence
for intermediate remote regions and for predominantly rural remote regions. The
trend for all Europe shows a widening gap. Results for the accessibility potential by air , in contrast, was quite clear with overall trends towards cohesion for all types of
regions for entire Europe.
Inclusion and quality of life
Disparities for most indicators under this objective remained stable over the last
decade, except for the proportion of early school leavers and the difference in female-male unemployment rates. For the first one, a clear trend towards
convergence could be observed since 2006 for the entire ESPON space. Many
regions with high proportions of school leavers managed to reduce these rates
significantly, but there were also some regions experiencing increases. For the
second, there is an interesting north/south pattern with higher female unemployment
rate in the Mediterranean countries plus France, Poland, Czech Republic and
Slovakia, while higher unemployment rates for men can be observed in Scandinavia,
Baltic States, Ireland, UK, Germany, Bulgaria and Romania. There are few countries
with balanced unemployment rates across sex, but disparities within countries are
decreasing, especially after 2004.
Disparities for the indicators life expectancy at birth and gender imbalances
remained almost stable, though at a low level. There has been almost no significant
development since 2002 (LEB) and 2003 (gender imbalances). Differences within
countries remain small for life expectancy, but differences between countries are
quite high, whereas almost all of them experience a slight overrepresentation of
women.
As for the ageing index , we can notice a general trend towards cohesion and many
countries revealing only small disparities. There are however remarkable exceptions
like Germany, Spain, Portugal, Greece or Italy which show great disparities between
their regions for this indicator.
Attractive regions of high ecological values and st rong territorial capital
The desired thresholds for all four indicators under this objective can only be reached
for a small number of regions, although many regions are experiencing no or only
marginal impacts of climate change. As for PM10 pollutions , many regions in Europe
still have rather high concentrations, even though differences within a country are
rather low. In case of Ozone concentration the analysis revealed that the number of
days with concentration exceedances is quite low for most European regions with
some exceptions, reflecting measures already implemented over the last decade for
improving the air quality; however, some countries like Italy, Romania or Bulgaria still
have to improve their air quality levels. Soil sealing illustrates the most
heterogeneous picture in Europe, with regions experiencing extremely high land take,

ESPON 2013 34
and other regions with very modest land take rates per capita. Territorial disparities
are extremely high within the countries, as well as between them, which leads to a
spatial pattern more diverse than for the other three indicators
So from a territorial cohesion perspective, the indicator on ozone concentration already presents the smallest spatial disparities, followed by PM10 and potential
vulnerability to climate change, while soil sealing still yield very high disparities.
Integrated polycentric territorial development
There are significant disparities still existing for all four indicators under this objective.
The indicator population potential clearly highlights the main dichotomy between
the European core area (‘blue banana’) and the peripheral ones. In areas outside the
European core area only selected urban regions show above-average population
potentials, while the other regions perform significantly below European average. A
change in these patterns is unlikely to occur in the short run, even though some of
the peripheral regions, such as regions in Spain, Greece or Ireland, experienced
considerable population gains through migration processes. But since the main
economic centres in Europe also experiences positive net migrations , it is rather
unlikely that areas outside the blue banana can significantly catch up. Nevertheless,
the net migration patterns again highlight the tremendous negative population trends
in the new Member States, in the Nordic countries, in Eastern Germany and Northern
France, which need to be paid attention by policy makers.
Smaller countries like the Baltic States, Slovakia, or Slovenia already engaged over
proportionally in international cooperation projects – by that trying to gain (or at
least keep) knowledge in the countries as an instrument counteracting even further
negative demographic trends.
At level of the territorial objectives, convergence trends over the past decade were
strongest for the objective of “Strong local economies ensuring global competitiveness” ; however, disparities are still medium and high. Indicators for
measuring “innovative territories” perform heterogeneously, with tertiary education
showing convergence trend, while for employment disparities even increased.
Indicators under the objective “Fair access to services, market and job” still show
the highest existing disparities over all indicators; insofar there is no fair access to
markets for all people in Europe. Only accessibility potential by road and air indicator
slight trends towards cohesion, while for the accessibility potential by rail in contrary
existing gaps seem to become permanent. Indicators on “Inclusion and quality of life” yield the smallest existing disparities for demographic aspects (gender
imbalance, ageing ratio, life expectancy) , but these small differences are stable over
time. For the other more socio-economic indicators; disparities are medium to very
high (for the difference in female-male unemployment rates), with generally clear
trends towards cohesion. Existing disparities for all indicators under the last two
objectives, i.e. “Attractive regions of high ecological values and s trong

ESPON 2013 35
territorial capital” and “Integrated polycentric territorial development” are
significant (medium, high and very high); due to a lack of data, time series analyses
could not be generated for these two objectives.
From a methodological point of view, the developed analytical framework (Chapter
B.2.3.) proofed to be applicable and successful in revealing the existing spatial
disparities and territorial cohesion trends in Europe. The combined approach of state
analysis (i.e. existing disparities) and trend analysis (i.e. cohesion as a process)
should be followed in future studies on territorial cohesion. Also the further regional
differentiation into urban, intermediate and rural regions was promising since for
some indicators this distinct approach uncovered interesting heterogeneous
developments. The successful analytical framework poses additional pressure on the
question of data availability (see wishlist, Chapter B.4.1.). Unfortunately, the trend
analysis could not be performed for all selected indicators due to a lack of data; also,
the differentiation by type of regions could only be done for indicators available at
NUTS 3 level. Thus, from the point of view of considering ESPON as a spatial
observatory, there is demand to collect data at NUTS 3 level and as time series. So
far both requirements cannot be met for all selected indicators. Insofar the developed
analytical framework can only provide first ideas of what could be done if all
indicators would be available at NUTS 3 level and for several points in time.
Data availability, disparities and general trends in convergence for each indicator
grouped by territorial objective are synthesised inTable 7:

ESPON 2013 36
Indicator Spatial resolution Years available
Disparities (1)
Trend (2)
Strong local economies ensuring global competitiveness
GDP per capita in PPS NUTS 3 1997-2008 high
Unemployment rate NUTS 3 1999-2009 high
Old age dependency ratio NUTS 3 2000-2010 medium
Labour productivity in industry and services
NUTS 2 2007 n.a. n.a.
Labour productivity per person employed
NUTS 0 1995-2010 medium
Innovative territories
Population aged 25-64 with tertiary education
NUTS 2 2008-2010 medium
Intramural expenditures on R&D
NUTS 2 2007 high n.a.
Employment rate 20-64 NUTS 2 1999-2009 small
Fair access to services, market and jobs
Access to compulsory school
NUTS 0, degree of
urbanisation
2008 very high n.a.
Access to hospitals NUTS 0, degree of
urbanisation
2008 very high n.a.
Accessibility of grocery
services
NUTS 0, degree of
urbanisation
2007 very high n.a.
Access to university (SILC data) 2007 n.a.
Accessibility potential by road
NUTS 3 2001, 2006 very high
Accessibility potential by rail NUTS 3 2001, 2006 very high
Accessibility potential by air NUTS 3 2001, 2006 high
1: Disparities: StDev / Avg = 0-0.2 small disparities; 0.2-0.4 medium disparities; 0.4-0.6 high disparities; >0.6 very
high disparities
2 : Trends towards cohesion: strong trend towards cohesion ,
trend towards cohesion , disparities remained stable , widening gaps
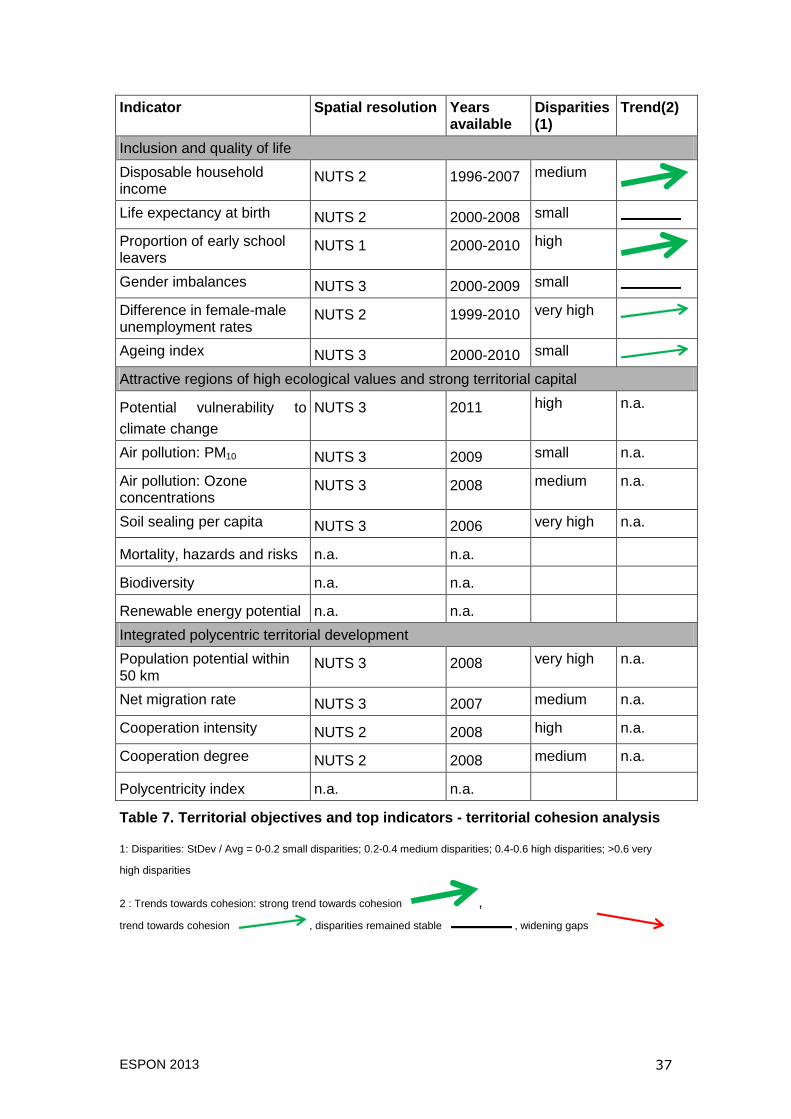
ESPON 2013 37
Indicator Spatial resolution Years available
Disparities (1)
Trend (2)
Inclusion and quality of life
Disposable household income
NUTS 2 1996-2007 medium
Life expectancy at birth NUTS 2 2000-2008 small
Proportion of early school leavers
NUTS 1 2000-2010 high
Gender imbalances NUTS 3 2000-2009 small
Difference in female-male unemployment rates
NUTS 2 1999-2010 very high
Ageing index NUTS 3 2000-2010 small
Attractive regions of high ecological values and strong territorial capital
Potential vulnerability to
climate change
NUTS 3 2011 high n.a.
Air pollution: PM10 NUTS 3 2009 small n.a.
Air pollution: Ozone concentrations
NUTS 3 2008 medium n.a.
Soil sealing per capita NUTS 3 2006 very high n.a.
Mortality, hazards and risks n.a. n.a.
Biodiversity n.a. n.a.
Renewable energy potential n.a. n.a.
Integrated polycentric territorial development
Population potential within 50 km
NUTS 3 2008 very high n.a.
Net migration rate NUTS 3 2007 medium n.a.
Cooperation intensity NUTS 2 2008 high n.a.
Cooperation degree NUTS 2 2008 medium n.a.
Polycentricity index n.a. n.a.
Table 7. Territorial objectives and top indicators - territorial cohesion analysis
1: Disparities: StDev / Avg = 0-0.2 small disparities; 0.2-0.4 medium disparities; 0.4-0.6 high disparities; >0.6 very
high disparities
2 : Trends towards cohesion: strong trend towards cohesion ,
trend towards cohesion , disparities remained stable , widening gaps

ESPON 2013 38
B.2.5. Other scales
Territorial cohesion: extension to Global Level
The inclusion of the global scale is made to enhance our understanding of the
processes occurring within Europe by framing them in broader, global perspective.
An important aspect when approaching territorial cohesion at several scales is the
element of ‘multiscalarity’ which refers to the fact that the degree of cohesion can
fluctuate according to the scale it is applied. Spatial disparities at for example the
national level may be masked if the analysis is up-scaled to the EU or global level or
down-scaled to regional or local levels (Davoudi, 2007). Another example is
presented by Schön (Schön, 2005) when referring to socio-economic developments
in which cohesion between the EU Member States increases while disparities
between regions are constantly growing. The multiscalar dimension of territorial
cohesion is already present when looking at territorial development policies: the
quest for territorial cohesion is framed between the inter-national (e.g. with policy
initiatives taken by the EU or the World Bank) and the multi-national (e.g. with similar
policy initiatives taken within many countries across the world). In his seminal work
on globalisation, Taylor, which suggests adopting a three scale approach (urban,
nation, global) to human geography, takes the angle of the global as ‘the scale of
reality’, which derives from a materialist position centred on the world economy. He
also claims that the global is the ‘ultimate scale’, the one that ‘really matters’ (Taylor,
1982).
In general many of the INTERCO indicators for territorial cohesion are also relevant
for understanding patterns of development at global level, even if the global
indicators are only available world-wide at NUTS0 level (see Annex 4 "INTERCO Indicators at Global Level"). All of the indicators within the set of strong local economies ensuring global competitiveness are available globally, although there
are some important substitutions and proxies used, i.e. both the World Development
Index and the Human Development Index no longer define wealth in terms of GDP
per capita in PPP; rather, both of these indices have gone over to GNI per capita in PPP. The indicators for innovative territories and inclusion and quality of life are
also highly relevant and mainly available in some form at the global level. However,
most of the indicators that have more uniquely European territory characteristics, such as the accessibility indicators in the category fair access to services, markets and jobs concerning accessibility to services and potential accessibility by road, rail
and air are not directly available at global level. Rather there are related indicators for
travel time to major cities. This does not mean that they are not relevant outside of
Europe, but rather that they are measured in different forms than accessibility by
territory, such as per capita within a larger spatial setting such as the entire country. Likewise, the indicators for attractive ecological regions , while highly relevant in a
global setting, are generally systematically captured in other ways outside of the
industrialised countries. The indicators measuring number and density of cooperation projects under the objective integrated polycentric territorial development have
ESPON 2013 39
no direct equivalents at the global level. As well, the indicator “population potential
within 50 km” has no real equivalent at global level, population density rather stands
to some degree in for this.
Comparing the INTERCO indicators for territorial cohesion in Europe clearly shows
the added dimension that territoriality plays in territorial cohesion compared to social
and economic cohesion, which are more easily understood at the non-
European/global level. While Europe is surely a forerunner in advocating and
developing territorial cohesion indicators at sub-national scale, there may be
opportunities to ‘export’ the territorial cohesion concept and policy goal to other parts
of the world.
Territorial cohesion: extension to Local Level
For the local level of INTERCO, the main aim was to enable the characterisation of
local situations by conducting an evaluation of the indicators defined in the
framework of the project, testing them through case studies at LAU level. The
implementation of the case studies has taken the form of ‘zoomed-in’ analysis
employing an analysis of disparities within a NUTS 2 or 3 region(s) in a selection of countries. So, the objective of the case studies (see Annex 5, Annex 6 and Annex
7) was to locally explore the indicators defined in the framework of the project as a
way to characterise local situations.
From this scope, it has been required at first to assess the availability of data at
LAU levels for an appropriate set of limited in number indicators, i.e. the headline
indicators defined at the project level. It has been shown that data availability of
indicators at LAU level is much poorer compared to other scales, concerning diversity
of data sources, differences in time periods measured, incomplete data, etc.
The few indicators for which there was data available were defined as those feasible indicators (in the sub-categories of population, employment and education) and
were then calculated for the specific case studies.
The analysis of the feasible indicators has shown that higher spatial inequalities exist
when going beyond the traditional NUTS 3 level of study. As it has been observed in
the specific case studies, territories which seem to have certain level of spatial
disparities in the traditional NUTS 3 level of analysis register other degrees of
disparities/inequalities at a local level.
It has been shown that this concerns at first the diverse settlement patterns and,
more in general, the different types of the ESPON urban-rural typology. Also, it has
been observed that even when NUTS 3 indicators data are compared to those at
NUTS 2 level, new differences emerge regarding the types of other ESPON territorial
typologies, i.e. regarding the metropolitan, the mountainous, the island, the coastal
and the industrial decline typologies. Among others, as a first illustration, the local
level analysis enabled us to identify that weak performing local areas are not
restricted to peripheral or rural sparsely populated areas but low performing local
examples are also found in central regions around major urban centres (i.e. Öresund

ESPON 2013 40
region: along the Öresund Strait in the hinterlands of Copenhagen, Malmö-Lund or
Helsingborg). Sometimes these areas are called “inner peripheries”. As another
illustration, the local level analysis in Thessalia has shown that important disparities
among diverse types of mountainous, island and coastal areas emerge –which was
not perceptible at NUTS 3 level. See Annex 5, Annex 6 and Annex 7 for the complete
case studies.
In a more general way, it was observed through the analyses at LAU level of the
case studies that important new insights can be brought regarding TC patterns at
NUTS 3 level as well as differences between regions at this scale.
Additionally to this it was of interest to identify indicators available in the local case
studies that do not exist at the EU regional level but that might be of interest for the
other levels in the framework of territorial cohesion. That is geographically specific
local indicators as examples to support the fact that local areas do possess a
diversity of local specificities. However examples as such were also difficult to find.
Summarising, the work on case studies at LAU level has proven the existence of
another territorial layer/level of study additional (and complementary) to the
traditional NUTS 2-3 scales, where more complex territorial patterns exist but are
imperceptible in the traditional way of displaying indicators on the basis of the
’regional’ scales. Further on, the case studies have shown that the local level could
enhance the dialogue between different scales that increasingly overlap temporally
and spatially; it could serve as a complement to other scales, as a contributor to
decipher the complexity of territorial cohesion.
Western Balkans and Turkey
We have started from the general hypothesis that there is a TC pattern (a substantial
degree of homogeneity) for the Candidate Countries and Potential Candidate
Countries (CC/PCC) which differs clearly from that for the entire EU. Specifically,
EU27 could be divided into three or four distinct territorial parts (depending on the
hypotheses and the methods used) on the basis of clearly different levels of
competitiveness, for instance: higher, moderate and lower levels of competitiveness.
The literature approach of the economic performance features of the CC/PCC
provided us arguments on the existence of a TC pattern for the entire territory of
CC/PCC (total of the countries) which is similar to the EU east one but clearly less
performing compared to the latter.
Further on, the specific analysis of the different TC dimensions on the basis of
indicators at country level, have consolidated the above literature results, as for the
majority of the TC dimensions.
Inside the total area of the CC/PCC, TC inequalities per country are pronounced.
Regarding mainly competitiveness, Croatia (HR) and Turkey (TR), which are
candidates to join EU, are equally performing with the two “weaker” EU east
countries: Romania and Bulgaria. Montenegro (ME) and Serbia (RS) perform less in
economy than HR and TR and present also similar values regarding indicators of

ESPON 2013 41
several other TC dimensions. FYROM (MK), Bosnia (BA), Albania (AL) and Kosovo
(XK) are even less developed and present a relative homogeneity regarding several
TC dimensions.
Regarding the sub-national level , the CC: HR, ME, MK and TR produce already
data which are in line with the specifications of Eurostat. In opposition, there is lack of
respective data for the PCC. Therefore, these countries should gradually be in line
with Eurostat specifications (including NUTS division) concerning an important
number of themes interesting TC. They should produce data corresponding by first
priority to the final and by second priority to the headline and core indicators of
INTERCO.
In this frame, the results at sub-national level are relatively poor for the entire
CC/PCC area.
The conceptual and technical/statistical analyses on the basis of the final and
headline/core indicators of INTERCO constitute also a test of both the selection of
the final and headline/core indicators and the methods to use these indicators in
order to approach territorial challenges and TC policy priorities. Because of the lack of data for the PCC, the results of this test were satisfactory for the most regarding
the country level and satisfactory at a medium degree for the sub-national level which
constitute a more crucial component of the territorial aspect of cohesion. However,
interesting answers for the actual territorial challenges and the implementation of TC
policy priorities were given; these answers go to some extent beyond the answers
given by the existing literature which has not exploit enough systematically the TC
indicators. Furthermore, more general deficiencies in the exploitation of TC indicators
analysis regard also the study of the CC/PCC area. We do not know the impact of
each indicator ‘translating’ a specific aspect of each TC dimension on this dimension.
Further on, we do not know the weight of each TC dimension to the TC seen globally.
Finally, the analysis, using several types of statistics of variation (min/max, mean,
standard deviation and coefficient of variation) at NUTS 3 level of the CC/PCC has
shown larger gaps between NUTS 3 units than those detected at country (NUTS 0)
level, as all the ranges of results at NUTS 3 level for all of the indicators used were
larger than the ones registered by country figures. The coefficients of variation (which
are the more appropriate statistic for this issue) are clearly higher at NUTS 3 level,
implying therefore a broader level of complexity of the indicators at this level. These
results are very similar with those found for the local case studies which enables us
to consolidate the conclusion that analyses at a higher than the NUTS 3 level could
not bring ‘really territorial’ results regarding cohesion.
B.2.6. GIS database / GIS tools
The INTERCO project developed a set of tools and the INTERCO GIS database to
support work with the territorial cohesion indicators. The INTERCO database as well
as the tools are provided on CD-ROM/DVD, which accompanies the Final Report
(see Annex 9).

ESPON 2013 42
The database itself, as well as all tools, require the use of ESRI´s ArcGIS software
with versions 9.3 or 10.x.
Apart from the GIS database, the CD-ROM/DVD includes the following support tools:
Scripts
Supporting scripts that help generating the territorial cohesion indicators, or help
processing the input data to illustrate the final selected indicators. Scripts are written
in Python, VBA or AML programming languages, or are developed by using the
Model Builder in ArcGIS. Scripts are not generated for all indicators but only for those
where needed.
Maps
All territorial cohesion indicators mapped in the Final Report are available as stand-
alone maps in PNG raster file format or in Adobe Illustrator (AI) vector graphics
format for immediate view and processing in other software environments. Maps in
PNG or AI format can also be used by non-GIS users who can import the maps into
reports or presentations without the need to use ArcGIS.
Layer files
Layer files are produced, which are referenced in the ArcMap map templates, and
which provide the symbology of map features. Layer files store only symbology of a
layer, but not the geometries.
Excel files
All input data for the indicator calculation, as well as all indicator outputs, are
provided as Excel files, in addition to the ArcGIS geodatabase. By that, non-GIS
users can work with the data or indicators without the need to use a GIS. The Excel
files are provided in standard ESPON Excel file format, including metadata
documentation.
Documentation
A metadata documentation (see an overview in Annex 10) as well as the user
manual for the INTERCO geodatabase and all the GIS tools are provided.
Cartography
All MXD files necessary to produce the indicator maps are provided. The MXD files
can be used to re-produce the indicators, change individual maps, or to export the
maps in different raster or vector graphic formats. The MXD files were created by
using ArcGIS version 10.
Section C.5. "GIS Data & Tools" provides detailed descriptions on the GIS tools
developed.

ESPON 2013 43
B.3. Links to other ESPON projects
The INTERCO project has integrated a lot of material produced by other ESPON
projects during all phases of the project, from the first compilation of indicators to the
implementation of those finally selected. The other ESPON projects, either from the
2006 or 2013 Programme, were used in different ways. Sometimes we took simply
data and indicators, sometimes the whole report was a great basis for understanding
a particular facet of territorial cohesion or the method to calculate indicators. In the
Inception Report we provided a review of ESPON projects used for the inventory of
indicators (Inception Report, Annex 1). Nevertheless we did not include all of them
again in this Final Report, since most of the indicators were integrated in the ESPON
Database, from where we took also many elements.
The table below summarises what we took from other projects and how the material
was used in INTERCO.
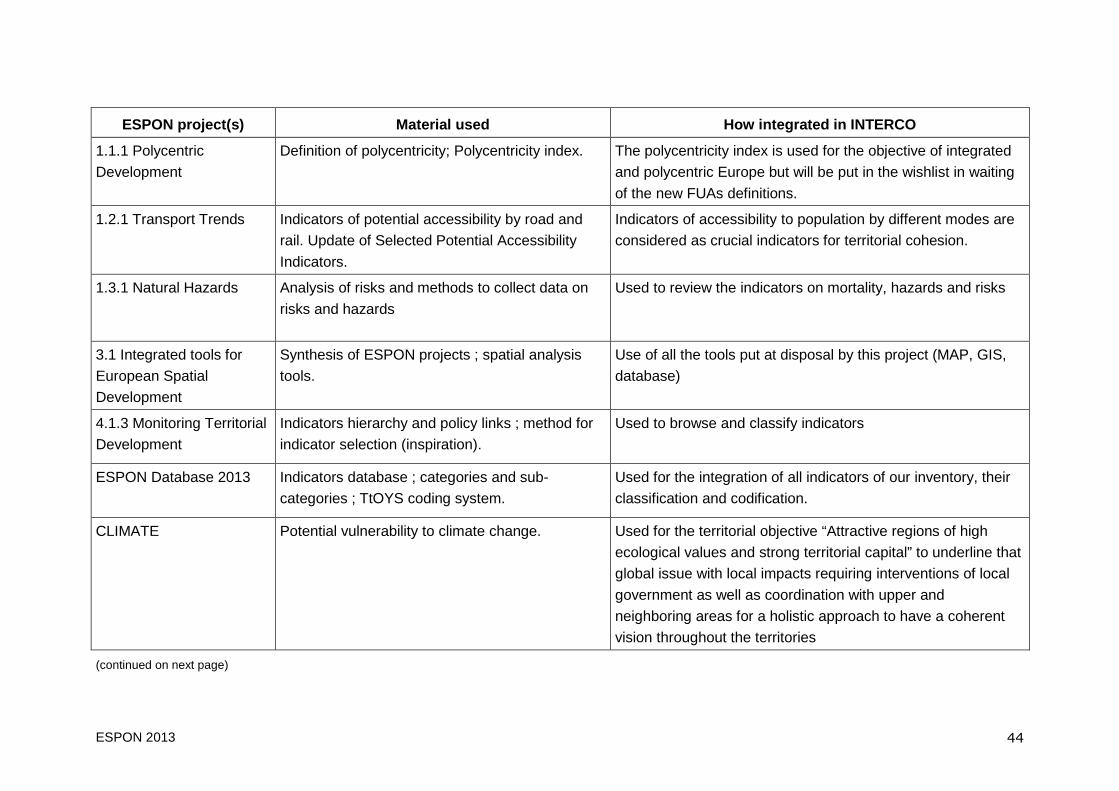
ESPON 2013 44
ESPON project(s) Material used How integrated in IN TERCO
1.1.1 Polycentric
Development
Definition of polycentricity; Polycentricity index.
The polycentricity index is used for the objective of integrated
and polycentric Europe but will be put in the wishlist in waiting
of the new FUAs definitions.
1.2.1 Transport Trends Indicators of potential accessibility by road and
rail. Update of Selected Potential Accessibility
Indicators.
Indicators of accessibility to population by different modes are
considered as crucial indicators for territorial cohesion.
1.3.1 Natural Hazards Analysis of risks and methods to collect data on
risks and hazards
Used to review the indicators on mortality, hazards and risks
3.1 Integrated tools for
European Spatial
Development
Synthesis of ESPON projects ; spatial analysis
tools.
Use of all the tools put at disposal by this project (MAP, GIS,
database)
4.1.3 Monitoring Territorial
Development
Indicators hierarchy and policy links ; method for
indicator selection (inspiration).
Used to browse and classify indicators
ESPON Database 2013 Indicators database ; categories and sub-
categories ; TtOYS coding system.
Used for the integration of all indicators of our inventory, their
classification and codification.
CLIMATE
Potential vulnerability to climate change. Used for the territorial objective “Attractive regions of high
ecological values and strong territorial capital” to underline that
global issue with local impacts requiring interventions of local
government as well as coordination with upper and
neighboring areas for a holistic approach to have a coherent
vision throughout the territories
(continued on next page)
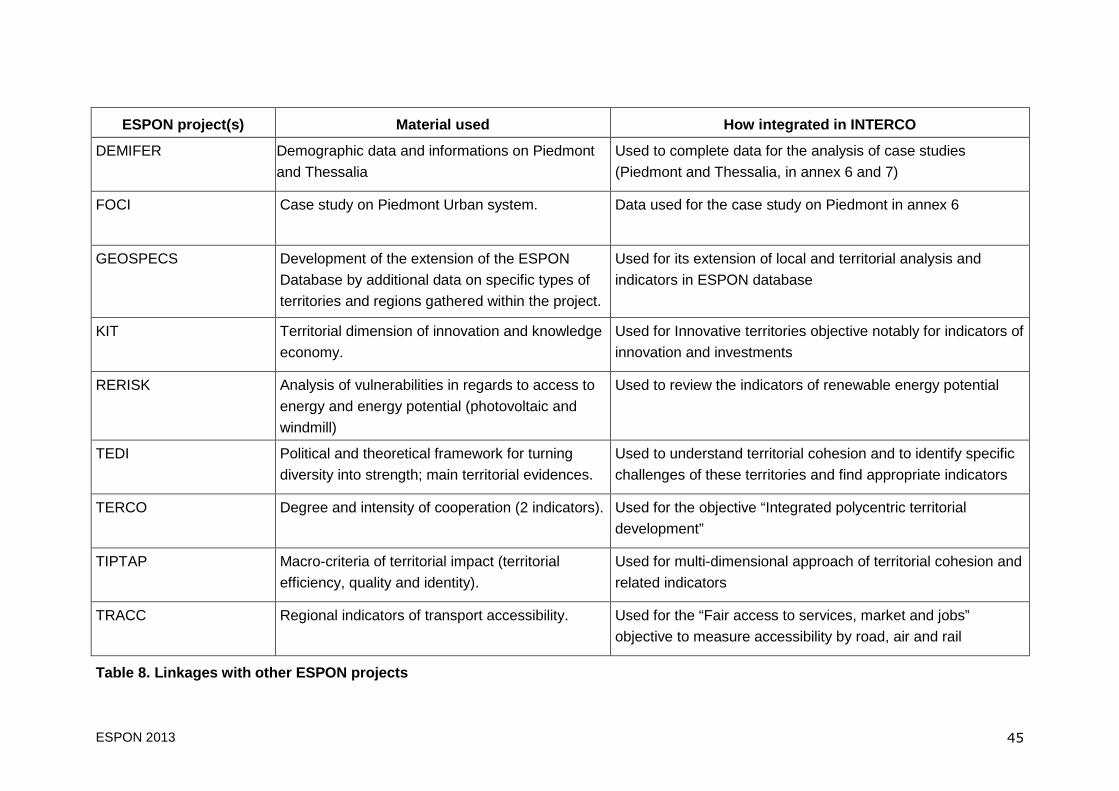
ESPON 2013 45
ESPON project(s) Material used How integrated in IN TERCO
DEMIFER Demographic data and informations on Piedmont
and Thessalia
Used to complete data for the analysis of case studies
(Piedmont and Thessalia, in annex 6 and 7)
FOCI Case study on Piedmont Urban system. Data used for the case study on Piedmont in annex 6
GEOSPECS Development of the extension of the ESPON
Database by additional data on specific types of
territories and regions gathered within the project.
Used for its extension of local and territorial analysis and
indicators in ESPON database
KIT Territorial dimension of innovation and knowledge
economy.
Used for Innovative territories objective notably for indicators of
innovation and investments
RERISK Analysis of vulnerabilities in regards to access to
energy and energy potential (photovoltaic and
windmill)
Used to review the indicators of renewable energy potential
TEDI Political and theoretical framework for turning
diversity into strength; main territorial evidences.
Used to understand territorial cohesion and to identify specific
challenges of these territories and find appropriate indicators
TERCO Degree and intensity of cooperation (2 indicators). Used for the objective “Integrated polycentric territorial
development”
TIPTAP Macro-criteria of territorial impact (territorial
efficiency, quality and identity).
Used for multi-dimensional approach of territorial cohesion and
related indicators
TRACC Regional indicators of transport accessibility.
Used for the “Fair access to services, market and jobs”
objective to measure accessibility by road, air and rail
Table 8. Linkages with other ESPON projects

ESPON 2013 46
B.4. Further work and research
B.4.1. Wishlist
Indicator of biodiversity
As for today, a wealth of biodiversity data have been collected at the global scale
(see e.g. the Global Biodiversity Information Facility (GBIF) or the UNEP World
Conservation Monitoring Centre (UNEP-WCMC)), but they are very much linked to
national levels. When talking about the different databases that exist we can note
that they are either on very specific issues (protection sites, habitats or species) or
covering country wide areas. Some countries have better data at a more practical
level for our use; unfortunately they are only few of them. Some indicators can be
desegregated to be used at sub-national levels but not enough of them to cover all
ESPON territories and be significant for territorial cohesion.
The closest database we could be using for European data is Natura2000. This
database represents well the difficulty we face to measure biodiversity. First of all, it
has be done only for one year, and not all regions or countries will update the data.
Therefore we do not have time series about it. The second challenge lies in regards
to the biodiversity data themselves. Natura 2000 is a descriptive database
representing endangered species and protected areas, hence only indirectly
measuring the quality of biodiversity. Though we can assert that protected areas are
designated so because they are of some value, it does not represent the level of
biodiversity in a given territory.
Actually, such an indicator should be built in a composite way, in order to be able to
represent if territories are very biodiversitied or not. That also leads to have
agreement on what is taken into account when talking about biodiversity: state and
evolution of biological diversity (biomes, habitats and ecosystems, trends in
abundance and distribution of species, coverage of protected areas, change in status
of threatened species, trends in genetic diversity); the sustainable use of resources
(sustainable management in protected areas, proportion of products issued from
sustainable resources, ecological footprint); integrity of ecosystems and ecosystems
goods and services (quality of water connectivity/fragmentation of ecosystems,
health and well-being of communities, biodiversity for food and medicine, trophic
integrity of ecosystems); status of traditional knowledge, innovations and practices;
status of access and benefit sharing; status of resources transfers.
If those indicators exists for some countries and can even be disaggregated at sub-
national level, there are not available for every European territories, nor complete
through time series. Recommendations should be addressed to the European
Environment Agency (EEA) that a synthetic and updatable indicator on the quality of
biodiversity should be made available.
ESPON 2013 47
Indicator of renewable energy potential
The indicator of renewable energy potential is of first importance given the territorial
objectives for Europe and for the future shape of economic policy as well. We did not
select them for the actual final list of indicators because of the spatial level they are
collected at.
The energy efficiency indicator is only be available at national level and does not
reflect territorial real energy use as not enough countries distinguish the imported
products from consumption and production in national databases. Therefore it is a
very imprecise indicator of energy efficiency. As for the use of renewable energy,
data does only scarcely exist. However, we can access data for the production of
renewable energy. In the ReRisk project, it has been strongly stated that energy was
an issue for inequality among Europan territories, due to economic vulnerabilities,
region's dependance and social vulnerrability. This indicator is interesting but there
no time series yet to be able to analyse convergence or not. They notably provided
data at NUTS 2 on windmill potential and photovolataic production potential for
ESPON territories, but data only for 2010. We really hope that for this particular
territorial indicator, data collection will improve and will allow to have an indicator that
will be updated through time and will be available at more local levels.
Indicator on mortality, hazards and risks
The ESPON 1.3.1 produced a 2004-2005 risk assessment based on a delphi method
for identifying and weighting hazards and vulnerability factors. For a convergence
analysis as envisaged by INTERCO, data with higher temporal and spatial exist.
The most recent and global analysis of risk from natural hazards is the "Global
Assessment Report on Disaster Risk Reduction 2011" by the UN International
Strategy for Disaster Reduction (ISDR)5. This report provides an in-depth analysis of
risk states and trends using global and local datasets.
The report applies a theoretical and stastical framework that distinguishes exposure,
vulnerability and risk for both human and economic elements at risk. In the context of
INTERCO exposure (number of persons or economic values exposed) and risk
(expressed in potential number of killed people and economic losses) would be of
high interest (Figure 7).
A webmapping interface (http://preview.grid.unep.ch/) allows the users to access
data on exposure, vulnerability and risk for several hazard types (cyclones, droughts,
earthquakes, floods, tsunamis, landslides, fires, volcanic eruptions).
The publicly available data is provided by country or as raster layers at a spatial
resolution of 1/12th of degrees (about 10km at the equator). In order to make these
datasets usable at NUTS 3 level, a feasibility study on the aggregation of data must
be done carefully : is the spatial resolution of the raster data sufficient for calculating
values (sums) by NUTS 3 units ? How to calculated a multi-hazard indicator? If risk
(expected human or economic losses) can be added, this might not be the case for
5 http://www.preventionweb.net/english/hyogo/gar/2011/

ESPON 2013 48
exposure data : been exposed to a flood has not the same consequences as if to a
cyclone, therefore exposures to different hazard types cannot be simply summed up.
Nevertheless, it is suggested that these freely accessible datasets are further
explored.
Figure 7. Mortality risk from tropical cylcones, fl oods and landslides
Indicators on access to services
Traditionally accessibility indicators were defined and calculated as potential
accessibility to population or to GDP. Recently, due to negative demographic trends
in large parts of Europe (outmigration, over aging), access to services and the
political issue of maintaining adequate levels of public service provision gained
increasing importance. European-wide accessibility indicators reflecting such
challenges properly, are, until today, only poorly available. Indicators on access to
several services from SILC survey provide aggregated data at national level (though
subdivided by degree of urbanisation), but conceptually these indicators represent
the personal perception rather than the actual de-facto accessibility pattern at a site.
ESPON TRACC already tries to overcome such deficits by calculating innovative
accessibility indicators to the following services (ESPON TRACC, Interim Report,
XIII; Spiekermann et al., 2011):
- Access to Health Care Facilities (Travel time to nearest hospital)
- Availability of secondary schools (Number of schools within 30 minutes travel
time)
- Potential accessibility to basic health care (Potential accessibility to general
practice surgeries)
As a preliminary example, Figure 8 maps the indicator on availability of secondary
schools in the Baltic Sea case study.

ESPON 2013 49
Figure 8. Raster indicator on availability of secon dary schools for Baltic Sea case study (tentative working map taken from ESPON TRACC project; input data still need to be finalized)

ESPON 2013 50
The approach is to calculate the road travel times from each raster cell or each
municipality (LAU 2) to the nearest facility of its kind; after that the travel times will be
aggregated (averaged) to NUTS 3 level. Unfortunately, due to the high data demand
and large computation times at raster level, ESPON TRACC calculates these
indicators not for the entire ESPON space but for seven case study regions only
(case studies regions are: Euram, Spain; Northern Italy; Bavaria, Germany; Czech
Republic; Poland; Baltic States; Finland).
Other studies for individual regions picked up the ESPON TRACC approach by
developing it further not only to calculate travel time indicators, but from there to
derive indicators of percentage of population living within a certain travel time to the
next facility. Such advanced indicator definitions even more respond to policy
questions. A recent study applying this kind of accessibility indicators, for instance,
was a study on mountain areas in southern Norway (Arnesen et al., 2010) conducted
for the Norwegian Ministry of Local Government and Regional Development. Here,
the percentage of population living within 30 minutes, 45 minutes and 60 minutes car
travel time to airports, hospitals, stations, and universities were calculated at LAU 2
basis, where the travel time itself were calculated at raster level, and grid population
data has been used as well (Figure 9 for the travel times; Figure 10 for the population
percentages).
Figure 9. Car travel times to next hospital in sout hern Norway: Raster (left), municipalities (right) (Arnesen et al., 2010, 61; 6 6)

ESPON 2013 51
Figure 10. Percentage of population within certain travel times to hospitals in Southern Norway: 30 min (top left), 45 minutes (top right), 60 minutes threshold (bottom) (Arnesen et al., 2010, 71)

ESPON 2013 52
Based upon these examples, the following recommendations for the ESPON programme in relation to indicators on access to services can be given:
- to extend the initial ESPON TRACC approach to entire ESPON space;
- to further develop the travel time indicators into policy-relevant indicators such
as percentage of population at LAU 2 level suffering from poor access to
individual public services;
- to support projects to calculate indicators below NUTS 3 level at LAU 2 or
raster level;
- to develop a standard grid (raster) system for the entire ESPON space which
allows calculation of such accessibility indicators; for example, an appropriate
raster resolution could be 2.5 x 2.5 km. The EEA population grid raster could
be taken as basis for such a raster system;
- to develop a rasterised population database for this raster system; and
- to launch projects that aim at establishing a GIS database for entire ESPON
space on public facilities that are deemed crucial for daily life, such as health
sector (hospitals, surgeries, pharmacies), education sector (primary schools,
secondary schools, universities), or transportation and logistics sector
(railway stations, airports, ports, transport terminals, freight villages).
Indicators on polycentricity
A first index of polycentricity was produced by Klaus Spiekermann and Michael
Wegener as part of the ESPON 1.1.1 project. Spiekermann and Wegener considered
European urban systems from three perspectives:
- Rank-size relationships, with one combined indicator based on two
measurements. First, a weak difference in population size between the two
most populated cities would indicate a higher degree of polycentricity, as
there would be two major nodes that would offset each other. Second, a rank-
size curve with a weak slope would indicate that there are limited contrasts
between main regional nodes and small and medium-sized towns.
- Geographical spread of towns and cities, measured by dividing the territory in
Thiessen polygons built around each of the 1595 Functional Urban Area
(FUA) centres the ESPON 1.1.1 project had identified in Europe. The Gini
coefficient of the areas of these polygons is considered to reflect the degree
to which cities are spread out on the territory. A low coefficient would indicate
an equal distribution, corresponding to a high degree of polycentricity.
- Levels of accessibility, considering that an urban system with limited
differences in this regard would be more polycentric. This index was based on
two measures: First, by calculating the Gini coefficients of levels of
accessibility of cities; second, by calculating the slope of the regression line
obtained when comparing accessibility levels and demographic mass.

ESPON 2013 53
Figure 11. Principle of measurement of polycentrici ty
This method was applied at the NUTS 0 and NUTS 1 levels. The responses were
mixed. On the one hand, the index based on rank-size relationships confirmed well-
known patterns, opposing typical monocentric countries such as Greece, Ireland,
Latvia and France and polycentric ones such as Germany, the Benelux coountries,
Poland and Slovakia. When considering the spread of cities and towns on the
territory, on the other hand, surprising results occurred as France appeared quite
polycentric, while Italy and the Netherlands where described as tending towards
monocentricity. Similar surprising outputs were obtained when one considered levels
of accessibility. The overall conclusion is that the measurement of polycentricity is
complex, as an urban system may be characterised by a number of factors of
polycentricity, e.g. regularly arranged cities, without necessarily functioning in a
polycentric way. Only comparisons of the population of cities seem to efficiently
reflect the polycentric or monocentric functioning of urban systems, as this is a
synthetic measure resulting from a wide range of social, economic and political
processes.
The ESPON 1.4.3 project therefore reverted to a measurement of polycentricity
focusing exclusively on population sizes. Their method is described in the following
way:
ESPON 2013 54
“Our index is computed on the basis of a simple and purely morphological
methodology (as approached by the proxies of population data). We have used the
cardinal ranking of the following indicators:
• Part of the main FUA in the total population of the country
• Part of the main FUA in the population of the whole set of FUAs with more
than 250 thousands inhab.
• Part of the main FUA in the population of the whole set of FUAs with more
than 50 thousands inhab.
• Standard deviation of the population of the FUAs with more than 50
thousands inhab.
• Average of the differences between the ranked populations of the FUAs until
the threshold of 50 thousands inhab.
The value of each of these five indicators has been distributed on a scale bounded
from 100 (the highest value for the indicator) and 0 (the lowest one). The arithmetic
average of these seven indicators gives the cardinal global index (Table 1). We
stress that we compute here (the proxy of) an exclusively morphological index of
polycentrism, and not a measure of functional polycentrism, decisional functions
appearing to be much more concentrated in most countries than the urban
populations.”
The ESPON 1.4.3 team also had to note that “the sole surprise arising from [the
resulting] ranking regarding a qualitative knowledge of the European urban patterns
is the position of Hungary, which appears a priori to be very monocentric due to the
weight of Budapest”. There is in other words not much added value to be gained from
measuring polycentricity.
However, the ESPON 1.1.1 project also produced an alternative measurement of
polycentricity, considering the number of cities and towns that could be reached
within a maximum generally accepted daily commuting distance of 45 minutes from
each European municipality. The underlying idea is that in areas with access to more
than one urban node, a certain degree of polycentric functioning may more easily
develop as cities compete to attract commuters and companies. This type of
approach focused on the territorial organisation of the smaller towns and cities, while
the previous measures mainly reflected patterns in the upper end of the urban
hierarchy.

ESPON 2013 55
Figure 12. Number of FUA centres accessible within a generally accepted maximum daily commuting time of 45 minutes
ESPON 2013 56
This latter type of measurement can be difficult to synthesise in the form of an index
at the NUTS 3 or NUTS 2 levels. Additionally, the ESPON FOCI and ESPON
Database have produced alternative delineations of Functional Urban Areas
rendering all the previously described measures obsolete.
It should also be noted that neither ESPON 1.1.1 nor ESPON 1.4.3 could identify a
significant relationship between measures of polycentricity and economic or
environmental performance, respectively measured through GDP and CO2 emissions
by unit of GDP. From this some of the authors concluded that the objective of
polycentric development formulated in European policy document was not
necessarily well-founded. However, one may also hypothesise that these forms of
quantifications of polycentricity did not reflect the political ambition of polycentricity in
an appropriate way. When analysing the discourse on polycentricity, one finds that
political stakeholders wish to promote the emergence of more nodes that are capable
or taking initiatives and stimulating development processes, and not necessarily
making urban centres more homogenous and more equally distributed6. It is not
within the scope of this project to produce alternative measurement that would reflect
the degree of achievement of these ambitions.
General wishes
As it can be seen from the general indicator overview (Annex 3), the statistical data
from Eurostat and from other organisations are, unfortunately, only available for
different spatial levels, such as NUTS 3, NUTS 2 or even NUTS 1.
Not only from the perspective of territorial cohesion, but also for general spatial
observatories, it would be needed to get all data at the finest spatial level, i.e. at
NUTS-3 level. Harmonised data availability at NUTS-3 level would:
- improve analyses of trends towards territorial cohesion;
- provide better options for correlations or other advanced statistical analyses.
Thus, recommendations should be addressed to all statistical offices in the EU
Member States and in ESPON space to collect the data only at NUTS 3.
B.4.2. Extended exploitation of the indicators
The main aim of INTERCO is to offer to stakeholders interested in EU TC an
appropriate tool allowing them to better approach actual weaknesses (and strengths)
of European territories in relation to the territorial objectives of the EU policies,
starting from the older priorities of the ESDP and focusing on the very recently
agreed priorities of the Territorial Agenda 2020 (in relation to the Europe 2020
priorities and targets).
From this scope, the creation of two sets of indicators restricted in number - “top”
indicators (Table 6) and headline/core indicators (Annex 2) well addressed to the
6 Gløersen, Erik (2012) La Finlande, la Norvège, la Suède face au projet d’une Europe polycentrique - La centralité à la marge de l’Europe, Rennes : Presses Universitaires de Rennes.

ESPON 2013 57
“territorial” aspects of the cohesion and covering TC through all territorial levels as
well as all the dimensions (facets) of the TC is undoubtedly of great importance.
Interested stakeholders could use indicators going beyond the national and “regional”
approach of the territories. They could use these sets of indicators as a sound basis
for the different kind tailor made analyses of the TC challenges, policy development
and policy impact studies.
Each stakeholder could use different methods of exploiting the INTERCO indicators
sets. Apart from the category of stakeholders that are familiar with the multitude of
methods of exploiting indicators in innovative research on TC, the majority of
stakeholders are interested to have in hand a collection of simpler methods
(recommendations, advices) on how to exploit TC indicators.
Ideas for potential extended uses of the INTERCO indicators are presented in the
Scientific Report, chapters "C.3.7. Further ideas for analyses" (page 123).
B.4.3. Communication plan
The ESPON INTERCO project has run in total six workshops targeting interested
stakeholders and the ESPON community. These workshops have been an important
working tools but also part of the project’s communication of this work and progress
made.
Through its participative approach the ESPON INTERCO project has created some
expectations towards the final results. Therefore it is envisaged to disseminate the
results as widely as possible as soon as the projects is finalised and the final report
has been approved.
In general three different target groups can interested in the results and therefore the
project has categorised its dissemination activities as to whether they target (a) other
ESPON projects, (b) policy oriented stakeholders, or (c) the wider scientific
community.

ESPON 2013 58
ES
PO
N
proj
ects
Pol
icy
stak
ehol
ders
Sci
entif
ic
Com
mun
ity
Dissemination activity X x x ESPON seminar in Aalborg (13-14 June 2012)
At the next ESPON seminar the lead partner of the ESPON INTERCO project will present the final results to the ESPON community, if ESPON so wants.
X x x Report on ESPON website The most important dissemination tool is the publication of the Final Report on the ESPON website, which makes the report available to a wider public.
X x x Indicator fact sheets Chapter C3 of the Final report is structured in that way, that it easily can be split into single indicator fact sheets. The TPG would like to encourage the ESPON CU to not only publish the report but also the single indicator fact sheets that can be extracted from this chapter.
x X x ESPON Map of the month To raise awareness about the results of the projects, the TPG would like to see one of the INTERCO maps as ESPON Map of the Month and would support the CU in the preparation of the necessary files.
X Update for workshop participants As soon as the Final Report has been approved, Spatial Foresight will inform the participants of the stakeholder workshops organised on 14.01.2011 and 20.10.2011 in Brussels.
x X x Nordregio News Once the Final Report has been approved, Nordregio envisages to inform about the results of the project in its Nordregio News.
X Website of the University of Geneva Once the Final Report has been approved, the University of Geneva will inform about the results of the project on its website.
X NTUA website Once the Final Report has been approved, NTUA will inform about the results of the project on its website.
x X Scientific papers Various members of the TPG have ambitious scientific aspirations and will use the ESPON INTERCO results for scientific papers and publications.
X University teaching Various TPG members are involved in university teaching about territorial development and will in this context also disseminate ESPON INTERCO results.
X = main target group x = additional target group

ESPON 2013 59
Conclusions
32 top indicators for 6 territorial priorities
After two years of research, the INTERCO project has selected 32 top-indicators
wich are structured along 6 territorial objectives. They aim at reflecting both the
thematic and policy dimensions of territorial cohesion (see chapter B.2.2.1. The list of indicators ).
The conduct of the project highlighted interesting challenges and difficulties to reach
its objectives, to develop indicators and indices that can be used to measure
territorial cohesion.
The main results show that there is no general trend towards convergence in all
ESPON territories. At level of the Territorial objectives, convergence trends over the
past decade were strongest for the objective of “Strong local economies ensuring global competitiveness” ; however, disparities are still medium and high. Indicators
for measuring “innovative territories” perform heterogeneously, with tertiary
education showing convergence trend, while for employment disparities even
increased. Indicators under the objective “Fair access to services, markets and job” still show the highest existing disparities over all indicators; insofar there is no
fair access to markets for all people in Europe. Only accessibility potential by road
and air indicator slight trends towards cohesion, while for the accessibility potential
by rail in contrary existing gaps seem to become permanent. Indicators on
“Inclusion and quality of life” yield the smallest existing disparities for
demographic aspects (gender imbalance, ageing ratio, life expectancy) , but these
small differences are stable over time. For the other more socio-economic indicators;
disparities are medium to very high (for the difference in female-male unemployment
rates), with generally clear trends towards cohesion. Existing disparities for all
indicators under the last two objectives, i.e. “Attractive regions of high ecological values and strong territorial capital” and “Integrated polycentric territorial development” are significant (medium, high and very high); due to a lack of data,
time series analyses could not be generated for these two objectives.
Recognising the complex and dynamic nature of terri torial cohesion
Territorial cohesion is a very rich concept, fostering a lot of theoretical reflexions
while in constant redefinition by the political framework. Indeed, its inherent
multidimensionality adds difficulties to the understanding of the concept of territorial
cohesion. Moreover, as shown by the current policy debates, it is also a moving
concept. The definition of territorial cohesion is very much linked to policy directives
and objectives that is why we cannot tackle ththeat subject without understanding
fully the different documents produced by European policies. Therefore, we sketched
the indicators out of the Territorial Agenda 2020 and Europe 2020 that guided us
through our discussions. The recurrent updates of the policy objectives and
documents had forced us to take a flexible attitude in the course of the project,

ESPON 2013 60
rendering the current results more in line with the future shape of Europe, but also
more adaptable if any changes should take place in the future as well.
The idea of a flexible and adaptable set of indicators must be considered as a
positive input for the users of ESPON Database. This implementation would need to
be achieved by clearly making the distinction between data - that can be organised
using a thematic thesaurus - and indicators that would be selected data linked to
specific facets of territorial cohesion (e.g. the territorial objectives identified by the
INTERCO project). Conversely, these territorial aspects - in our case, the territorial
objectives - should serve as entry points to the database. This type of well-thought,
policy-oriented entry points might be more understandable, relevant and usable than
thesaurus categories for any user interested in territorial cohesion.
Recognising the political and contradictory nature of territorial cohesion
Another benefit of the INTERCO project is its interaction and proximity with the actors
that are directly engaged in territorial cohesion. It appeared very soon that territorial
cohesion could embrace large and various definitions among our group of
researchers, but among policy makers as well. This not-so-easy-to-define concept
led to numerous discussions about the multiple dimensions to be considered. Our
objective was to build a few simple indicators, yet significantly covering a wide and
complex notion. Thus, a participative process - made of several workshops and
questionnaires - enabled the TPG to capture the concrete demands from policy
makers. However, the striking main result of these participative processes was to
underline the divergence of the requests of policy makers among themselves as well,
reflecting the ambiguous meaning of territorial cohesion and its related political
objectives. It was a real challenge for the TPG to respond to these demands in a
coherent manner. For instance, the minutes of the workshops revealed a clear
rejection, by the vast majority of the stakeholders, of composite indicators, when the
building of composite indicators was one of the primary requests of the call. The
differences of needs from local governements and systemic actors were also an
interesting challenge to answer.
Considering the changing and heterogeneous views on territorial cohesion, it would
be interesting to develop participatory tools (websites, electronic fora, etc.) through
which local people can develop their own definitions of territorial cohesion and their
own measures of it. Such approaches have been used, e.g. in developing
sustainability indicators in countries like USA and Canada.
Building on ESPON knowledge
An important part of the project was to build upon previous ESPON project. The
originality of such a project in this context is the possibility to access a large database
and to build upon previous results of researches conducted on the same subject or
close themes. For example, the research conducted by ESPON Climate or by
GEOSPECS, or KIT, ReRisk, gave us new and innovative data that could be added
to complement more classical indicators. In that sense, ESPON allows a fruitful

ESPON 2013 61
collaborative approach among its project teams, an approach that must be continued
in the future. For a project like INTERCO which is at the crossroad of all discussions
and practices in the European Union, it was very helpful to be able to rely on
numerous previous researches that a specialized institution like ESPON had helped
conducting.
Data gaps
However, despite this existence of this large database, we have to admit that our
research is not as complete as we would have liked it to be. The utter idealistic
indicators lists should have included a lot more data that would have allowed us to
compare and link better the indicators. Since the composite indicators were not
desired by the stakeholders, we had to find another way of managing linkage
between indicators. The research then led us to build sets of indicators. Though, the
current image of the 6 territorial objectives is not yet satisfactory as it is lacking some
very core indicators (4 out of the 32 top indicators had to be put a wishlist). For
instance in the 5th territorial objective (Attractive regions of high ecological values and
strong territorial capital) has actually only the pollution indicators and soil sealing per
capita, leaving territorial capital aside in the final results. Two objectives that are of
first importance for this territorial objective, as well as for the European policy, are the
biodiversity state and the progression of renewable energy production and
consumption. However, to be able to incorporate those indicators for territorial
purposes, they should exist for all territories and at regional (NUTS 3) if not at local
levels. As for today, the data were leaving too many gaps in terms of territory covers
as they are available only at national level and not for all countries yet. We could
have used national data that exists, but they were not satisfying in the analytical
framework we used. Moreover, when time series are not available, how could we
analyse convergence? It is therefore very difficult to draw conclusive lessons from
this set of territorial indicator. The same problem occurs for several other indicators
(see annex 3. Top indicators-data availability).
The official data collection is not yet fully adjusted to the newest political priorities and
we are strongly urging the data providers to make the missing data available for the
researchers and the policy-makers, if not for the general public. INTERCO
recommends to Eurostat and EU member countries to collect the respective data
regularly (time frequency to be defined) at least at NUTS 2 level, preferably at NUTS
3, otherwise by relevant territorial typologies (e.g. degrees of urbanisation,
urban/rural regional types, etc.). This should help reaching the political targets of the
latest development of the European cohesion strategy.
Policy indicators versus contextual indicators
We also had to deal with some more restrictive requests from practical policy
demands. Stakeholders often set the focus on indicators that would enable them to
measure the concrete results of their political actions, i.e. on subjects on which they
can have a direct influence.

ESPON 2013 62
For that reason, indicators such as on life expectancy were criticised because they
could not be linked to immediate actions or policies; even though a desired direction
of change was identified (life expectancy should in principle increase).
But more descriptive - contextual - indicators that are reflecting the complexity of the
various situations in Europe (e.g. population density) were also dismissed because
they could not be associated to a desirable direction of change, to a specific policy
objective.
Yet, the overall image of territorial cohesion would benefit from these contextual
indicators that could help interpreting the performances of territories in relation to
their specific conditions (demography, climate, remoteness, etc.). As a matter of fact,
it is difficult to focus only on policy indicators ignoring the general contextual factors
that are indirectly linked. The linkages between the contextual and policy-oriented
indicators in way that is meaningful for territorial cohesion, is a task that is conducted
in other ESPON project such as GEOSPECS. INTERCO had the mandate to provide
a European-wide picture of a territorial cohesion. Other projects can deepen the
INTERCO results by studying in more details the different preconditions for
development, as well as the particular contributions to the aims of Europe 2020 and
TA 2020 in the different types of areas.
Well-being as the ultimate impact of territorial co hesion
The focus on measuring concrete policy results, very useful for policy makers, must
be balanced by a reminder of what should be the ultimate goal of any policy action,
i.e. the well-being of the population. Well-being is another fuzzy concept difficult to
influence directly, but in our view it is clear that territorial cohesion, along with
sustainable development, should be considered as means for well-being and
progress. Therefore, indicators on territorial cohesion should also, if not primarily,
reflect on the impacts of European policies, which include the improvement and
reduction of disparities in well-being over time for all territories in Europe.
ESPON 2013
The ESPON 2013 Programme is part-financed by the European Regional Development Fund, the EU Member States and the Partner States Iceland, Liechtenstein, Norway and Switzerland. It shall support policy development in relation to the aim of territorial cohesion and a harmonious development of the European territory.
ISBN 978-2-919777-10-5


 XXX draft ANNEXES 1 to 21 ANNEXES to COMMISSION](https://static.fdocuments.us/doc/165x107/5b02708e7f8b9a84338f9f10/annexes-to-commission-delegated-ec-en-european-commission-brussels-xxx-2014.jpg)