Interbull Meeting – Dublin 2007 Genetic Parameters of Butter Hardness Estimated by Test-Day Model...
13
Interbull Meeting – Dublin 2007 Genetic Parameters of Butter Hardness Estimated by Test- Day Model Hélène Soyeurt 1,2 , F. Dehareng 3 , C. Bertozzi 4 & N. Gengler 1,5 1 Animal Science Unit, Gembloux Agricultural University, B-5030 Gembloux, Belgium 2 Fond pour la Recherche dans l’Industrie et l’Agriculture (F.R.I.A.), B-1000 Brussels, Belgium 3 Quality Department, Walloon Agricultural Research Centre, B-5030 Gembloux, Belgium 4 Research & Development Department, Walloon Breeders Association, B-5590 Ciney, Belgium 5 National Fund for Scientific Research (F.N.R.S.), B-1000 Brussels, Belgium
-
Upload
thomasine-wilcox -
Category
Documents
-
view
212 -
download
0
Transcript of Interbull Meeting – Dublin 2007 Genetic Parameters of Butter Hardness Estimated by Test-Day Model...
Interbull Meeting – Dublin 2007
Genetic Parameters of Butter Hardness Estimated by Test-Day Model
Hélène Soyeurt 1,2, F. Dehareng 3, C. Bertozzi 4 & N. Gengler 1,5
1 Animal Science Unit, Gembloux Agricultural University, B-5030 Gembloux, Belgium2Fond pour la Recherche dans l’Industrie et l’Agriculture (F.R.I.A.), B-1000 Brussels, Belgium
3 Quality Department, Walloon Agricultural Research Centre, B-5030 Gembloux, Belgium4 Research & Development Department, Walloon Breeders Association, B-5590 Ciney, Belgium
5 National Fund for Scientific Research (F.N.R.S.), B-1000 Brussels, Belgium
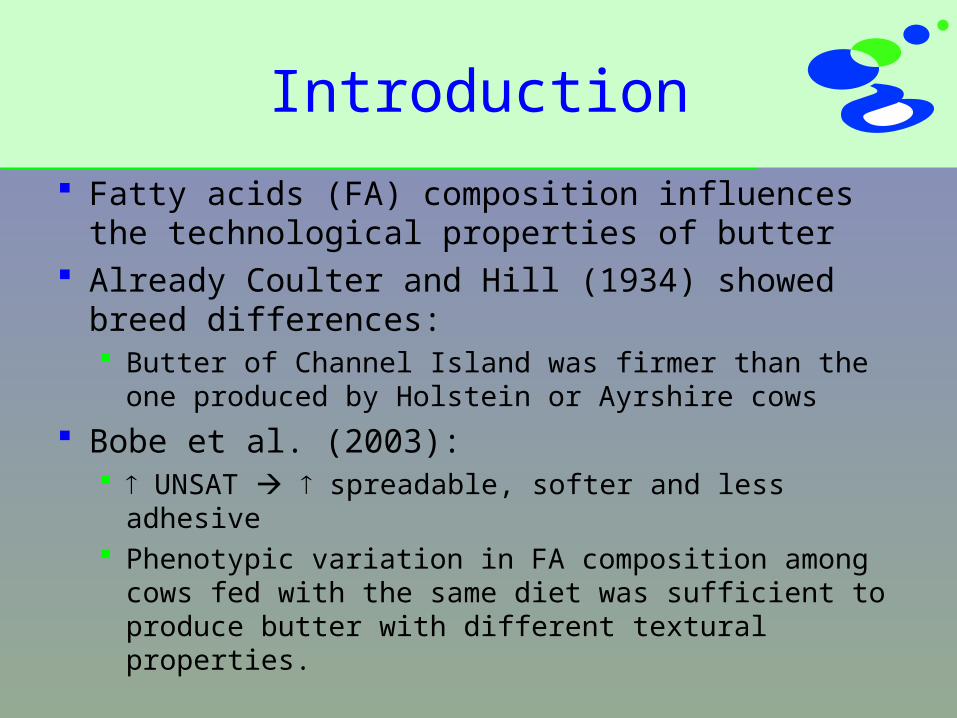
Introduction
Fatty acids (FA) composition influences the technological properties of butter
Already Coulter and Hill (1934) showed breed differences: Butter of Channel Island was firmer than the one
produced by Holstein or Ayrshire cows
Bobe et al. (2003): UNSAT spreadable, softer and less adhesive Phenotypic variation in FA composition among cows
fed with the same diet was sufficient to produce butter with different textural properties.
Objectives
Estimate the genetic parameters of the hardness of butter and
Estimate its correlations with milk yield, fat and protein contents using a multi-trait random regression test-day model.
Materials & Methods
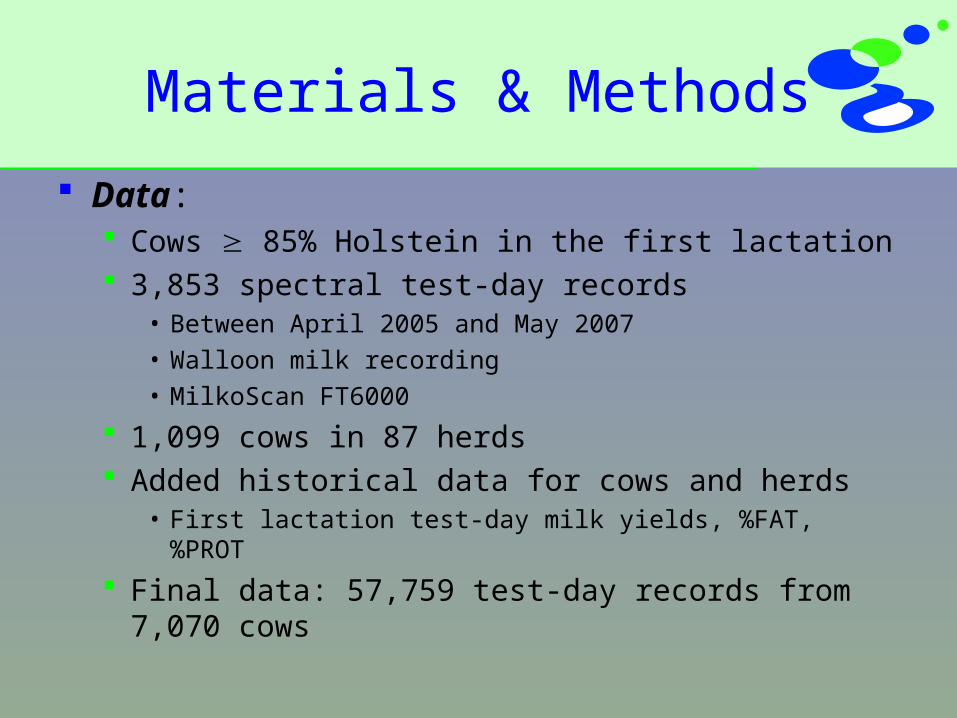
Data: Cows 85% Holstein in the first lactation 3,853 spectral test-day records
• Between April 2005 and May 2007• Walloon milk recording• MilkoScan FT6000
1,099 cows in 87 herds Added historical data for cows and herds
• First lactation test-day milk yields, %FAT, %PROT
Final data: 57,759 test-day records from 7,070 cows
Materials & Methods
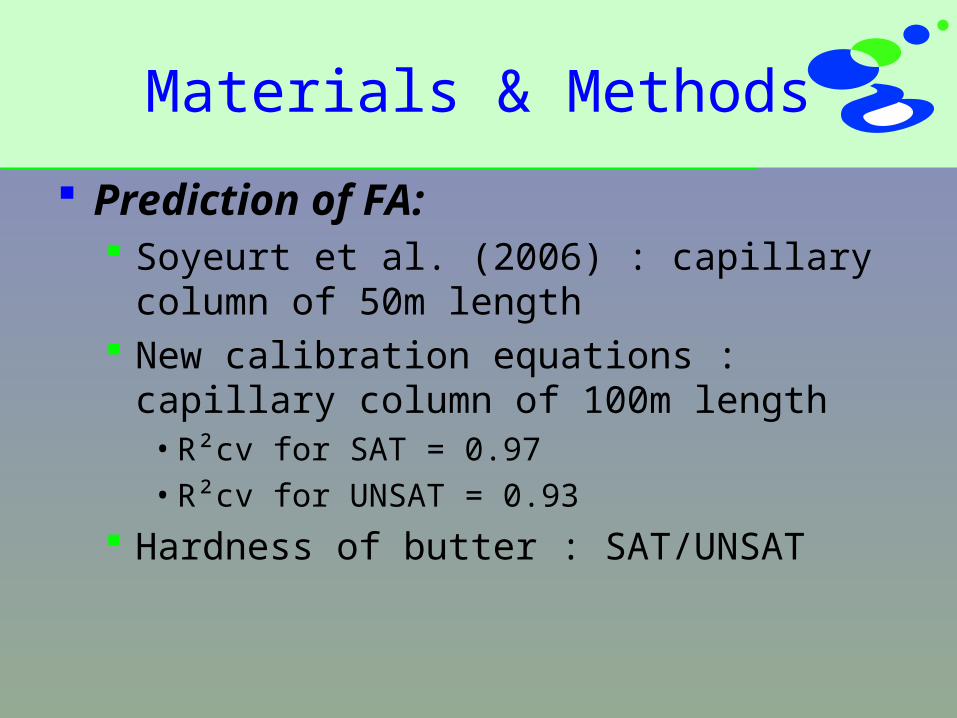
Prediction of FA: Soyeurt et al. (2006) : capillary column of 50m
length New calibration equations : capillary column
of 100m length• R²cv for SAT = 0.97• R²cv for UNSAT = 0.93
Hardness of butter : SAT/UNSAT
Materials & Methods
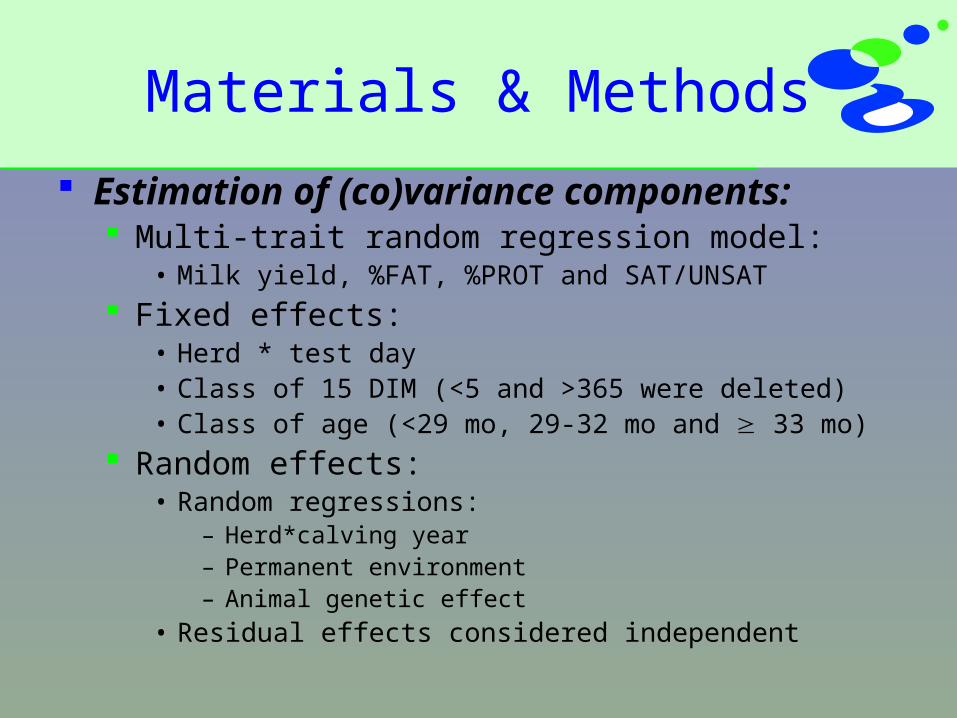
Estimation of (co)variance components: Multi-trait random regression model:
• Milk yield, %FAT, %PROT and SAT/UNSAT Fixed effects:
• Herd * test day• Class of 15 DIM (<5 and >365 were deleted)• Class of age (<29 mo, 29-32 mo and 33 mo)
Random effects: • Random regressions:
– Herd*calving year– Permanent environment– Animal genetic effect
• Residual effects considered independent
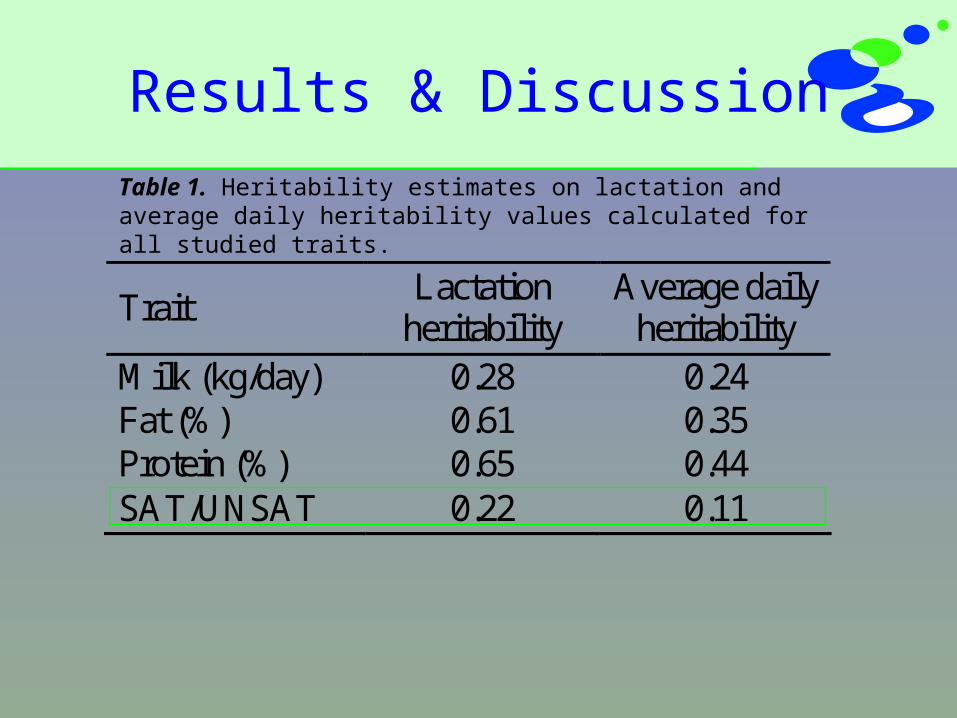
Trait Lactation
heritability Average daily
heritability Milk (kg/day) 0.28 0.24 Fat (%) 0.61 0.35 Protein (%) 0.65 0.44 SAT/UNSAT 0.22 0.11
Results & Discussion
Table 1. Heritability estimates on lactation and average daily heritability values calculated for all studied traits.
Results & Discussion
Trait Milk Fat Prot. S/U Milk (kg/day) -0.42 -0.65 0.05 Fat (%) -0.50 0.60 0.39 Protein (%) -0.42 0.56 0.28 SAT/UNSAT -0.71 0.87 0.58
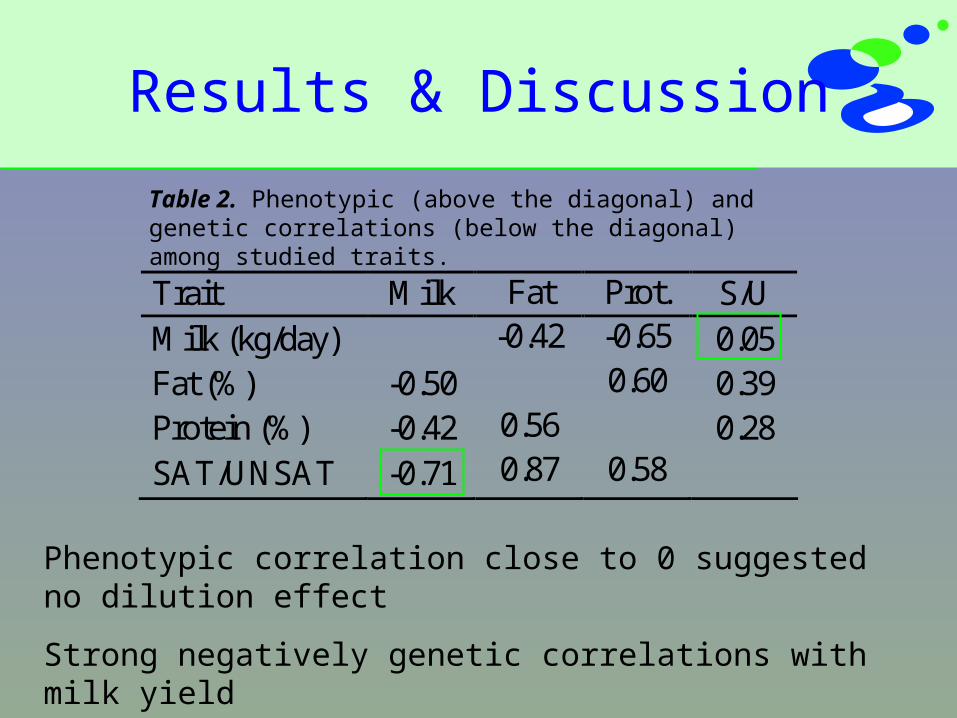
Table 2. Phenotypic (above the diagonal) and genetic correlations (below the diagonal) among studied traits.
Phenotypic correlation close to 0 suggested no dilution effect
Strong negatively genetic correlations with milk yield

Results & Discussion
Trait Milk Fat Prot. S/U Milk (kg/day) -0.42 -0.65 0.05 Fat (%) -0.50 0.60 0.39 Protein (%) -0.42 0.56 0.28 SAT/UNSAT -0.71 0.87 0.58
Table 2. Phenotypic (above the diagonal) and genetic correlations (below the diagonal) among studied traits.
Hardness of butter was affected by milk composition
Stronger link between %FAT and SAT/UNSAT

Results & Discussion
Figure 1. Phenotypic correlations among traits within DIM.
Milk – SAT/UNSAT
Linear increase
Dilution effect
%FAT – SAT/UNSAT
Strong link
Increased when %FAT decreased
%PROT-SAT/UNSAT
Stable-0.8
-0.6
-0.4
-0.2
0
0.2
0.4
0.6
0.8
1
5 30 55 80 105 130 155 180 205 230 255 280 305 330 355
Days in milk
Phenoty
pic
corr
ela
tions
ppp
Milk - SAT/UNSAT %Fat - SAT/UNSAT %Protein - SAT/UNSAT
Results & Discussion
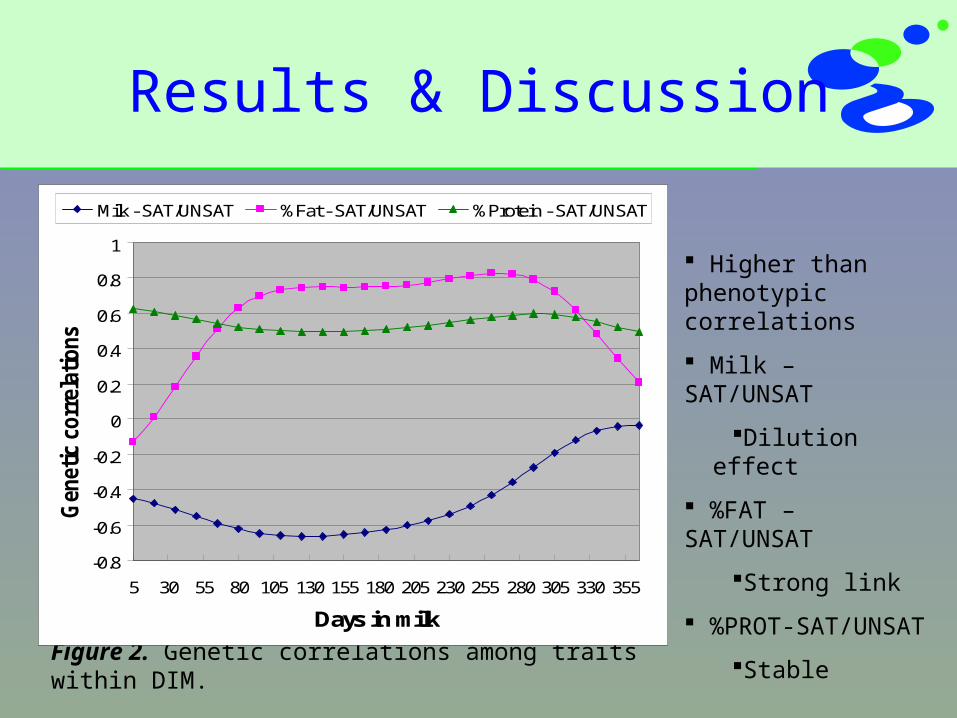
Figure 2. Genetic correlations among traits within DIM.
Higher than phenotypic correlations
Milk – SAT/UNSAT
Dilution effect
%FAT – SAT/UNSAT
Strong link
%PROT-SAT/UNSAT
Stable-0.8
-0.6
-0.4
-0.2
0
0.2
0.4
0.6
0.8
1
5 30 55 80 105 130 155 180 205 230 255 280 305 330 355
Days in milk
Gen
etic
corr
elat
ions
ppp
Milk - SAT/UNSAT %Fat - SAT/UNSAT %Protein - SAT/UNSAT
Conclusion & Perspectives
First results: Genetic variability of the hardness of butter
seemed to exist Affected by milk production Influenced by the variation of %FAT but less
by the variation of %PROT
Perspectives: From Sept. 2007, all spectra will be recorded In a few years, more data will be available for
modeling and potential genetic evaluations
Thank you for your attention
Acknowledgement :
Study supported of FRIA through grant
scholarship and FNRS through grants
F.4552.05 and 2.4507.02
Corresponding author :
Hélène Soyeurt
Passage des Déportés, 2
5030 Gembloux
BELGIUM
E-mail : [email protected]