Interactive Qualifying Project Air Pollution in Asia · PDF fileInteractive Qualifying Project...
168
Interactive Qualifying Project Air Pollution in Asia Li-Shun Lu [email protected] Bo-Huei Lin [email protected] Tin-Chi Wong [email protected] Term A, 2005 ~Term D, 2006
Transcript of Interactive Qualifying Project Air Pollution in Asia · PDF fileInteractive Qualifying Project...
Interactive Qualifying Project
Air Pollution in Asia
Li-Shun Lu
Bo-Huei Lin
Tin-Chi Wong
Term A, 2005 ~Term D, 2006

2
Table of Contents ABSTRACT 3 1. INTRODUCTION 4 2. BACKGROUND 8 2.1 AIR POLLUTION GENERAL KNOWLEDGE 9 2.1.1 DEFINITION 9 2.1.2 CAUSES PARTICLES INFORMATION 10 2.1.3 AIR POLLUTION EFFECTS 14 2.2 INTRODUCTION OF THREE REGIONS 30 2.2.1 TAIWAN (R.O.C.) 30 2.2.2 HONG KONG 34 2.2.3 JAPAN 38 2.3 BRIEF SUMMARY 42 3. METHODOLOGY 43 4. RESULT 46 4.1 HISTORICAL INFORMATION 47 4.1.1 TAIWAN 47 4.1.2 HONG KONG 54 4.1.3 JAPAN 58 4.1.4 SECTION SUMMARY 74 4.2 TECHNOLOGY 75 4.2.1 AIR POLLUTION EPISODES 75 4.2.2 MONITORING SYSTEM 84 4.2.3 TECHNICAL SOLUTION 97 4.2.4 ANALYSIS AND COMPARISON 122 4.3 GOVERNMENT POLICY 124 4.3.1 TAIWAN 124 4.3.2 HONG KONG 133 4.3.3 JAPAN 142 4.3.4 ANALYSIS AND COMPARISON 159
5. CONCLUSION 161 REFERENCE 164
3
Abstract
Air pollution is a major factor that creates bad influence to human health and cause
respiration disease. This project will introduce air pollution in general point of view,
describe the cause pollutants, human effects, and explain critical environmental effect in
present time. For further information on air pollution, the air pollution index will
introduce the pollutant criteria and the air quality detector, monitoring system. In order
to provide best suggested methods for preventing air pollution issue, this project
compares all technical solutions and government policies published by Taiwan, Hong
Kong, and Japan; so the result will be best suitable and efficient for other Asian countries.
1. Introduction
Even when the sun is shining, and the sky seems clean; the atmosphere is not exactly as
clean as it looks. There are tiny solid, liquid, and gas particles existing in the atmosphere,
for example pollen and bacteria; when those particles exceed a certain limit, they will
become pollutants and affect air quality. In a lower level of effect, air pollutants will
simply create some weird smell or smudge the vision in the atmosphere. Since every
organism on the earth is depended on breathing air for living, when air pollution becomes
more serious, pollutants could be seen as lethal diseases and threaten any creature’s life.
This project is mainly designed for Asia, the world’s largest continent. As the report
shows that there are more than 2.5 billion people live in Asia, which is more than one-
third of the whole human-beings on this planet. Though, most of the Asian countries do
not have good preservation on air quality, the cause of this status is unidentified.
However, as the result shows most nations with bad air quality have a common symbol in
economics, which is they are either undeveloped or developing. “Developing” and
“Undeveloped” might be the significant phrase for economical definition, but they also
indirectly symbolize how civilized and advanced the country is. If a country is not
advanced, it might have a few knowledge on pollution, which means it does not know
how important the situation is and how to prevent it. Even if the countries have
knowledge of air pollution and the understanding of its importance, the secondary
problem is always that there are not enough budgets for air quality preservation.
Nevertheless, this project does not provide any suggestion on how to create a larger
amount of budget but the solution on pollution prevention. By observing at Taiwan,
Hong Kong, and Japan, the most advanced and civilized nations in Asia, which have
longer and better outcomes on air pollution prevention; the report can supply lists of most
efficient solutions. To sum up, the goal of this project is to provide suggestions on
solving air pollution problems by seeking methods from the three most advanced and
civilized regions in Asia: Taiwan, Hong Kong, and Japan; compare the methods and
generate the suggested solution.
5
Problems must be clarified before they can be solved. Prior to the solution analysis and
conclusion, the understanding of the problem is essential. Thus, the first objective is to
provide data for problem understanding. In order to do so, the report derives parts for air
pollution definition, the cause particles information, and the pollution effects
identifications. Next is to introduce the three models: Taiwan, Hong Kong, Japan. Since
the suggested solutions in the end is resulted from the comparison of those three regions,
it is necessary to understand each region’s background information, such as the
population, economic structure, etc. and their maintenance on air pollution, such as air
quality standards and pollutant standard values. Before the real comparison, it was found
necessary to identify the air pollution index in each region, which is considered as the
historical information. This section clarifies the flow of air quality upon to a period of
time. Analysis on such data presents the efficiency of technical solutions or government
policies. The next section is the technical solution comparison. Comparison is made first
by description and identification of all technical solutions. Meanwhile, air quality
objective is also stated for target clarification. In this case, the output of a solution should
be used prior to such situation is made. Air pollution episode, similar to air pollution
index, is placed to represent the result created by certain technology. After the
technology itself, what it is used for, and its result have been clarified, data must be
analyzed to state the efficiency; which is the major factor for solution comparison. The
same process is used for government policy. First is to identify the political regulation,
then specify any penalty and reward base on law violation relates to air quality; then
analyze data for efficiency outline and for solution comparison. Throughout the
completion on comparisons in both technical solution and government policy, the best
solution prior to this project research will be clearly identified.
As mentioned in the second paragraph that Hong Kong, Taiwan, and Japan are the most
developed and civilized regions in Asia; which indirectly represent for their most
advanced technology and comprehensive political regulations. Due to these two
occasions, Hong Kong, Taiwan, and Japan are considered to be the regions where air
pollution prevention has been well organized and processed. Though, in the greatest
continent Asia, not only these regions possess the specialties. Countries like South Korea,

6
Singapore, etc. are all advanced enough to be a good model for air quality maintenance.
The prior consideration is to focus on regions based on small land area while contains a
large population since human is the major air pollutant source. The minor consideration
is the diversification of economical industry. By research, a large portion of air
pollutants are created by industrial productions, which means the industry is a significant
factor of pollutant sources. Regions conform to the previous two considerations
theoretically possess poor air quality, though it can clearly specify the level of pollution
prevention. Rather than choosing one of the three regions to be the only model for whole
Asia, comparison was found to perform and conclude the best solution since it will be
obviously clear where the weakness and strength of each region. The common factor
base on Taiwan, Hong Kong, and Japan, is the population. Hong Kong is most likely to
have the highest density of human vs. land size around the whole Asia. Even if Hong
Kong is known to specify in world trade business, the air pollution index based on human
is absolutely remarkable and worth to define. On the other hand, Taiwan and Japan both
specialize in multiple types of industry, such as agricultural pursuits, manufacturing
industry, mercantile pursuits, etc. Hence, the comparison based on Taiwan, Hong Kong,
and Japan will be able to provide outstanding solution considered with human factor and
industries.
In the section of air pollution introduction, scientific definition, the explanation and
description on causes and affects are the expected outcomes. For the definition, it must
be written thorough and detailed. Though, the output must be summarized and written in
simple-format English for easy understanding. The effect on air pollution, on the other
hand, should not be a simple statement or list; the research must also cover picture
collection. Since air pollution is a scientific issue, the causes mostly originate from
chemical particles. In order to make a thorough research, the outcome must not only
identify all chemical causes but also all machines that require such particle and product
pollutants; so people would know what the cause is and where will it come from. The
second part is to introduce the three models: Taiwan, Hong Kong, Japan. These three
regions are considered as models because they have the most advanced technology and
have been working on solving air pollution issue more than other countries in Asia. With
7
the study on their air pollution progress, the project can state all useful technology and
efficient solution for other countries to consult. Once again, in order to structure an easy-
understanding format on this project, for every single data or information collected, it
must come along with analysis as explanation and description. The analysis states the
reason of the progress, the usage for such technology, and the result in the end so there
would be identification on its efficiency. The final research is targeting on government
policy. The objective is to highlight and explain how law regulations can be a significant
factor of air pollution prevention. In this case, it includes a research on any government
policy that relates to pollutants restrictions or laws. Analysis is also required in this
section, so the outcome would state how such law or restriction effect the air quality and
the whole situation as efficiency identification.
8
2. Background
The following chapter is considered as background introduction. Knowledge of air
pollution will be informed by its general definition, pollutant identification, and statement
of pollution effects. For the section of air pollution effects, in order to provide detail
information on the pollution effects, the section is divided into two parts where the first
part will simply state the effect in connection with each pollutant and also state the source
that generates or contains such pollutant; the second part is a detail description of
worldwide critical effects in the present time where the effects are most hazardous and
deadly to the earth.
Next is the introduction of three regions that have been chosen for comparison on air
quality protection. Air pollution is a problem grows beyond civilization where it is
proportion to national population and economy, which by the way is the consideration for
choosing the three regions. Therefore, the economy structure and population will be
directly introduced in the section.
9
2.1 Air Pollution General Knowledge
2.1.1 Definition
Particles or gases in the air that are not part of its normal composition, it can be
considered as "air pollution" and the particles or gases are called "air pollutants." Even if
the amounts of certain air pollutants are small, they can still cause serious health and
environmental problems. The general human health effects will be introduced in the next
part.
Air pollution has plagued communities since the industrial revolution and even before.
Airborne pollutants, such as gases, chemicals, smoke particles, and other substances,
reduce the value of and ability to enjoy affected property and cause significant health and
environmental problems. Despite the long history and significant consequences of this
problem, effective legal remedies are relatively recent. Though some cities adopted air
quality laws as early as 1815, air pollution at that time was seen as a problem best
handled by local laws and ordinances. Only as the United States' cities continued to grow,
and pollution and health concerns with them, did federal standards and a nationwide
approach to air quality begin to emerge.
Air pollution can be natural or human-made. Air pollution occurs naturally during
volcano eruptions, forest fires, or dust storms. This has been an occasional problem for
humans. However, during the past hundred years, air pollution created by humans has
become a major, persistent problem. On the other hand, the most critical air pollutants are
human-made. The next part of project will state in detail of all significant human-made
pollutants and their effects.
10
2.1.2 Causes Particles Information
Air pollution is the contamination of the air by noxious gases and minute particles of
solid and liquid matter (particulates) in concentrations that endanger health. The major
sources of air pollution are transportation engines, power and heat generation, industrial
processes, and the burning of solid waste.
The combustion of gasoline and other hydrocarbon fuels in automobiles, trucks, and jet
airplanes produces several primary pollutants: nitrogen oxides, gaseous hydrocarbons,
and carbon monoxide, as well as large quantities of particulates, chiefly lead. In the
presence of sunlight, nitrogen oxides combine with hydrocarbons to form a secondary
class of pollutants, the photochemical oxidants, among them ozone and the eye-stinging
Proxy Acetyl Nitrate (PAN). Nitrogen oxides also react with oxygen in the air to form
nitrogen dioxide, a foul-smelling brown gas. In urban areas like Los Angeles where
transportation is the main cause of air pollution, nitrogen dioxide tints the air, blending
with other contaminants and the atmospheric water vapor to produce brown smog.
Although the use of catalytic converters has reduced smog-producing compounds in
motor vehicle exhaust emissions, recent studies have shown that in so doing the
converters produce nitrous oxide, which contributes substantially to global warming.
In cities, air may be severely polluted not only by transportation but also by the burning
of fossil fuels (oil and coal) in generating stations, factories, office buildings, and homes
and by the incineration of garbage. The massive combustion produces tons of ash, soot,
and other particulates responsible for the gray smog of cities like New York and Chicago,
along with enormous quantities of sulfur oxides (which also may be result from burning
coal and oil). These oxides rust iron, damage building stone, decompose nylon, tarnish
silver, and kill plants. Air pollution from cities also affects rural areas for many miles
downwind.
Every industrial process exhibits its own pattern of air pollution. Petroleum refineries are
responsible for extensive hydrocarbon and particulate pollution. Iron and steel mills,
11
metal smelters, pulp and paper mills, chemical plants, cement and asphalt plants— all
discharge vast amounts of various particulates. Un-insulated high-voltage power lines
ionize the adjacent air, forming ozone and other hazardous pollutants. Airborne
pollutants from other sources include insecticides, herbicides, radioactive fallout, and
dust from fertilizers, mining operations, and livestock feedlots.
Pollutant Characteristici
Nitrogen oxides include nitrous oxide (NO) and nitrogen dioxide (NO2)
Nitrogen oxides come from the combustion process. Nitrogen in the air or in the fuel
reacts with oxygen and forms nitrogen oxides. Nitrous oxide is a colorless, odorless gas
and slightly dissolves in water. Nitrous oxide is the major component of combustion and
can transform to nitrogen dioxide through photochemical reactions. On the contrary,
nitrogen dioxide can breakdown into nitrous oxide and oxygen by photochemical
reactions under the sunlight. It can dissolve in water and transform to nitrous acid (HNO2)
and nitric acid (HNO3). The oxidation reactions of nitrogen dioxide in the air are also a
source of acid rain. Nitrogen dioxide is a gas with yellowish color and irritating odor. It
can cause an odorous brown haze that irritates the eyes and nose, shuts out sunlight and
reduces visibility. It also has been associated with acute effects in sufferers of respiratory
diseases.
Ozone (O3)
Ozone is a secondary pollutant in that it is not emitted directly to the atmosphere but
rather formed in the atmosphere by the reactions of other pollutants. It is produced when
volatile organic compounds (VOC) and nitrogen oxides react with sunlight. Sources of
these two pollutants include gasoline vapors, the combustion of fossil fuels, automobile
emissions and vapors from solvents. Due to its strong oxidative reactions, ozone can
cause irritating symptoms on the eyes and the respiratory system, such as coughing,
asthma, headache, lethargy, and even lung damage. Children, the elderly, patients, or

12
persons with active outdoor activities are most vulnerable to ozone damage. Ozone can
also cause damage to crops, paintings, and plastic products such as tires.
Carbon monoxide (CO)
Carbon monoxide is a poisonous gas that has an affinity with hemoglobin, 210 times that
of oxygen. By combining with the hemoglobin in the blood, it inhibits the delivery of
oxygen to the body's tissue, thereby causing asphyxia or shortness of breath. The health
threat from carbon monoxide is serious for those who suffer from cardiovascular diseases.
Carbon monoxide is a by-product of the incomplete burning of fuels. Industrial processes
contribute to carbon monoxide pollution levels, but the principal source of carbon
monoxide in most large urban areas is vehicular emissions. The highest concentrations
are found close to combustion sources.
Lead (Pb)
The ambient lead concentrations have been lingering at very low levels since the oil
companies took voluntary action in reducing the lead content of petrol in the early
eighties
Hydrocarbons (HC)
In addition to the natural occurrences of hydrocarbons, the major sources of hydrocarbon
come from incomplete combustion and evaporation or leakage of gasoline products.
There are two groups of Hydrocarbons: methane and non-methane hydrocarbons. The
majority of methane comes from natural biological activities and is not involved in
photochemical reactions. The non-methane hydrocarbons mainly come from human
activities, most of which are involved in photochemical reactions.

13
Sulfur dioxides (SO2)
Sulfur dioxides are emitted primarily from industrial furnaces or power plants burning
coal or sulfur-containing oil besides the naturally occurring material. It is a colorless gas
with a foul odor, also a major source of acid rain, damages trees, plants and agricultural
crops. The major health effects of concern associated with high exposures to sulfur
dioxide include effects on breathing and respiratory illness symptoms. The population
most sensitive to sulfur dioxide includes asthmatics and individuals with chronic lung
disease or cardiovascular disease.
Suspend Particulate (PM10)
PM10s are particulates with a diameter less than 10 um, including dust from road traffic,
emission from vehicles, open burning, construction, agriculture, or as a secondary
pollutant transformed from other air pollutants. Due to its small size, PM10 can easily
penetrate into the bronchus of the human lungs. The respiratory system can be damaged
by the physical presence of PM10 or by the pollutants that are absorbed on the PM10.
14
2.1.3 Air Pollution Effects
Air pollution may possibly harm populations in ways so subtle or slow that they have not
yet been detected. For that reason research is now under way to assess the long-term
effects of chronic exposure to low levels of air pollution— what most people
experience— as well as to determine how air pollutants interact with one another in the
body and with physical factors such as nutrition, stress, alcohol, cigarette smoking, and
common medicines. Another subject of investigation is the relation of air pollution to
cancer, birth defects, and genetic mutations.
A recently discovered result of air pollution are the “holes” in the ozone layer in the
atmosphere above Antarctica and the Arctic, coupled with growing evidence of global
ozone depletion. This can increase the amount of ultraviolet radiation reaching the earth,
where it damages crops and plants and can lead to skin cancer and cataracts. This
depletion has been caused largely by the emission of chlorofluorocarbons (CFCs) from
refrigerators, air conditioners, and aerosols. The Montreal Protocol of 1987 required that
developed nations signing the accord not exceed 1986 CFC levels. Several more
meetings were held from 1990 to 1997 to adopt agreements to accelerate the phasing out
of ozone-depleting substances.
The other critical pollutant is sulfur oxides. Like photochemical pollutants, sulfur oxides
contribute to the incidence of respiratory diseases. Acid rain, a form of precipitation that
contains high levels of sulfuric or nitric acids, can contaminate drinking water and
vegetation, damage aquatic life, and erode buildings. When weather condition known as
a temperature inversion prevents dispersal of smog, inhabitants of the area, especially
children and the elderly and chronically ill, are warned to stay indoors and avoid physical
stress. The dramatic and debilitating effects of severe air pollution episodes in cities
throughout the world— such as the London smog of 1952 that resulted in 4,000 deaths—
have alerted governments to the necessity for crisis procedures. Even everyday levels of
air pollution may insidiously affect health and behavior. Indoor air pollution is a problem
in developed countries, where efficient insulation keeps pollutants inside the structure. In

15
less developed nations, the lack of running water and indoor sanitation can encourage
respiratory infections. Carbon monoxide, for example, by driving oxygen out of the
bloodstream, causes apathy, fatigue, headache, disorientation, and decreased muscular
coordination and visual acuity.
Human Health Effecti i
In the following section, the table below is used to identify sources in accordance with
each pollutant, and state possible human health effects.
Pollutant Source
Human Health Effects
Particles (API) -
Air Particle
Index
· Internal combustion
engines (e.g., cars and
trucks);
· Industry (e.g. factories);
· Burning wood;
· Cigarette smoke; and
· Bushfires.
Long term exposure is linked to:
· Lung Cancer;
· Heart Disease;
· Lung Disease;
· Asthma Attacks; and
· Other health problems.
Nitrogen
Dioxide (NO2)
· Motor Vehicles are the
biggest contributors;
· Other combustion
processes;
Exposure to high levels of NO2
may lead to:
· Lung damage; or
· Respiratory Disease.
It has also been linked to:
· Increased hospital
admissions for asthma and
respiratory problems;
· Increased mortality.
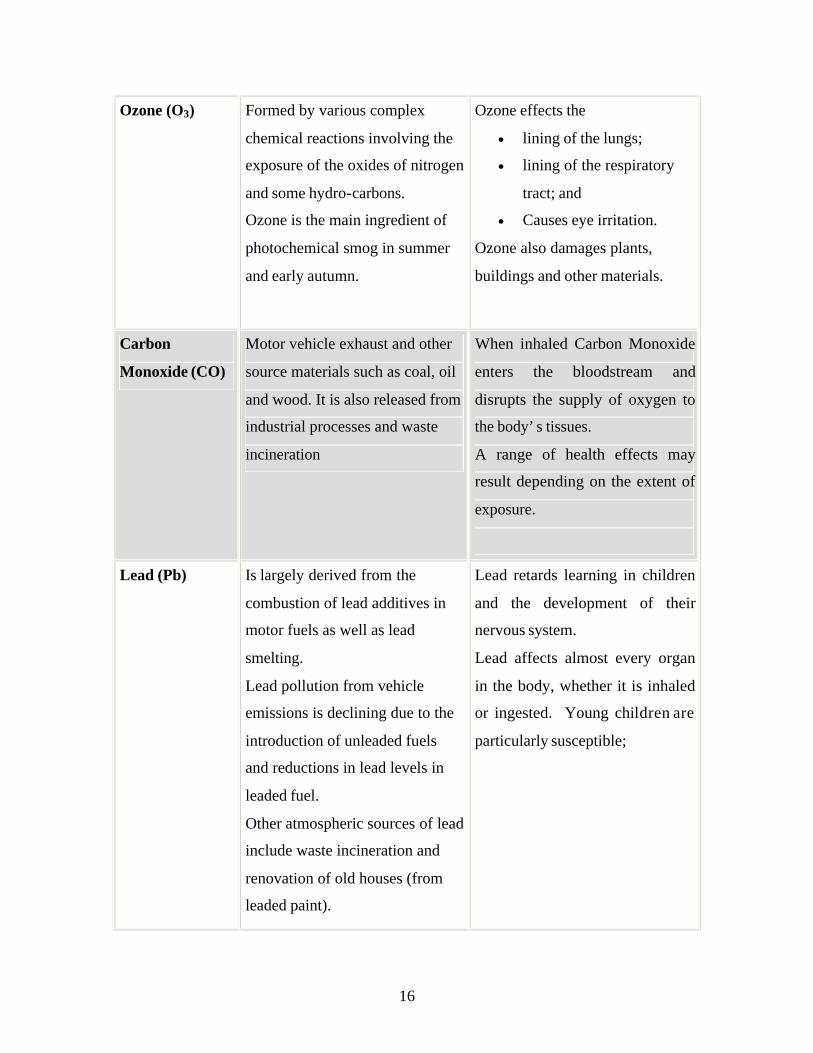
16
Ozone (O3) Formed by various complex
chemical reactions involving the
exposure of the oxides of nitrogen
and some hydro-carbons.
Ozone is the main ingredient of
photochemical smog in summer
and early autumn.
Ozone effects the
· lining of the lungs;
· lining of the respiratory
tract; and
· Causes eye irritation.
Ozone also damages plants,
buildings and other materials.
Carbon
Monoxide (CO)
Motor vehicle exhaust and other
source materials such as coal, oil
and wood. It is also released from
industrial processes and waste
incineration
When inhaled Carbon Monoxide
enters the bloodstream and
disrupts the supply of oxygen to
the body’s tissues.
A range of health effects may
result depending on the extent of
exposure.
Lead (Pb) Is largely derived from the
combustion of lead additives in
motor fuels as well as lead
smelting.
Lead pollution from vehicle
emissions is declining due to the
introduction of unleaded fuels
and reductions in lead levels in
leaded fuel.
Other atmospheric sources of lead
include waste incineration and
renovation of old houses (from
leaded paint).
Lead retards learning in children
and the development of their
nervous system.
Lead affects almost every organ
in the body, whether it is inhaled
or ingested. Young children are
particularly susceptible;

17
Hydro-carbons
(HC) - chemical
compounds
composed of
Hydrogen and
Carbon atoms
Most fuel combustion processes
result in the release of hydro
carbons to the environment. The
largest fuel sources are natural
gas and petrol. Note that
hydrocarbons can enter the
environment both as evaporative
emissions from vehicle fuel
systems, or in exhaust emissions.
They are also a component of the
smoke from wood fires.
Exposure can cause headaches or
nausea, while some compounds
may cause cancer. Some may also
damage plants.
Volatile Organic
Compounds
(VOC)- Benzene
& 1,3-Butadiene
VOC is released in vehicle
exhaust gases either as unburned
fuels or as combustion products,
and are also emitted by the
evaporation of solvents and motor
fuels. 1,3-butadiene is also an
important chemical in certain
industrial processes, particularly
the manufacture of synthetic
rubber
Possible chronic health effects
include cancer, central nervous
system disorders, liver and kidney
damage, reproductive disorders,
and birth defects
18
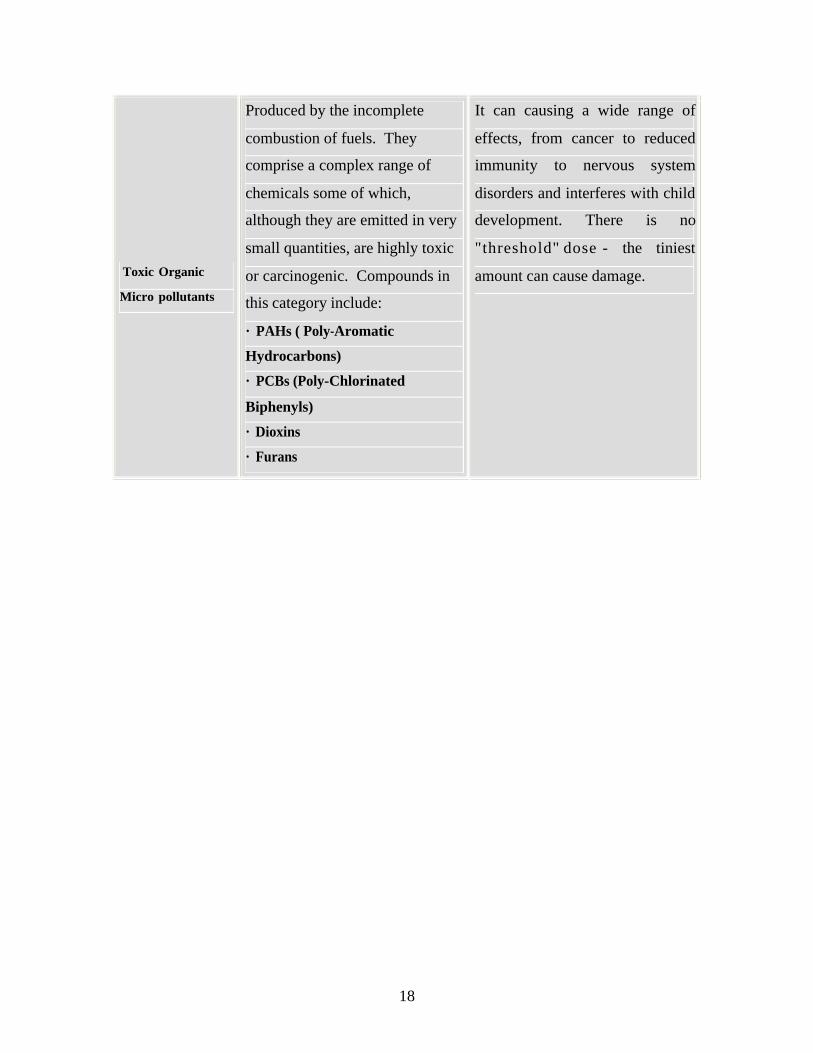
Toxic Organic
Micro pollutants
Produced by the incomplete
combustion of fuels. They
comprise a complex range of
chemicals some of which,
although they are emitted in very
small quantities, are highly toxic
or carcinogenic. Compounds in
this category include:
· PAHs ( Poly-Aromatic
Hydrocarbons)
· PCBs (Poly-Chlorinated
Biphenyls)
· Dioxins
· Furans
It can causing a wide range of
effects, from cancer to reduced
immunity to nervous system
disorders and interferes with child
development. There is no
"threshold" dose - the tiniest
amount can cause damage.
19
Environmental Effect
Air pollution has been effecting global environment early when the Industrial Revolution
starts in the end of 18th century. Even the pollutants are tiny and the effects were rare;
throughout hundreds of years, the problem has been growing more and more serious.
Until now, since the problem was never taken care, the following deadly effects have
been occurred worldwide:
1. Smogi i i
Smog is a kind of air pollution - the name is a portmanteau of smoke and fog. Classic
smog results from large amounts of coal burning in an area and is caused by a mixture of
smoke and sulfur dioxide. In the 1950s a new type of smog, known as photochemical
smog, was first described. This is a noxious mixture of air pollutants including the
following:
· nitrogen oxides, such as nitrogen dioxide
· troposphere ozone
· volatile organic compound (VOC)
· peroxyacyl nitrates (PAN)
All of these chemicals are usually highly reactive and oxidizing. Due to this fact,
photochemical smog is considered to be a problem of modern industrialization.
Photochemical smog is a concern in most major urban canters but, because it travels with
the wind, it can affect sparsely populated areas as well. Smog is caused by a reaction
between sunlight and emissions mainly from human activity. Photochemical smog is the
chemical reaction of sunlight, nitrogen oxides and volatile organic compounds (VOC) in
the atmosphere, which leaves airborne particles (called particulate matter) and ground-
level ozone.
Smog is a problem in a number of cities and continues to harm human health. Ground-
level ozone is especially harmful for seniors, children, and people with heart and lung
conditions such as emphysema, bronchitis, and asthma. It can inflame breathing passages,
20
decreasing the lung's working capacity, and causing shortness of breath, pain when
inhaling deeply, wheezing, and coughing. It can cause eye and nose irritation and dry out
the protective membranes of the nose and throat and interfere with the body's ability to
fight infection, increasing susceptibility to illness. Hospital admissions and respiratory
deaths often increase during periods when ozone levels are high.
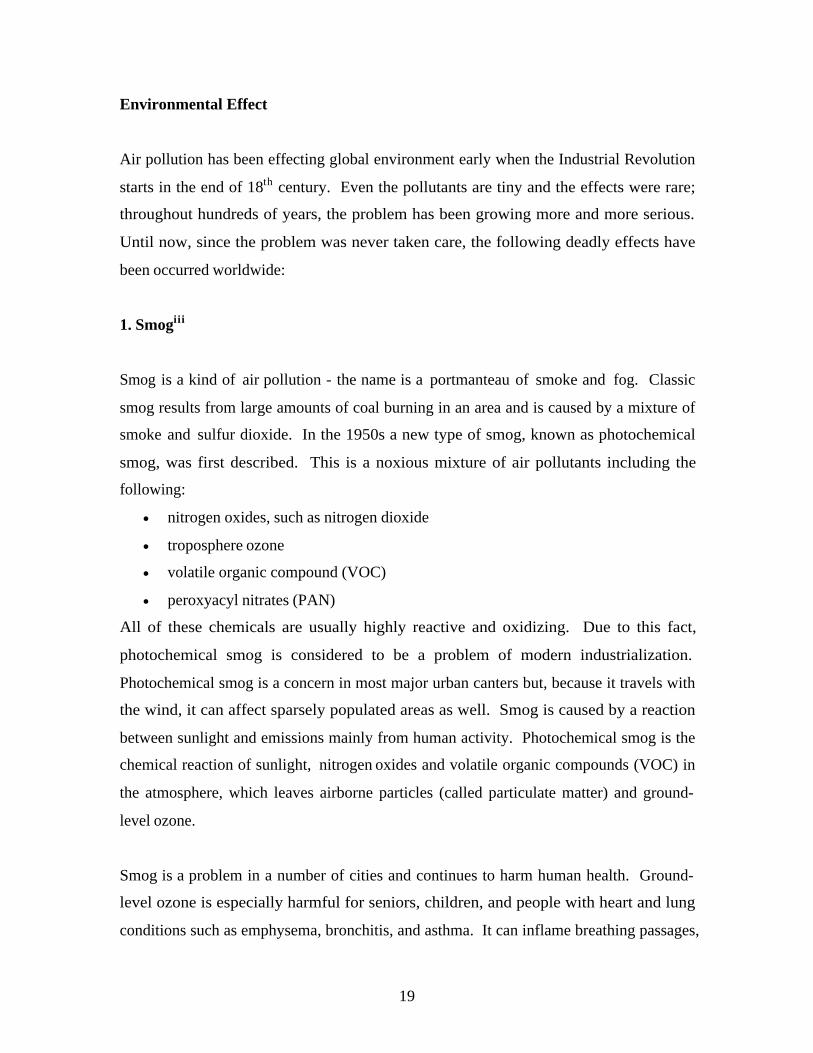
Figure 1: Picture of a city with serious smog pollution
21
2. Acid rainiv
Acid rain is defined as any type of precipitation with a pH that is unusually low.
Dissolved carbon dioxide dissociates to form weak carbonic acid giving a pH of
approximately 5.6 at typical atmospheric concentrations of CO2. Therefore a pH of <5.6
has sometimes been used as a definition of acid rain.
Acid rain occurs when sulfur dioxide and nitrogen oxides are emitted into the atmosphere,
undergo chemical transformations and are absorbed by water droplets in clouds. The
droplets then fall to earth as rain, snow, or sleet. This can increase the acidity of the soil,
and affect the chemical balance of lakes and streams. Acid rain also causes an increased
rate of oxidation for iron.
Acid rain is sometimes used more generally to include all forms of acid deposition - both
wet deposition, where acidic gases and particles are removed by rain or other
precipitation, and dry deposition removal of gases and particles to the Earth's surface in
the absence of precipitation. The most important gas which leads to acidification is
sulfur dioxide. Emissions of nitrogen oxides which are oxidized to form Nitric acid are
of increasing importance due to stricter controls on emissions of sulfur containing
compounds. 70 Tg(S) per year in the form of SO2 comes from fossil fuel combustion
and industry, 2.8 Tg(S) from wildfires, and 7-8 Tg(S) per year from volcanoes. Acid
rain also can damage certain building materials and historical monuments. Some
scientists have suggested links to human health, but none have been proven.
Decades of enhanced acid input has increased the environmental stress on high elevation
forests and aquatic organisms in sensitive ecosystems. In extreme cases, it has altered
entire biological communities and eliminated some fish species from certain lakes and
streams. In many other cases, the changes have been more subtle, leading to a reduction
in the diversity of organisms in an ecosystem. The following paragraphs identify the
most popular acid rain effects around the world.
22
Effects on lake ecology
There is a strong relationship between lower pH values and the loss of populations of fish
in lakes. Below 4.5 virtually no fish survive, whereas levels of 6 or higher promote
healthy populations. Acid in water inhibits the production of enzymes which enable
fish's larvae to escape their eggs. It also mobilizes toxic metals such as aluminum in lakes.
Aluminum causes some fish to produce an excess of mucus around their gills, preventing
proper ventilation. Phytoplankton growth is inhibited by high acid levels, and animals
which feed on it suffer.
Many lakes are subject to natural acid runoff from acid soils, and this can be triggered by
particular rainfall patterns, that concentrate the acid. An acid lake with newly-dead fish
is not necessarily evidence of severe air-pollution.
Effects of acid rain on soil biology
Soil biology can be seriously damaged by acid rain. Some tropical microbes can quickly
consume acids but other types of microbe are unable to tolerate low pHs and are killed.
The enzymes of these microbes are denatured (changed in shape so they no longer
function) by the acid. Forest soils tend to be inhabited by fungi, but acid rain shifts forest
soils to be more bacterially dominated. In order to fix nitrogen many trees rely on fungi
in a symbiotic relationship with their roots.
Other adverse effects
Trees are harmed by acid rain in a variety of ways. The waxy surface of leaves is broken
down and nutrients are lost, making trees more susceptible to frost, fungi, and insects.
Root growth slows and as a result fewer nutrients are taken up. Toxic ions are mobilized
in the soil, and valuable minerals are leached away or (as in the case of phosphate)
become bound to aluminum or iron compounds, or to clay. The toxic ions released due to
acid rain form the greatest threat to humans. Mobilized copper has been implicated in
23
outbreaks of diarrhea in young children and it is thought that water supplies contaminated
with aluminum cause Alzheimer's disease.
Acid rain can cause erosion on ancient and valuable statues and has caused considerable
damage. This is because the sulfuric acid in the rain chemically reacts with the calcium
in the stones (lime stone, sandstone, marble and granite) to create gypsum, which then
flakes off. This is also commonly seen on old gravestones where the acid rain can cause
the inscription to become completely illegible.
24
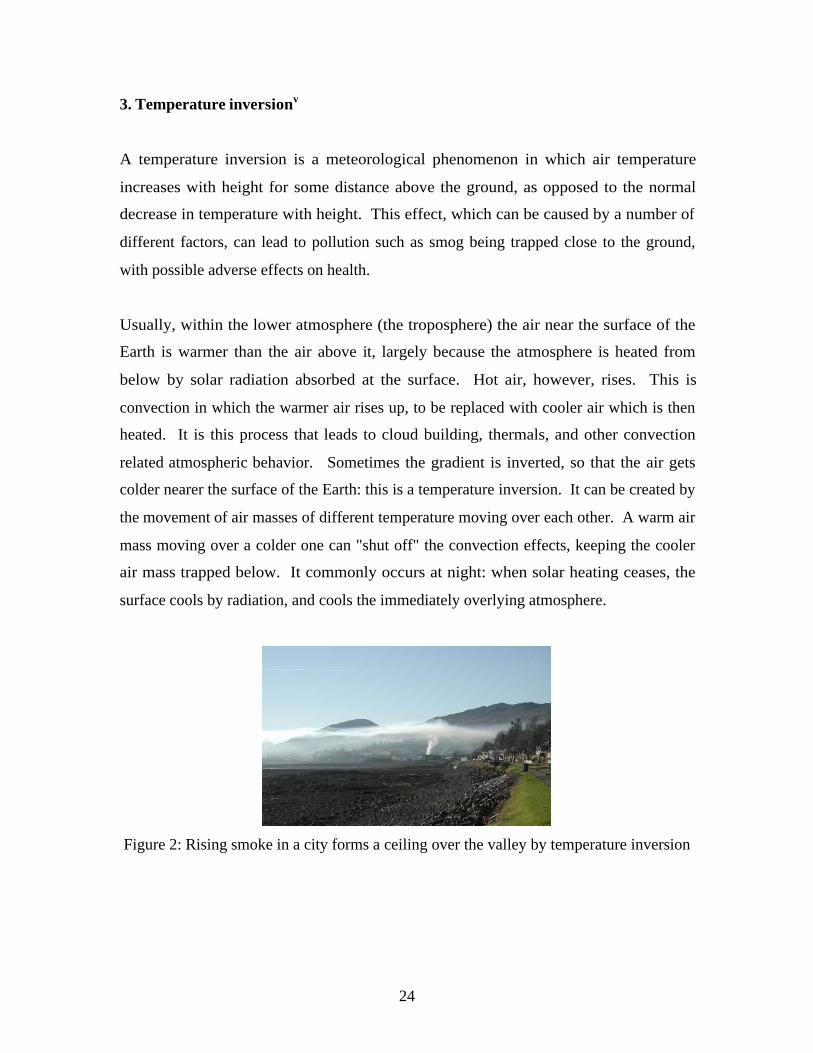
3. Temperature inversionv
A temperature inversion is a meteorological phenomenon in which air temperature
increases with height for some distance above the ground, as opposed to the normal
decrease in temperature with height. This effect, which can be caused by a number of
different factors, can lead to pollution such as smog being trapped close to the ground,
with possible adverse effects on health.
Usually, within the lower atmosphere (the troposphere) the air near the surface of the
Earth is warmer than the air above it, largely because the atmosphere is heated from
below by solar radiation absorbed at the surface. Hot air, however, rises. This is
convection in which the warmer air rises up, to be replaced with cooler air which is then
heated. It is this process that leads to cloud building, thermals, and other convection
related atmospheric behavior. Sometimes the gradient is inverted, so that the air gets
colder nearer the surface of the Earth: this is a temperature inversion. It can be created by
the movement of air masses of different temperature moving over each other. A warm air
mass moving over a colder one can "shut off" the convection effects, keeping the cooler
air mass trapped below. It commonly occurs at night: when solar heating ceases, the
surface cools by radiation, and cools the immediately overlying atmosphere.
Figure 2: Rising smoke in a city forms a ceiling over the valley by temperature inversion
25
4. Global warmingvi
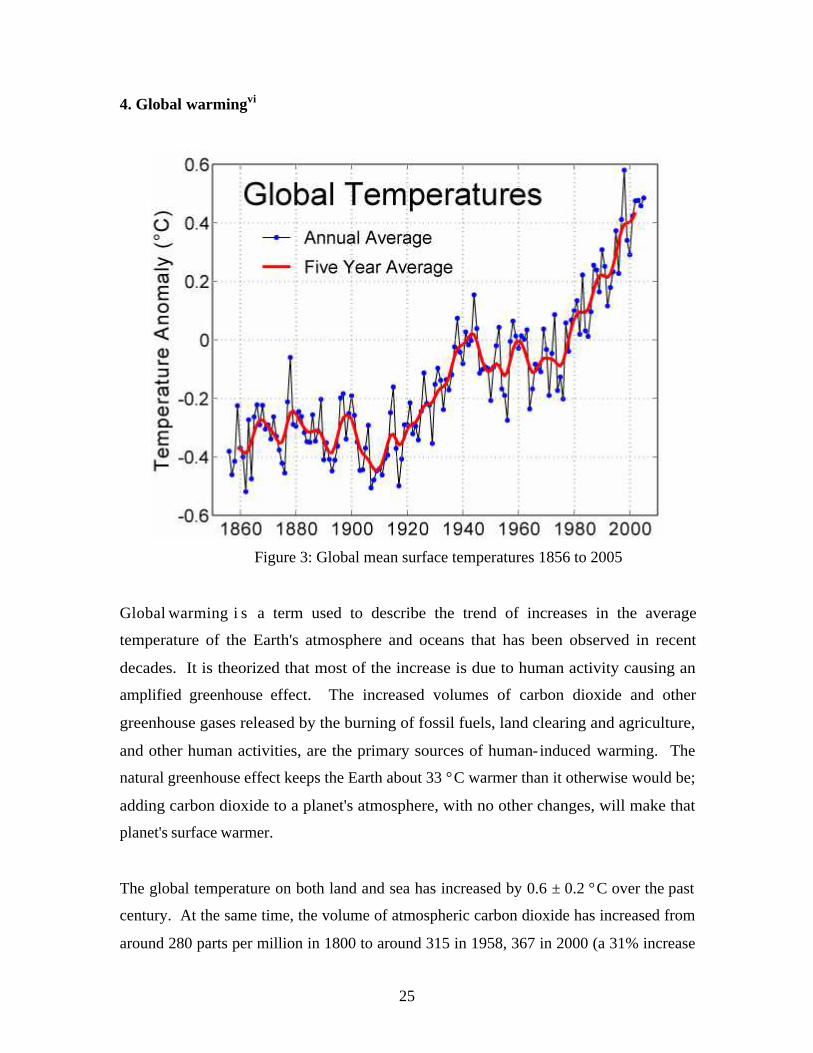
Figure 3: Global mean surface temperatures 1856 to 2005
Global warming i s a term used to describe the trend of increases in the average
temperature of the Earth's atmosphere and oceans that has been observed in recent
decades. It is theorized that most of the increase is due to human activity causing an
amplified greenhouse effect. The increased volumes of carbon dioxide and other
greenhouse gases released by the burning of fossil fuels, land clearing and agriculture,
and other human activities, are the primary sources of human-induced warming. The
natural greenhouse effect keeps the Earth about 33 °C warmer than it otherwise would be;
adding carbon dioxide to a planet's atmosphere, with no other changes, will make that
planet's surface warmer.
The global temperature on both land and sea has increased by 0.6 ± 0.2 °C over the past
century. At the same time, the volume of atmospheric carbon dioxide has increased from
around 280 parts per million in 1800 to around 315 in 1958, 367 in 2000 (a 31% increase
26
over 200 years), and about 380 in 2006. Other greenhouse gas emissions have also
increased. Future carbon dioxide levels are expected to continue to rise due to ongoing
fossil fuel usage, though the actual trajectory will depend on uncertain economic,
sociological, technological, and natural developments.
Based on basic science, observational sensitivity studies and the climate models
referenced by the IPCC, temperatures may increase by 1.4 to 5.8 °C between 1990 and
2100. This is expected to result in other climate changes including rises in sea level and
changes in the amount and pattern of precipitation. Such changes may increase the
frequency and intensity of extreme weather events such as floods, droughts, heat waves,
and hurricanes, change agricultural yields, cause glacier retreat, reduced summer stream
flows, or contribute to biological extinctions. Although warming is expected to affect the
number and magnitude of these events, it is difficult to connect any particular event to
global warming. Much of the evidence is statistical; a significant increase in certain
events which is correlated with warming.

27
5. Ozone depletionvii
The term ozone depletion is used to describe two distinct, but related, observations: a
slow, steady decline, of about 3% per decade, in the total amount of ozone in the earth's
stratosphere during the past twenty years, and a much larger, but seasonal, decrease in
stratospheric ozone over the earth's polar regions during the same period. (The latter
phenomenon is commonly referred to as the "ozone hole".) The detailed mechanism by
which the polar ozone holes form is different from that for the mid-latitude thinning, but
the proximate cause of both trends is believed to be catalytic destruction of ozone by
atomic chlorine and bromine. The primary source of these halogen atoms in the
stratosphere is photo-dissociation of chlorofluorocarbon (CFC) compounds, commonly
called Freon, and bromofluorocarbon compounds known as Halons, which are
transported into the stratosphere after being emitted at the surface. Both ozone depletion
mechanisms strengthened as emissions of CFCs and Halons increased.
The CFC is completely artificial (they did not exist in nature before being synthesized by
man). They are used in air conditioning/cooling units, as aerosol spray propellants prior
to the 1980s, and in the cleaning processes of delicate electronic equipment, and are a
byproduct of some chemical processes. They are dissociated by ultraviolet light to
release chlorine atoms. The chlorine atom acts as a catalyst which can break down many
thousands of ozone molecules before it is removed from the stratosphere. Since the ozone
layer prevents most harmful UVB wavelengths (270- 315 nm) of ultraviolet light from
passing through the Earth's atmosphere, observed and projected decreases in ozone have
generated worldwide concern, leading to adoption of the Montreal Protocol banning the
production of CFCs and halons as well as related ozone depleting chemicals such as
carbon tetrachloride and trichloroethane (also known as methyl chloroform). It is
suspected that a variety of biological consequences, including, for example, increases in
skin cancer, damage to plants, and reduction of plankton populations in the ocean's photic
zone, may result from the increased UV exposure due to ozone depletion.

28
The main public concern regarding the ozone hole has been the effects of surface UV on
human health. As the ozone hole over Antarctica has in some instances grown very large
as to reach southern parts of Australia and New Zealand, environmentalists have been
concerned that the increase in surface UV could be significant.
UVB (the higher energy UV radiation absorbed by ozone) is generally accepted to be a
contributory factor to skin cancer. The most common forms of skin cancer in humans,
basal and squamous cell carcinomas have been strongly linked to UVB exposure. The
mechanism by which UV-B induces these cancers is well understood - absorption of UV-
B radiation causes the pyrimidine bases in the DNA molecule to form dimers, resulting in
transcription errors when the DNA replicates. These cancers are relatively mild and
rarely fatal, although the treatment of squamous cell carcinoma sometimes requires
extensive reconstructive surgery. By combining epidemiological data with results of
animal studies, scientists have estimated that a one percent decrease in stratospheric
ozone would increase the incidence of these cancers by 2%.
Another form of skin cancer, malignant melanoma, is much less common but far more
dangerous, being lethal in about 20% of the cases diagnosed. The relationship between
malignant melanoma and ultraviolet exposure is not yet well understood, but it appears
that both UV-B and UV-A are involved. Experiments on fish suggest that 90 to 95% of
malignant melanomas may be due to UVA and visible radiation whereas experiments on
opossums suggest a larger role for UV-B.
So far, ozone depletion in most locations has been typically a few percent. Where the
high levels of depletion seen in the ozone hole ever to be common across the globe, the
effects could be substantially more dramatic. For example, recent research has analyzed
a widespread extinction of plankton 2 million years ago that coincided with a nearby
supernova. Researchers speculate that the extinction was caused by a significant
weakening of the ozone layer at that time when the radiation from the supernova
produced nitrogen oxides that catalyzed the destruction of ozone (plankton are
particularly susceptible to effects of UV light, and are vitally important to marine food
29
webs). An increase of UV radiation would also affect crops. A number of economically
important species of plants, such as rice, depend on cyanobacteria residing on their roots
for the retention of nitrogen. Cyanobacteria are very sensitive to UV light and they
would be affected by its increase.
Aside from the direct effect of ultraviolet radiation on organisms, increased surface UV
leads to increased tropospheric ozone, as noted above. Paradoxically, at ground- level
ozone is generally recognized to be a health risk, as ozone is toxic due to its strong
oxidant properties. At this time, ozone at ground level is produced mainly by the action
of UV radiation on combustion gases from vehicle exhausts.
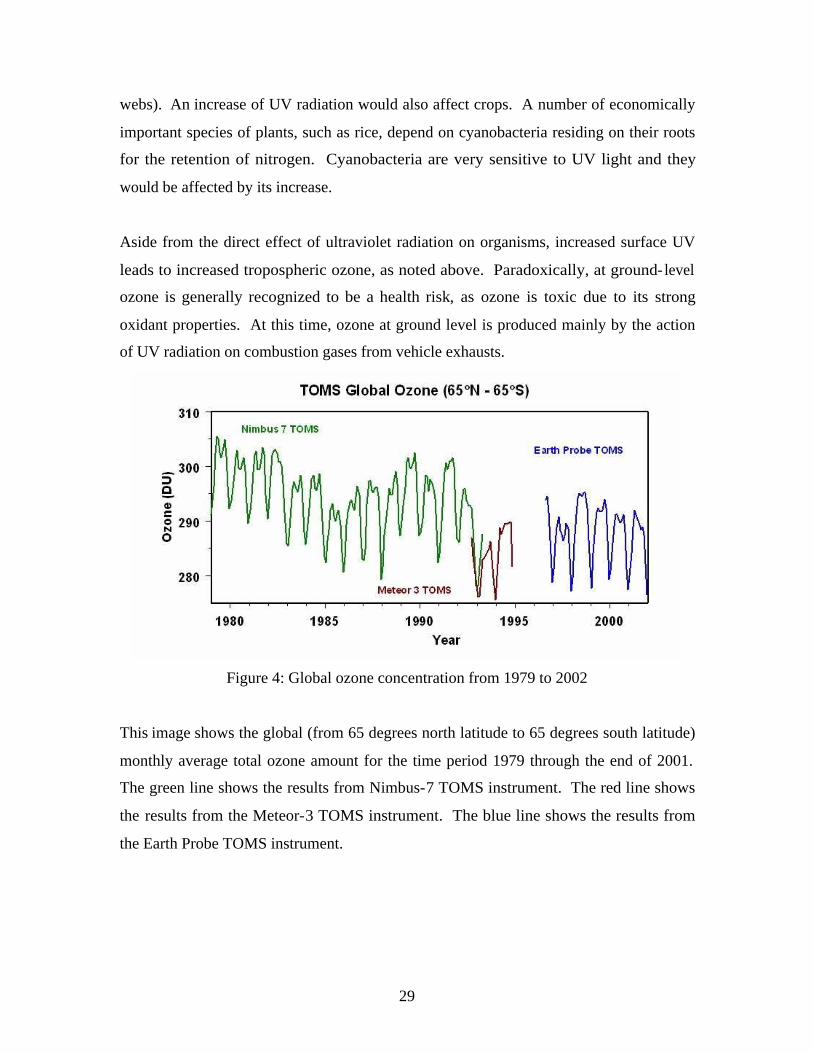
Figure 4: Global ozone concentration from 1979 to 2002
This image shows the global (from 65 degrees north latitude to 65 degrees south latitude)
monthly average total ozone amount for the time period 1979 through the end of 2001.
The green line shows the results from Nimbus-7 TOMS instrument. The red line shows
the results from the Meteor-3 TOMS instrument. The blue line shows the results from
the Earth Probe TOMS instrument.
30
2.2 Introduction of Three Regions
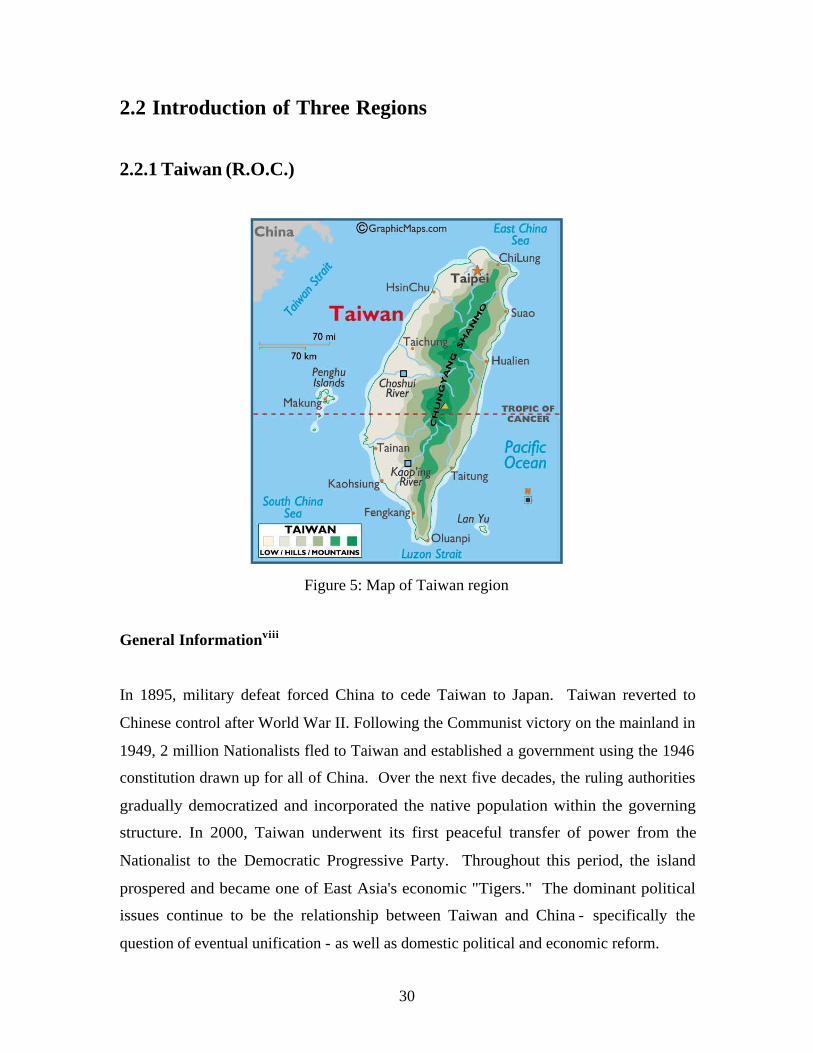
2.2.1 Taiwan (R.O.C.)
Figure 5: Map of Taiwan region
General Informationviii
In 1895, military defeat forced China to cede Taiwan to Japan. Taiwan reverted to
Chinese control after World War II. Following the Communist victory on the mainland in
1949, 2 million Nationalists fled to Taiwan and established a government using the 1946
constitution drawn up for all of China. Over the next five decades, the ruling authorities
gradually democratized and incorporated the native population within the governing
structure. In 2000, Taiwan underwent its first peaceful transfer of power from the
Nationalist to the Democratic Progressive Party. Throughout this period, the island
prospered and became one of East Asia's economic "Tigers." The dominant political
issues continue to be the relationship between Taiwan and China - specifically the
question of eventual unification - as well as domestic political and economic reform.
31
Location
Eastern Asia, islands bordering the East China Sea, Philippine Sea, South China Sea, and
Taiwan Strait, north of the Philippines, off the southeastern coast of China
Area
Total: 35,980 sq km
Land: 32,260 sq km
Water: 3,720 sq km
Area-comparative: slightly smaller than Maryland and Delaware combined
Population
23,036,087 (July 2006 estimated)
Population Growth Rate
0.61% (2006 estimated)
Government Type
Multiparty democracy
Economy
Through nearly five decades of hard work and sound economic management, Taiwan has
transformed itself from an underdeveloped, agricultural island to an economic power that
is a leading producer of high-technology goods. In the 1960s, foreign investment in
Taiwan helped introduce modern, labor- intensive technology to the island, and Taiwan
became a major exporter of labor- intensive products. In the 1980s, focus shifted toward
increasingly sophisticated, capital- intensive and technology- intensive products for export
and toward developing the service sector. At the same time, the appreciation of the New
32
Taiwan dollar (NT$), rising labor costs, and increasing environmental consciousness in
Taiwan caused many labor-intensive industries, such as shoe manufacturing, to move to
the Chinese mainland and Southeast Taiwan is now a creditor economy, holding the
world's third largest stock of foreign exchange reserves ($253 billion as of December
2005). Although Taiwan enjoyed sustained economic growth, full employment, and low
inflation for many years, in 2001, the combination of the slowing global economy,
weaknesses in parts of the financial sector, and sagging consumer and business
confidence in the government's economic policymaking resulted in the first recession
since 1952.
Taiwan firms are the world's largest supplier of computer monitors and leaders in PC
manufacturing. Textile production, though of declining importance as Taiwan loses its
competitive advantage in labor- intensive markets, is another major industrial export
sector. Imports are dominated by raw materials and capital goods, which account for
more than 90% of the total. Taiwan imports coal, oil and gas to meet most of its energy
needs. Reflecting the large Taiwan investment in the mainland, China supplanted the
United States as Taiwan's largest trade partner in 2003. The U.S. is now Taiwan's third-
largest trade partner, taking 15% of Taiwan's exports and supplying 11.6% of its imports.
Taiwan is the United States' eighth- largest trading partner; imports from the United States
consist mostly of agricultural and industrial raw materials. Exports to the United States
are mainly electronics and consumer goods. The United States, Hong Kong, the P.R.C.,
and Japan account for nearly 60.5% of Taiwan's exports, and the United States, Japan,
and the P.R.C. provide almost 50% of Taiwan's imports. The lack of formal diplomatic
relations with all but 24 of its trading partners appears not to have seriously hindered
Taiwan's rapidly expanding commerce, but has made free trade agreements extremely
difficult to pursue. Taiwan maintains trade offices in more than 96 countries with which
it does not have official relations. Taiwan is a member of the Asian Development Bank,
the WTO, and the Asia-Pacific Economic Cooperation (APEC) forum. These
developments reflect Taiwan's economic importance and its desire to become further
integrated into the global economy.
33
Although only about one-quarter of Taiwan's land area is arable, virtually all farmland is
intensely cultivated, with some areas suitable for two and even three crops a year.
However, increases in agricultural production have been much slower than industrial
growth. Agriculture only comprises about 1.7% of Taiwan's GDP. Taiwan's main crops
are rice, sugarcane, fruit, and vegetables. While largely self-sufficient in rice production,
Taiwan imports large amounts of wheat, corn, and soybeans, mostly from the United
States. Meat production (poultry and pork) and consumption are rising sharply, reflecting
a rising standard of living. Taiwan produces insignificant quantities of soybeans, corn,
and wheat and, in order to meet demand for animal feed and wheat-based consumer
products, Taiwan imports large amounts of these commodities, mostly from the United
States.

34
2.2.2 Hong Kong
Figure 6: Map of Hong Kong region
General Informationix
Occupied by the UK in 1841, Hong Kong was formally ceded by China the following
year; various adjacent lands were added later in the 19th century. Pursuant to an
agreement signed by China and the UK on 19 December 1984, Hong Kong became the
Hong Kong Special Administrative Region (SAR) of China on 1 July 1997. In this
agreement, China has promised that, under its "one country, two systems" formula,
China's socialist economic system will not be imposed on Hong Kong and that Hong
Kong will enjoy a high degree of autonomy in all matters except foreign and defense
affairs for the next 50 years.
35
Location
Eastern Asia, bordering the South China Sea and China
Area
Total: 1,098 sq km
Land: 1,042 sq km
Water: 50 sq km
Area-comparative: six times the size of Washington, DC
Population
6,940,432 (July 2006 estimated)
Population Growth Rate
0.59% (2006 estimated)
Government Type
Limited democracy
Economy
Hong Kong is one of the world's most open and dynamic economies. Hong Kong per
capita GDP is comparable to other developed countries. Real GDP expanded by 8.2% in
2004 year-on-year, driven by thriving exports, vibrant inbound tourism and strong pick
up of consumer spending. While severe acute respiratory syndrome (SARS) caused the
Hong Kong economy to shrink during the first half of 2003, second quarter real GDP
expanded by 3.2% year-on-year. Hong Kong experienced deflation from November
1998 until July 2004, when inflation reappeared at a 0.9% rate, measured year-on-year.
A slack property market has also contributed significantly to deflation. By mid-2003,
36
property prices had fallen 66% from their late 1997 peak, but have since rebounded by
about 58% from that lower base. The Hong Kong Government has generally resisted
pressure for large-scale public expenditures to stimulate the economy due to growing
public policy concerns with the government budget deficit. The surplus for fiscal year
2004-05 was $2.7 billion or 1.7% of GDP, attributed to the sales of government bonds
and notes.
Hong Kong enjoys a number of economic strengths, including accumulated public and
private wealth from decades of unprecedented growth, a sound banking system, virtually
no public debt, a strong legal system, and an able and rigorously enforced anti-corruption
regime. The need for economic restructuring poses difficult challenges and choices for
the government. Hong Kong is endeavoring to improve its attractiveness as a
commercial and trading center, especially after China's entry into the WTO, and
continues to refine its financial architecture. The government is deepening its economic
interaction with the Pearl River Delta in an effort to maintain Hong Kong's position as a
gateway to China. These efforts include the conclusion of a free trade agreement with
China, the Closer Economic Partnership Arrangement (CEPA), which applies zero tariffs
to all Hong Kong-origin goods and preferential treatment in 27 service sectors. Hong
Kong, along with the Macau SAR, is also participating in a new pan-Pearl River Delta
trade block with nine Chinese provinces, which aims to lower trade barriers among
members, standardize regulations, and improve infrastructure. U.S. companies have a
generally favorable view of Hong Kong's business environment, including its legal
system and the free flow of information, low taxation, and infrastructure. The American
Chamber of Commerce's annual business confidence survey, released in December 2005,
showed 98% of respondents had a "good" or "satisfactory" outlook for 2006. Survey
results indicated a positive economic outlook through 2008.
On the international front, Hong Kong is a separate and active member of the World
Trade Organization (WTO) and the Asia Pacific Economic Cooperation (APEC) forum,
where it is an articulate and effective champion of free markets and the reduction of trade
barriers. Hong Kong residents across the political spectrum supported China's accession

37
to the WTO, believing this would open new opportunities on the Mainland for local firms
and stabilize relations between Hong Kong's two most important trade and investment
partners, the United States and China.

38
2.2.3 Japan
Figure 7: Map of Japan region
General Informationx
In 1603, a Tokugawa Shogunate (military dictatorship) ushered in a long period of
isolation from foreign influence in order to secure its power. For 250 years this policy
enabled Japan to enjoy stability and a flowering of its indigenous culture. Following the
Treaty of Kanagawa with the US in 1854, Japan opened its ports and began to intensively
modernize and industrialize. During the late 19th and early 20th centuries, Japan became
a regional power that was able to defeat the forces of both China and Russia. It occupied
Korea, Formosa (Taiwan), and southern Sakhalin Island. In 1933 Japan occupied
Manchuria, and in 1937 it launched a full-scale invasion of China. Japan attacked US
forces in 1941 - triggering America's entry into World War II - and soon occupied much
of East and Southeast Asia. After its defeat in World War II; Japan recovered to become
an economic power and a staunch ally of the US. While the emperor retains his throne as

39
a symbol of national unity, actual power rests in networks of powerful politicians,
bureaucrats, and business executives. The economy experienced a major slowdown
starting in the 1990s following three decades of unprecedented growth, but Japan still
remains a major economic power, both in Asia and globally. In 2005, Japan began a two-
year term as a non-permanent member of the UN Security Council.
Location
Eastern Asia, island chain between the North Pacific Ocean and the Sea of Japan, east of
the Korean Peninsula
Area
Total: 377,835 sq km
Land: 374,744 sq km
Water: 3,091 sq km
Area-comparative: slightly smaller than California
Population
127,463,611 (July 2006 estimated)
Population Growth Rate
0.02% (2006 estimated)
Government Type
Constitutional monarchy with a parliamentary government
40
Economy
Japan's industrialized, free market economy is the second-largest in the world. Its
economy is highly efficient and competitive in areas linked to international trade, but
productivity is far lower in areas such as agriculture, distribution, and services. After
achieving one of the highest economic growth rates in the world from the 1960s through
the 1980s, the Japanese economy slowed dramatically in the early 1990s, when the
"bubble economy" collapsed.
Japan's reservoir of industrial leadership and technicians, well-educated and industrious
work force, high savings and investment rates, and intensive promotion of industrial
development and foreign trade has produced a mature industrial economy. Japan has few
natural resources, and trade helps it earn the foreign exchange needed to purchase raw
materials for its economy.
While Japan's long-term economic prospects are considered good, Japan is currently in its
worst period of economic growth since World War II. Plummeting stock and real estate
prices in the early 1990s marked the end of the "bubble economy." The impact of the
Asian financial crisis of 1997-98 also was substantial. Real GDP in Japan grew at an
average of roughly 1% yearly in the 1990s, compared to growth in the 1980s of about 4%
per year. Real growth in 2003 was 2.7%. The agricultural economy is highly subsidized
and protected even when only 15% of Japan's land is suitable for cultivation. With per
hectare crop yields among the highest in the world, Japan maintains an overall
agricultural self-sufficiency rate of about 50% on fewer than 5.6 million cultivated
hectares (14 million acres). Japan normally produces a slight surplus of rice but imports
large quantities of wheat, sorghum, and soybeans, primarily from the United States. Japan
is the largest market for U.S. agricultural exports.
Given its heavy dependence on imported energy, Japan has aimed to diversify its sources.
Since the oil shocks of the 1970s, Japan has reduced dependence on petroleum as a
source of energy from more than 75% in 1973 to about 57% at present. Other important
41
energy sources are coal, liquefied natural gas, nuclear power, and hydropower. Deposits
of gold, magnesium, and silver meet current industrial demands, but Japan are dependent
on foreign sources for many of the minerals essential to modern industry. Iron ore, coke,
copper, and bauxite must be imported, as must many forest products.
42
2.3 Brief Summary
The reason why air pollution is important and hazardous is because the effects spread
worldwide and involve to every single person on this planet. The reason why there is a
need to study pollution is because such problem is not easy to be prevent and it is hard to
be solved. Browsing through the pollutant sources, it is obvious that all sources are
directly related and definitely necessary in our lives. Once the pollution is acute enough
to involve the atmosphere, where it is globally connected, the negative effects will spread
throughout the whole world. Since air is gaseous, it can not be simply cleaned; which is
why such smog problem has been critical for so many years and still can not be directly
cured. Though, as the research of pollutant characteristics concludes that the most
critical and major process to produce all contaminants is by the combustion of lead, coal,
and sulfur-containing oil. Such sources are commonly found in industrial and vehicular
fuel. Therefore, emission of vehicle and industries and every burning action are the
thresholds of air pollutant prevention.
Transportations are so convenient that it is absolutely impossible to live without them. In
the recent years, the amount of vehicles or any type of transportation is directly
proportion to the population throughout a nation. Prior to the three regions (Taiwan,
Hong Kong, Japan) introduced, Hong Kong happens to have the highest density of
population vs. area, which means the number of people using transportations could be a
critical problem that causes air pollution. Consequently, Taiwan and Japan do both have
high population, so vehicle emission is also a significant resource of pollutants. On the
other hand, Taiwan and Japan have higher economy concentration in manufacturing
industries, which is secondary relative to combustion in every type of fuel. For this
reason, Taiwan and Japan will likely to be aware of industrial emission control.
43
3. Methodology
Background information, which is sectored in Chapter 2, was constructed as for a lead- in
of the project, and introduction of the priority issue, air pollution. The air pollution
general knowledge section is specially made for the purpose of understanding air
pollution problems. The initial step is to state the definition of air pollution in general;
then, since air pollution is considered as an environmental problem, it can be analyzed by
identify its costs and effects. Air pollution is a fact of chemical reaction based on an
exceeding amount of certain particulates. These “certain particulates” are the causation
of air pollution, so known as the pollutants. Therefore, the objective is to identify all
pollutants and describe their characteristics. In order to create a better path of generating
the preventing method, further information of pollutant source is provided so the idea of
what the pollutants are and where it can be found is clear. On the other hand, air
pollution is critical and important because it has the influence on human health. For this
reason, the identification of human health effect description is necessary and required as
air pollution introduction. Critical effects in the present environment, such as smog, acid
rain, etc. should also be state and explained in detail for air quality awareness information
and future prevention objective.
The goal of this project is to provide suggestions on solving air pollution problems by
seeking methods from the three most advanced and civilized regions in Asia: Taiwan,
Hong Kong, and Japan; compare the methods and generate the suggested solution. Prior
to the comparison, the introduction of each region is significant and helpful. Since air
pollution flows with the structure of economic industry and dense population, it is
necessary to describe how different the economies are in these three regions and
identifies the status of population. For further introduction base on the difference
between these regions, it was found helpful to gather data of pollutant standards, which in
this case is named the air pollution index. The Air Pollution Index (API) is a simple way
of describing air pollution levels to provide timely information about air pollution to the
public and to enhance awareness. Air pollution index contains information of pollutant
44
standards published by the regions. Through the information of pollutant standard index,
there is a better understanding of pollution issues that the regions are confronting.
Up until this point, the introduction and basic knowledge description are all being settled.
Next part is the research corresponding to the project goal: seeking methods from the
three regions; compare the methods and generate the suggested solution. The substance
of this project maintains two types of solutions; the first one is technical solution, and the
second one is solution based on government policy. Technical solution, obviously, is
defined as the technology used to reduce pollutant, clean up the air, or anything that can
improve the air quality. Speaking of technology, other than being the solution of air
pollution issue, technical methods of detecting the air quality is also significant for the
project. The monitoring system is one of the most convenient and efficient detecting
machine. Without the detector of air quality, it could hardly notice how bad the
environment has been damaged. Such technology has been defined and used wisely as
the monitoring system. By setting up the monitoring system extensively, it is then easier
to realize where exactly the pollutant has gone more hazardous; hence, to increase air
quality control. Base on the different needs in each region, which were mentioned in air
pollution index; there will be different types and purposes for each technology. The
objective is to explain the technology and state the usage. The prior comparisons will be
made beyond the similar product measuring how much the air quality has improved by
such technology. Since most of the technology will maintain close usages, at least
Taiwanese and Japanese ones will; the secondary comparison will be based on the
efficiency and convenience of the technology. Throughout the detail statements of
technologies and comparison, it provides a clear and significant suggestion of technical
solutions which could be considered using in other Asian countries.
Similarly, base on the different needs in each region, the government policy legislated for
air quality control will be distinct. Even though the objective for Taiwan and Japan is
similar, due to the government type and different level of political restriction, the policies
can be possibly set up completely contrary. For this reason, the objective is to state the
regulations clearly for each region. Though, policies opposite from regulation are found
45
to be one other helpful political solution for air quality control. Such policy is called
promotion. By research, it is clearly seen that promotion is one easily accepted policy.
In this case, it secondary increases the efficient of pollutant control by policies. Thus,
comparison will be based on distinct regulation intentions, restrictions, and promotions in
order to represent the best air quality control method.
Throughout the completion of all introductions and comparisons, the project reaches the
purpose of first provide the understanding for air pollution, then provide suggestions on
solving air pollution problems by seeking methods from the three most advanced and
civilized regions in Asia: Taiwan, Hong Kong, and Japan; compare the methods and
generate the suggested solution.
46
4. Result
Chapter 4 contains all research results of historical information, technology, and
government policy. Historical information contains air pollution index from each region
and improvements throughout the past tenth years. The technology section in this chapter
is mainly to introduce methods or procedures used utilized in the present time. Further
information of air quality detector, which is known as the monitoring system, is also
introduced and compared within the technology section. The last comparison is based on
government policy announced throughout each region. However, the comparison of
government policy is slightly different from the technology section. Comparison of
technology is to conclude the best and highest-efficient methods beyond all applications,
where the comparison of government policy can only state the idea of regulations based
on different concentrations for the pollutant restriction.

47
4.1 Historical Information
The following section introduces all air pollution related index of each section. Based on
the research of pollution index throughout each one of the region, the most common and
useful information is called the Pollutant Standard Index. The Pollutant Standard Index
overall identifies the pollutant standard, which also represents the individual
concentration and requirement from each region. Based on the knowledge of the region’s
pollutant standards, the section also provides the air quality improvement made within
the past tenth years. The improvement part is demanded for comparisons on technology
and government policies in the section after, since the technology or policy is only useful
when there is an actual improvement occurs.
4.1.1 Taiwan
Air Pollution Index
To let the public better understand the air quality, the monitoring data is transformed to
the Pollutant Standards Index (PSI). The monitoring data used to calculate the index is
based on the criteria pollutants, i.e., PM10, SO2, NO2, CO, and O3. For each pollutant, a
sub- index is calculated from a segmented linear function that transforms ambient
concentrations onto a scale ranging from 0 to 500. The PSI is calculated as the maximum
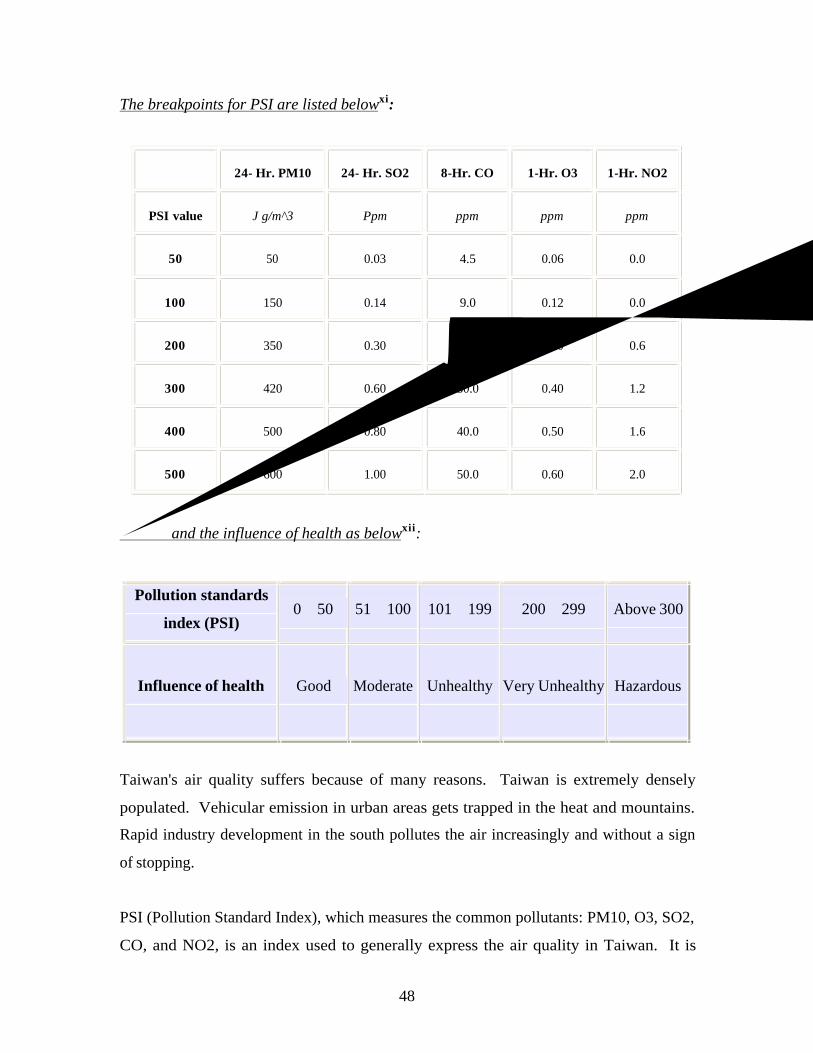
of sub-index. The index range and descriptor category are as follows:
0 to 50............................................"Good"
51 to 100........................................"Moderate"
101 to 199......................................"Unhealthy"
200 to 299......................................"Very Unhealthy"
300 to above.................................."Hazardous"
48
The breakpoints for PSI are listed belowxi:
24- Hr. PM10 24- Hr. SO2 8-Hr. CO 1-Hr. O3 1-Hr. NO2
PSI value J g/m^3 Ppm ppm ppm ppm
50 50 0.03 4.5 0.06 0.0
100 150 0.14 9.0 0.12 0.0
200 350 0.30 15.0 0.20 0.6
300 420 0.60 30.0 0.40 1.2
400 500 0.80 40.0 0.50 1.6
500 600 1.00 50.0 0.60 2.0
PSI and the influence of health as belowxii:
Pollution standards
index (PSI) 0∼ 50 51∼ 100 101∼ 199 200∼ 299 Above 300
Influence of health Good Moderate Unhealthy Very Unhealthy Hazardous
Taiwan's air quality suffers because of many reasons. Taiwan is extremely densely
populated. Vehicular emission in urban areas gets trapped in the heat and mountains.
Rapid industry development in the south pollutes the air increasingly and without a sign
of stopping.
PSI (Pollution Standard Index), which measures the common pollutants: PM10, O3, SO2,
CO, and NO2, is an index used to generally express the air quality in Taiwan. It is
49
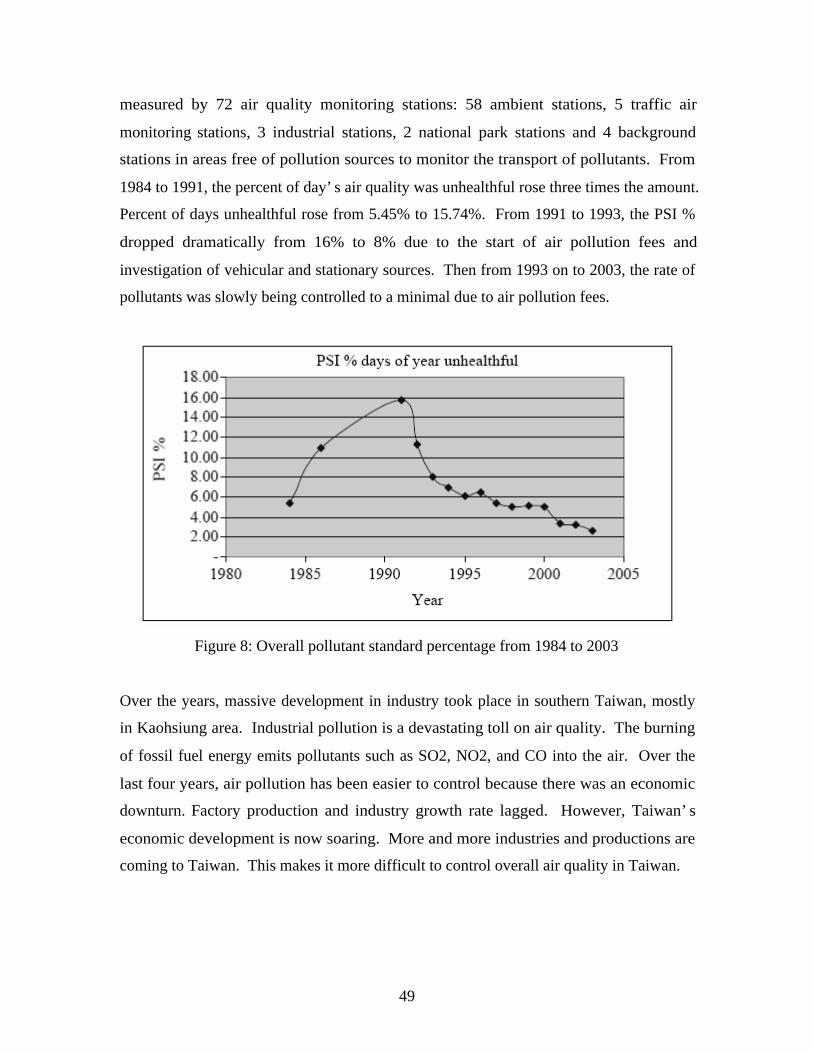
measured by 72 air quality monitoring stations: 58 ambient stations, 5 traffic air
monitoring stations, 3 industrial stations, 2 national park stations and 4 background
stations in areas free of pollution sources to monitor the transport of pollutants. From
1984 to 1991, the percent of day’s air quality was unhealthful rose three times the amount.
Percent of days unhealthful rose from 5.45% to 15.74%. From 1991 to 1993, the PSI %
dropped dramatically from 16% to 8% due to the start of air pollution fees and
investigation of vehicular and stationary sources. Then from 1993 on to 2003, the rate of
pollutants was slowly being controlled to a minimal due to air pollution fees.
Figure 8: Overall pollutant standard percentage from 1984 to 2003
Over the years, massive development in industry took place in southern Taiwan, mostly
in Kaohsiung area. Industrial pollution is a devastating toll on air quality. The burning
of fossil fuel energy emits pollutants such as SO2, NO2, and CO into the air. Over the
last four years, air pollution has been easier to control because there was an economic
downturn. Factory production and industry growth rate lagged. However, Taiwan’s
economic development is now soaring. More and more industries and productions are
coming to Taiwan. This makes it more difficult to control overall air quality in Taiwan.
50
Air Quality Improvementxiii
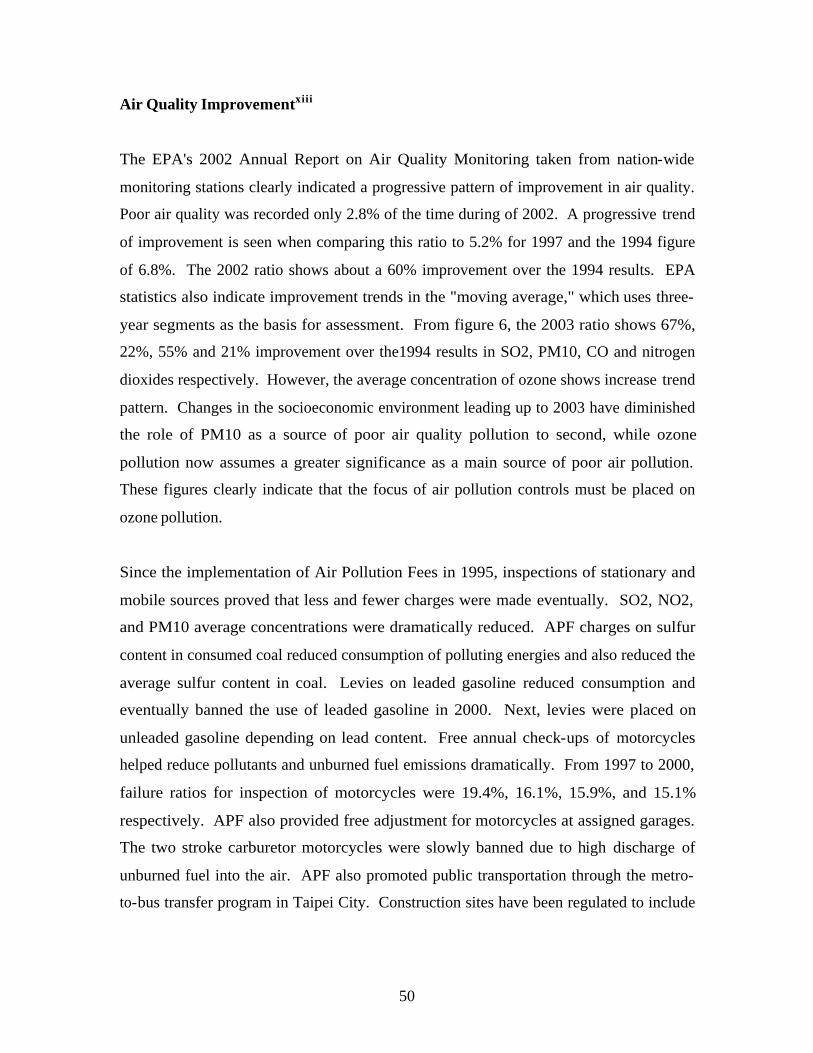
The EPA's 2002 Annual Report on Air Quality Monitoring taken from nation-wide
monitoring stations clearly indicated a progressive pattern of improvement in air quality.
Poor air quality was recorded only 2.8% of the time during of 2002. A progressive trend
of improvement is seen when comparing this ratio to 5.2% for 1997 and the 1994 figure
of 6.8%. The 2002 ratio shows about a 60% improvement over the 1994 results. EPA
statistics also indicate improvement trends in the "moving average," which uses three-
year segments as the basis for assessment. From figure 6, the 2003 ratio shows 67%,
22%, 55% and 21% improvement over the1994 results in SO2, PM10, CO and nitrogen
dioxides respectively. However, the average concentration of ozone shows increase trend
pattern. Changes in the socioeconomic environment leading up to 2003 have diminished
the role of PM10 as a source of poor air quality pollution to second, while ozone
pollution now assumes a greater significance as a main source of poor air pollution.
These figures clearly indicate that the focus of air pollution controls must be placed on
ozone pollution.
Since the implementation of Air Pollution Fees in 1995, inspections of stationary and
mobile sources proved that less and fewer charges were made eventually. SO2, NO2,
and PM10 average concentrations were dramatically reduced. APF charges on sulfur
content in consumed coal reduced consumption of polluting energies and also reduced the
average sulfur content in coal. Levies on leaded gasoline reduced consumption and
eventually banned the use of leaded gasoline in 2000. Next, levies were placed on
unleaded gasoline depending on lead content. Free annual check-ups of motorcycles
helped reduce pollutants and unburned fuel emissions dramatically. From 1997 to 2000,
failure ratios for inspection of motorcycles were 19.4%, 16.1%, 15.9%, and 15.1%
respectively. APF also provided free adjustment for motorcycles at assigned garages.
The two stroke carburetor motorcycles were slowly banned due to high discharge of
unburned fuel into the air. APF also promoted public transportation through the metro-
to-bus transfer program in Taipei City. Construction sites have been regulated to include
51
vehicle washing facilities and other control measures to keep suspended particulates
under control.
Figure 9: SO2, NO2, O3 concentration from 1994 to 2004
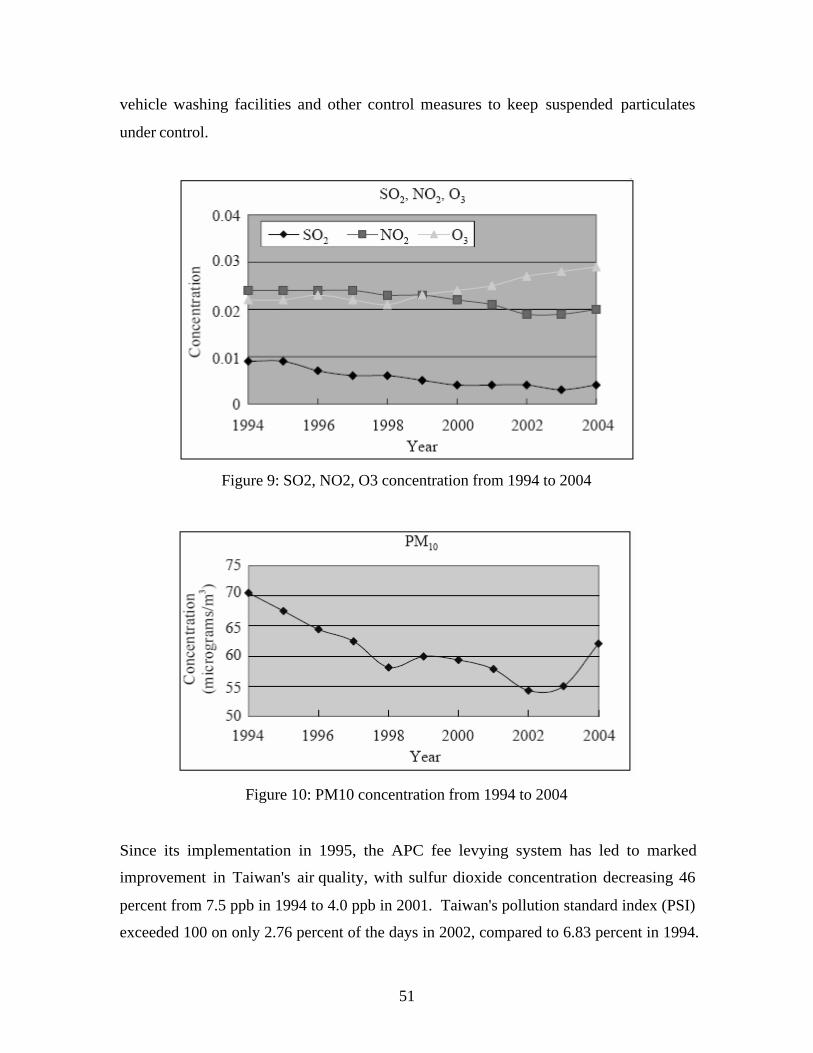
Figure 10: PM10 concentration from 1994 to 2004
Since its implementation in 1995, the APC fee levying system has led to marked
improvement in Taiwan's air quality, with sulfur dioxide concentration decreasing 46
percent from 7.5 ppb in 1994 to 4.0 ppb in 2001. Taiwan's pollution standard index (PSI)
exceeded 100 on only 2.76 percent of the days in 2002, compared to 6.83 percent in 1994.
52
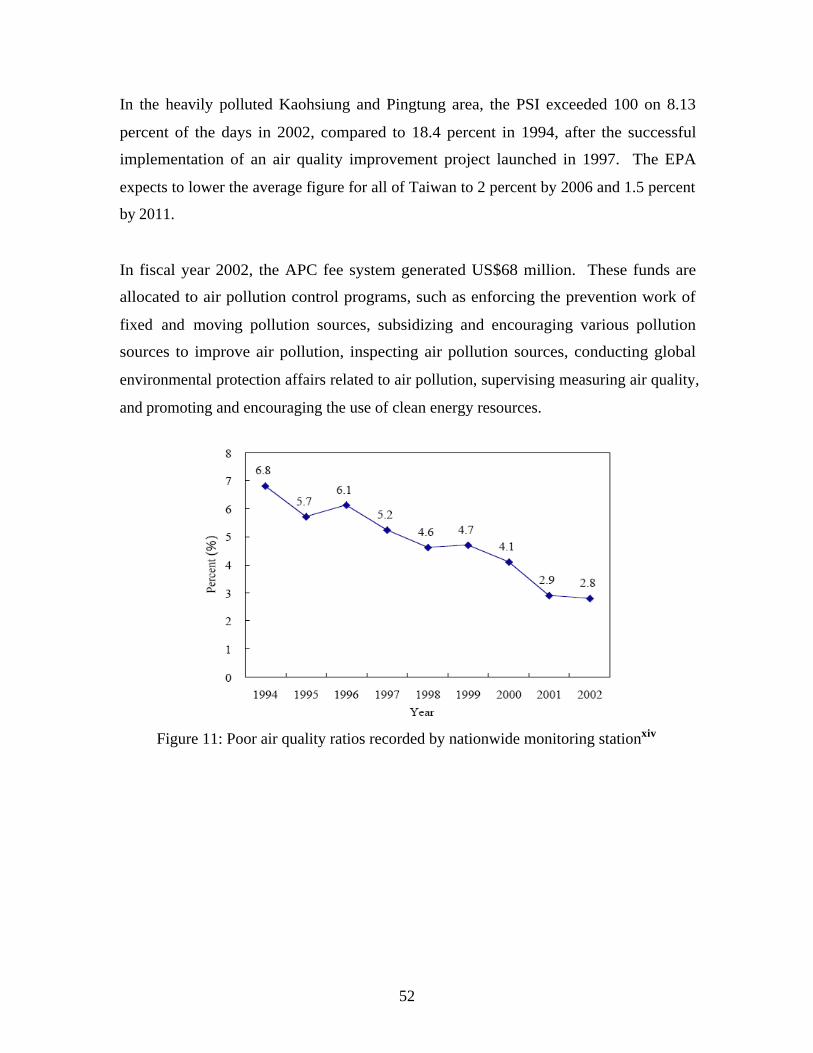
In the heavily polluted Kaohsiung and Pingtung area, the PSI exceeded 100 on 8.13
percent of the days in 2002, compared to 18.4 percent in 1994, after the successful
implementation of an air quality improvement project launched in 1997. The EPA
expects to lower the average figure for all of Taiwan to 2 percent by 2006 and 1.5 percent
by 2011.
In fiscal year 2002, the APC fee system generated US$68 million. These funds are
allocated to air pollution control programs, such as enforcing the prevention work of
fixed and moving pollution sources, subsidizing and encouraging various pollution
sources to improve air pollution, inspecting air pollution sources, conducting global
environmental protection affairs related to air pollution, supervising measuring air quality,
and promoting and encouraging the use of clean energy resources.
Figure 11: Poor air quality ratios recorded by nationwide monitoring stationxiv
53
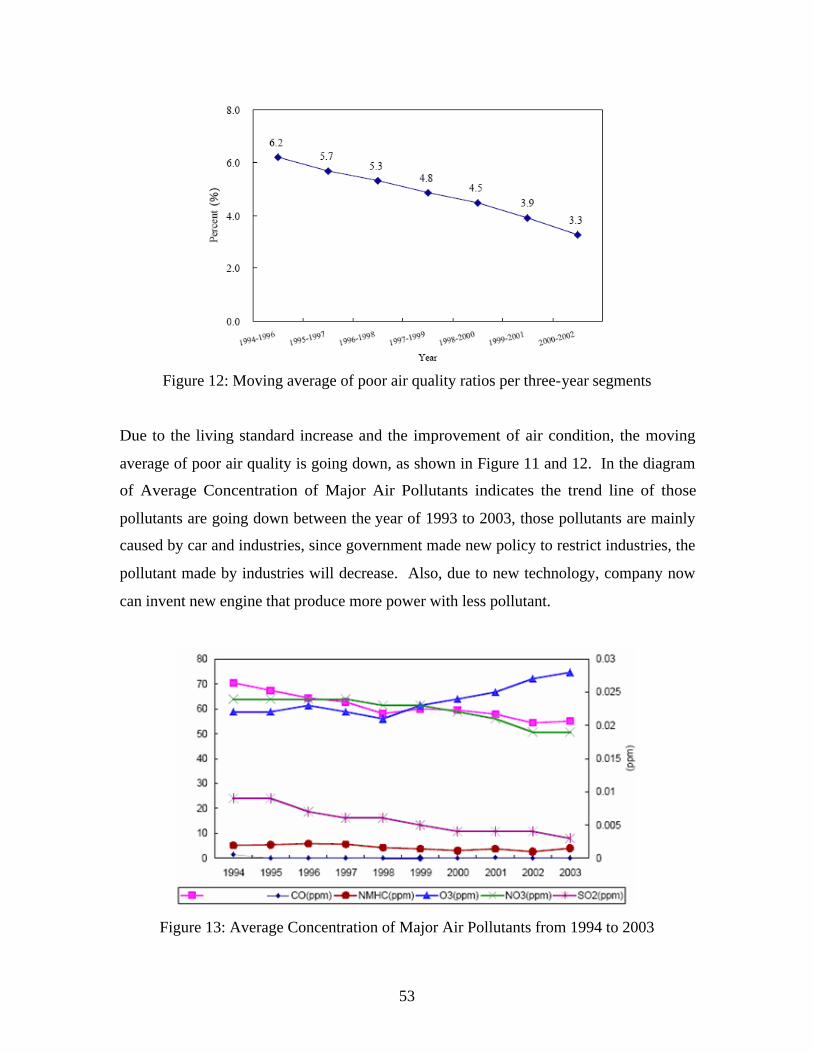
Figure 12: Moving average of poor air quality ratios per three-year segments
Due to the living standard increase and the improvement of air condition, the moving
average of poor air quality is going down, as shown in Figure 11 and 12. In the diagram
of Average Concentration of Major Air Pollutants indicates the trend line of those
pollutants are going down between the year of 1993 to 2003, those pollutants are mainly
caused by car and industries, since government made new policy to restrict industries, the
pollutant made by industries will decrease. Also, due to new technology, company now
can invent new engine that produce more power with less pollutant.
Figure 13: Average Concentration of Major Air Pollutants from 1994 to 2003
54
4.1.2 Hong Kong
Air Pollution Index
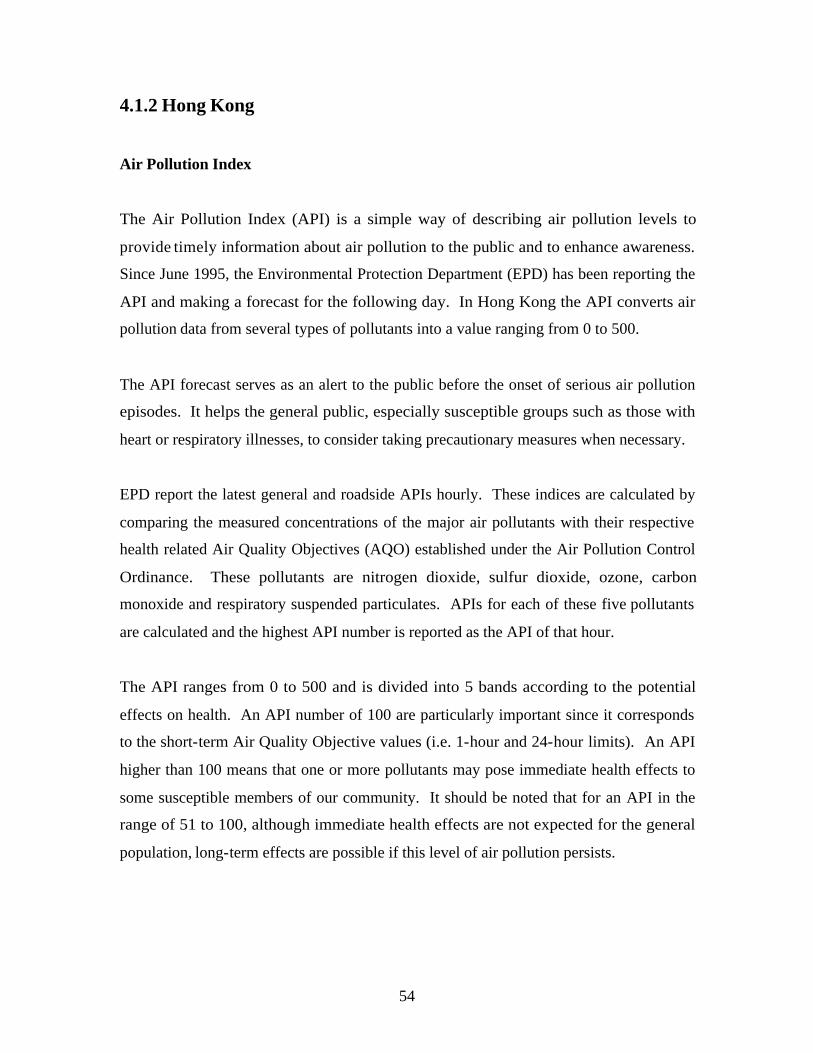
The Air Pollution Index (API) is a simple way of describing air pollution levels to
provide timely information about air pollution to the public and to enhance awareness.
Since June 1995, the Environmental Protection Department (EPD) has been reporting the
API and making a forecast for the following day. In Hong Kong the API converts air
pollution data from several types of pollutants into a value ranging from 0 to 500.
The API forecast serves as an alert to the public before the onset of serious air pollution
episodes. It helps the general public, especially susceptible groups such as those with
heart or respiratory illnesses, to consider taking precautionary measures when necessary.
EPD report the latest general and roadside APIs hourly. These indices are calculated by
comparing the measured concentrations of the major air pollutants with their respective
health related Air Quality Objectives (AQO) established under the Air Pollution Control
Ordinance. These pollutants are nitrogen dioxide, sulfur dioxide, ozone, carbon
monoxide and respiratory suspended particulates. APIs for each of these five pollutants
are calculated and the highest API number is reported as the API of that hour.
The API ranges from 0 to 500 and is divided into 5 bands according to the potential
effects on health. An API number of 100 are particularly important since it corresponds
to the short-term Air Quality Objective values (i.e. 1-hour and 24-hour limits). An API
higher than 100 means that one or more pollutants may pose immediate health effects to
some susceptible members of our community. It should be noted that for an API in the
range of 51 to 100, although immediate health effects are not expected for the general
population, long-term effects are possible if this level of air pollution persists.
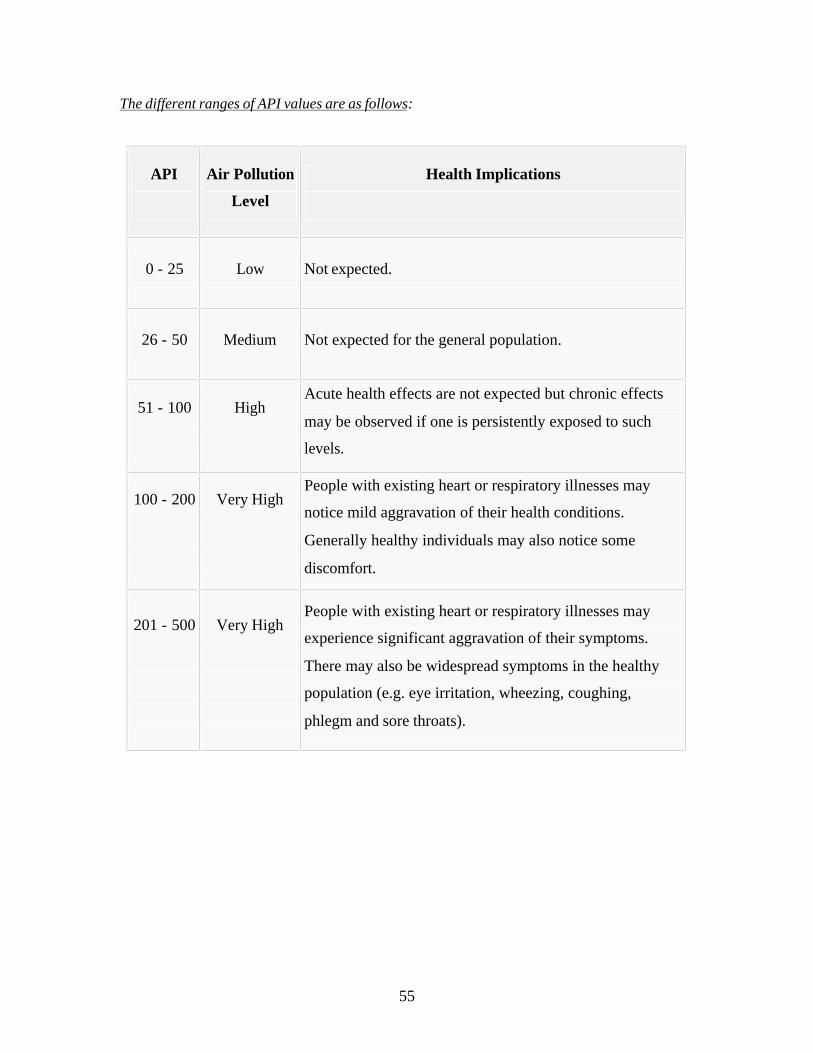
55
The different ranges of API values are as follows:
API
Air Pollution
Level
Health Implications
0 - 25 Low Not expected.
26 - 50 Medium Not expected for the general population.
51 - 100
High
Acute health effects are not expected but chronic effects
may be observed if one is persistently exposed to such
levels.
100 - 200
Very High
People with existing heart or respiratory illnesses may
notice mild aggravation of their health conditions.
Generally healthy individuals may also notice some
discomfort.
201 - 500
Very High
People with existing heart or respiratory illnesses may
experience significant aggravation of their symptoms.
There may also be widespread symptoms in the healthy
population (e.g. eye irritation, wheezing, coughing,
phlegm and sore throats).
56
Air Quality Improvementxv
Hong Kong has achieved good progress in reducing the total emissions of nitrogen
dioxides (NOx), and VOC. For SO2, however, much of the effort has been vitiated by
the increase in emissions from the local power plants. Details are presented in the table
shown below –
Target to achieve for emissions reduction in 2010
Emission Level
in 1997 (tones)
Emission Level
in 2003 (tones)
Changes in
Emission Level
during 1997-
2003
Reduction
Target for
2010
SO2 64,500 90,900 +41% -40%
NOx 110,000 96,600 -12% -20%
VOC 54,400 41,800 -23% -55%
Road transport, as the second major source of emissions, accounted for about 21%, 28%,
and 17% of total NOx, and VOC respectively in 2003. Compared with 1997, vehicular
emissions of SO2, NOx, and VOC in Hong Kong have been reduced by 93%, 35%, 60%
and 46% respectively by the end of 2003. Between 1999 and 2004, the NOx levels as
measured at roadside decreased by 9% and 24% respectively. The number of smoky
vehicles also has dropped by 80% during the same period.
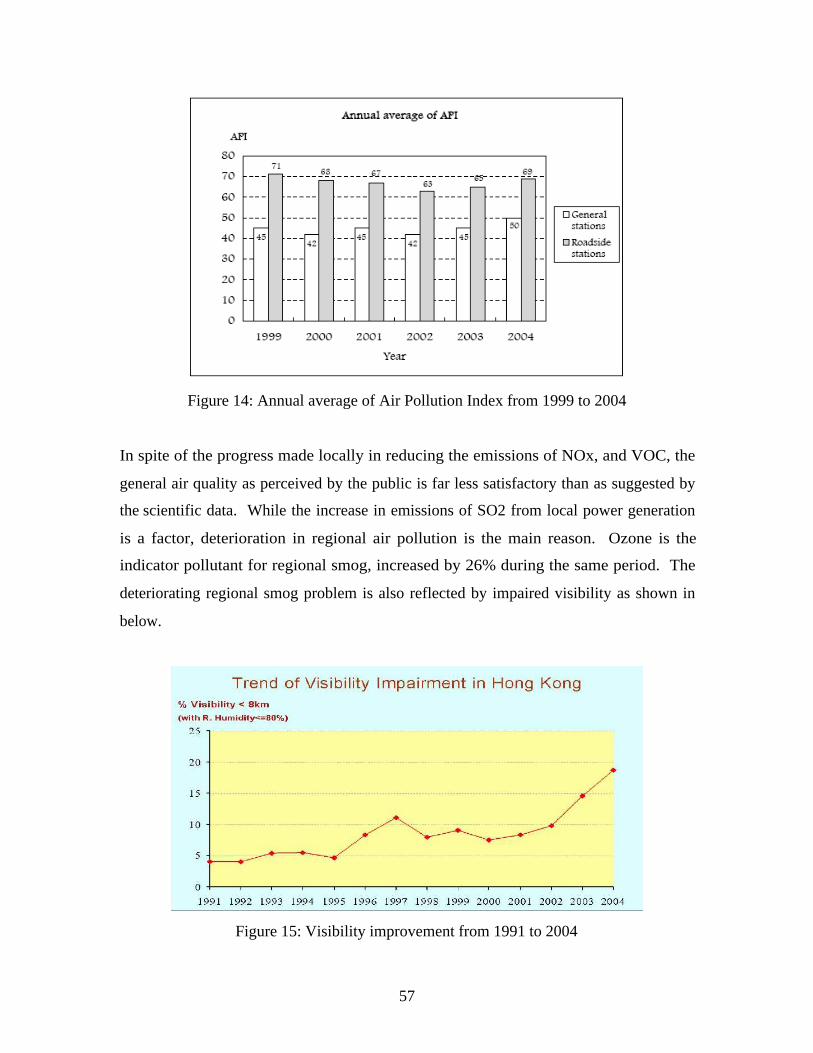
57
Figure 14: Annual average of Air Pollution Index from 1999 to 2004
In spite of the progress made locally in reducing the emissions of NOx, and VOC, the
general air quality as perceived by the public is far less satisfactory than as suggested by
the scientific data. While the increase in emissions of SO2 from local power generation
is a factor, deterioration in regional air pollution is the main reason. Ozone is the
indicator pollutant for regional smog, increased by 26% during the same period. The
deteriorating regional smog problem is also reflected by impaired visibility as shown in
below.
Figure 15: Visibility improvement from 1991 to 2004
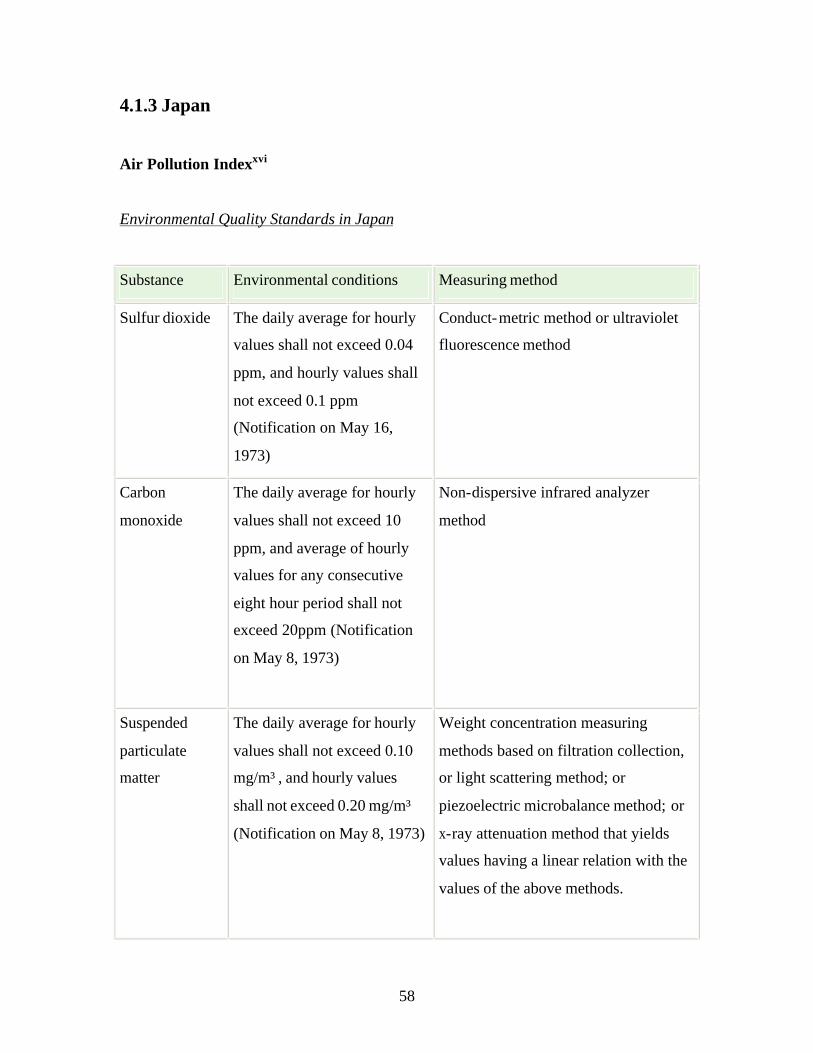
58
4.1.3 Japan
Air Pollution Indexxvi
Environmental Quality Standards in Japan
Substance Environmental conditions Measuring method
Sulfur dioxide The daily average for hourly
values shall not exceed 0.04
ppm, and hourly values shall
not exceed 0.1 ppm
(Notification on May 16,
1973)
Conduct-metric method or ultraviolet
fluorescence method
Carbon
monoxide
The daily average for hourly
values shall not exceed 10
ppm, and average of hourly
values for any consecutive
eight hour period shall not
exceed 20ppm (Notification
on May 8, 1973)
Non-dispersive infrared analyzer
method
Suspended
particulate
matter
The daily average for hourly
values shall not exceed 0.10
mg/m³, and hourly values
shall not exceed 0.20 mg/m³
(Notification on May 8, 1973)
Weight concentration measuring
methods based on filtration collection,
or light scattering method; or
piezoelectric microbalance method; or
x-ray attenuation method that yields
values having a linear relation with the
values of the above methods.
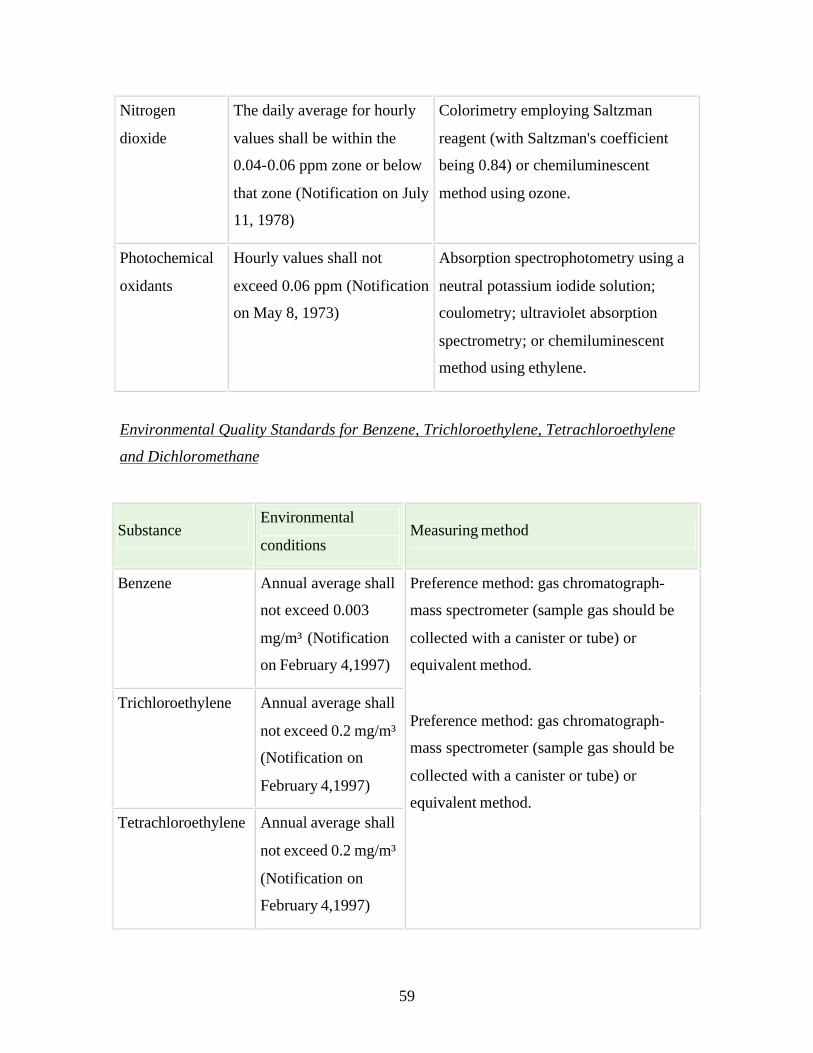
59
Nitrogen
dioxide
The daily average for hourly
values shall be within the
0.04-0.06 ppm zone or below
that zone (Notification on July
11, 1978)
Colorimetry employing Saltzman
reagent (with Saltzman's coefficient
being 0.84) or chemiluminescent
method using ozone.
Photochemical
oxidants
Hourly values shall not
exceed 0.06 ppm (Notification
on May 8, 1973)
Absorption spectrophotometry using a
neutral potassium iodide solution;
coulometry; ultraviolet absorption
spectrometry; or chemiluminescent
method using ethylene.
Environmental Quality Standards for Benzene, Trichloroethylene, Tetrachloroethylene
and Dichloromethane
Substance Environmental
conditions Measuring method
Benzene Annual average shall
not exceed 0.003
mg/m³ (Notification
on February 4,1997)
Trichloroethylene Annual average shall
not exceed 0.2 mg/m³
(Notification on
February 4,1997)
Tetrachloroethylene Annual average shall
not exceed 0.2 mg/m³
(Notification on
February 4,1997)
Preference method: gas chromatograph-
mass spectrometer (sample gas should be
collected with a canister or tube) or
equivalent method.
Preference method: gas chromatograph-
mass spectrometer (sample gas should be
collected with a canister or tube) or
equivalent method.
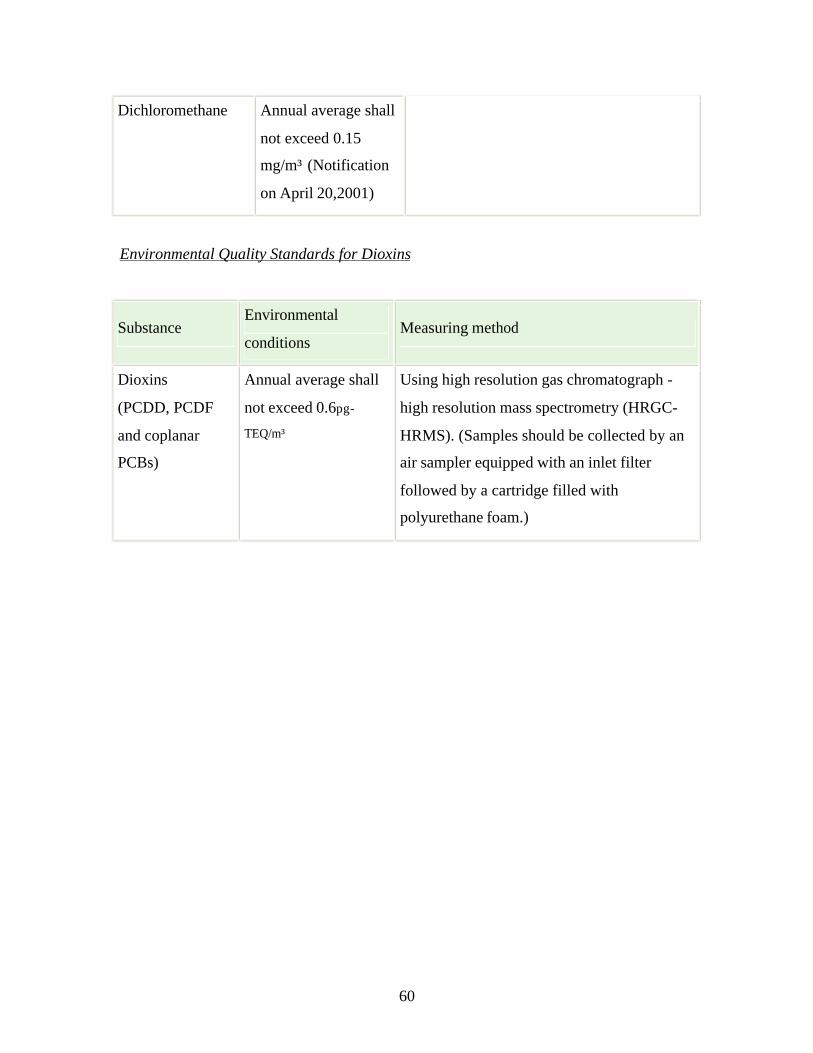
60
Dichloromethane Annual average shall
not exceed 0.15
mg/m³ (Notification
on April 20,2001)
Environmental Quality Standards for Dioxins
Substance Environmental
conditions Measuring method
Dioxins
(PCDD, PCDF
and coplanar
PCBs)
Annual average shall
not exceed 0.6pg-
TEQ/m³
Using high resolution gas chromatograph -
high resolution mass spectrometry (HRGC-
HRMS). (Samples should be collected by an
air sampler equipped with an inlet filter
followed by a cartridge filled with
polyurethane foam.)

61
Air Quality Improvementxvii
The Ministry of the Environment published the air pollution monitoring results in 2003.
In accordance with the Air Pollution Control Law, state of air pollution is constantly
monitored throughout Japan at 2,101 monitoring stations by ordinance-designated
municipal governments. As of March 31, 2004, there are 1,660 ambient air pollution
monitoring stations (hereinafter referred to as the "APMS") and 441 roadside air
pollution monitoring stations (hereinafter referred to as the "RAPMS").
Nitrogen dioxides (NO2)
The environmental quality standard (EQS) achievement rate of NO2 is relatively high just
like year 2002. The achievement rate is 99.9% for APMS and 85.7% for RAPMS. It
improved slightly compared to 2002 (99.1% for APMS and 83.5% for RAPMS), shown
in Table 1 and Figure 17. There is no major change in the annual average, as Figure 18
shows. Note that Figure 16 is an average result taken from continued monitoring stations.
As the result shows, the pollutant nitrogen dioxide has not declined because of the
continued growth in automobile use.
Figure 16: Annual average NO2 concentration

Table 1: Annual environmental quality standard achievement rate for nitrogen dioxides
Figure 17: Annual achievement rate of environmental quality standard for nitrogen dioxide
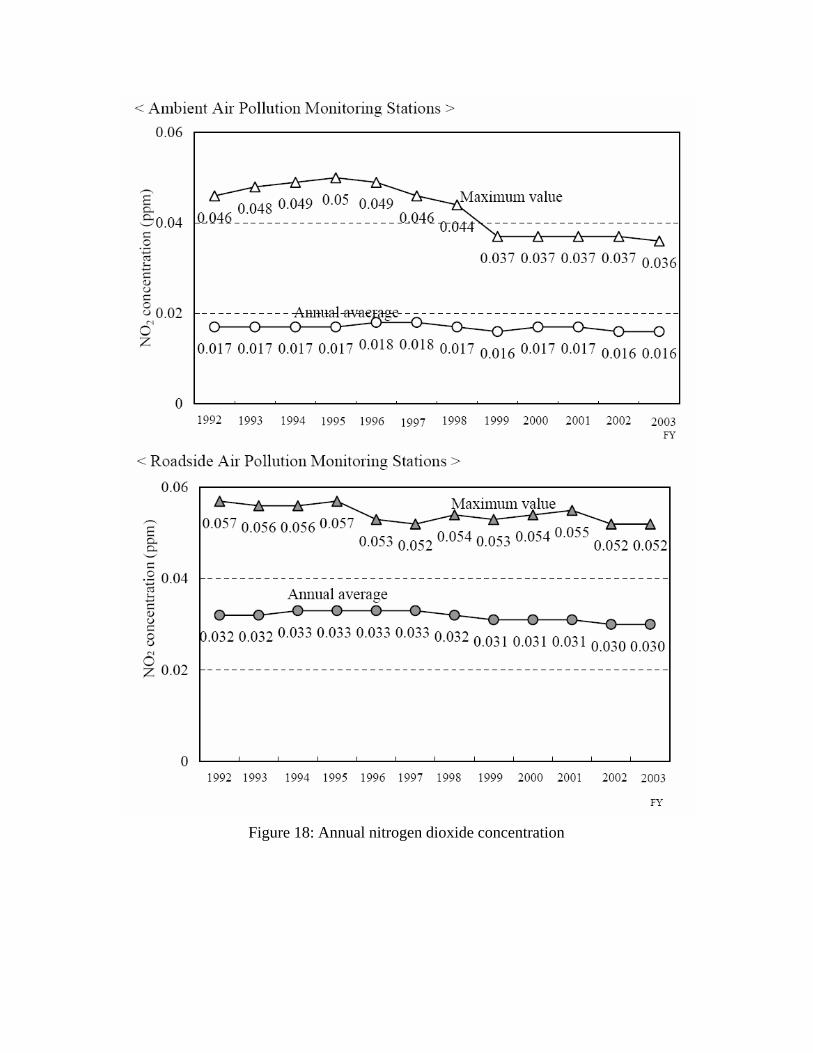
Figure 18: Annual nitrogen dioxide concentration
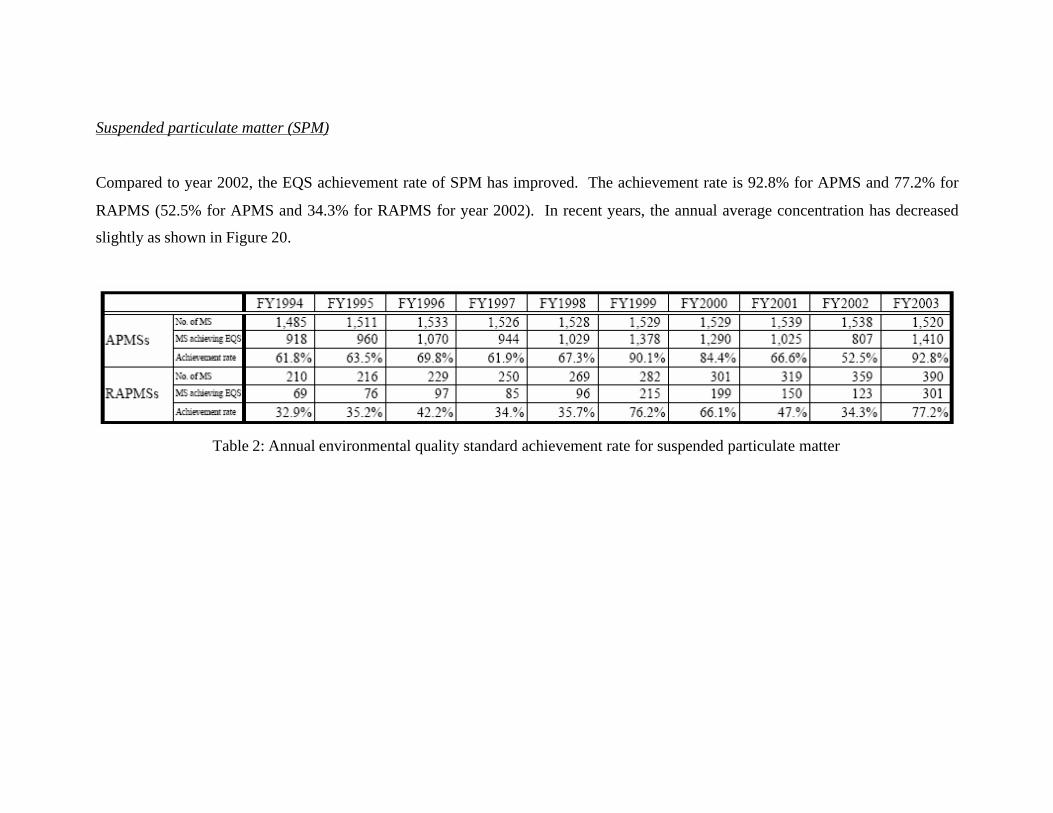
Suspended particulate matter (SPM)
Compared to year 2002, the EQS achievement rate of SPM has improved. The achievement rate is 92.8% for APMS and 77.2% for
RAPMS (52.5% for APMS and 34.3% for RAPMS for year 2002). In recent years, the annual average concentration has decreased
slightly as shown in Figure 20.
Table 2: Annual environmental quality standard achievement rate for suspended particulate matter
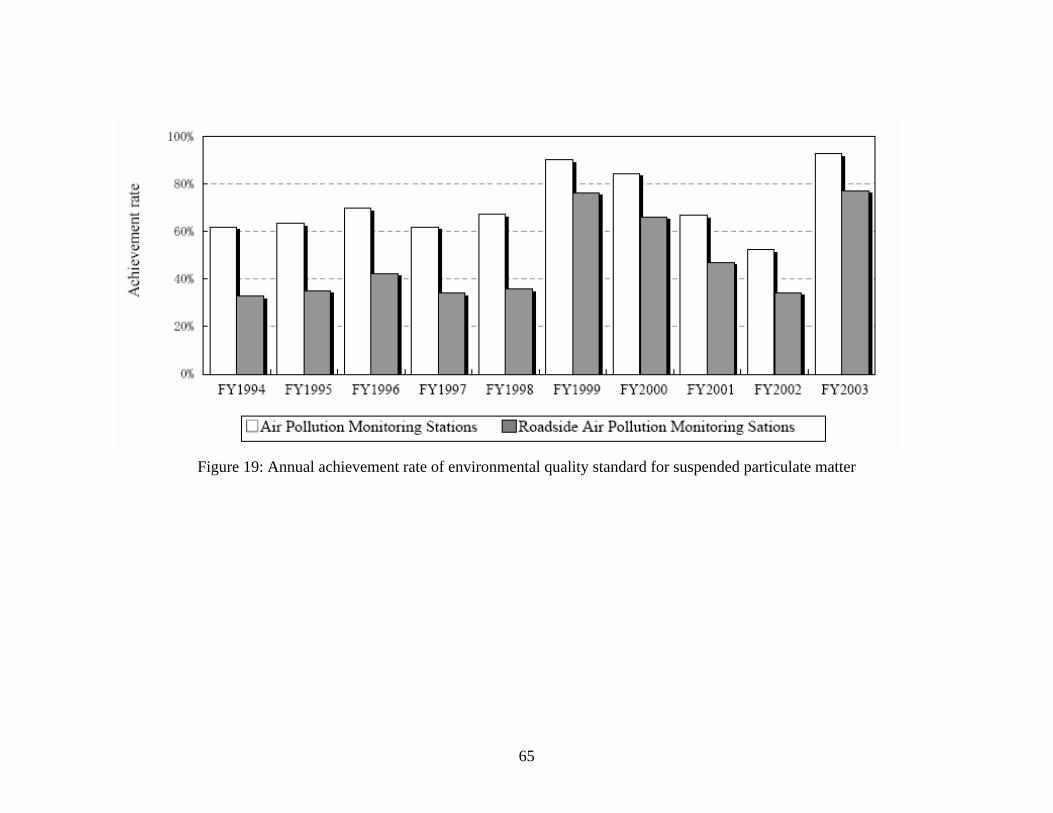
65
Figure 19: Annual achievement rate of environmental quality standard for suspended particulate matter
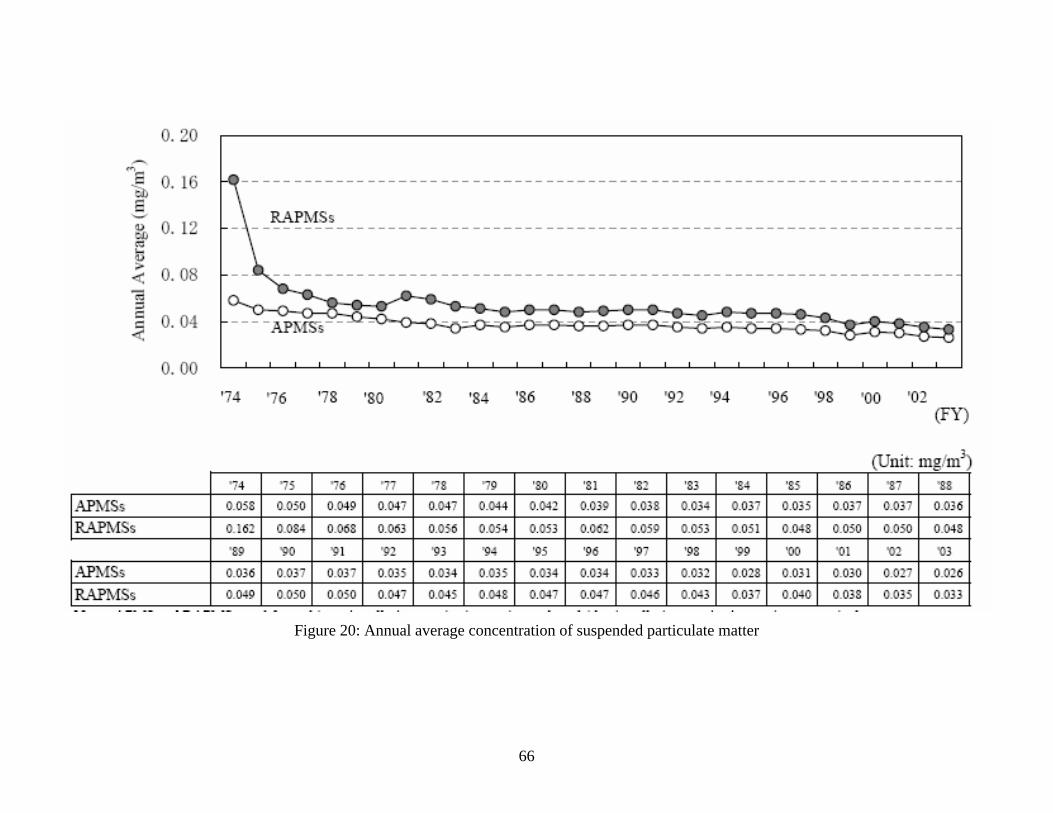
66
Figure 20: Annual average concentration of suspended particulate matter
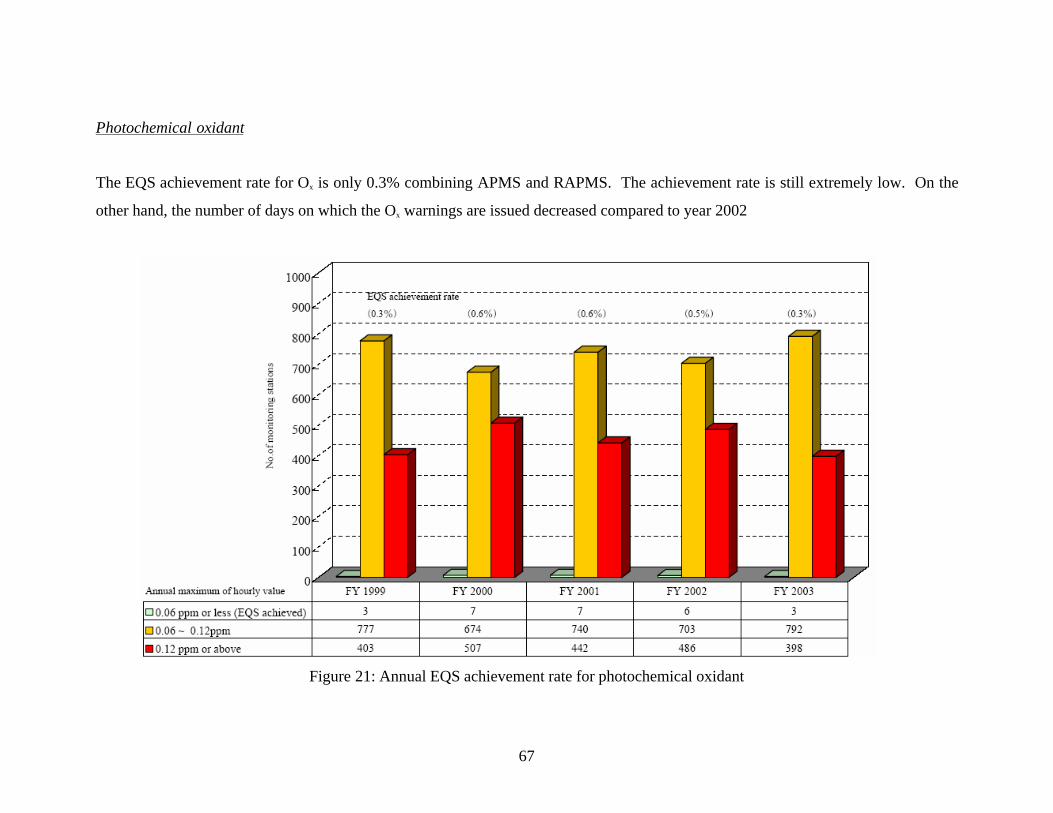
67
Photochemical oxidant
The EQS achievement rate for Ox is only 0.3% combining APMS and RAPMS. The achievement rate is still extremely low. On the
other hand, the number of days on which the Ox warnings are issued decreased compared to year 2002
Figure 21: Annual EQS achievement rate for photochemical oxidant
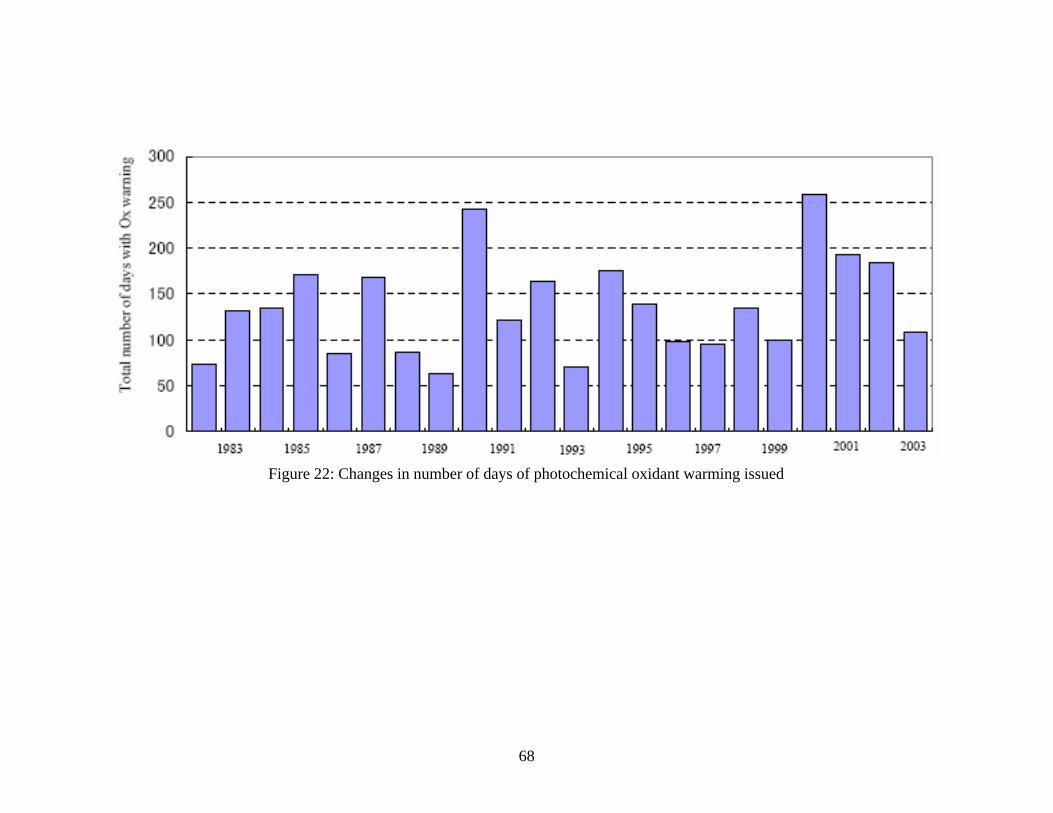
68
Figure 22: Changes in number of days of photochemical oxidant warming issued
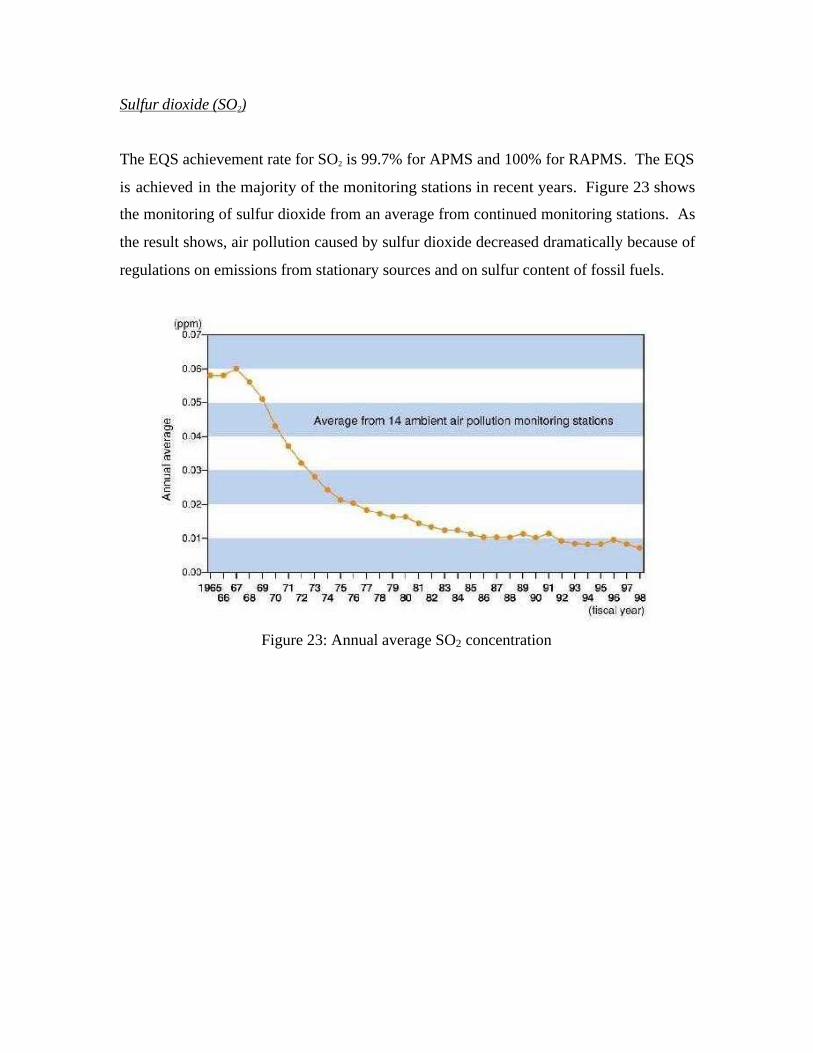
Sulfur dioxide (SO2)
The EQS achievement rate for SO2 is 99.7% for APMS and 100% for RAPMS. The EQS
is achieved in the majority of the monitoring stations in recent years. Figure 23 shows
the monitoring of sulfur dioxide from an average from continued monitoring stations. As
the result shows, air pollution caused by sulfur dioxide decreased dramatically because of
regulations on emissions from stationary sources and on sulfur content of fossil fuels.
Figure 23: Annual average SO2 concentration
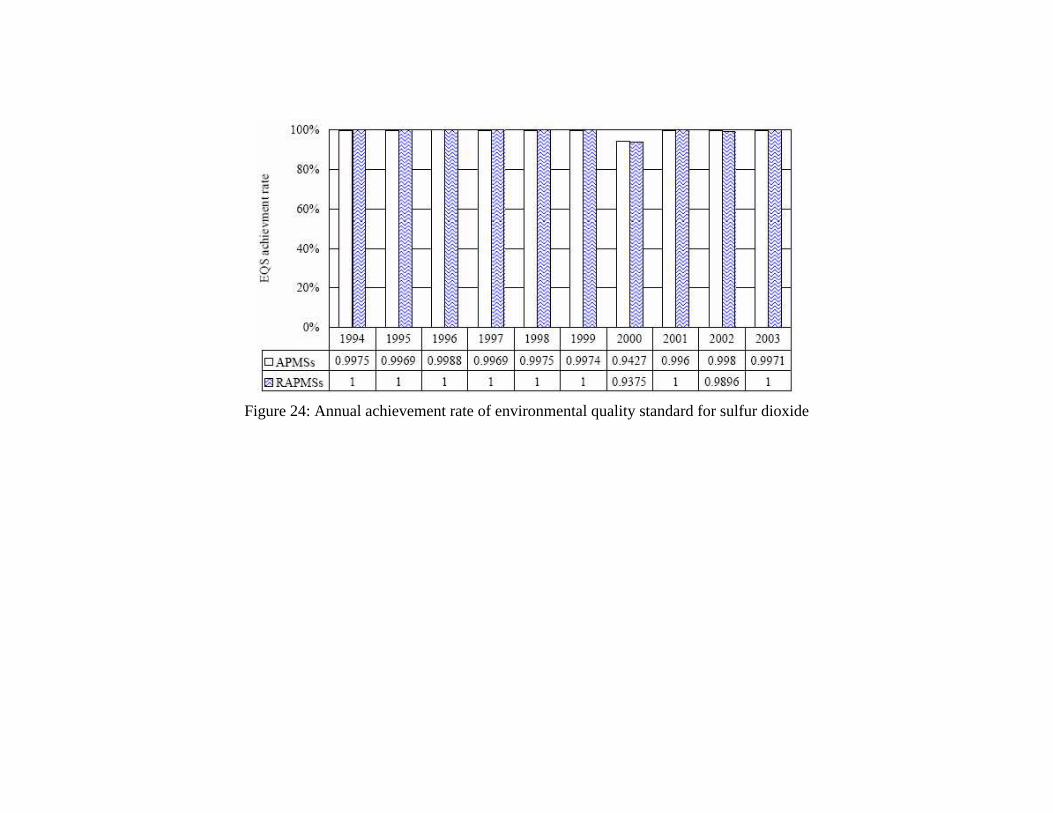
Figure 24: Annual achievement rate of environmental quality standard for sulfur dioxide
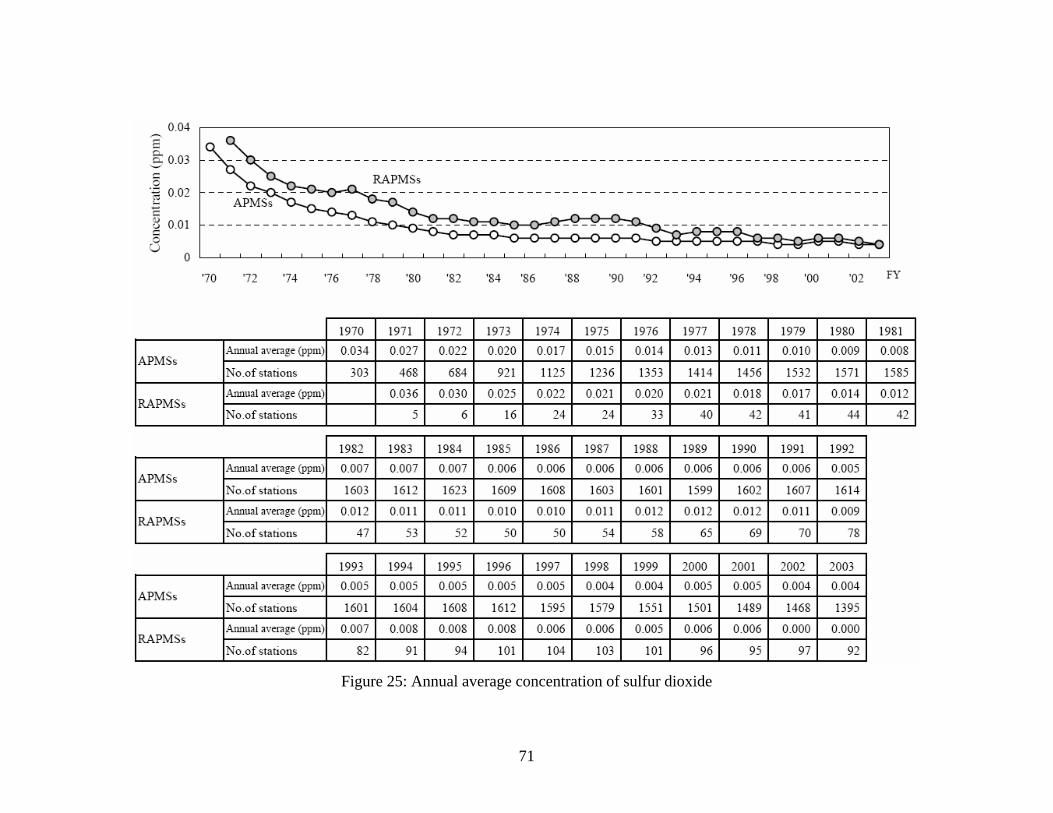
71
Figure 25: Annual average concentration of sulfur dioxide
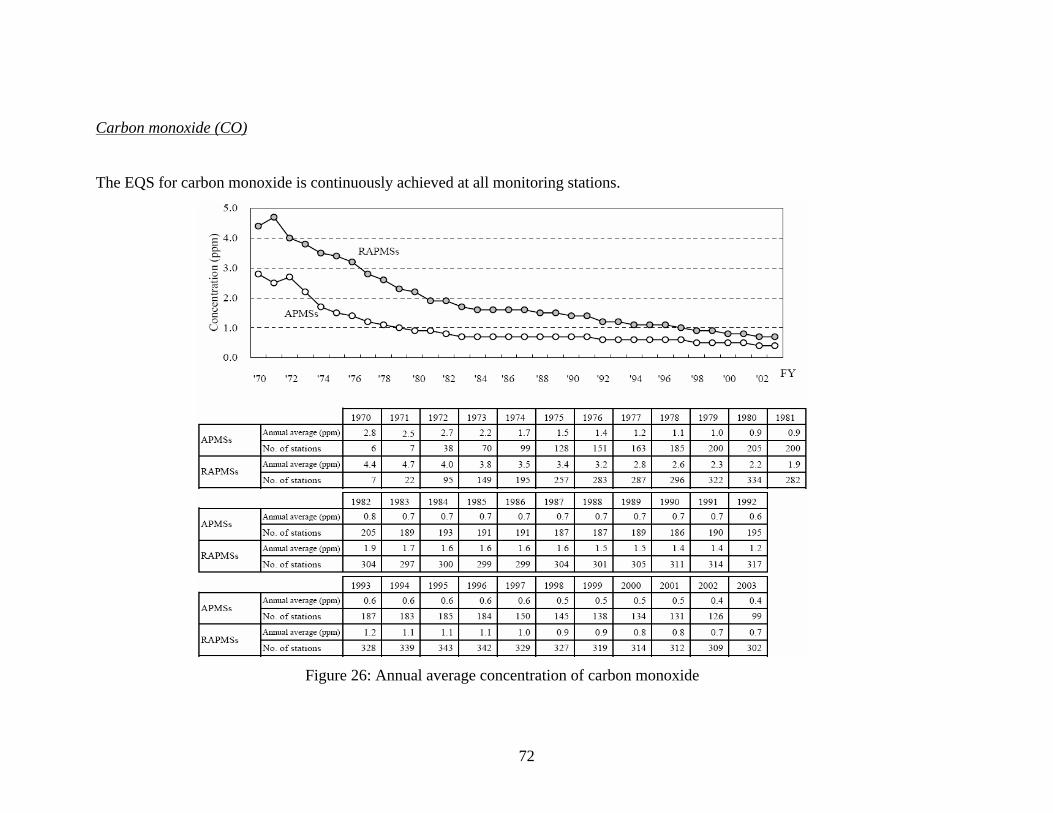
72
Carbon monoxide (CO)
The EQS for carbon monoxide is continuously achieved at all monitoring stations.
Figure 26: Annual average concentration of carbon monoxide

Based on the monitoring results, the Ministry of the Environment will further enhance the
comprehensive efforts to have an early achievement of EQS through taking measures for
emission from factories and business establishments, automobile exhaust gas,
dissemination of low-emission vehicles, etc.
According to those diagrams provided above, it is very obvious that the air condition in
Japan has a great improvement since 1990 to now, the major pollutants: Nitrogen
dioxides, Suspended particulate matter, photochemical oxidant, Sulfur dioxide, and
Carbon monoxide has a great decrement. This is caused by several factors such as new
government policy, improvement of technology, better understanding with human being.
Due to the great improvement of technology, industries have better machines, so the
exhaust emission are much less than before, also government set up the regulation, to
restraint all auto’s emissions, so those auto companies had to come up with some plan to
deal with this situation, otherwise no one is going to buy the vehicles. New engine was
the solution they found, it provides a better stability, higher horse power, and the most
important thing for our environment, less emission. Those factors helped the
environment a lot. After the monitoring system developed, government knows what
caused bad air conditions the most, to provide and set up a solution for it, this is really
working out as the improvement shown in the data above
74
4.1.4 Section Summary
As the air pollution index presents for each region, Taiwan and Japan have exactly the
same pollutant concentration, which are the suspended particulate matter (PM10), sulfur
dioxide (SO2), carbon monoxide (CO), Photochemical oxidants (O3), and nitrogen
dioxide. Consequently, they do also have similar Pollutant Standard Index (PSI) prior to
those five pollutants. Hong Kong, on the other hand, focuses their air pollution index on
vehicular emissions, such as nitrogen dioxide, sulfur dioxide (SO2), and Volatile Organic
Compounds (VOC). Such result could be foreseen and concluded from the difference of
economy in these three regions, which was mentioned in the section of introduction to
three regions of Chapter 2. In economic point of view, Taiwan and Japan possess a
multiple-structure economy where it is constructed by business trade, manufacturing
industry, and agricultural pursuits. Prior to these three types of industry, the
manufacturing industry contains an extreme value of vehicular emission, which costs
Japan and Taiwan put extra concentration on industry-related pollutant standard index.
For Hong Kong, since its economy is mostly business trade, the PSI is then related to all
transportation emission.
For the improvement of air quality, such measurement was made by pollutant detectors
that are known as the monitoring systems. The monitoring systems will be introduced in
detail in the following section. Overall, Taiwan, Japan, and Hong Kong all have
improved the air quality within the past tenth years. Theoretically, the reason costs the
improvement is based on new technology invention and government policies, which will
be described later in the chapter.
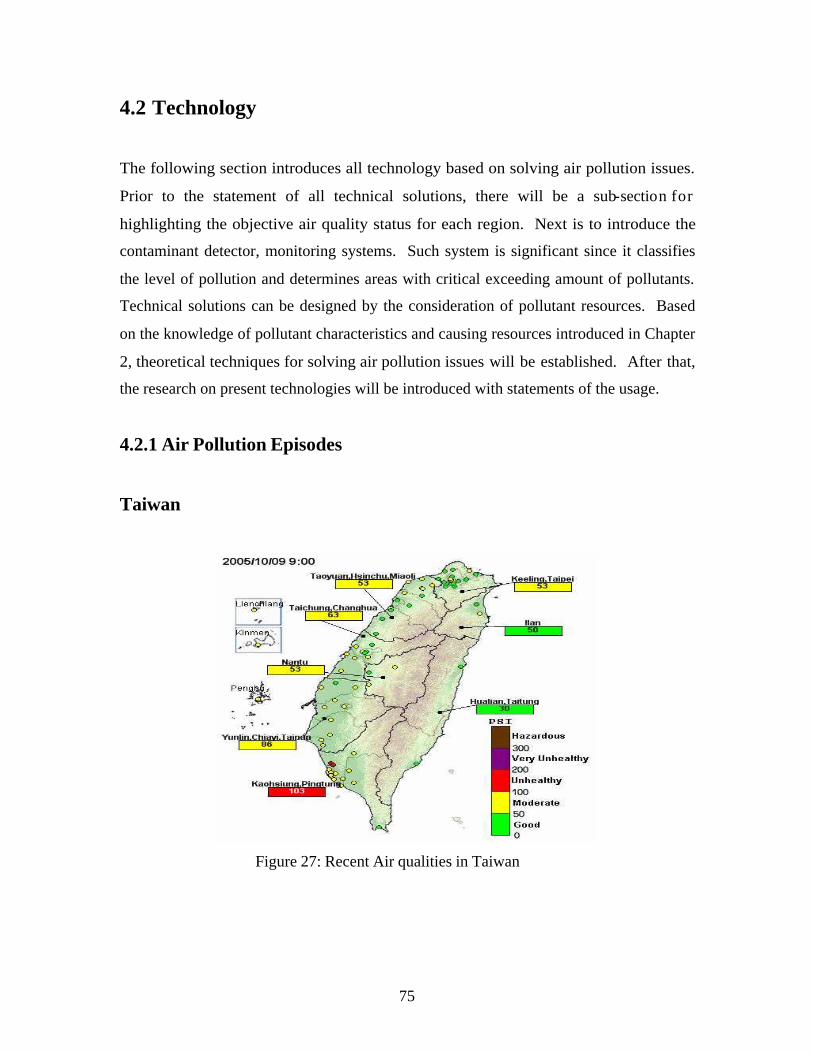
75
4.2 Technology
The following section introduces all technology based on solving air pollution issues.
Prior to the statement of all technical solutions, there will be a sub-section for
highlighting the objective air quality status for each region. Next is to introduce the
contaminant detector, monitoring systems. Such system is significant since it classifies
the level of pollution and determines areas with critical exceeding amount of pollutants.
Technical solutions can be designed by the consideration of pollutant resources. Based
on the knowledge of pollutant characteristics and causing resources introduced in Chapter
2, theoretical techniques for solving air pollution issues will be established. After that,
the research on present technologies will be introduced with statements of the usage.
4.2.1 Air Pollution Episodes
Taiwan
Figure 27: Recent Air qualities in Taiwan
76
Objectives
Air quality monitoring data are important bases for air quality management strategies
planning and performance assessment. Therefore, the environmental protection
authorities need to plan the air quality monitoring network effectively. However, in
Taiwan, the national Environmental Protection Administration (EPA) and some county
Environmental Protection Bureaus (EPB) separately installed their own monitoring
stations. This study developed an integrated methodology and computer system for
planning air quality monitoring networks.
The environmental, social, and economic objectives and sub-objectives, and their weights
were identified using system analysis and multiple objective planning, based on the
principles of sustainable development. A multiple objective optimization model and
procedure for sustainable air quality monitoring networks planning are developed in this
study. According to the procedure, a Multiple Objective Planning System for Sustainable
Air Quality Monitoring Networks (MOPSSAQMN) is developed using computer
software based on the modified bounded implicit enumeration algorithm with the
constraint arrangement method. The air quality monitoring network of Taoyuan County,
in northern Taiwan, was used as a case study to demonstrate the proposed method. Two
satisfactory alternatives based on different conditions were generated using
MOPSSAQMN. The compared results show that this study generated better alternatives
than the current monitoring network. An installation schedule for the alternative was
proposed, and its first step is now being implemented by the EPB of Taoyuan County
Government. The procedure and computer system developed in this study can be used to
assist the competent authorities to devise good and different alternatives for air quality
monitoring networks planning.
Since Taiwan’s air quality problem lies mainly in industry emissions, a new solution is
necessary if Taiwan wishes to further reduce pollutant levels. By restricting and/or
placing fees on energy and raw materials industry is allowed to use, industries will be
forced to find more efficient methods of production. By providing a motive to develop
77
newer technological machinery, industries will produce with less energy consumption
and consequently produce less polluting by-products. Even stricter regulations on stack
emissions will force industries to move out and into newer developing countries. If
Taiwan can move towards a cleaner production industry and shift towards more service
type businesses, not only would Taiwan’s air quality improve, but less energy
consumption in industrial sector would also bring about higher GDP growth rate. A new
plan adjusting the industrial sector will improve blue skies and benefit Taiwan in more
ways than one.
The Air Pollution Control Act, enacted in 1975 and newly revised in June 2002,
empowers the government at various levels to establish air quality standards for different
areas across Taiwan and monitoring stations at appropriate sites. Air quality is currently
monitored through the Taiwan Area Air Quality Monitoring Network. The network
comprises 74 stationary automatic air quality monitoring stations, two mobile monitoring
stations, and one air quality assurance laboratory. Next-day air quality forecasts for eight
areas of Taiwan are issued daily based on the data collected from this network.
In order to monitor ozone precursors in the metropolitan area, eight photochemical
assessable monitoring stations (PAMS) are deployed in the north, central, and south of
Taiwan to form three monitoring networks. These newly deployed PAMS' will not only
gather valuable monitoring data but can also benefit various ambient activities such as
atmospheric science and human health risk assessment research.
Air quality improvement measures include stringent emission standards for industrial
plants and motor vehicles (5.9 million cars and 12 million motorcycles in 2002), regular
exhaust inspections for motorcycles, the promotion of low-pollution transportation
vehicles, strict standards on the composition of petroleum products, increased inspections
of construction sites, and road-cleaning. The Environmental Protection Administration
(EPA) levies an air pollution control (APC) fee on both stationary sources, such as
factories and construction sites, and mobile sources, such as motor vehicles. This APC

78
fee covers such pollutants as suspended particulates, nitrogen oxides, sulfur oxides, and
hydrocarbons.
79
Hong Kong
Objectives
The overall policy objective for air quality management in Hong Kong is to achieve as
soon as reasonably practicable and to maintain thereafter an acceptable level of air
quality to safeguard the health and well being of the community, and to promote the
conservation and best use of air in the public interest. In this regard, Air Quality
Objectives (AQO) for seven widespread air pollutants were established in 1987 under the
Air Pollution Control Ordinance (APCO) based on international standards as yardsticks
for air quality management. These derived from scientific analyses of the relationship
between pollutant concentrations in the air and the associated adverse effects of the
polluted air on the health of the public. The established AQO apply to the whole territory.
Possible ways to achieve and maintain AQO include preventive measures through
intervention in the planning stage, or enforcement of APCO and its subsidiary legislation
to alleviate excessive emissions. AQO may be reviewed from time to time to include a
wider range of air pollutants and, if necessary, to tighten the standards taking into account
international developments for better protection of the health and well being of the
community.
To improve regional air quality, the Hong Kong SAR Government and the Guangdong
Provincial Government have reached a consensus to reduce, on a best Endeavour basis,
the emission of four major air pollutants, namely sulfur dioxide (SO2), nitrogen oxides
(NOx), Reparable Suspended Particulates (RSP) and volatile organic compounds (VOC)
by 40%, 20%, 55% and 55% respectively in the region by 2010, using 1997 as the base
year. Achieving these targets will not only enable Hong Kong to meet its air quality
objectives (AQO) but also significantly improve the air quality of the Pearl River Delta
(PRD) and relieve the regional smog problem. To meet the above emission reduction
targets, the two governments jointly drew up the Pearl River Delta Regional Air Quality
Management Plan (the “Management Plan”) in December 2003 to implement specific
control measures. The Pearl River Delta Air Quality Management and Monitoring
80
Special Panel were also set up under the Hong Kong-Guangdong Joint Working Group
on Sustainable Development and Environmental Protection, to monitor the
implementation of the Management Plan. PM2.5 has recently become a frequently
discussed issue, which is the repairable portion of the particles suspended in air with a
diameter smaller than 2.5 micron. They are part of the RSP and the quantities of RSP
measured in Hong Kong also include PM2.5. All the control measures undertaken by the
Government, which target at RSP, will also reduce the emission of PM2.5. At present,
the United States has set a standard for PM2.5 to be achieved by 2015. However, the US
is now reviewing its standard and the result is expected to be available by September
2006.
The European Union (EU) has recently issued a draft directive on ambient air quality that
includes a proposed PM2.5 standard to be achieved by member states by 2015. The
proposal is being examined by country members of the EU and a decision on its adoption
will not be made until 2007. According to the Air Quality Guidelines for Europe
published by the World Health Organization (WHO), when setting air quality standards,
considerations such as the prevailing exposure levels, technical feasibility, source control
measures, abatement strategies, and social, economic and cultural conditions should be
taken into account when setting air quality standards for a particular place. Most
importantly, such standards should be realistic and achievable by the government
concerned by means of pollution control measures. The EPD will continue close liaison
with relevant international experts and organizations on the development of Air Quality
Objectives.
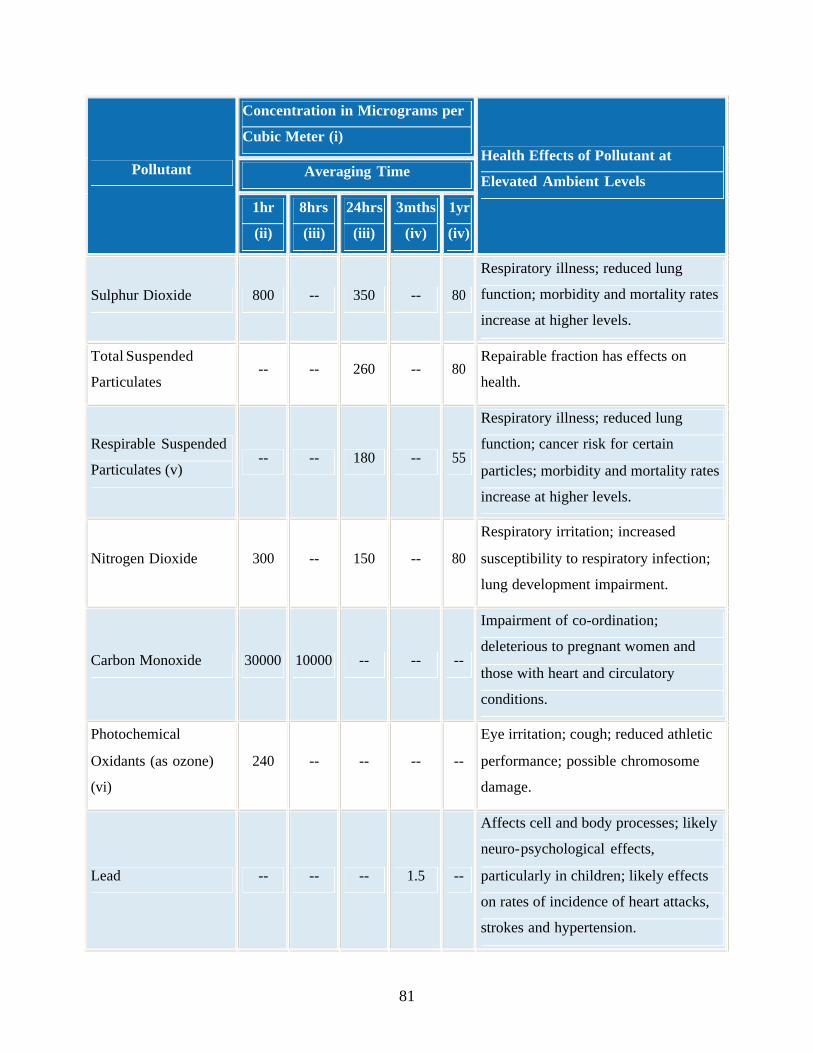
81
Concentration in Micrograms per
Cubic Meter (i)
Averaging Time Pollutant
1hr
(ii)
8hrs
(iii)
24hrs
(iii)
3mths
(iv)
1yr
(iv)
Health Effects of Pollutant at
Elevated Ambient Levels
Sulphur Dioxide 800 -- 350 -- 80
Respiratory illness; reduced lung
function; morbidity and mortality rates
increase at higher levels.
Total Suspended
Particulates -- -- 260 -- 80
Repairable fraction has effects on
health.
Respirable Suspended
Particulates (v) -- -- 180 -- 55
Respiratory illness; reduced lung
function; cancer risk for certain
particles; morbidity and mortality rates
increase at higher levels.
Nitrogen Dioxide 300 -- 150 -- 80
Respiratory irritation; increased
susceptibility to respiratory infection;
lung development impairment.
Carbon Monoxide 30000 10000 -- -- --
Impairment of co-ordination;
deleterious to pregnant women and
those with heart and circulatory
conditions.
Photochemical
Oxidants (as ozone)
(vi)
240 -- -- -- --
Eye irritation; cough; reduced athletic
performance; possible chromosome
damage.
Lead -- -- -- 1.5 --
Affects cell and body processes; likely
neuro-psychological effects,
particularly in children; likely effects
on rates of incidence of heart attacks,
strokes and hypertension.

82
Japan
Objectives
The main objective is to reduce total emission of dioxins (PCDD, PCDF and Co-planner
PCBs) by approximately 90% of the base year of 1997. Approximately 95% of the
estimated reduction was achieved by plan completion in 2003.
Most data by air pollution continuous monitoring in Japan come from the following two
types of station:
· General air pollution monitoring stations, which monitor the ambient air quality
of a fixed region.
· Roadside air pollution monitoring stations, which monitor the ambient air quality
near road with large traffic volume and assess air pollution caused by exhaust gas
from automobiles.
These monitoring stations have been established in accordance with Article 22 of the Air
Pollution Control Law to continuously monitor atmospheric environment. Most of these
stations are run by local governments.
The purpose of general air pollution monitoring stations
General air pollution monitoring stations are established to obtain data for the
1. To determine if meets environmental quality standards for air pollution.
2. To obtain data which need to take measures for emergency due to the prevention
of damage to human health and living environment by air pollution.
3. To establish air pollution control measures and evaluate their effects.
4. To check trends of air pollutant and their effects for long time.
83
The purpose of roadside air pollution monitoring stations
Roadside air pollution monitoring stations are established to obtain data for the purposes
described below:
1. To determine if air quality in the roadside region meets environmental air quality
standards.
2. To establish grounds for asking the Prefecture Public Safety Commission to take
measures based on regulations of the Road Traffic Law, and for stating opinions
regarding the structure, etc. to the road manager.

84
4.2.2 Monitoring System
Taiwan xviii
The EPA started to set up the Taiwan Air Quality Monitoring Network (TAQMN) in
1990. Until 1998, there were 72 air quality monitoring stations, serving five different
purposes as following:
1. Ambient stations: 58 ambient stations are located in populated areas where
relatively high pollutant concentrations are expected to occur.
2. Traffic air monitoring stations: Five traffic air monitoring stations are located near
heavily traveled roadways, including Taipei City, Taipei County, Taoyuan County,
and Kaohsiung City.
3. Industrial stations: Three industrial stations are located downwind of industrial
districts in more than 70 industrial regions with significant emission sources.
4. National park air monitoring stations: Two national park air monitoring stations
are located in north and south national parks to characterize air quality levels and
long-term trends.
5. Background air monitoring stations: Four background air monitoring stations are
located upwind of major urban areas, where there is little man-made pollution, to
monitor the long-range transport of pollutants.
The air quality monitoring network in Taiwanese Environmental Protection Association
(EPA) comprises fourteen fixed monitoring stations to meet the following objectives:
1. To understand air pollution problems in order that cost-effective policies and
solutions can be developed;
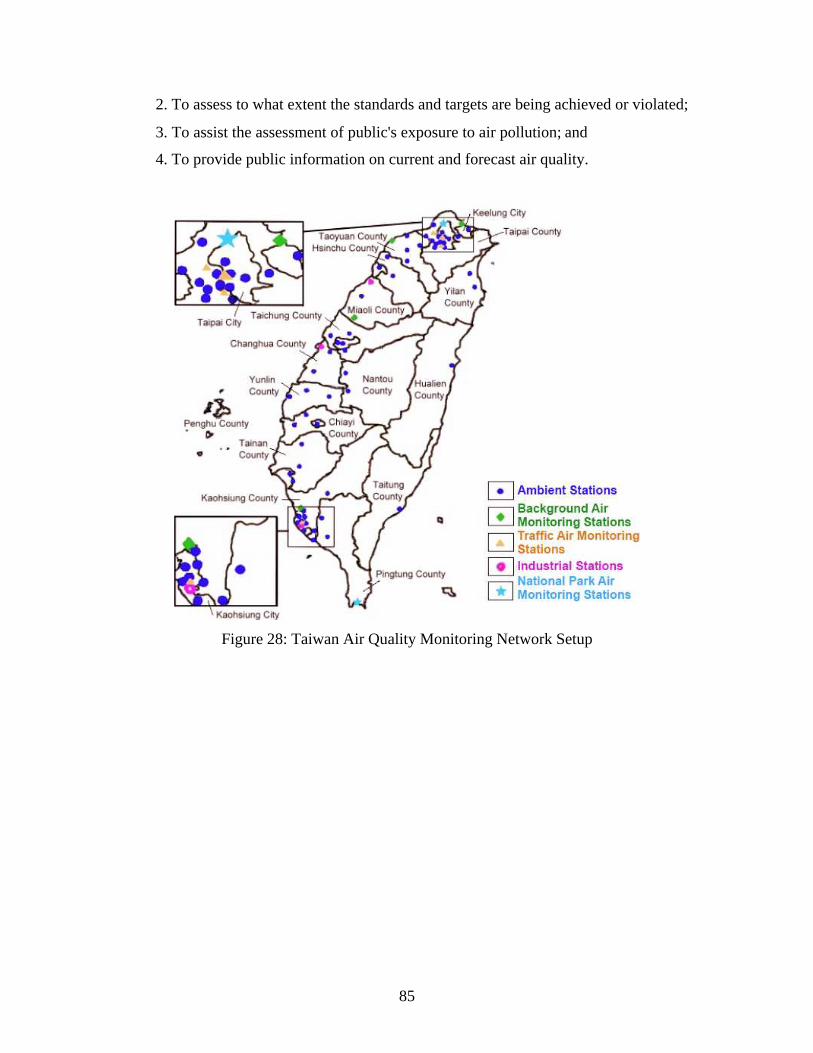
85
2. To assess to what extent the standards and targets are being achieved or violated;
3. To assist the assessment of public's exposure to air pollution; and
4. To provide public information on current and forecast air quality.
Figure 28: Taiwan Air Quality Monitoring Network Setup
86
Advanced Techniquesxix
Optical Open-path Monitoring System
Conventional air quality monitoring stations can do the measurement of Volatile Organic
Compounds (VOC) through the total concentrations of hydrocarbons (CXHY), but the
analysis of their composition has to be done through manual sampling. As a result, the
EPA has been aggressively planning to introduce advanced optical open-path monitoring
techniques in Taiwan. To reach the goal of immediate monitoring Volatile Organic
Compounds as an auxiliary reference for pollution control policy, the EPA has carried out
a series of assessment studies in urban and industrial areas to evaluate the applicability of
optical open-path monitoring system in Taiwan.
Photochemical Assessment Monitoring Stations and Particulate Matter Super Sites
According to the past year's air quality monitoring results, the criteria pollutants that
attributed most to bad air quality are PM10 and O3. To understand the reasons of the
variation of PM10 and O3 in the air, the EPA has been planning the establishment of
"Photochemical Assessment Monitoring Stations (PAMS)" and "Particulate Matter (PM)
Super Sites” PAMS can assist the EPA in understanding the variation of concentrations
of ozone precursors through continuously monitoring the VOC. PM Super Sites are
planned to continuously monitor particle elemental carbon and organic carbon, as well as
have sampling systems for particle metals and acid aerosols to understand the pollution
degree made by particulate matter so that the results can serve as useful information for
future risk assessments and pollution control.
Ozone Standard Reference Photometer (SRP)
O3 concentration standards are required for the calibration and auditing of ambient O3
monitors. It can be classified into two basic groups: primary standards and transfer
standards. A primary O3 standard is an O3 concentration standard that has been
dynamically generated and assayed by UV photometry. An O3 transfer standard is a
transportable device or apparatus, which together with associated operational procedures,
87
is capable of accurately reproducing O3 concentration standards or of producing accurate
assays of O3 concentrations, which are quantitatively related to a primary O3 standard.
Due to the instability of O3, the concentration standards of O3 must be generated and
certified locally. Therefore, in 2002, TEPA began to build its own Calibration Room for
Ozone Standard Reference Photometer (SRP) which had been developed by the U.S.
National Institute of Standards and Technology (NIST) and the EPA as a highly stable,
highly precise, computer-controlled instrument for assaying O3 concentrations.
Currently, the SRP located in TEPA QA Laboratory is the sole primary standards for the
certification of O3 concentrations in Asia and has been designated as the NIST Primary
SRP.
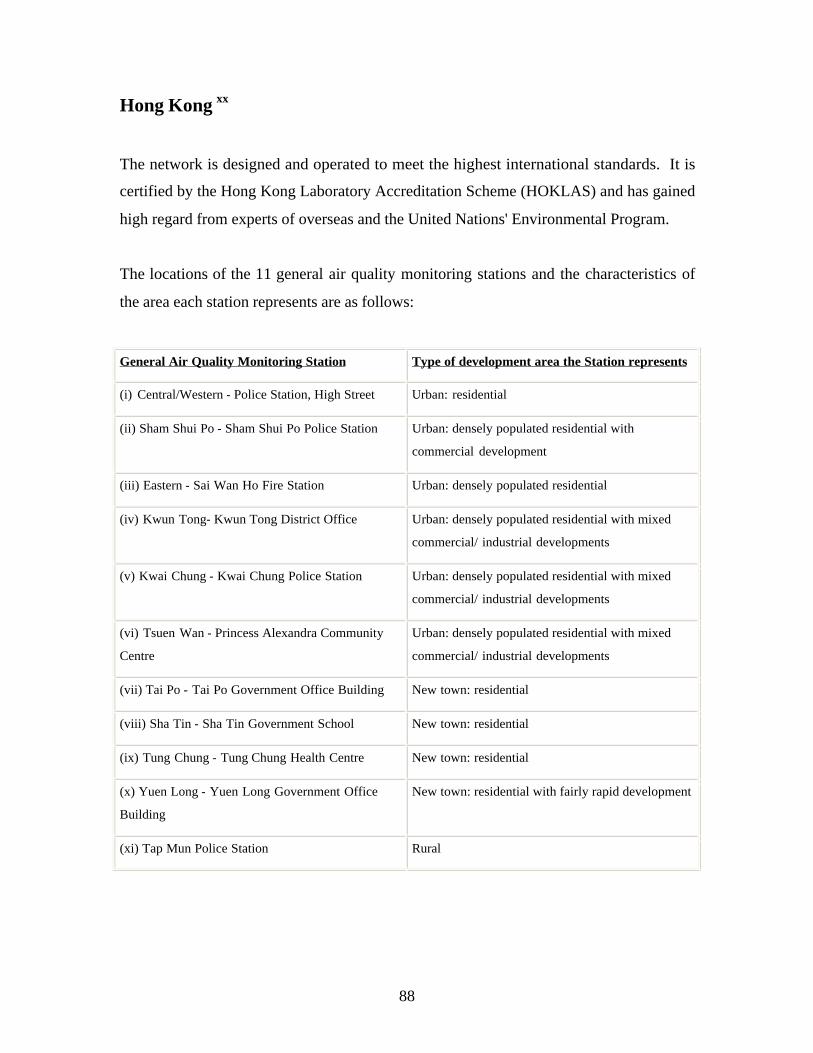
88
Hong Kong xx
The network is designed and operated to meet the highest international standards. It is
certified by the Hong Kong Laboratory Accreditation Scheme (HOKLAS) and has gained
high regard from experts of overseas and the United Nations' Environmental Program.
The locations of the 11 general air quality monitoring stations and the characteristics of
the area each station represents are as follows:
General Air Quality Monitoring Station Type of development area the Station represents
(i) Central/Western - Police Station, High Street Urban: residential
(ii) Sham Shui Po - Sham Shui Po Police Station Urban: densely populated residential with
commercial development
(iii) Eastern - Sai Wan Ho Fire Station Urban: densely populated residential
(iv) Kwun Tong- Kwun Tong District Office Urban: densely populated residential with mixed
commercial/ industrial developments
(v) Kwai Chung - Kwai Chung Police Station Urban: densely populated residential with mixed
commercial/ industrial developments
(vi) Tsuen Wan - Princess Alexandra Community
Centre
Urban: densely populated residential with mixed
commercial/ industrial developments
(vii) Tai Po - Tai Po Government Office Building New town: residential
(viii) Sha Tin - Sha Tin Government School New town: residential
(ix) Tung Chung - Tung Chung Health Centre New town: residential
(x) Yuen Long - Yuen Long Government Office
Building
New town: residential with fairly rapid development
(xi) Tap Mun Police Station Rural
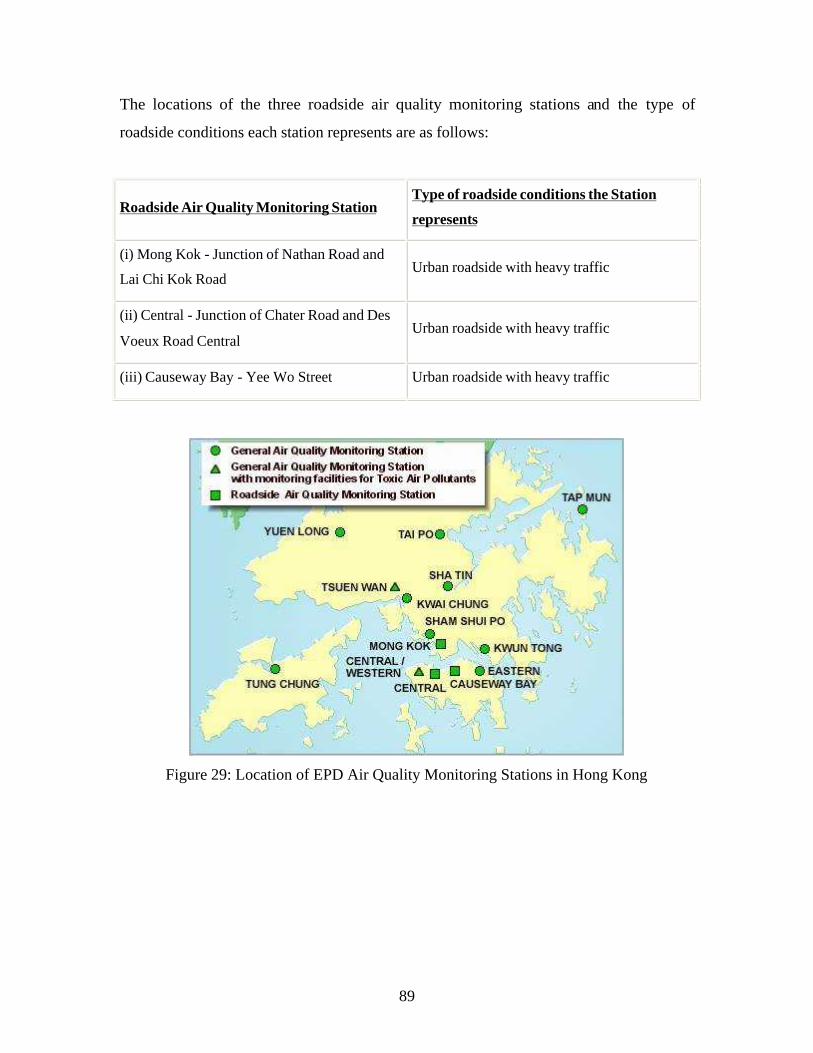
89
The locations of the three roadside air quality monitoring stations and the type of
roadside conditions each station represents are as follows:
Roadside Air Quality Monitoring Station Type of roadside conditions the Station
represents
(i) Mong Kok - Junction of Nathan Road and
Lai Chi Kok Road Urban roadside with heavy traffic
(ii) Central - Junction of Chater Road and Des
Voeux Road Central Urban roadside with heavy traffic
(iii) Causeway Bay - Yee Wo Street Urban roadside with heavy traffic
Figure 29: Location of EPD Air Quality Monitoring Stations in Hong Kong
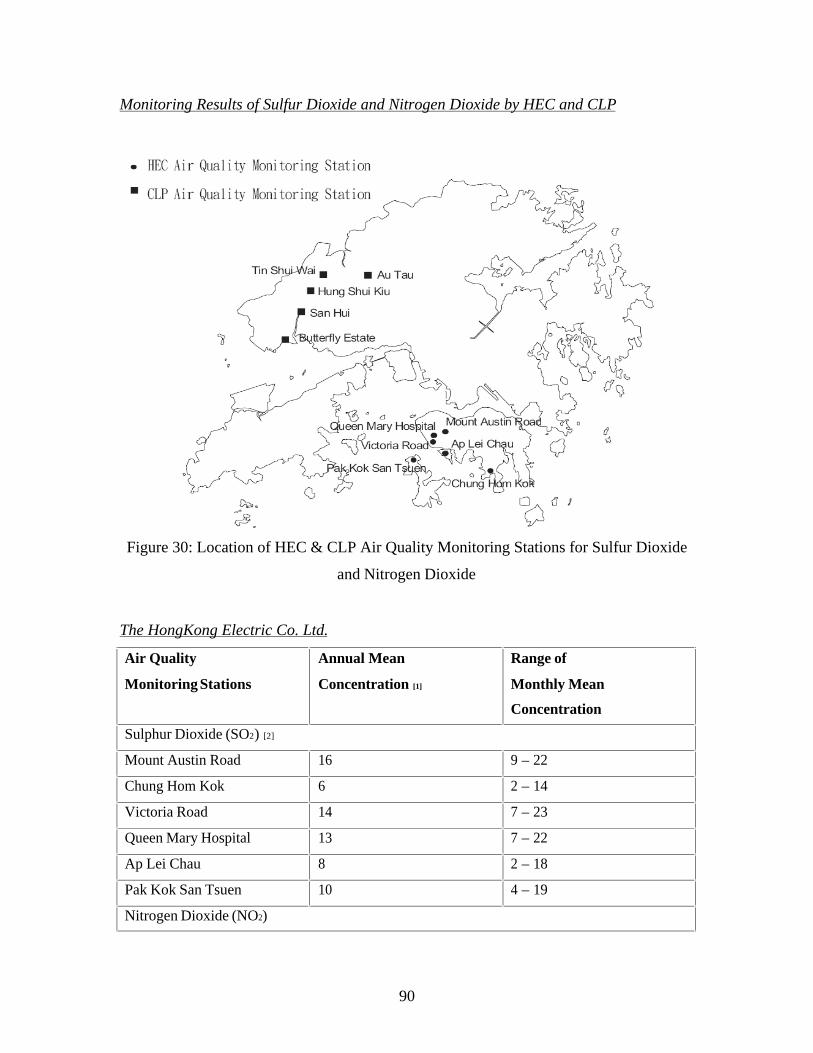
90
Monitoring Results of Sulfur Dioxide and Nitrogen Dioxide by HEC and CLP
Figure 30: Location of HEC & CLP Air Quality Monitoring Stations for Sulfur Dioxide
and Nitrogen Dioxide
The HongKong Electric Co. Ltd.
Air Quality
Monitoring Stations
Annual Mean
Concentration [1]
Range of
Monthly Mean
Concentration
Sulphur Dioxide (SO2) [2]
Mount Austin Road 16 9 – 22
Chung Hom Kok 6 2 – 14
Victoria Road 14 7 – 23
Queen Mary Hospital 13 7 – 22
Ap Lei Chau 8 2 – 18
Pak Kok San Tsuen 10 4 – 19
Nitrogen Dioxide (NO2)
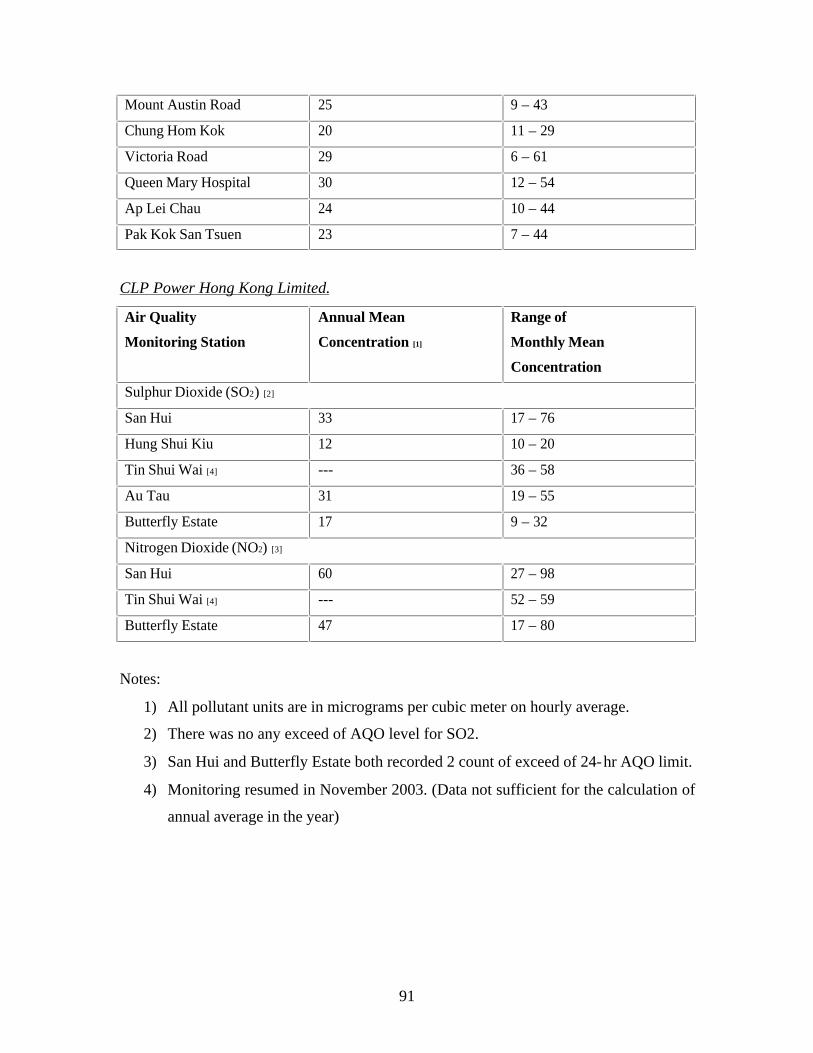
91
Mount Austin Road 25 9 – 43
Chung Hom Kok 20 11 – 29
Victoria Road 29 6 – 61
Queen Mary Hospital 30 12 – 54
Ap Lei Chau 24 10 – 44
Pak Kok San Tsuen 23 7 – 44
CLP Power Hong Kong Limited.
Air Quality
Monitoring Station
Annual Mean
Concentration [1]
Range of
Monthly Mean
Concentration
Sulphur Dioxide (SO2) [2]
San Hui 33 17 – 76
Hung Shui Kiu 12 10 – 20
Tin Shui Wai [4] --- 36 – 58
Au Tau 31 19 – 55
Butterfly Estate 17 9 – 32
Nitrogen Dioxide (NO2) [3]
San Hui 60 27 – 98
Tin Shui Wai [4] --- 52 – 59
Butterfly Estate 47 17 – 80
Notes:
1) All pollutant units are in micrograms per cubic meter on hourly average.
2) There was no any exceed of AQO level for SO2.
3) San Hui and Butterfly Estate both recorded 2 count of exceed of 24-hr AQO limit.
4) Monitoring resumed in November 2003. (Data not sufficient for the calculation of
annual average in the year)
92
Japan xxi
The primary demand for environmental monitoring equipment comes from local
governments that need to know and preserve the state of their air environment. They are
purchasing new equipment to replace old equipment, outfit new monitoring stations and
assess the environment. Currently in Japan, there are 8,000 environmental monitoring
devices in service between the 1,800 general monitoring stations and approximate 400
automobile exhaust emissions measurement stations.
Since peaking in 1996, there has been a decline in the number of SOx and CO monitoring
stations that detected an air environment in compliance with standards, but there is a
steady increase in the number of suspended substances monitoring stations that are
detecting air environments in compliance with standards when originally there had only
been a few. Nevertheless, citing a large drop in equipment replacement intention of local
governments due to falling tax revenues and correlated with that the negative effect of
new monitoring stations on business because of escalating competition, it is predicted
that equipment shipments to local governments will decline and eventually level off after
equipment shipped during the bubble economy was replaced in 2001.
An increase in demand and especially demand for PM 2.5 suspended substance detectors
is foreseen since the Ministry of Land and Transportation has laid out plans to set up
monitoring stations in more than 100 locations along national highways between 2002
and 2005, as measures are required in heavily congested areas such as national routes
because of the outcome of related lawsuits on roadside air pollution.
As a method for selecting target substances, the following three types of surveys, each
with their own purpose, were introduced so that the survey results could be effectively
utilized for measures against chemical substances in the environment.

93
Initial Environmental Survey
Grasping the status of environmental persistence of chemical substances and others,
targeting the Designated Chemical Substances by the Law Concerning the Examination
and Manufacture, etc. of Chemical Substances (hereinafter called the Chemical
Substances Control Law), candidate substances for the PRTR System, unintentionally
formed substances, and the substances required by social factors.
Environmental Survey for Exposure Study
Grasping the exposure amount of chemical substances to humans and wildlife, which is
necessary for the environmental risk assessment.
Monitoring Investigation
All-time monitoring of air pollution is indispensable to grasp degrees to which
environmental quality standards are attained and to formulate measures to prevent air
pollution. It also constitutes the foundation of administration on the conservation of the
atmosphere.
1. National Air Monitoring Network
In order to come to grips with the nationwide state of air pollution and obtain basic data
necessary for the establishment of environmental quality standards and the formulation of
pollution prevention programs, national air pollution monitoring stations and national
environment background air monitoring stations are established.
National air monitoring stations are established at 15 places in major districts across the
country. Each monitoring station is equipped with a wide variety of measuring
instruments to monitor sulfur dioxide, nitrogen oxides and other chemicals, and on the
94
basis of those stations' findings, factors for air pollution are analyzed and clarified.
National environment background air monitoring stations are established at 8 places to
come to grips with local conditions in areas other than already polluted districts in Japan's
representative plains. Those monitoring stations are equipped with instruments to
measure hydrogen sulfide and ozone, etc., in addition to the same kinds of measuring
instruments as furnished to national air pollution monitoring stations.
A three-year program for the establishment of acid rain monitoring stations on offshore
islands was started in fiscal 1989. They were established at Oki Shima and Tsushima in
fiscal 1989.
As regards automobile exhaust gas, national automobile exhaust monitoring stations are
established at 3 places in Tokyo beside one in Maebashi City, Gunma Prefecture.
As part of the global-scale background air pollution monitoring network (BAPMON) of
the World Meteorological Organization (WMO), the Meteorological Agency is
constantly observing at the Meteorological Rocket Observatory in Sanriku Town, Iwate
Prefecture, the concentration of carbon dioxide, CFCs, nitrogen monoxide and on-the-
ground ozone, which are greenhouse gases deeply tied in with global warming, and the
conditions of air pollution, such as the chemical analysis of precipitation and dust fallout.
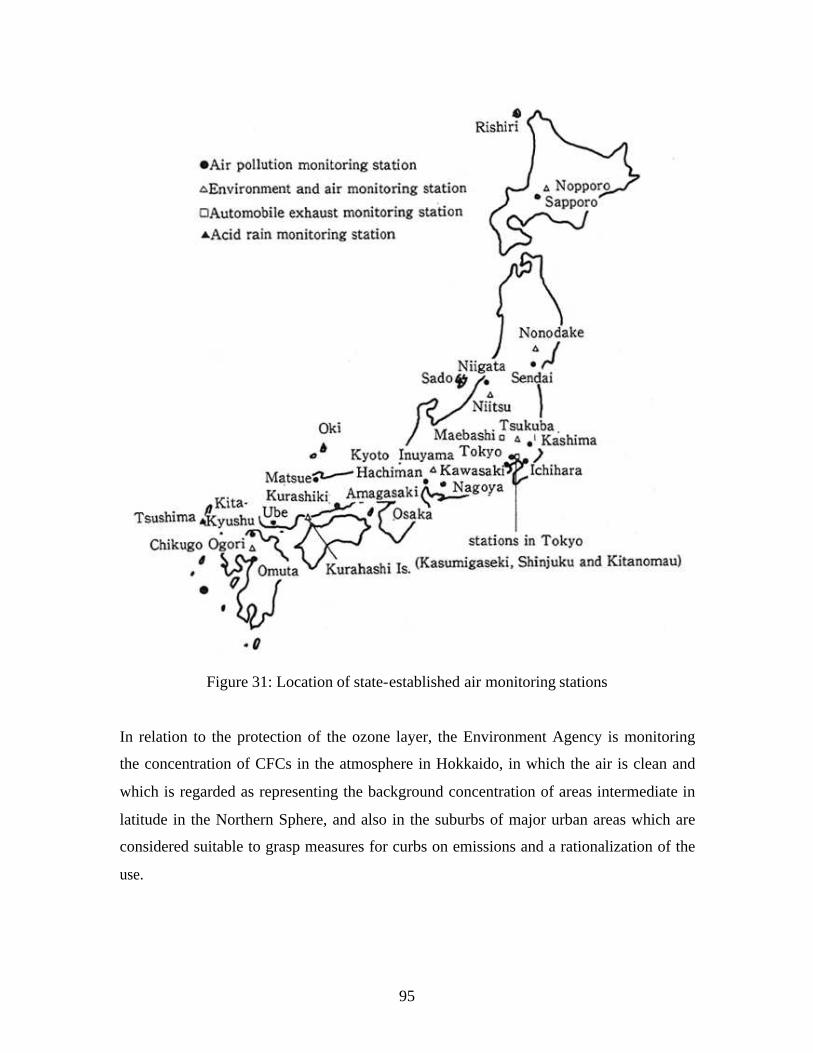
95
Figure 31: Location of state-established air monitoring stations
In relation to the protection of the ozone layer, the Environment Agency is monitoring
the concentration of CFCs in the atmosphere in Hokkaido, in which the air is clean and
which is regarded as representing the background concentration of areas intermediate in
latitude in the Northern Sphere, and also in the suburbs of major urban areas which are
considered suitable to grasp measures for curbs on emissions and a rationalization of the
use.
96
The Meteorological Agency carried on the observation of ozone at four points in the
country, which were part of the WMO's global ozone observation system (GO3OS)
[Sapporo, Tateno (Tsukuba), Kagoshima and Naha] and at the Showa Antarctic Base, and
began to observe ultraviolet radiation in order to clarify changes in the conditions of toxic
ultraviolet rays at the Sub stratospheric Observatory (Tsukuba) in conjunction with the
depletion of the ozone layer.
Moreover, in order to assess the role of oceans in the global environment, such as
greenhouse gases and ozone layer disrupters, the agency has also started periodically
observing carbon dioxide, methane, chlorofluorocarbons and di-nitrogen monoxide in the
seas around Japan and in the Western Pacific.
2. Local Air Pollution Monitoring System
In the countryside, the governors of prefectures and the mayors of administrative
ordinance-designated cities are constantly monitoring air pollution under the Air
Pollution Control Law. In addition, monitoring is being made by other local governments.
Constant monitoring is made on the concentration of sulfur dioxide and the quantities of
fuels used at the sources from which air pollutants are emitted, and the development of
telemetric systems with which to transmit monitored data to the central monitoring center
is being done by some local governments.
Incidentally, the State subsidizes the development of monitoring instruments necessary to
prefectures and administrative ordinance-designated cities for monitoring, works for the
sophistication of monitoring technologies and the systematic and priority development of
monitoring systems which satisfy the increased efficiency. It also strives to modernize
the facilities of local environmental pollution research institutes.
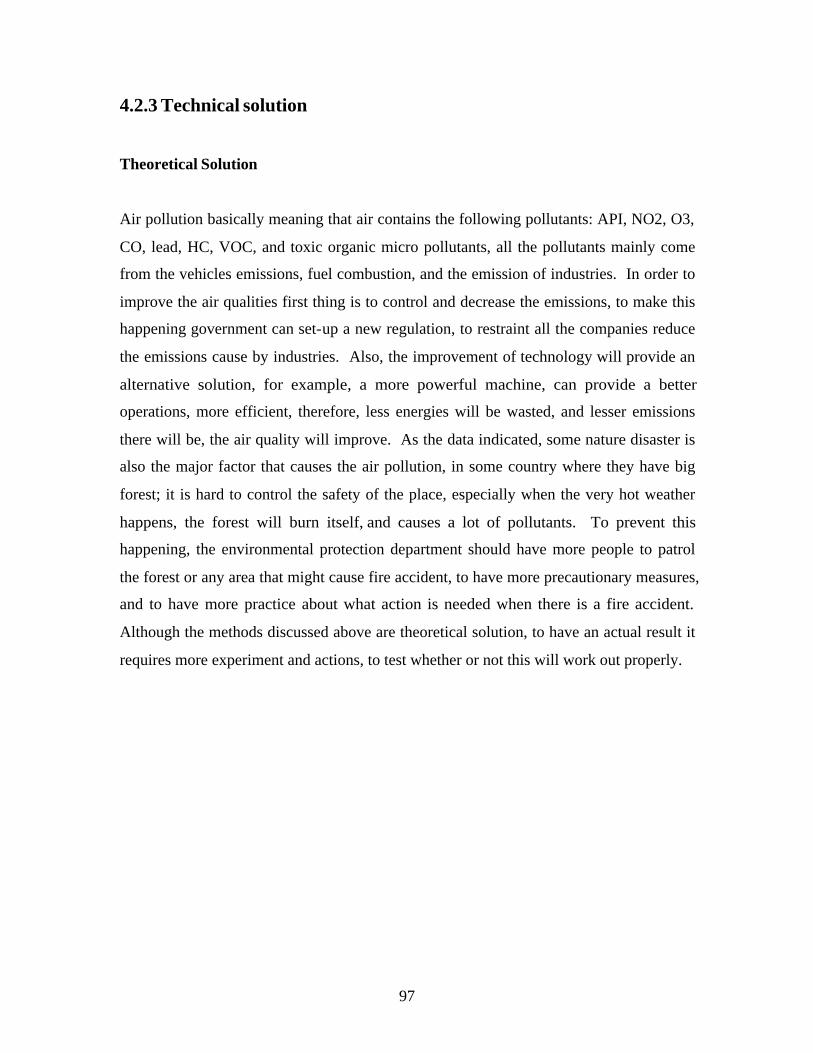
97
4.2.3 Technical solution
Theoretical Solution
Air pollution basically meaning that air contains the following pollutants: API, NO2, O3,
CO, lead, HC, VOC, and toxic organic micro pollutants, all the pollutants mainly come
from the vehicles emissions, fuel combustion, and the emission of industries. In order to
improve the air qualities first thing is to control and decrease the emissions, to make this
happening government can set-up a new regulation, to restraint all the companies reduce
the emissions cause by industries. Also, the improvement of technology will provide an
alternative solution, for example, a more powerful machine, can provide a better
operations, more efficient, therefore, less energies will be wasted, and lesser emissions
there will be, the air quality will improve. As the data indicated, some nature disaster is
also the major factor that causes the air pollution, in some country where they have big
forest; it is hard to control the safety of the place, especially when the very hot weather
happens, the forest will burn itself, and causes a lot of pollutants. To prevent this
happening, the environmental protection department should have more people to patrol
the forest or any area that might cause fire accident, to have more precautionary measures,
and to have more practice about what action is needed when there is a fire accident.
Although the methods discussed above are theoretical solution, to have an actual result it
requires more experiment and actions, to test whether or not this will work out properly.
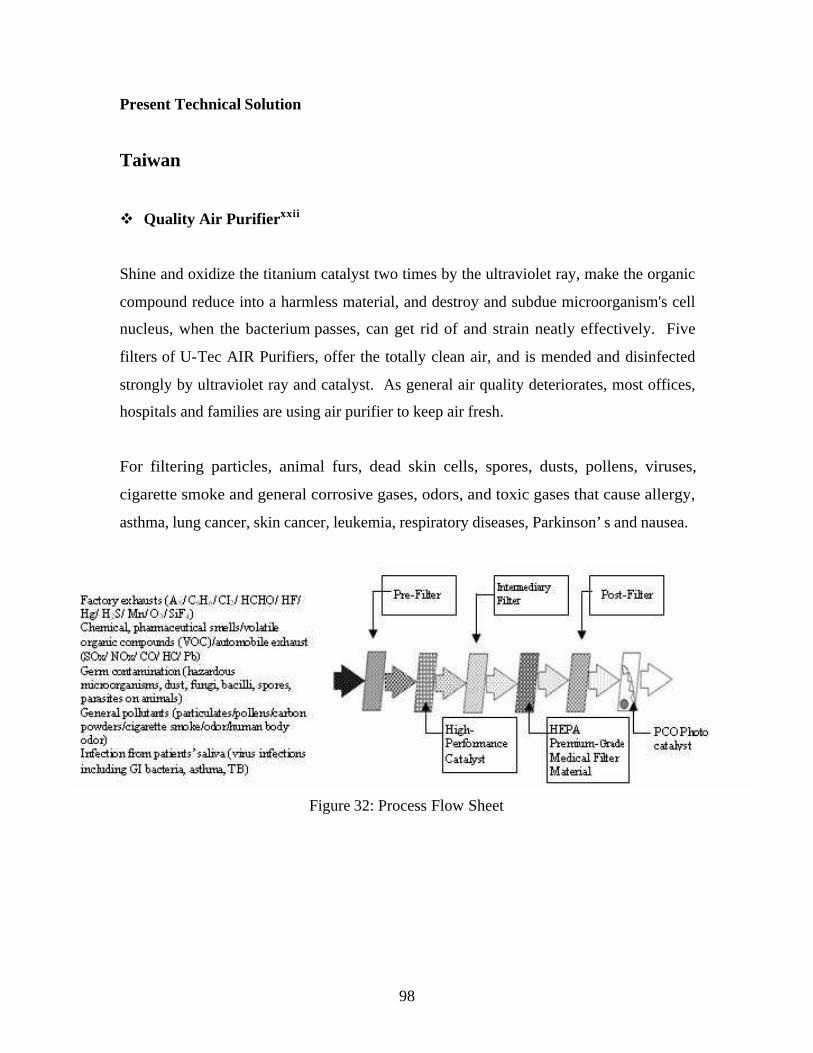
98
Present Technical Solution
Taiwan
v Quality Air Purifierxxii
Shine and oxidize the titanium catalyst two times by the ultraviolet ray, make the organic
compound reduce into a harmless material, and destroy and subdue microorganism's cell
nucleus, when the bacterium passes, can get rid of and strain neatly effectively. Five
filters of U-Tec AIR Purifiers, offer the totally clean air, and is mended and disinfected
strongly by ultraviolet ray and catalyst. As general air quality deteriorates, most offices,
hospitals and families are using air purifier to keep air fresh.
For filtering particles, animal furs, dead skin cells, spores, dusts, pollens, viruses,
cigarette smoke and general corrosive gases, odors, and toxic gases that cause allergy,
asthma, lung cancer, skin cancer, leukemia, respiratory diseases, Parkinson’s and nausea.
Figure 32: Process Flow Sheet
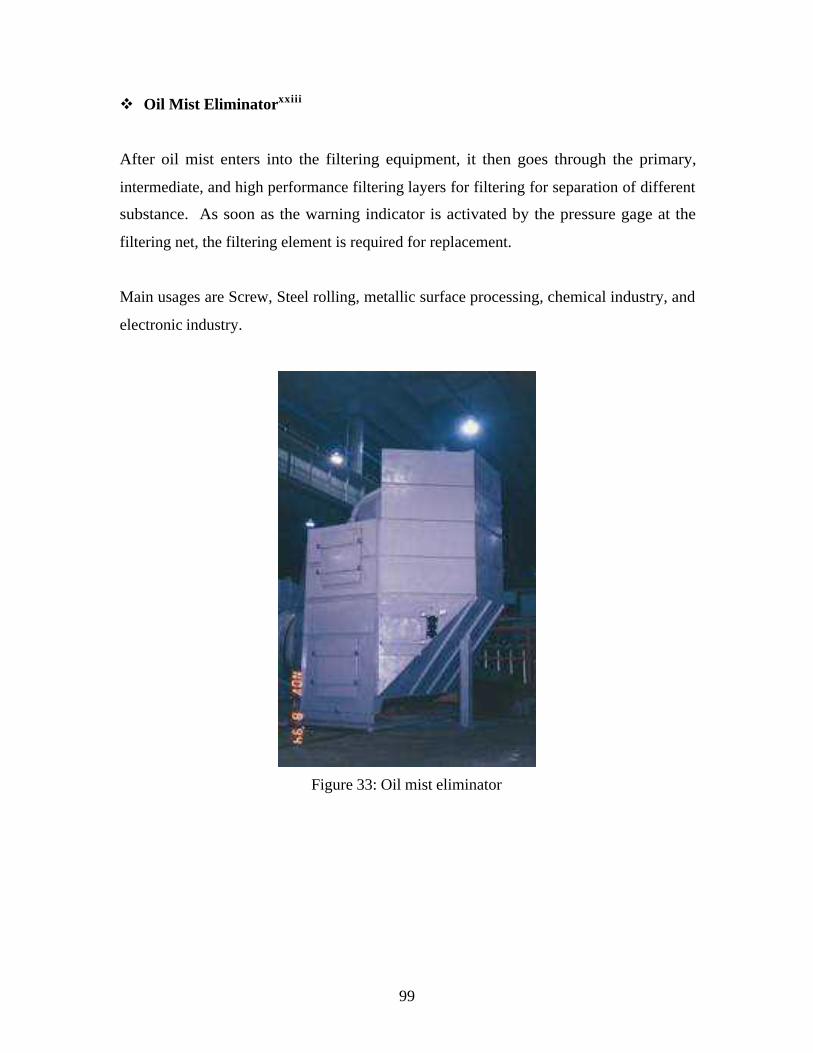
99
v Oil Mist Eliminatorxxiii
After oil mist enters into the filtering equipment, it then goes through the primary,
intermediate, and high performance filtering layers for filtering for separation of different
substance. As soon as the warning indicator is activated by the pressure gage at the
filtering net, the filtering element is required for replacement.
Main usages are Screw, Steel rolling, metallic surface processing, chemical industry, and
electronic industry.
Figure 33: Oil mist eliminator
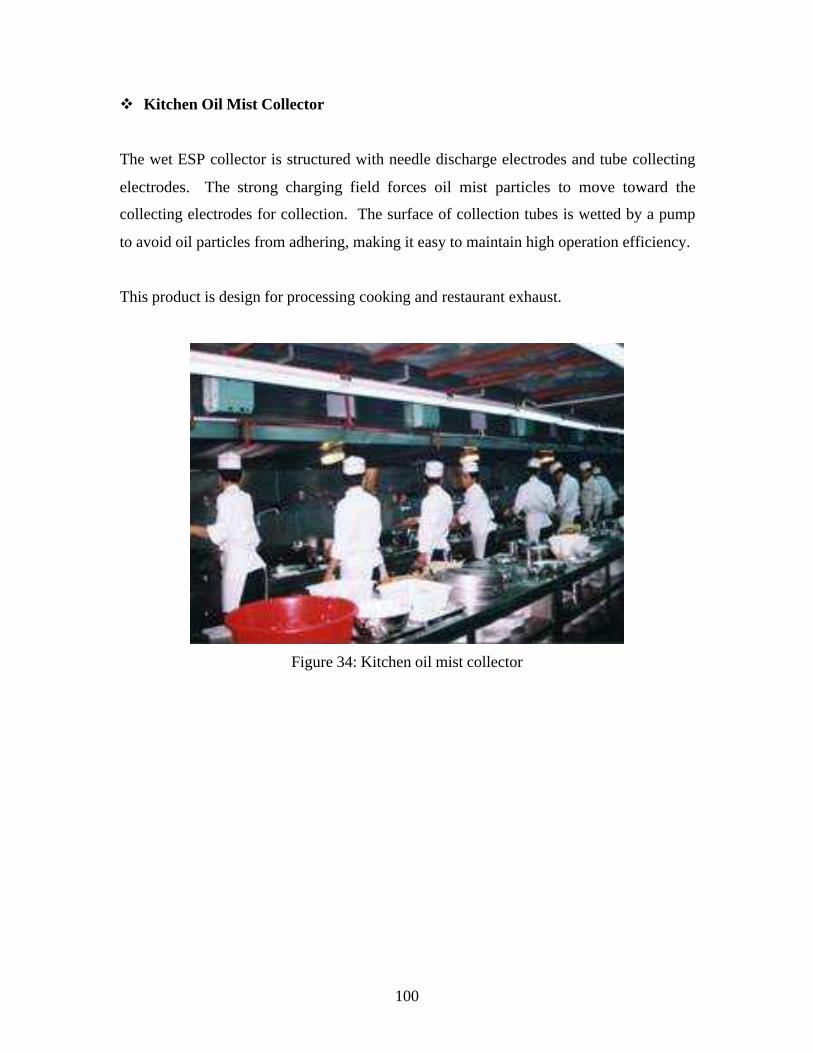
100
v Kitchen Oil Mist Collector
The wet ESP collector is structured with needle discharge electrodes and tube collecting
electrodes. The strong charging field forces oil mist particles to move toward the
collecting electrodes for collection. The surface of collection tubes is wetted by a pump
to avoid oil particles from adhering, making it easy to maintain high operation efficiency.
This product is design for processing cooking and restaurant exhaust.
Figure 34: Kitchen oil mist collector

101
v Central Vacuum Dust Collector for PC Board “Drill” Router
This machine is specially designed for PC Board drill and router machine. The high
pressure central vacuum dust collector is equipped with:
1. Vacuum piping with static pressure control.
2. Pressure-resist cartridge dust collector.
3. Double flap dumping valves.
4. Low noise vacuum blower.
System designed for high pressure and high velocity operation, low abrasion, anti-static,
continuous dust discharge for 24-hrs/day operations.
The machine is mainly created for the following:
1. Vacuum dust collector for PCB’s drill, router, and cutting process.
2. Central vacuum dust collector for other processes.
3. Vacuum cleaning for work area.
Figure 35: Central vacuum dust collector
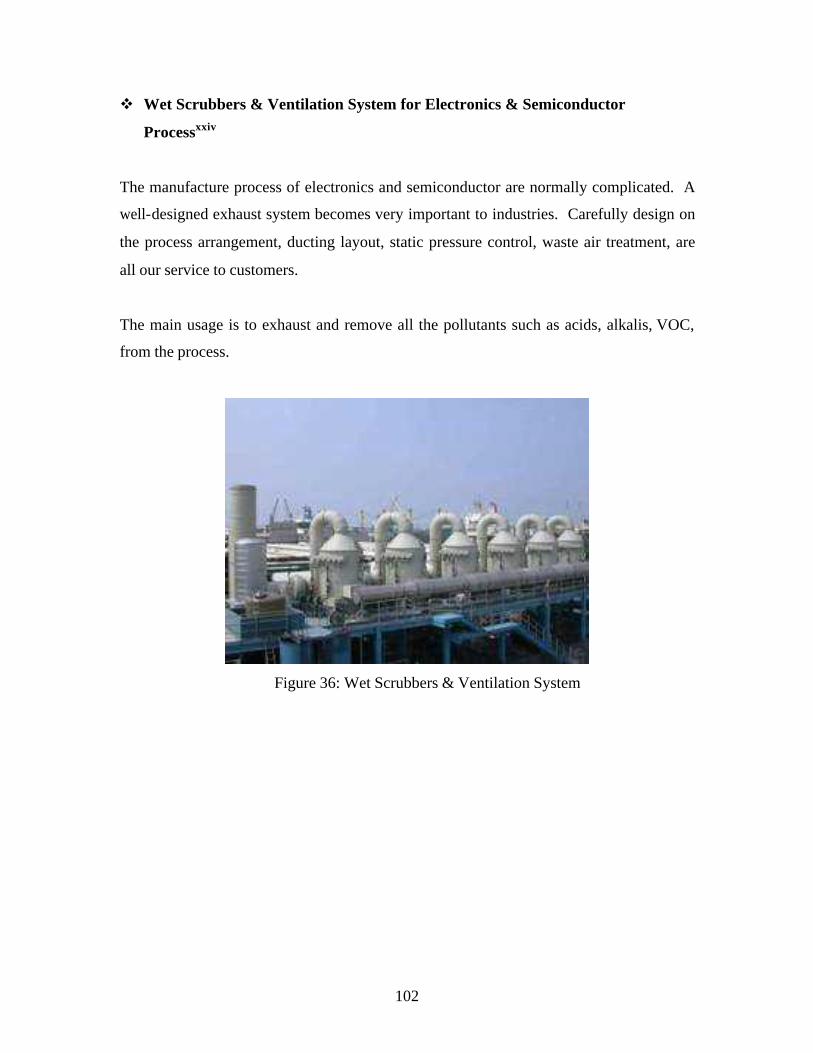
102
v Wet Scrubbers & Ventilation System for Electronics & Semiconductor
Processxxiv
The manufacture process of electronics and semiconductor are normally complicated. A
well-designed exhaust system becomes very important to industries. Carefully design on
the process arrangement, ducting layout, static pressure control, waste air treatment, are
all our service to customers.
The main usage is to exhaust and remove all the pollutants such as acids, alkalis, VOC,
from the process.
Figure 36: Wet Scrubbers & Ventilation System
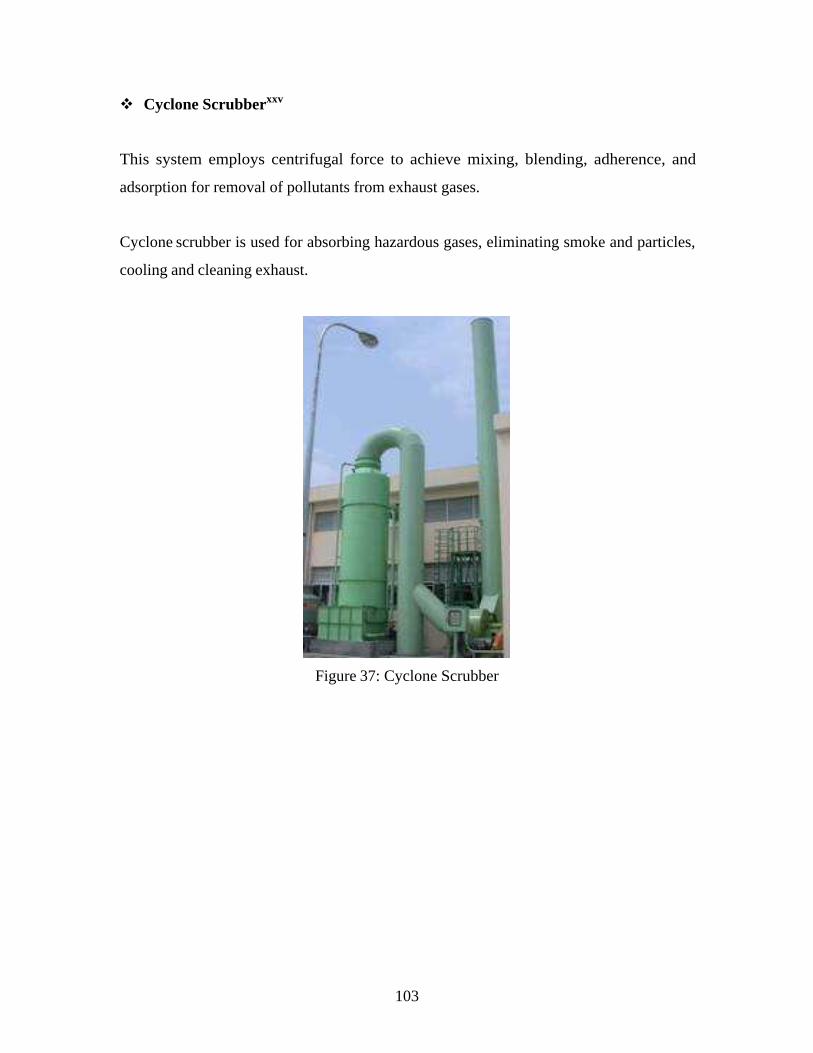
103
v Cyclone Scrubberxxv
This system employs centrifugal force to achieve mixing, blending, adherence, and
adsorption for removal of pollutants from exhaust gases.
Cyclone scrubber is used for absorbing hazardous gases, eliminating smoke and particles,
cooling and cleaning exhaust.
Figure 37: Cyclone Scrubber
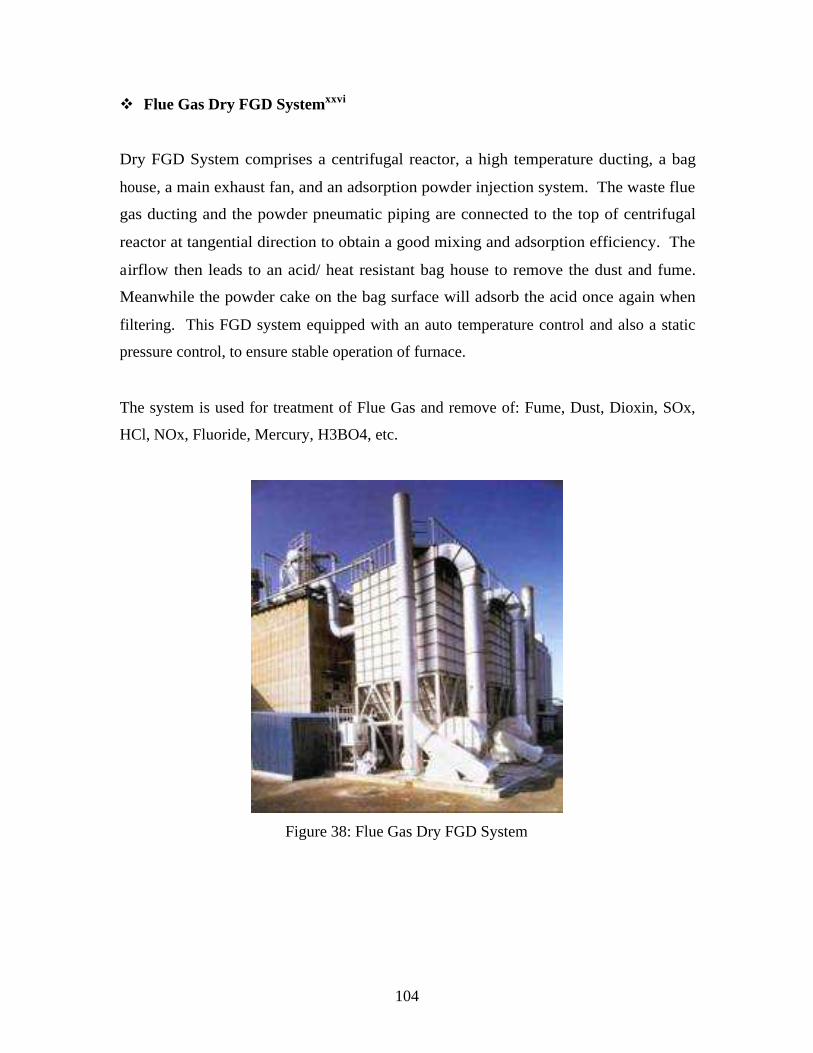
104
v Flue Gas Dry FGD Systemxxvi
Dry FGD System comprises a centrifugal reactor, a high temperature ducting, a bag
house, a main exhaust fan, and an adsorption powder injection system. The waste flue
gas ducting and the powder pneumatic piping are connected to the top of centrifugal
reactor at tangential direction to obtain a good mixing and adsorption efficiency. The
airflow then leads to an acid/ heat resistant bag house to remove the dust and fume.
Meanwhile the powder cake on the bag surface will adsorb the acid once again when
filtering. This FGD system equipped with an auto temperature control and also a static
pressure control, to ensure stable operation of furnace.
The system is used for treatment of Flue Gas and remove of: Fume, Dust, Dioxin, SOx,
HCl, NOx, Fluoride, Mercury, H3BO4, etc.
Figure 38: Flue Gas Dry FGD System
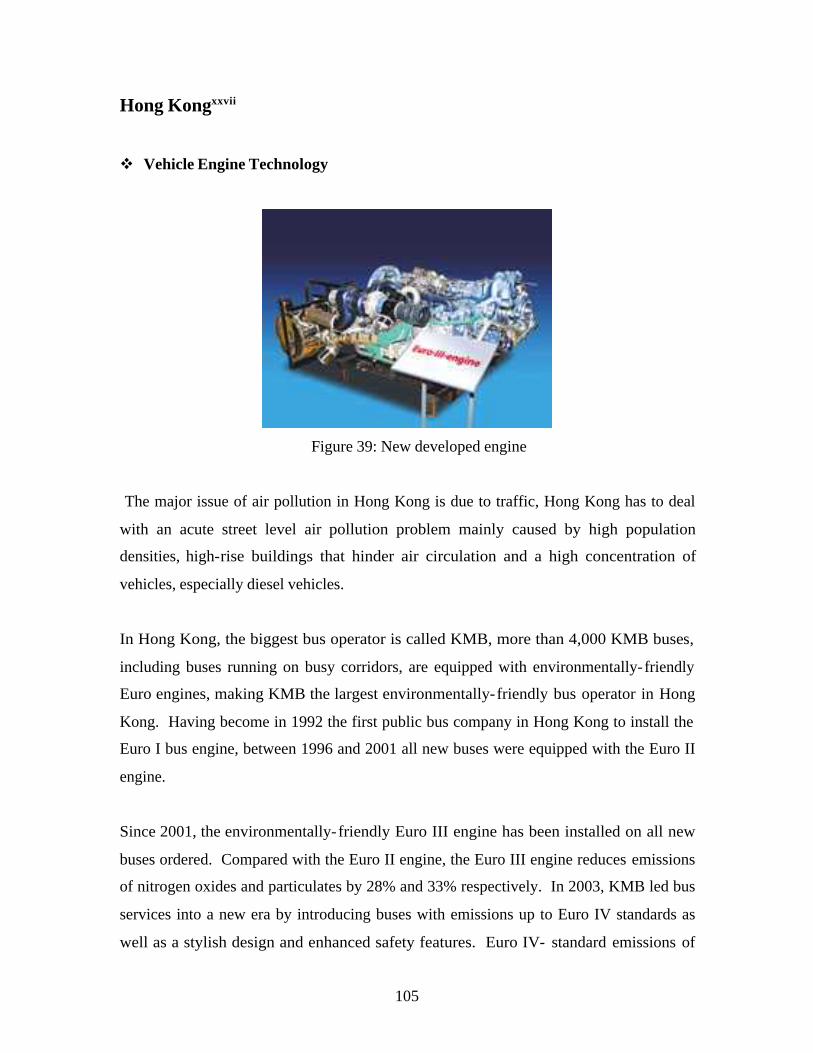
105
Hong Kongxxvii
v Vehicle Engine Technology
Figure 39: New developed engine
The major issue of air pollution in Hong Kong is due to traffic, Hong Kong has to deal
with an acute street level air pollution problem mainly caused by high population
densities, high-rise buildings that hinder air circulation and a high concentration of
vehicles, especially diesel vehicles.
In Hong Kong, the biggest bus operator is called KMB, more than 4,000 KMB buses,
including buses running on busy corridors, are equipped with environmentally-friendly
Euro engines, making KMB the largest environmentally-friendly bus operator in Hong
Kong. Having become in 1992 the first public bus company in Hong Kong to install the
Euro I bus engine, between 1996 and 2001 all new buses were equipped with the Euro II
engine.
Since 2001, the environmentally-friendly Euro III engine has been installed on all new
buses ordered. Compared with the Euro II engine, the Euro III engine reduces emissions
of nitrogen oxides and particulates by 28% and 33% respectively. In 2003, KMB led bus
services into a new era by introducing buses with emissions up to Euro IV standards as
well as a stylish design and enhanced safety features. Euro IV- standard emissions of

106
nitrogen oxides and particulates are reduced by 30% and 80% respectively when
compared with the Euro III engine.
Compared with the emission levels in 1992, each KMB bus emits 75% less particulates
on average. Emission levels of the different types of engines are listed below:
Exhaust emissions (gram per kw/h)
Engine Carbon
Monoxide Hydrocarbons
Nitrogen
Oxides
Particulate
Matter
Euro I 4.5 1.1 8.0 0.36
Euro I I 4.0 1.1 7.0 0.15
Euro I I I 2.1 0.66 5.0 0.10
Euro IV-standard 1.5 0.46 3.5 0.02
Table 3 Comparison of Euro Engine
Figure 40: Consumption of ozone deleting substances
As the trend line of air pollution start to go down after year 1989, it is because Hong
Kong government made new policies which are dealing with environmental pollution,

107
and they were set out in the 1989 White Paper “Pollution, A Time to Act”. Now, the
Government continuously monitored air quality at nine sites throughout Hong Kong. Air
quality in many parts of Hong Kong is reasonably good on a day-to-day basis. But, the
chronic presence of repairable particulate matter in the more congested urban districts
continues consistently to exceed annual acceptable levels. This poses a threat to the
health and well-being of the community and reduces visibility. The main sources of air
pollution in Hong Kong are road vehicles, construction activities and industry. The
major instrument for such control is the Air Pollution Control Ordinance. Ozone
depleting substances are controlled under the Ozone Layer Protection Ordinance. Hong
Kong is, as before, divided by statute into ten Air Control Zones. The Air Pollution
Control (Fuel Restriction) Regulations sets the maximum permitted level of sulfur in
industrial fuel oils at 0.5%.
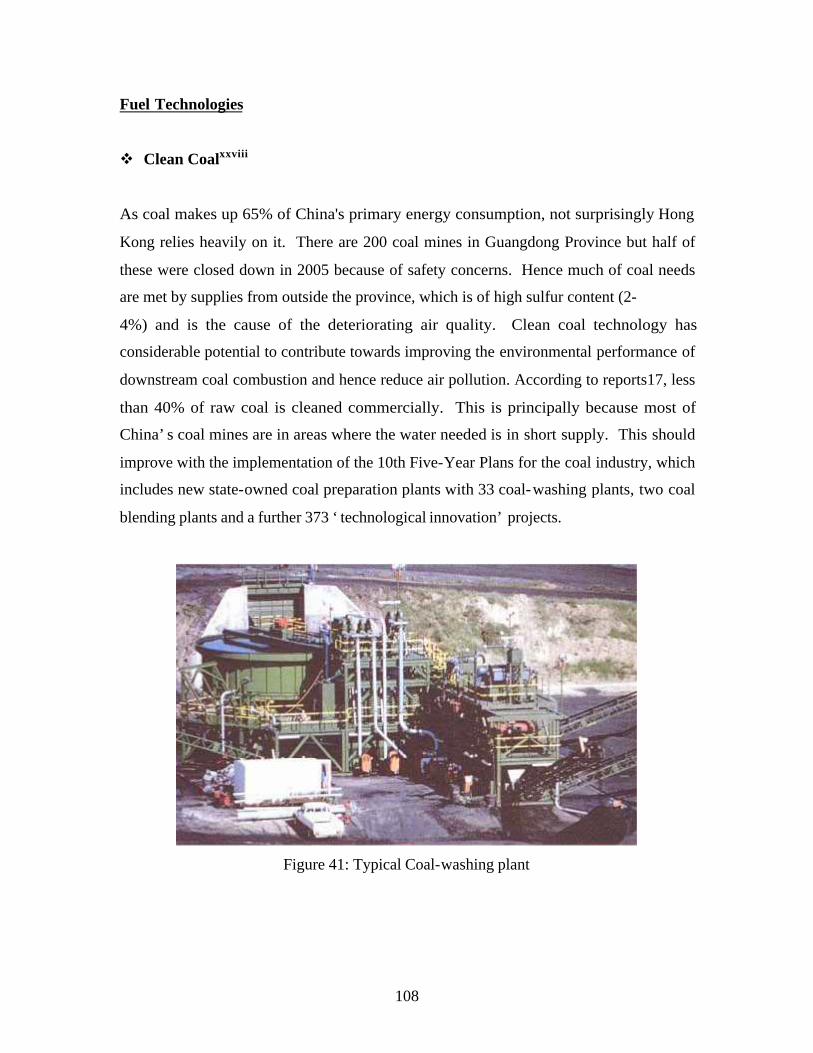
108
Fuel Technologies
v Clean Coalxxviii
As coal makes up 65% of China's primary energy consumption, not surprisingly Hong
Kong relies heavily on it. There are 200 coal mines in Guangdong Province but half of
these were closed down in 2005 because of safety concerns. Hence much of coal needs
are met by supplies from outside the province, which is of high sulfur content (2-
4%) and is the cause of the deteriorating air quality. Clean coal technology has
considerable potential to contribute towards improving the environmental performance of
downstream coal combustion and hence reduce air pollution. According to reports17, less
than 40% of raw coal is cleaned commercially. This is principally because most of
China’s coal mines are in areas where the water needed is in short supply. This should
improve with the implementation of the 10th Five-Year Plans for the coal industry, which
includes new state-owned coal preparation plants with 33 coal-washing plants, two coal
blending plants and a further 373 ‘technological innovation’ projects.
Figure 41: Typical Coal-washing plant
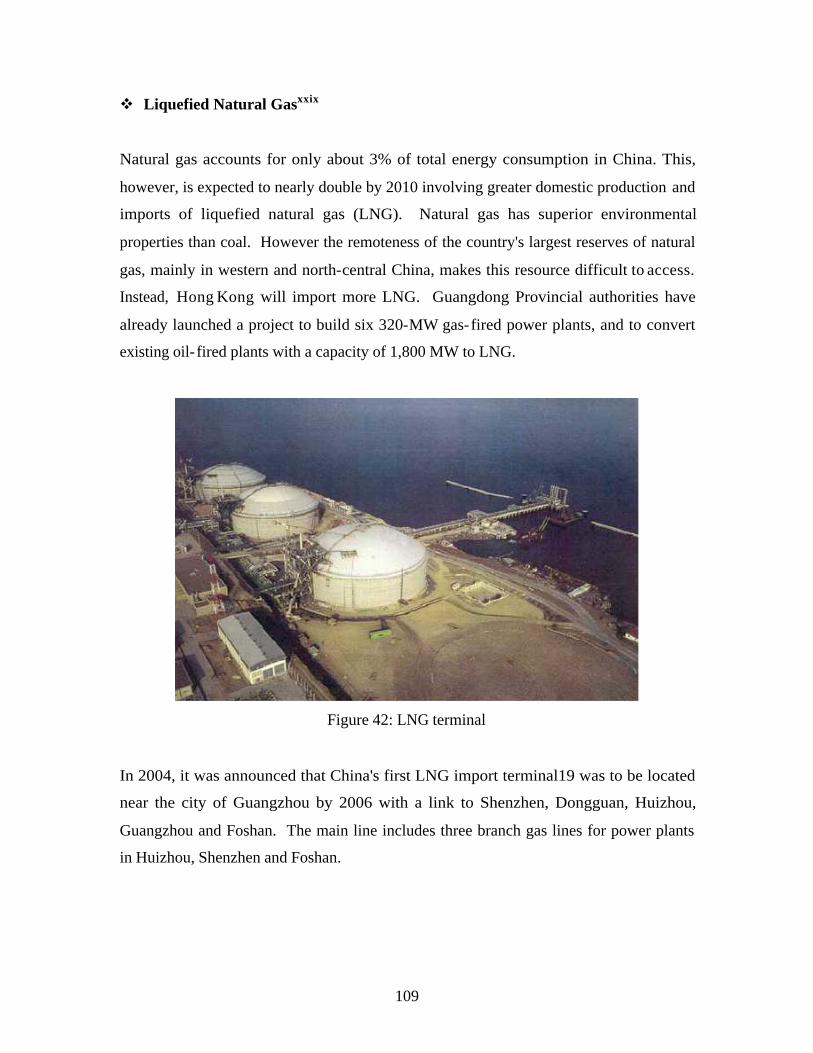
109
v Liquefied Natural Gasxxix
Natural gas accounts for only about 3% of total energy consumption in China. This,
however, is expected to nearly double by 2010 involving greater domestic production and
imports of liquefied natural gas (LNG). Natural gas has superior environmental
properties than coal. However the remoteness of the country's largest reserves of natural
gas, mainly in western and north-central China, makes this resource difficult to access.
Instead, Hong Kong will import more LNG. Guangdong Provincial authorities have
already launched a project to build six 320-MW gas-fired power plants, and to convert
existing oil- fired plants with a capacity of 1,800 MW to LNG.
Figure 42: LNG terminal
In 2004, it was announced that China's first LNG import terminal19 was to be located
near the city of Guangzhou by 2006 with a link to Shenzhen, Dongguan, Huizhou,
Guangzhou and Foshan. The main line includes three branch gas lines for power plants
in Huizhou, Shenzhen and Foshan.
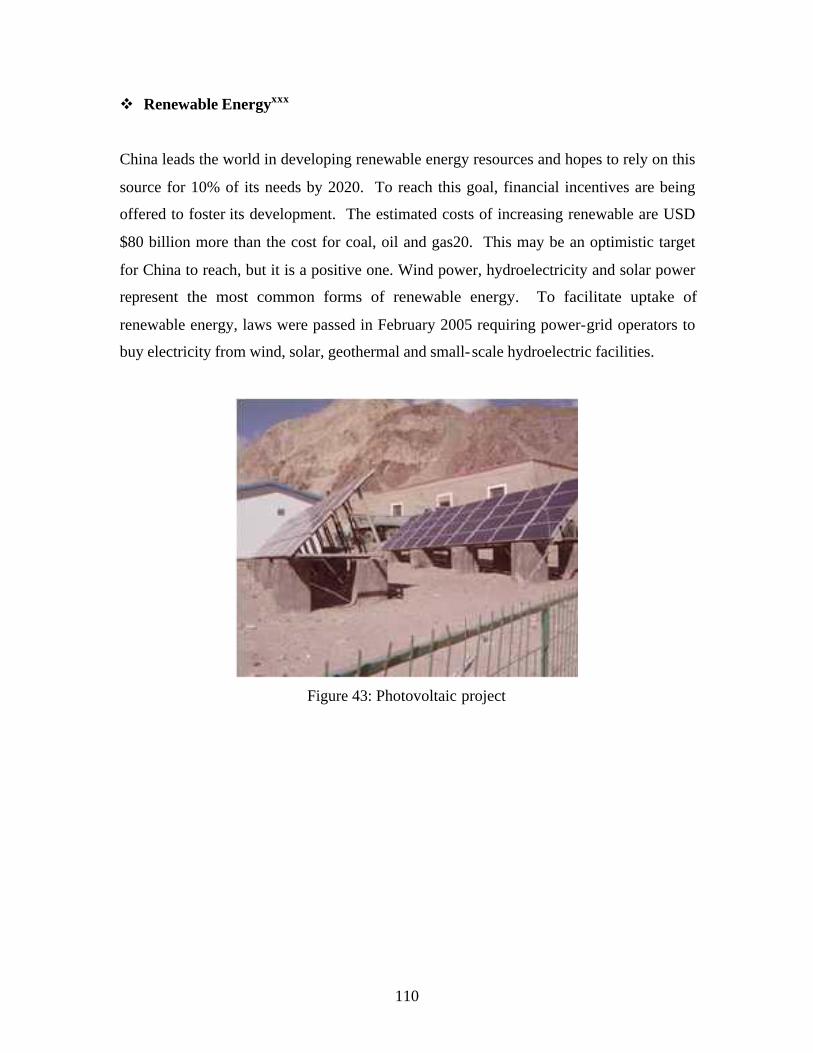
110
v Renewable Energyxxx
China leads the world in developing renewable energy resources and hopes to rely on this
source for 10% of its needs by 2020. To reach this goal, financial incentives are being
offered to foster its development. The estimated costs of increasing renewable are USD
$80 billion more than the cost for coal, oil and gas20. This may be an optimistic target
for China to reach, but it is a positive one. Wind power, hydroelectricity and solar power
represent the most common forms of renewable energy. To facilitate uptake of
renewable energy, laws were passed in February 2005 requiring power-grid operators to
buy electricity from wind, solar, geothermal and small-scale hydroelectric facilities.
Figure 43: Photovoltaic project
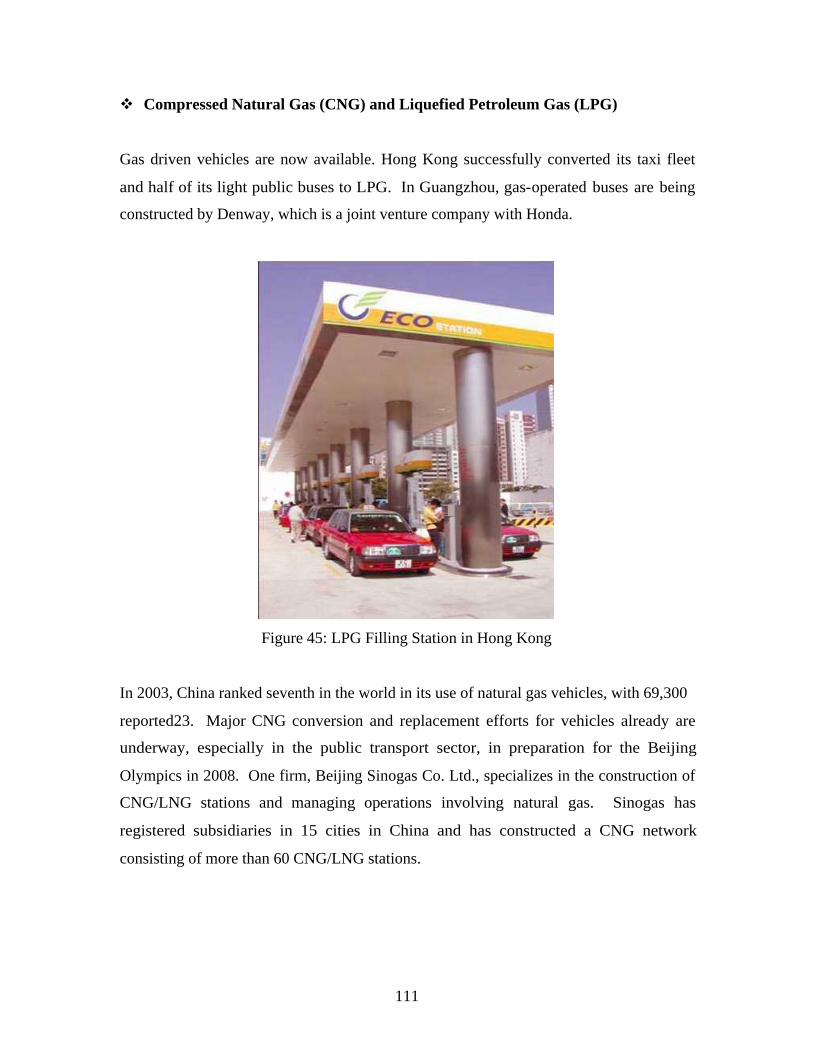
111
v Compressed Natural Gas (CNG) and Liquefied Petroleum Gas (LPG)
Gas driven vehicles are now available. Hong Kong successfully converted its taxi fleet
and half of its light public buses to LPG. In Guangzhou, gas-operated buses are being
constructed by Denway, which is a joint venture company with Honda.
Figure 45: LPG Filling Station in Hong Kong
In 2003, China ranked seventh in the world in its use of natural gas vehicles, with 69,300
reported23. Major CNG conversion and replacement efforts for vehicles already are
underway, especially in the public transport sector, in preparation for the Beijing
Olympics in 2008. One firm, Beijing Sinogas Co. Ltd., specializes in the construction of
CNG/LNG stations and managing operations involving natural gas. Sinogas has
registered subsidiaries in 15 cities in China and has constructed a CNG network
consisting of more than 60 CNG/LNG stations.
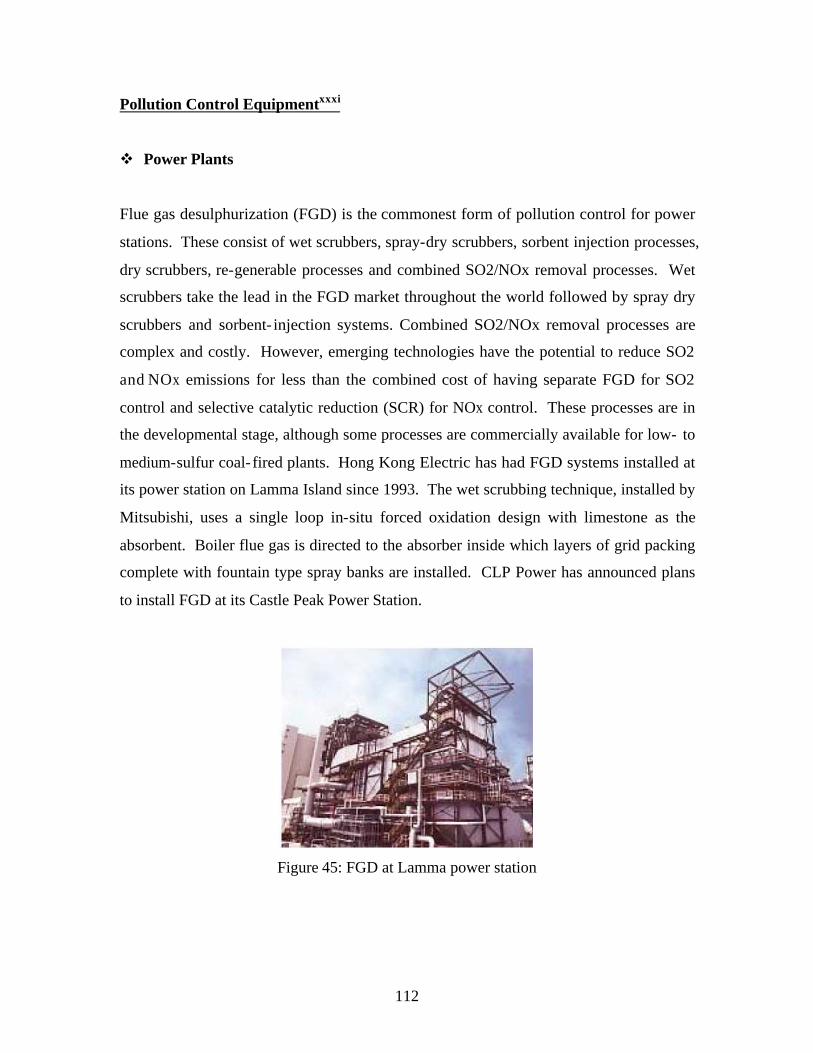
112
Pollution Control Equipmentxxxi
v Power Plants
Flue gas desulphurization (FGD) is the commonest form of pollution control for power
stations. These consist of wet scrubbers, spray-dry scrubbers, sorbent injection processes,
dry scrubbers, re-generable processes and combined SO2/NOx removal processes. Wet
scrubbers take the lead in the FGD market throughout the world followed by spray dry
scrubbers and sorbent- injection systems. Combined SO2/NOx removal processes are
complex and costly. However, emerging technologies have the potential to reduce SO2
and NOx emissions for less than the combined cost of having separate FGD for SO2
control and selective catalytic reduction (SCR) for NOx control. These processes are in
the developmental stage, although some processes are commercially available for low- to
medium-sulfur coal- fired plants. Hong Kong Electric has had FGD systems installed at
its power station on Lamma Island since 1993. The wet scrubbing technique, installed by
Mitsubishi, uses a single loop in-situ forced oxidation design with limestone as the
absorbent. Boiler flue gas is directed to the absorber inside which layers of grid packing
complete with fountain type spray banks are installed. CLP Power has announced plans
to install FGD at its Castle Peak Power Station.
Figure 45: FGD at Lamma power station

113
Japan xxxii
Dust Collector
v Smoke Soot Filter Plant System
The dust collection system has been obtained, whose filter collects the soot in tunnel gas
which are exhausted from tunnel ventilation tower, whose automatic revival mechanism
removes the soot from the dirty filter by air blow, and whose bag filter stores the
removed soot.
Figure 46: Smoke Soot Filter Plant System Diagram
Figure 47: Smoke Soot Filter Plant

114
Desulphurization Equipmentxxxiii
v Compact FGD System
Air pollution is one of the very important issues world-wide. The wet limestone-gypsum
process has been the most popular method adopted to eliminate SO2 emitted from
Thermal Power Stations.
However, due to the relatively high construction cost, its further implementation has
inevitably limited and the development of more economical FGD technology has been
sought. Hence, Hitachi Compact FGD System was developed, for the purposes of
simplification and cost reduction utilizing features of the latest FGD technology fully.
The first System was delivered to Peoples Republic of China under the "Green Aid Plan",
which has been organized and managed by the Ministry of International Trade and
Industry (MITI), Japan, in order to implement their policy to transfer environmental
preservation technology to neighboring countries and it contributes to global
environmental preservation. And the technologies, such as, higher gas velocity in the
absorber and adoption of horizontal flow spray absorber instead of conventional vertical
flow spray absorber shortened duct length. Eventually it helps to accomplish a lower
construction cost.
Figure 48: The process flow sheet

115
Figure 49: Outline of absorber
Figure 50: Picture of Compact FGD

116
De-Nitrification Equipmentxxxiv
v De-NOx System
The De-NOx apparatus is applied to suppress air pollution by converting nitrogen oxides,
which are contained in flue gas emitted from boilers, furnaces, etc., or in tail gas emitted
from nitric acid plants, into nitrogen and water with high efficiency.
Figure 51: Process flow sheet
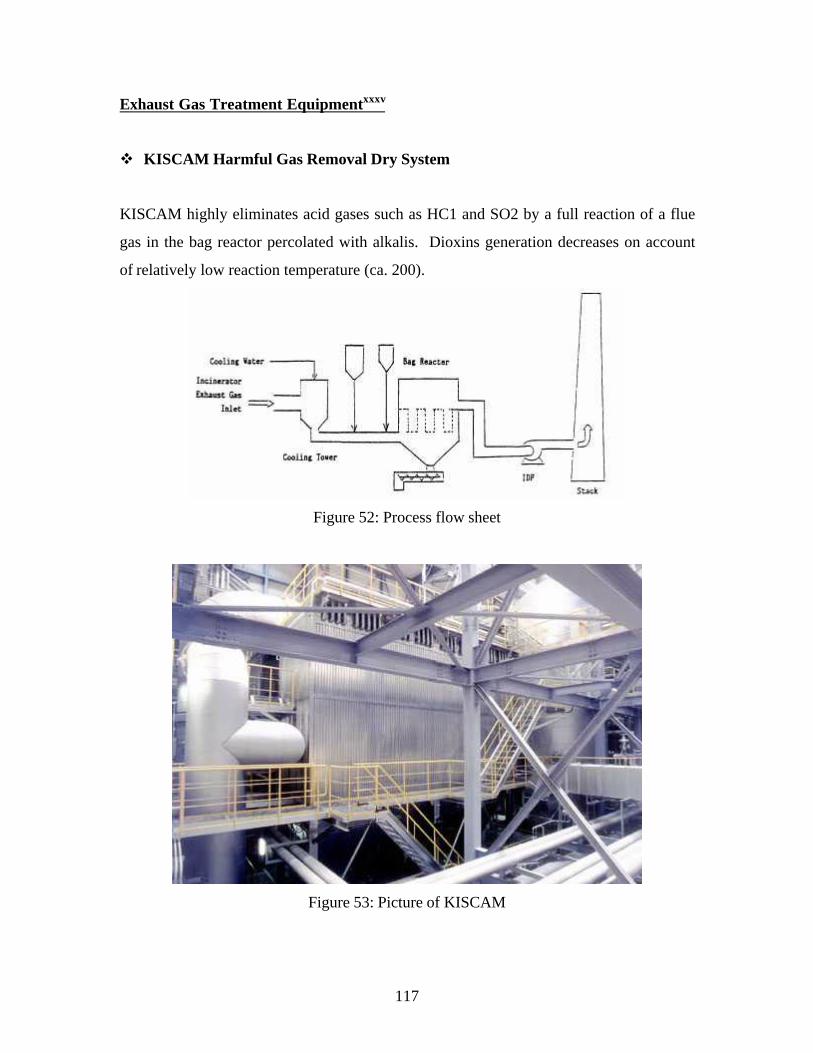
117
Exhaust Gas Treatment Equipmentxxxv
v KISCAM Harmful Gas Removal Dry System
KISCAM highly eliminates acid gases such as HC1 and SO2 by a full reaction of a flue
gas in the bag reactor percolated with alkalis. Dioxins generation decreases on account
of relatively low reaction temperature (ca. 200).
Figure 52: Process flow sheet
Figure 53: Picture of KISCAM
118
Sulfur Recovery Unitxxxvi
v Scot Process
SCOT Process (Shell Claus Off-gas Treating Process) was developed by Shell, and
introduced in the early seventies as an attractive process for improving the efficiency of a
Sulfur Recovery Unit (SRU; Claus Unit). Since the first unit was started-up in 1973,
more than 120 units have been built with a wide range of capacities.
SRU Plant is normally located in Petroleum Refineries in combination with hydrogen
sulfide removal plant in a Hydro-Desulphurization Unit (HDS).
The HDS Process is one of the most important key technologies for refining low grade
fuels and preventing air pollution from internal combustion engines and burning facilities.
By using the SCOT process, the overall sulfur recovery of SRU can reach about 95% to
99.9% while the Super-SCOT process can give 99.95% recovery, which makes it capable
of coping with the most stringent legislation.
JGC Corporation has been sublicensed by Shell as one of three authorized licensor in the
world, and has a lot of achievements with many clients, all over the world.
Process Features:
· High reliability and stability in operation.
· Sulfur recovery efficiency exceeding 99.9%.
· Flexible design alternatives applying various reducing gases, using different
solvents and so on.
· Optimum design philosophy on the basis of extensive past experience.

119
Figure 54: Scot Process Flow Diagram
Figure 55: Super Scot Process Flow Diagram
120
De-carbonization Equipment (CO2 Reduction)xxxvii
v Flue Gas CO2 Recovery Unit
New, cost effective flue gas CO2 recovery system was developed by the cooperative
efforts of the Mitsubishi Heavy Industries, Ltd. and the Kansai Electric Power Co., Ltd.
This recovery technology makes use of the chemical absorption method, where the flue
gas is first cooled to ambient temperature, and is reacted against an amine-type CO2
absorbing solution. The flue gas can be vented to the atmosphere after CO2 recovery has
been completed. The CO2-rich amine solution is then transferred to the Regenerator, and
heated (by the low pressure steam) to release CO2. The advantage of our technology
consists of the low heat input requirement for the regeneration of fluids, as well as the
low consumption of absorbing solution. Although our primary purpose of our new
development is rooted in the environmental concerns over global warming, we also
recognize its high potential for commercial application. Examples of such applications
are; dry ice production, carbonation, and its direct use in as raw material for synthesis
reactions in chemical plants.
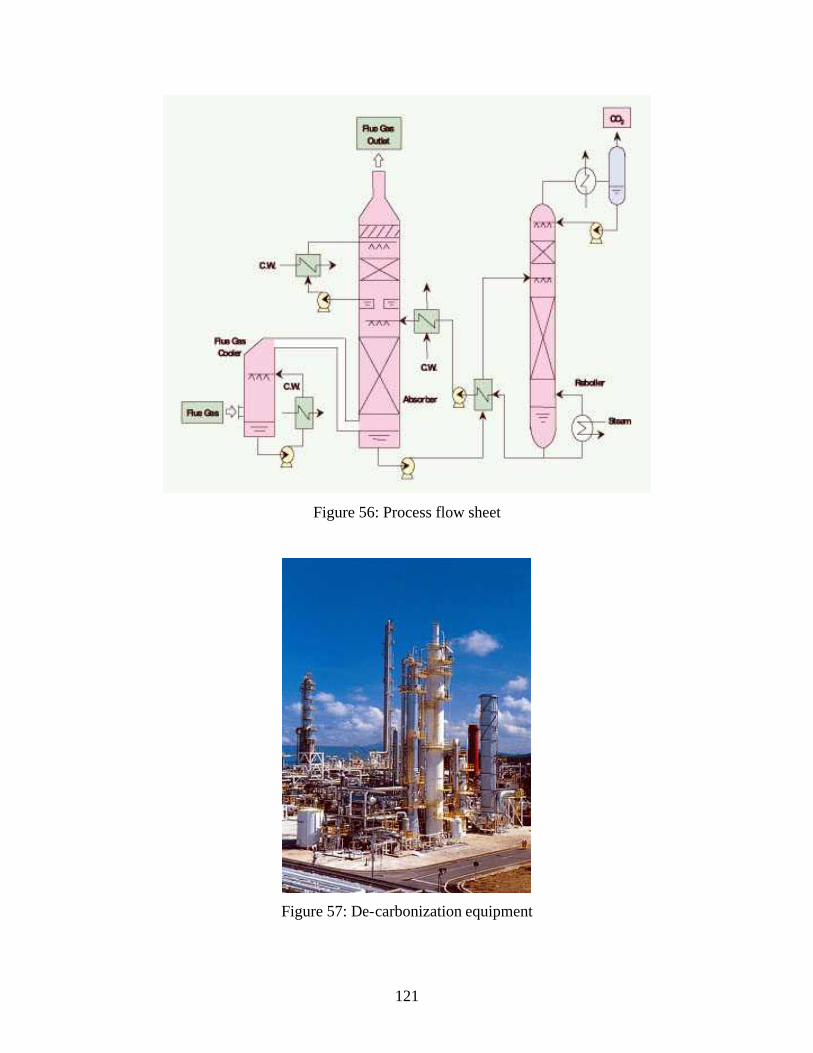
121
Figure 56: Process flow sheet
Figure 57: De-carbonization equipment

122
4.2.4 Analysis and Comparison
As the result presents, Taiwan, Hong Kong, and Japan have similar objectives toward air
pollution, which is to decrease all types of emission and enhance the effectiveness of
monitoring system. Lower the emission is obvious the major and final objective for all
kind of air pollution prevention since it is the main cause. However, monitoring system,
the combination of new government policy and technology, it is useful for tracking air
conditions in distinct areas. The reason for air pollution issue being so serious in the
present time is because there was no high-maintained control action. In order to learn the
less from the past, monitoring system is extremely essential and helpful to prevent the
situation getting any worse. Though, the monitoring system technology requires no
improvement or new invention. The emphasis is to set up the system in the right place
for enhancing the level of detection. Generally, monitoring systems are built in areas
with high dense of population or heavy industry sections since the contaminants seem to
be largely created in such regions.
Refer to the result of pollutant sources identified in Chapter 2; most of the pollutant
comes from both vehicular fuel emission and industrial oil or fuel emission. For this
reason, there are two ideal solutions: first one is to make the use of fuels more
economical so there will be fewer leftovers which mean less emission in total; the other
idea is to invent new technology which demands less fuel or oil as resource so it could
possibly generate no emission. Consequently, each region does use technologies based
on these two theoretical solutions. As the world’s greatest electronics and semiconductor
manufacturing country, Taiwan spends air quality control fees on building “wet scrubber
and ventilation systems”, which are used to decrease or remove all the pollutants such as
acids, alkalis, VOC, etc. that were produced electronics and semiconductor manufactures.
Taiwan also set up “cyclone scrubber” that is used for absorbing hazardous gases,
eliminating smoke and particles, cooling and cleaning exhaust. For heavy industrial
emission control, Taiwan presents “oil mist eliminator”, which is mainly used for screw
and steel rolling, metallic surface processing, chemical industry, and electronic industry.
The idea is to reduce the oil emission and decrease the polluting level. Taiwan also

123
presents a “kitchen oil mist eliminator”, which is the same technology with smaller
volume and being set up in kitchen for reducing cooking oil emission. It was an
interesting idea since Asian food production in general contains more oil than western
countries. In this case, such technology can be used wisely and extensively throughout
the whole Asia.
Hong Kong, on the other hand, concentrates on the vehicle gasoline emission control.
The major technical solution is the “vehicle engine technology”, which is so called the
Euro-emission standard engine. This technology has been established on public
transportations since 1992, where it is being used to reduce emissions of nitrogen oxides
which are the major pollutant from vehicular emission. The newest version, Euro IV, has
the capability to reduce nitrogen oxides and critical particulates by 30% in general. For
industrial emission, Hong Kong set up clean coal machines in firms for reduction of
emission. Hong Kong also introduces some other fuel technology which is mainly
invented to deal with renewable energy so there will be less wasted energy and less
emission created in total. Similar to the oil mist eliminator in Taiwan, Hong Kong
generates technology to liquefy natural gas so the emission level would decrease prior to
the same amount of usage.
Japanese technical solutions are generally base on pollutant itself. As the result shows,
there are machines against nitrogen dioxides (de-nitrification equipment), Carbon
dioxides (de-carbonization equipment), and sulfur particulates (Scot process). Each
technology is established to reduce pollutant level. For exhaust gas treatment equipment,
Japan introduces the “KISCAM harmful gas removal dry system” that eliminates acid
gases such as HCL and SO2 by a full reaction of a flue gas in the bag reactor percolated
with alkalis. Overall, Japan presents the “smoke soot filter plant system” for dust
collection. The dust collection system uses filters to collect the soot in tunnel gas which
are exhausted from tunnel ventilation tower, whose automatic revival mechanism
removes the soot from the dirty filter, and whose bag filter stores the removed soot. Such
system can be used extensively against distinct pollutants.

124
4.3 Government Policy
This section provides air quality related regulations published by each region. For
distinct catalogue of pollutant, the result will output how each region present their air
quality control by certain restriction and individual level of punishment. To differ from
high restricted regulation, some regions also present the air quality control act by using
promotion, which will also be detailed explained in the following section.
4.3.1 Taiwanxxxviii
Regulation of Environment Control Regions
The central competent authority shall delineate and officially announce each class of
special municipality, county and city control region based on the demands placed upon
air quality by land use or air quality conditions.
The control regions in the foregoing paragraph shall be divided into the following three
classes.
1. Class 1 control regions means such areas as national parks and nature protection
and conservation areas that are delineated in accordance with the law.
2. Class 2 control regions means areas that meet air quality standards, with the
exception of Class 1 control regions.
3. Class 3 control regions means areas that do not meet air quality standards, with
the exception of Class 1 control regions.
Stationary pollution sources may not be newly added or modified within Class 1 control
regions, with the exception of facilities for maintaining the livelihoods of residents within
the region, facilities necessary for the operation and management of national parks, and
national defense facilities.
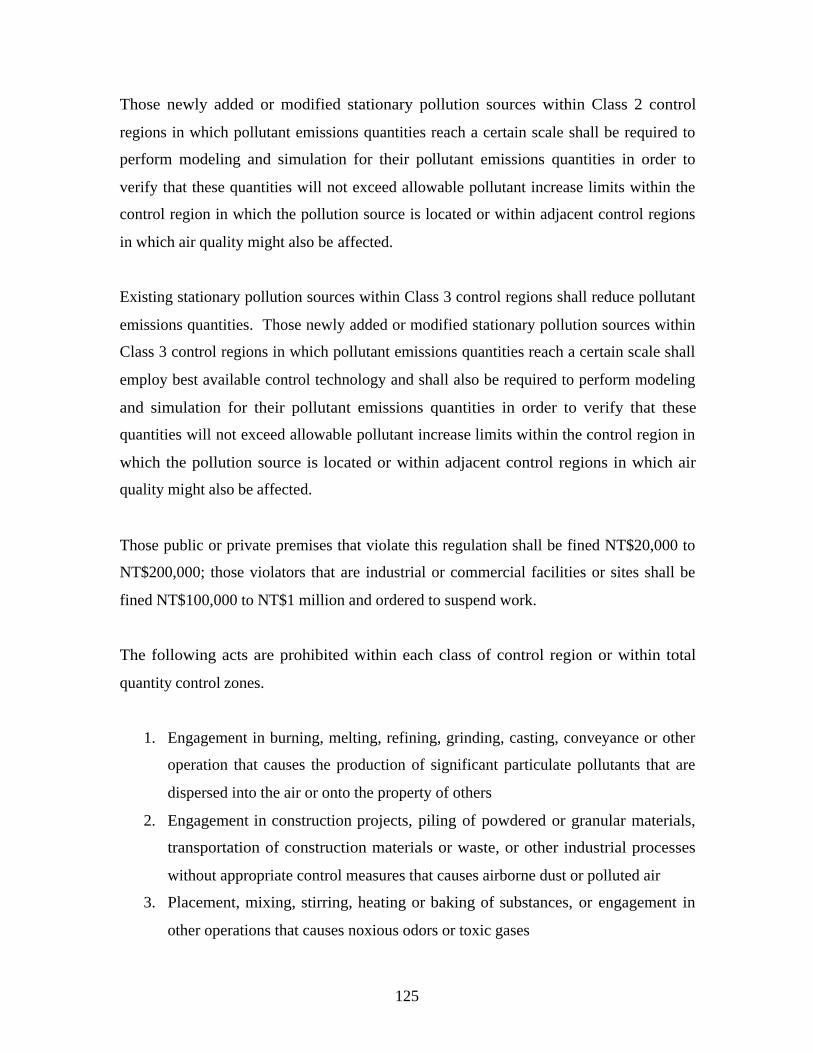
125
Those newly added or modified stationary pollution sources within Class 2 control
regions in which pollutant emissions quantities reach a certain scale shall be required to
perform modeling and simulation for their pollutant emissions quantities in order to
verify that these quantities will not exceed allowable pollutant increase limits within the
control region in which the pollution source is located or within adjacent control regions
in which air quality might also be affected.
Existing stationary pollution sources within Class 3 control regions shall reduce pollutant
emissions quantities. Those newly added or modified stationary pollution sources within
Class 3 control regions in which pollutant emissions quantities reach a certain scale shall
employ best available control technology and shall also be required to perform modeling
and simulation for their pollutant emissions quantities in order to verify that these
quantities will not exceed allowable pollutant increase limits within the control region in
which the pollution source is located or within adjacent control regions in which air
quality might also be affected.
Those public or private premises that violate this regulation shall be fined NT$20,000 to
NT$200,000; those violators that are industrial or commercial facilities or sites shall be
fined NT$100,000 to NT$1 million and ordered to suspend work.
The following acts are prohibited within each class of control region or within total
quantity control zones.
1. Engagement in burning, melting, refining, grinding, casting, conveyance or other
operation that causes the production of significant particulate pollutants that are
dispersed into the air or onto the property of others
2. Engagement in construction projects, piling of powdered or granular materials,
transportation of construction materials or waste, or other industrial processes
without appropriate control measures that causes airborne dust or polluted air
3. Placement, mixing, stirring, heating or baking of substances, or engagement in
other operations that causes noxious odors or toxic gases

126
4. Use, conveyance or storage of organic solvents or other volatile substances that
causes noxious odors or toxic gases
5. Food preparation by the food and beverage industry that causes the dispersal of
oily smoke or noxious odors
6. Other air polluting acts officially announced by the competent authority
Air polluting acts in the foregoing paragraph means acts in which air pollutants are not
emitted through exhaust pipes.
Those that violate one of the circumstances in the foregoing paragraph shall be fined
NT$5,000 to NT$100,000; those violators that are industrial or commercial facilities or
sites shall be fined NT$100,000 to NT$1 million.
Those fined pursuant to the foregoing paragraph shall also be notified to make
improvements within a limited period; those that have still failed to complete
improvements by the deadline shall be issued consecutive daily fines; in those severe
circumstances, orders may be issued for the suspension of activities or the suspension of
the operation of pollution sources, or issued for the suspension of work or the suspension
of business, and, when necessary, operating permits may be cancelled or orders issued for
the termination of business.
127
Regulation of Contaminant Emission
The central competent authority may, based on topographical and meteorological
conditions, designate single or multiple special municipalities, counties or cities between
which it is possible for air pollutants to circulate as total quantity control zones,
determine total quantity control plans, and officially announce and implement total
quantity controls.
Within a total quantity control zone that meets air quality standards, those newly installed
or modified stationary pollution sources for which pollutant emissions quantities reach a
certain scale shall be required to perform modeling and simulation for their pollutant
emissions quantities in order to verify that these quantities will not exceed allowable
pollutant increase limits within the zone.
Within a total quantity control zone that does not meet air quality standards: an existing
stationary pollution source shall apply to the local competent authority for authorization
of its pollutant emissions quantity and shall make reductions in accordance with the
targets and deadlines the central competent authority has designated based on air quality
requirements; and, newly installed or modified stationary pollution sources for which
pollutant emissions quantities reach a certain scale shall employ best available control
technology and obtain emissions quantities sufficient to offset pollutant emissions
increases.
Those existing stationary pollution sources that, as a result of the adoption of control
measures, achieve actual emissions reduction quantities greater than designated reduction
quantities may bank offset or trade the difference after authorization by the local
competent authority.
Those public or private premises that fail to reduce pollutant emissions quantities
regarding the last paragraph or that violate the regulations for the authorization of the
emissions reduction quantities difference for banking shall be fined NT$20,000 to
128
NT$200,000; those violators that are industrial or commercial facilities or sites shall be
fined NT$100,000 to NT$1 million.
Those fined pursuant to the foregoing paragraph shall also be notified to make
corrections or improvements within a limited period; those that have still failed to make
corrections or complete improvements by the deadline shall be issued consecutive daily
fines; in those severe circumstances, the public or private premises may be ordered to
suspend work or suspend business and, when necessary, may have its operating permit
cancelled or be ordered to terminate business.
The total quantity control plans of total quantity control zones that meet air quality
standards shall include allowable pollutant increase limits, measures for avoiding the
deterioration of air quality, rules for the approval of newly added or modified stationary
pollution sources, organizational and operational methods, and other matters.
The total quantity control plans of total quantity control zones that do not meet air quality
standards shall include pollutant types, quantity reduction targets, quantity reduction
timetables, pollutant reduction quantities and timetables that the competent authorities of
each special municipality, county and city within the control zone shall be required to
implement, rules for the approval of newly added or modified stationary pollution
sources, organizational and operational methods, and other matters.
Competent authorities at all levels may collect air pollution control fees from stationary
and mobile pollution sources that emit air pollutants. The targets of air pollution control
fees are as follows.
1. Stationary pollution sources: fees shall be collected from the owners of the
pollution source based on the types and quantity of air pollutants emitted; fees
shall be collected from the actual user or manager if the owner of the source is not
the user or manager; fees shall be collected from the construction project owner if
the pollution source is a construction project; for substances designated and
129
officially announced by the central competent authority, fees may be collected
from the vendor or importer based on the sales volume of the substance.
2. Mobile pollution sources: fees shall be collected from the vendor or user based on
the types and quantity of air pollutants emitted, or from the vendor or importer
based on the type, composition and quantity of fuel.
For those that fail to pay fees pursuant to the fee collection regulations determined
regarding the foregoing paragraph by the deadline, an overdue fine, which shall be
assessed at a rate of 0.5% of the overdue amount for each day the fees are overdue, shall
be paid together with the overdue fees; those that have still failed to pay fees 30 days
after the deadline shall be fined NT$1,500 to NT$60,000; those violators that are
industrial or commercial facilities or sites shall be fined NT$100,000 to NT$1 million
and ordered to pay within a limited period; those that have still failed to pay fees by the
deadline shall be referred for compulsory enforcement in accordance with the law.
Those public and private premises possessing stationary pollution sources designated and
officially announced by the central competent authority shall complete the installation of
automatic monitoring facilities by the designated deadline in order to continuously
monitor their operations or air pollutant emissions conditions, and shall apply to the
competent authority for authorization; those that have been designated and officially
announced as being required to connect via the internet shall complete the connection of
their monitoring facilities via the Internet to the competent authority by the designated
deadline.
With the exception of the pollution sources in the foregoing paragraph, the competent
authority may, when it deems necessary, designate and officially announce whether a
pollution source shall perform regular analysis on its own or shall commission an
analysis laboratory to conduct such analysis.
130
Public and private premises shall effectively collect each type of air pollutant and
maintain the normal operation of their air pollution control facilities and monitoring
facilities; the maximum operating quantity of their stationary pollution sources may not
exceed the maximum treatment capacity of their air pollution control facilities.
Those vendors or users of bituminous coal, petroleum coke or other substances prone to
cause air pollution shall first submit the relevant documents in order to apply to the
special municipality, county or city competent authority; the sale or use of these
substances may begin only after a review of qualifications and the issuance of a permit;
records of the sale and use of these substances shall be maintained and reported to the
local competent authority in accordance with regulations. Those that violates such
regulation shall be fined NT$5,000 to NT$100,000; those violators that are industrial or
commercial facilities or sites shall be fined NT$100,000 to NT$1 million.
Those fined pursuant to the foregoing paragraph shall also be notified to make
corrections or report within a limited period; those that have still failed to comply by the
deadline shall be issued consecutive daily fines; in those severe circumstances, orders
may be issued for the suspension of work or suspension of business and, when necessary,
sales or use permits may be cancelled or orders issued for the termination of business.

131
Regulation of Monitoring System
Competent authorities at all levels shall select appropriate locations for the installation of
air quality monitoring stations and officially publish air quality conditions at regular
intervals.
Those public or private premises that violate regulation regarding the last paragraph shall
be fined NT$100,000 to NT$1 million; in those severe circumstances, the public or
private premises may be ordered to suspend work or suspend business.
When developing special industrial parks, buffer zones and air quality monitoring
facilities shall be planned and installed within the boundaries of the parks or in
appropriate areas.
For those circumstances stated in the foregoing paragraph is violated, the developer shall
be fined NT$500,000 to NT$5 million and notified to make improvements within a
limited period; those that have still failed to complete improvements by the deadline shall
be issued consecutive daily fines.
Those that lack air pollution control equipment and burn substances prone to cause
particular harm to health shall be punished by a maximum of three years imprisonment,
detention and/or a fine of NT$200,000 to NT$1 million.
132
Regulations Relate to Ground Transportation
The owners of transportation vehicles shall maintain the effective operation of the air
pollution control equipment of their vehicle and may not remove or modify this
equipment.
For those in-use motor vehicles that have undergone random testing of air pollutants
emissions by the central competent authority and that are determined to be unable to meet
air pollution emissions standards for transportation vehicles due to poor design or
assembly, the central competent authority shall order the manufacturer or importer to
recall for correction within a limited period all units of the model of the motor vehicle at
issue that have already been sold; the central competent authority shall suspend the
manufacture, import and sales of those manufacturers or importers that fail to comply
with this order by the deadline.
Those manufacturers or importers that violate the foregoing paragraph regulation by
failure to issue recall notifications shall be fined NT$100,000 per vehicle.
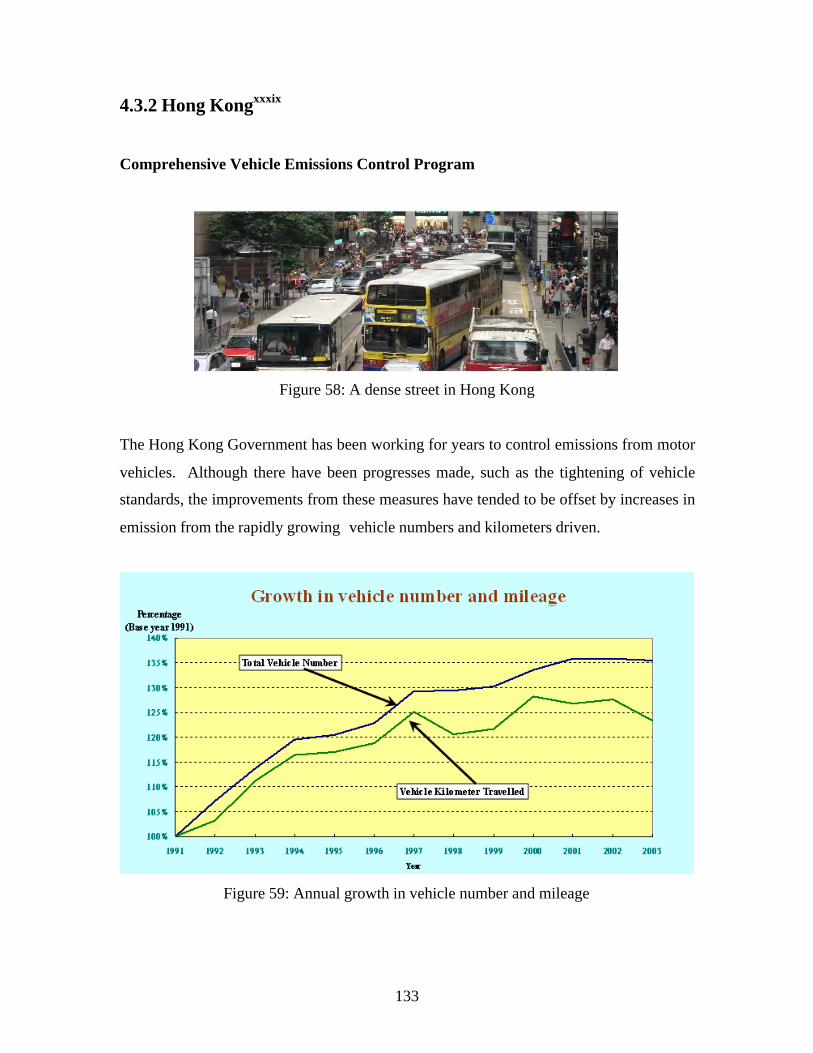
133
4.3.2 Hong Kongxxxix
Comprehensive Vehicle Emissions Control Program
Figure 58: A dense street in Hong Kong
The Hong Kong Government has been working for years to control emissions from motor
vehicles. Although there have been progresses made, such as the tightening of vehicle
standards, the improvements from these measures have tended to be offset by increases in
emission from the rapidly growing vehicle numbers and kilometers driven.
Figure 59: Annual growth in vehicle number and mileage
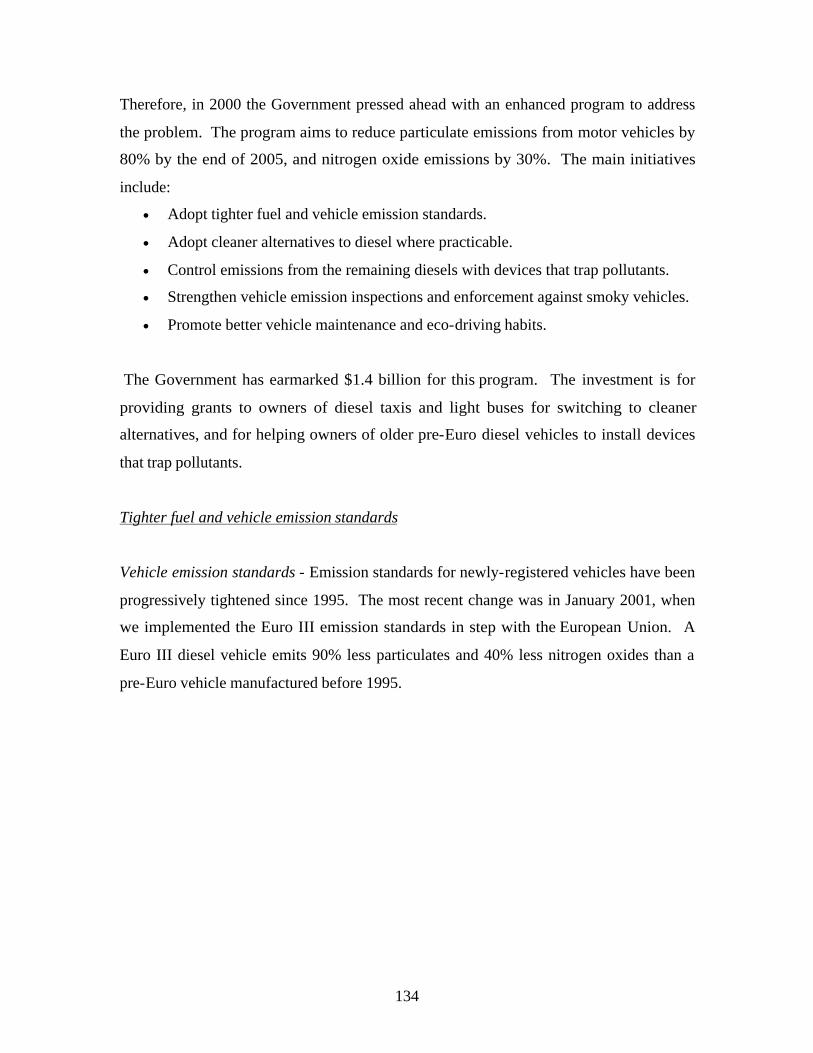
134
Therefore, in 2000 the Government pressed ahead with an enhanced program to address
the problem. The program aims to reduce particulate emissions from motor vehicles by
80% by the end of 2005, and nitrogen oxide emissions by 30%. The main initiatives
include:
· Adopt tighter fuel and vehicle emission standards.
· Adopt cleaner alternatives to diesel where practicable.
· Control emissions from the remaining diesels with devices that trap pollutants.
· Strengthen vehicle emission inspections and enforcement against smoky vehicles.
· Promote better vehicle maintenance and eco-driving habits.
The Government has earmarked $1.4 billion for this program. The investment is for
providing grants to owners of diesel taxis and light buses for switching to cleaner
alternatives, and for helping owners of older pre-Euro diesel vehicles to install devices
that trap pollutants.
Tighter fuel and vehicle emission standards
Vehicle emission standards - Emission standards for newly-registered vehicles have been
progressively tightened since 1995. The most recent change was in January 2001, when
we implemented the Euro III emission standards in step with the European Union. A
Euro III diesel vehicle emits 90% less particulates and 40% less nitrogen oxides than a
pre-Euro vehicle manufactured before 1995.

135
Figure 60: New vehicle emission standards
Vehicle fuel standards
Petrol – It was found the sulfur content in unleaded petrol from 0.015% to 0.005% since
January 2005 in step with the European Union.
Ultra low sulfur diesel (ULSD) – ULSD has a sulfur content of 0.005%, which is only
one seventh of the current Euro III fuel standard adopted by the European Union. It is the
only motor diesel fuel available at petrol filling stations in Hong Kong, after the
Government introduced a concessionary duty on ULSD in July 2000. Hong Kong is the
first place in Asia to introduce ULSD on a full scale for its vehicle fleet. Since April
2002, ULSD has been the statutory minimum requirement for motor vehicle diesel.
Cleaner alternatives to diesel
Taxis – To encourage a quick switch of the 18,000 diesel taxis to environmentally-cleaner
vehicles, the government provided a one-off grant of $40,000 for each replacement of
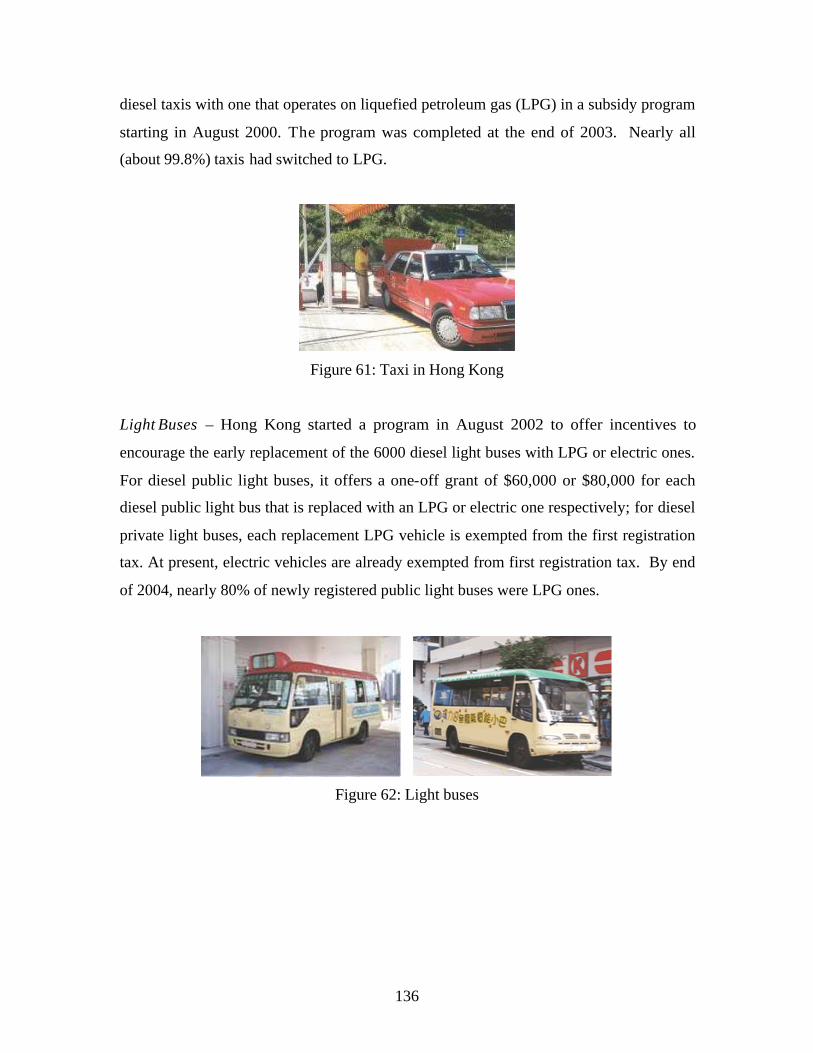
136
diesel taxis with one that operates on liquefied petroleum gas (LPG) in a subsidy program
starting in August 2000. The program was completed at the end of 2003. Nearly all
(about 99.8%) taxis had switched to LPG.
Figure 61: Taxi in Hong Kong
Light Buses – Hong Kong started a program in August 2002 to offer incentives to
encourage the early replacement of the 6000 diesel light buses with LPG or electric ones.
For diesel public light buses, it offers a one-off grant of $60,000 or $80,000 for each
diesel public light bus that is replaced with an LPG or electric one respectively; for diesel
private light buses, each replacement LPG vehicle is exempted from the first registration
tax. At present, electric vehicles are already exempted from first registration tax. By end
of 2004, nearly 80% of newly registered public light buses were LPG ones.
Figure 62: Light buses
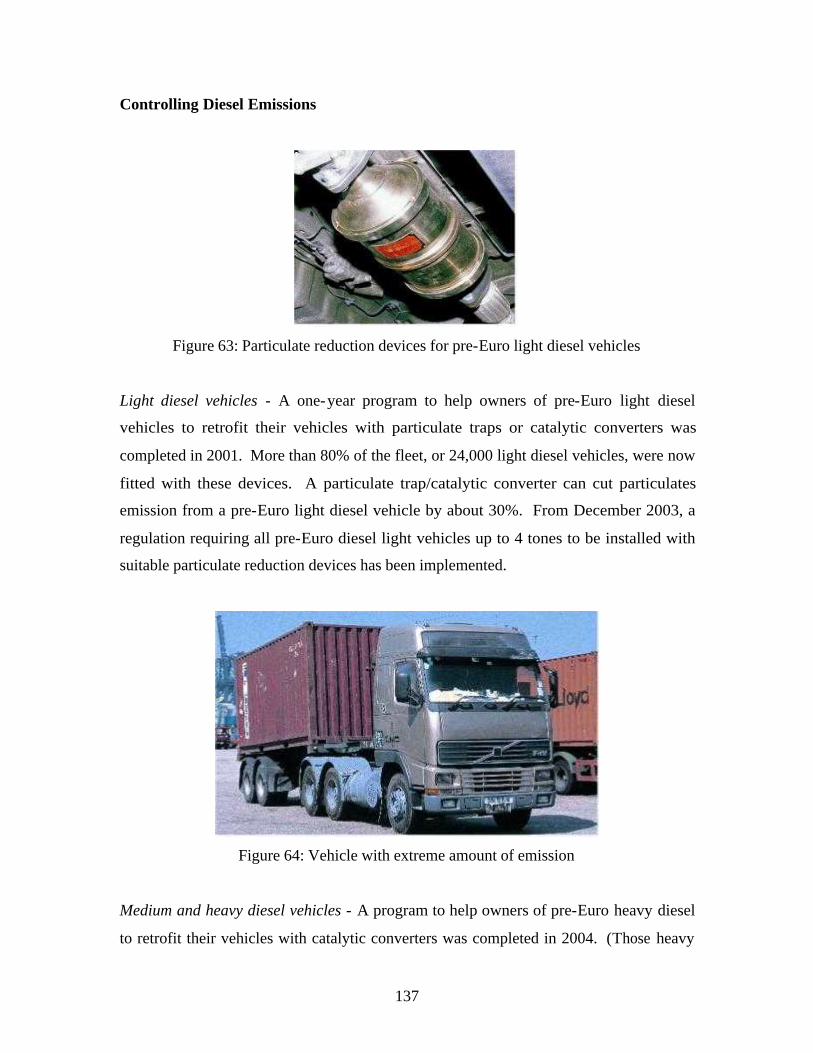
137
Controlling Diesel Emissions
Figure 63: Particulate reduction devices for pre-Euro light diesel vehicles
Light diesel vehicles - A one-year program to help owners of pre-Euro light diesel
vehicles to retrofit their vehicles with particulate traps or catalytic converters was
completed in 2001. More than 80% of the fleet, or 24,000 light diesel vehicles, were now
fitted with these devices. A particulate trap/catalytic converter can cut particulates
emission from a pre-Euro light diesel vehicle by about 30%. From December 2003, a
regulation requiring all pre-Euro diesel light vehicles up to 4 tones to be installed with
suitable particulate reduction devices has been implemented.
Figure 64: Vehicle with extreme amount of emission
Medium and heavy diesel vehicles - A program to help owners of pre-Euro heavy diesel
to retrofit their vehicles with catalytic converters was completed in 2004. (Those heavy
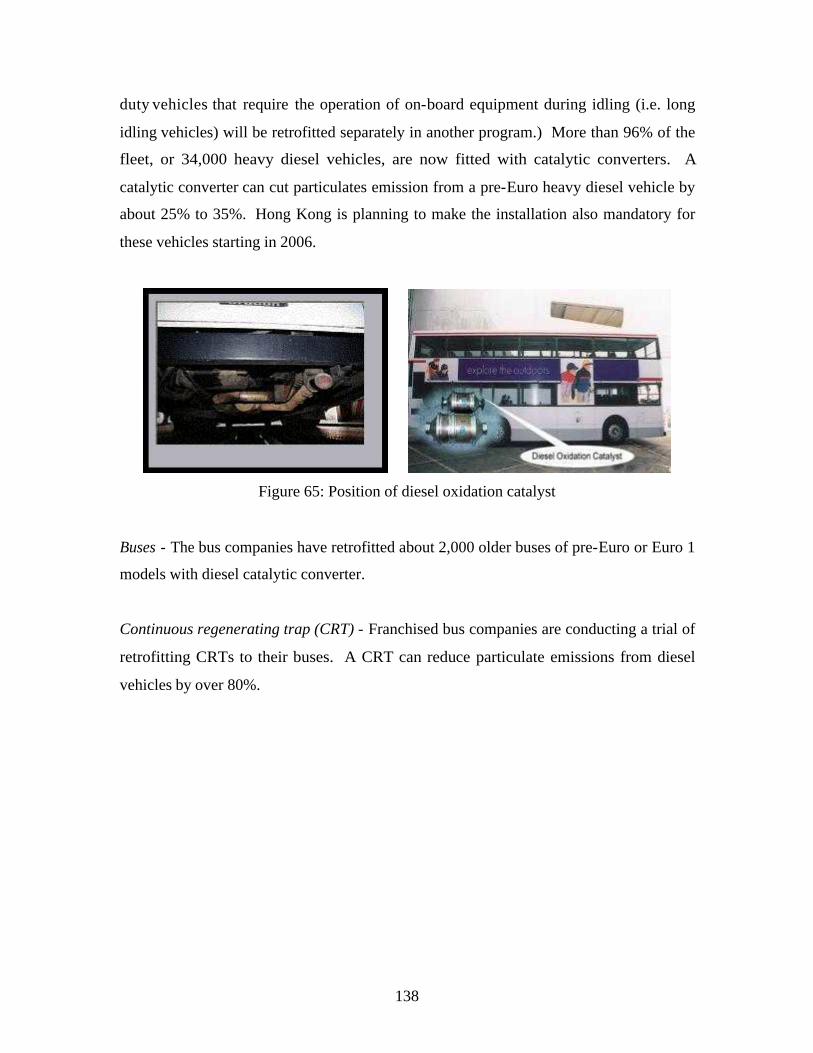
138
duty vehicles that require the operation of on-board equipment during idling (i.e. long
idling vehicles) will be retrofitted separately in another program.) More than 96% of the
fleet, or 34,000 heavy diesel vehicles, are now fitted with catalytic converters. A
catalytic converter can cut particulates emission from a pre-Euro heavy diesel vehicle by
about 25% to 35%. Hong Kong is planning to make the installation also mandatory for
these vehicles starting in 2006.
Figure 65: Position of diesel oxidation catalyst
Buses - The bus companies have retrofitted about 2,000 older buses of pre-Euro or Euro 1
models with diesel catalytic converter.
Continuous regenerating trap (CRT) - Franchised bus companies are conducting a trial of
retrofitting CRTs to their buses. A CRT can reduce particulate emissions from diesel
vehicles by over 80%.
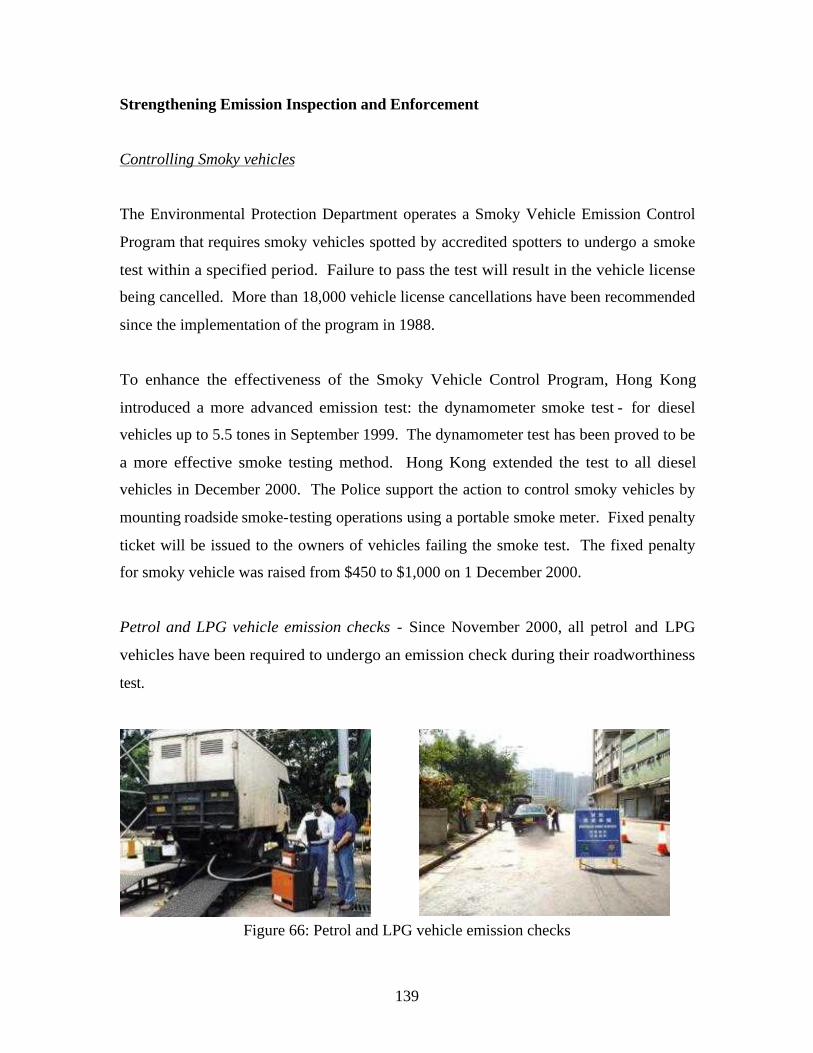
139
Strengthening Emission Inspection and Enforcement
Controlling Smoky vehicles
The Environmental Protection Department operates a Smoky Vehicle Emission Control
Program that requires smoky vehicles spotted by accredited spotters to undergo a smoke
test within a specified period. Failure to pass the test will result in the vehicle license
being cancelled. More than 18,000 vehicle license cancellations have been recommended
since the implementation of the program in 1988.
To enhance the effectiveness of the Smoky Vehicle Control Program, Hong Kong
introduced a more advanced emission test: the dynamometer smoke test - for diesel
vehicles up to 5.5 tones in September 1999. The dynamometer test has been proved to be
a more effective smoke testing method. Hong Kong extended the test to all diesel
vehicles in December 2000. The Police support the action to control smoky vehicles by
mounting roadside smoke-testing operations using a portable smoke meter. Fixed penalty
ticket will be issued to the owners of vehicles failing the smoke test. The fixed penalty
for smoky vehicle was raised from $450 to $1,000 on 1 December 2000.
Petrol and LPG vehicle emission checks - Since November 2000, all petrol and LPG
vehicles have been required to undergo an emission check during their roadworthiness
test.
Figure 66: Petrol and LPG vehicle emission checks

140
Promotion for Vehicle Maintenance and Eco-driving
Training and seminars on vehicle maintenance
Since August 1999, the Environmental Protection Department, in collaboration with the
Vocational Training Council and Hong Kong Productivity Council, has been offering
training sessions for vehicle mechanics on proper engine repair and maintenance to
reduce smoke emissions from diesel vehicles.
As LPG vehicles are relatively new in Hong Kong, seminars are also organized to
promote the awareness of their owners on their maintenance.
Campaign on eco-driving
The Government kicked off a campaign in September 2001 to promote "switching off
engines while waiting". Guidelines have been issued to the transport trade on this good
practice.
Hong Kong is seeing improvements in air quality with the implemented
measures. Particulates and nitrogen oxides levels on the street have dropped by 9% and
24% respectively since 1999. The number of smoky vehicles on the road has also
reduced. About 78% fewer smoky vehicles have been spotted since 1999.
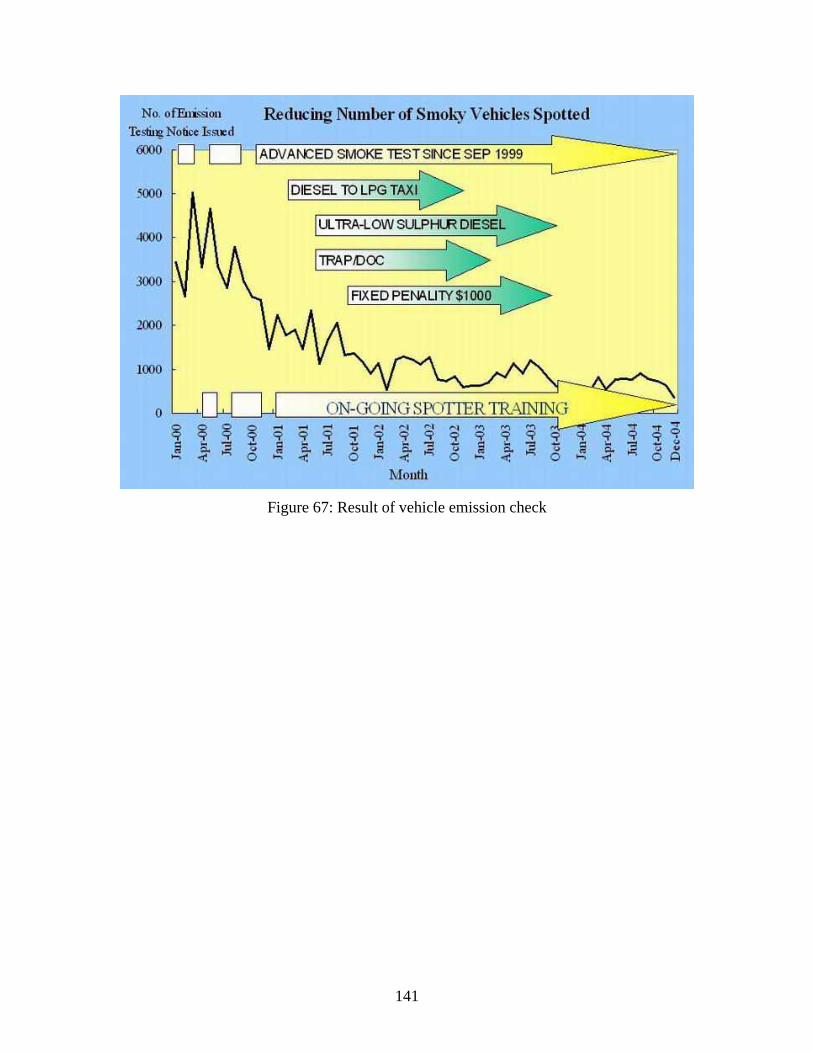
141
Figure 67: Result of vehicle emission check
142
4.3.3 Japanxl
Regulation of Soot and Smoke Emission
Measuring the Volume of Soot and Smoke
Any soot and smoke emitting person shall measure and keep record of the volume and
density of the soot and smoke generated by his soot and smoke emitting facility under
Order of the Prime Minister's Office.
Emission Standards
1. The emission standards prescribed in the preceding paragraph mean the maximum
permissible limits for: Item 1 in the case of sulfur oxides; Item 2 in the case of
soot and dust referred to in Item 2 (hereinafter referred to simply as "soot and
dust"); Item 3 in the case of the substances provided in Item 3 (hereinafter
referred to simply as "toxic substances").
2. Maximum permissible limits on the amounts of sulfur oxides which are generated
in a soot and smoke emitting facility and emitted into the air from an outlet of the
facility (hereinafter will refer to a smokestack or any other outlet installed for
emitting soot and smoke generated in a soot and smoke emitting facility,) are
prescribed for each of the areas designated by Cabinet Order in accordance with
the height of the outlet (hereinafter will refer to the height adjusted in accordance
with the procedure stipulated by Order of the Prime Minister's Office).
3. Maximum permissible limits on the amount of soot and dust contained in the
materials generated in soot and dust emitting facility and emitted into the air from
an outlet are prescribed for each kind and scale of facility.
4. Maximum permissible limits on the amounts of toxic substances (excluding the
specific toxic substances prescribed in the following item) contained in the
materials generated in a soot and smoke emitting facility and emitted into the air
from an outlet are prescribed for each kind of toxic substance and facility.
143
5. Maximum permissible limits on the amount of specific toxic substances
designated by the Director General of the Environment Agency from among toxic
substances generated in a soot and smoke emitting facility as a result of
combustion of fuel and the like and emitted into the air, (hereinafter referred to as
"specific toxic substances") are prescribed for each kind of the specific toxic
substance in accordance with the height of the outlet.
Notification of the Establishment of a Soot and Smoke Emitting Facility
Any person who plans to establish soot and smoke emitting facility shall notify the
following information to the governor of the prefecture in accordance with the provisions
of Order of the Prime Minister's Office:
1. That person's name or the name of the firm and address, or the name of the
representative of the legal person;
2. Name and location of the plant or business establishment;
3. Kind of proposed soot and smoke emitting facility;
4. Structure of the proposed soot and smoke emitting facility;
5. Method of operation of the proposed soot and smoke emitting facility; and,
6. Proposed method of disposal of the soot and smoke.
The notification under the provisions of the preceding paragraph shall be accompanied by
documents containing matters prescribed by Order of the Prime Minister's Office, such as
the volume of sulfur oxides or specific toxic substances generated by the proposed soot
and smoke emitting facility and emitted into the air from an outlet (hereinafter referred to
as the "volume of soot and smoke"), the volume of soot and dust or toxic substances
(excluding specific toxic substances) contained in the pollutant materials generated by the
proposed soot and smoke emitting facility and emitted into the air from an outlet
(hereinafter referred to as the "density of soot and smoke"), and the method of emission
of soot and smoke.
144
Restriction on the Implementation of Plans
1. Any person who provided notification under the provisions of Paragraph 1 of
“Notification of the Establishment of a Soot and Smoke Emitting Facility” shall
not install the notified soot and smoke emitting facility or change the structure,
the method of operation or the method of disposal of soot and smoke of the
notified soot and smoke emitting facility within 60 days after notification is
received.
2. In cases where the governor of the prefecture finds reasonable and suitable the
contents of matters notified under the provisions of Paragraph 1 of ” Notification
of the Establishment of a Soot and Smoke Emitting Facility”, the governor may
shorten the period prescribed in the preceding paragraph.
Restrictions on the Emission of Soot and Smoke
1. No person who emits soot and smoke generated by soot and smoke emitting
facility (hereinafter referred to a "soot and smoke emitting person") shall emit
soot and smoke the volume or density of which fails to meet the emission
standards at the outlet of the facility.
2. The provisions of the preceding paragraph shall not apply to soot and smoke
generated by and emitted into the air from a facility (including those under
construction) of a person for 6 months (or l year in the case of a facility
designated by Cabinet Order) after the facility is designated as a soot and smoke
emitting facility. However, it shall apply when an ordinance of the local public
entity applicable to the person prescribes such provisions corresponding to the
preceding paragraph (it shall not apply if related penal provisions are not
prescribed in the ordinance of the local public entity.)
3. No soot and smoke emitting facility emitting soot and smoke at a specific factory,
etc., may emit soot and smoke which fails to meet the total mass emission control
standard in terms of the total volume emitted at the outlets of all the soot and
smoke emitting facilities at said specific factories, etc., into the ambient air.
145
Order for Improvement
1. In cases where the governor of the prefecture recognizes that a soot and smoke
emitting person is likely to continuously emit soot and smoke whose volume or
density fails to meet the emission standards at the outlet and that continued
emission of such soot and smoke may cause damage to human health or the living
environment, he may order the person to improve, within a prescribed period, the
structure, the method of operation, or the method of disposal of soot and smoke
generated by the soot and smoke emitting facility, or to suspend the operation of
the facility temporarily.
2. In cases where soot and smoke are likely to be continuously emitted and fail to
meet noncompliance with the total mass emission control standard and when the
governor of the prefecture recognizes that continued emission may cause damage
to human health or the living environment, he may order the person who
established the specific factory, etc., relating to said designated soot and smoke to
improve, within a prescribed period, the method of soot and smoke disposal at the
specific factory, etc., to change the fuel used, or to take such other measures as
may be necessary.
Measures Relating to the Seasonal Use of Fuel
1. In cases where the governor of the prefecture recognizes that serious air pollution
from sulfur oxides occurs or is likely to occur in an area designated by Cabinet
Order, where sulfur oxides' soot and smoke emitting facilities are concentrated
whose volume of fuel fluctuates considerably according to season and that any
person who emits sulfur oxides generated by a facility into the air in the area uses
in that facility any fuel which fails to meet the fuel standard, the governor may
recommend such person observe the fuel standard within a prescribed period.
146
2. In cases where a person who receives a recommendation under the provision of
the preceding paragraph does not obey the recommendation, the governor of the
prefecture may order that person to observe the fuel standard within a prescribed
period.
3. The fuel standard referred to in Paragraph 1 hereof shall be prescribed by the
governor of the prefecture for each area designated by Cabinet Order on the basis
of the standards prescribed by the Director General of the Environment Agency
with respect to the kinds of fuel prescribed by Order of the Prime Minister's
Office.
4. In cases where the Prime Minister plans to establish, amend, or abolish Cabinet
Order prescribed in Paragraph 1 hereof, he shall hear the opinions of the governor
of the prefecture concerned.
5. The governor of the prefecture shall proclaim the fuel standard established under
the provision of Paragraph 3. The same shall apply to amendment or abolition of
the fuel standard.
6. In cases where the governor of the prefecture recognizes that the use of fuel at a
factory or business establishment other than the specific factories, etc. fails to
meet the fuel standard, the governor may advise the person who established said
factory or business establishment to observe the fuel standard within a prescribed
period.
7. In cases where a person who receives such advice under the provisions of the
preceding paragraph does not obey the advice the governor of the prefecture may
order that person to observe the fuel standard within a prescribed period.
8. The fuel standard referred to in Paragraph 1 above shall be prescribed relating to
sulfur oxides for factories and business establishments other than specific

147
factories, etc., by the governor of the prefecture for each area designated by
Cabinet Order on the basis of the standards prescribed by the Director General of
the Environment Agency with respect to the kinds of fuel prescribed by Order of
the Prime Minister's Office.
9. The governor of the prefecture may, when he recognizes the necessity, divide the
said designated area into two or more zones for each of which he may prescribe a
fuel standard referred to in Paragraph 1 above.
10. The provisions of Paragraph 5 may be applied to a fuel standard referred to in
Paragraph 6 above.
148
Promotion of Low-Emission Vehicle
To reduce exhaust emissions from vehicles, it is important to promote the use of low-
pollution vehicles that emit much less exhaust, in addition to tightening of exhaust
emission control regulations.
Types of low-pollution vehicles include vehicles fueled with compressed natural gas
(CNG), liquefied petroleum gas (LPG), and hybrid cars. Joining forces with eight other
municipal governments, TMG has designated these types of vehicles as low-pollution
vehicles, thereby promoting their use.
The Ordinance on Environmental Preservation requires that, by the end of FY2005,
businesses using 200 vehicles or more in the Metropolis must convert their vehicles to
"ultra- low-pollution Vehicles" as designated by TMG and more than 5% should be low-
pollution vehicles.
In order to accelerate the introduction of low-emission vehicles, TMG has implemented
various assistance measures.
Assistance measures for introduction of low-emission vehicles
· Loan mediation for introduction of low-emission vehicles
· Assistance to regular route bus operators to cover part of their expense for
introducing CNG vehicles
· Financial support provided for installation of CNG fueling stations
TMG-certified low-emission vehicles
The TMG-certified low-emission vehicle is a vehicle designated by TMG as emitting no
exhaust or substantially small amounts of exhaust. TMG classifies low-emission vehicles
as follows for designation and disclosure to category.
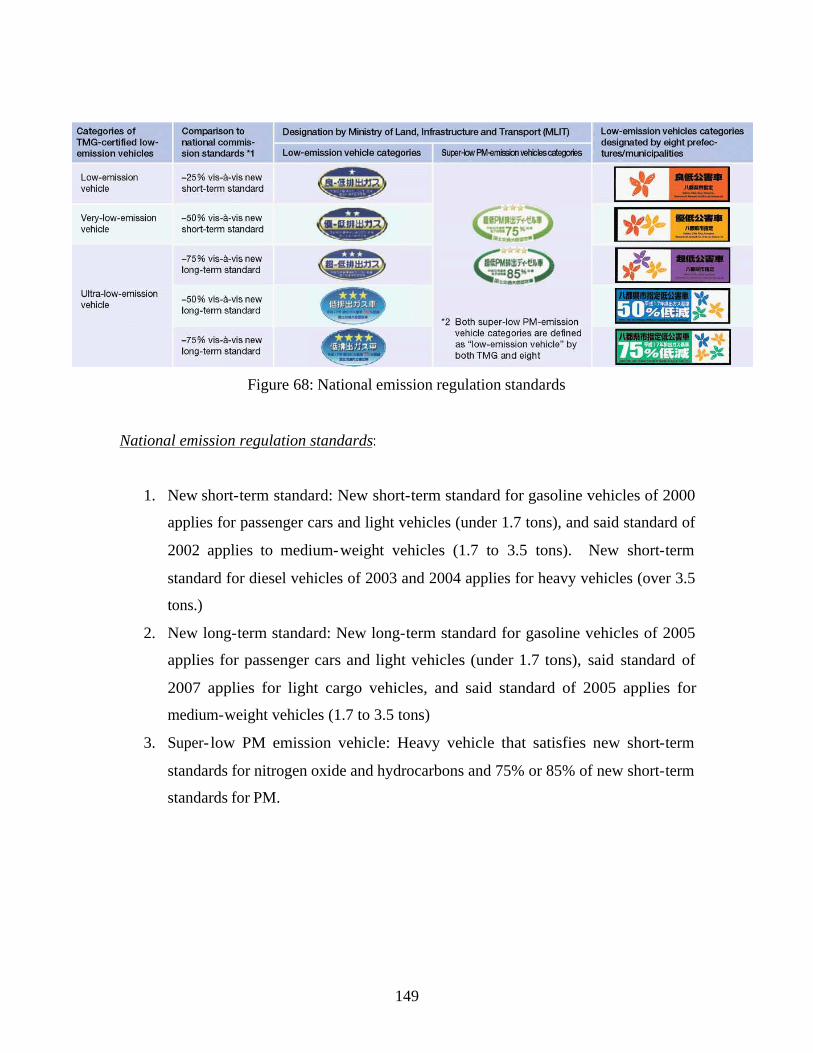
149
Figure 68: National emission regulation standards
National emission regulation standards:
1. New short-term standard: New short-term standard for gasoline vehicles of 2000
applies for passenger cars and light vehicles (under 1.7 tons), and said standard of
2002 applies to medium-weight vehicles (1.7 to 3.5 tons). New short-term
standard for diesel vehicles of 2003 and 2004 applies for heavy vehicles (over 3.5
tons.)
2. New long-term standard: New long-term standard for gasoline vehicles of 2005
applies for passenger cars and light vehicles (under 1.7 tons), said standard of
2007 applies for light cargo vehicles, and said standard of 2005 applies for
medium-weight vehicles (1.7 to 3.5 tons)
3. Super- low PM emission vehicle: Heavy vehicle that satisfies new short-term
standards for nitrogen oxide and hydrocarbons and 75% or 85% of new short-term
standards for PM.
150
Promotion of Transportation Demand Management (TDM)
Traffic congestion is having a serious impact on urban systems and the environment. As
a means of realizing a smooth flow of traffic, the promotion of Transportation Demand
Management (TDM) is crucial. Through TDM various measures are being implemented,
including joint operations for transportation and delivery and a move towards utilization
of public transportation.
Reinforcement of cooperation with related organizations
TMG is encouraging closer, mutual cooperation among the many entities involved in
TDM to promote its policy in this area. At the Transportation Demand Management
Administrative Liaison Council held since 2002, information exchanging and cooperation
with wards and municipalities have been implemented and TDM plans are being
promoted.
In addition, the Council has set up subcommittees to study issues in specific areas, such
as Park & Ride and the flow of goods. Looking ahead, action will be taken to promote
closer coordination with business associations, NPO, etc., and provide pertinent
information to these entities.
Environment-conscious actions in the flow of goods
As for measures for the flow of goods, it is also important to focus on actual delivery-
related activities on the streets, such as freight delivery. In order to promote efficiency,
measures to take in the perspective of deliveries for town development are examined with
the support of the Environmental Restoration and Conservation Agency of Japan since
FY2003.
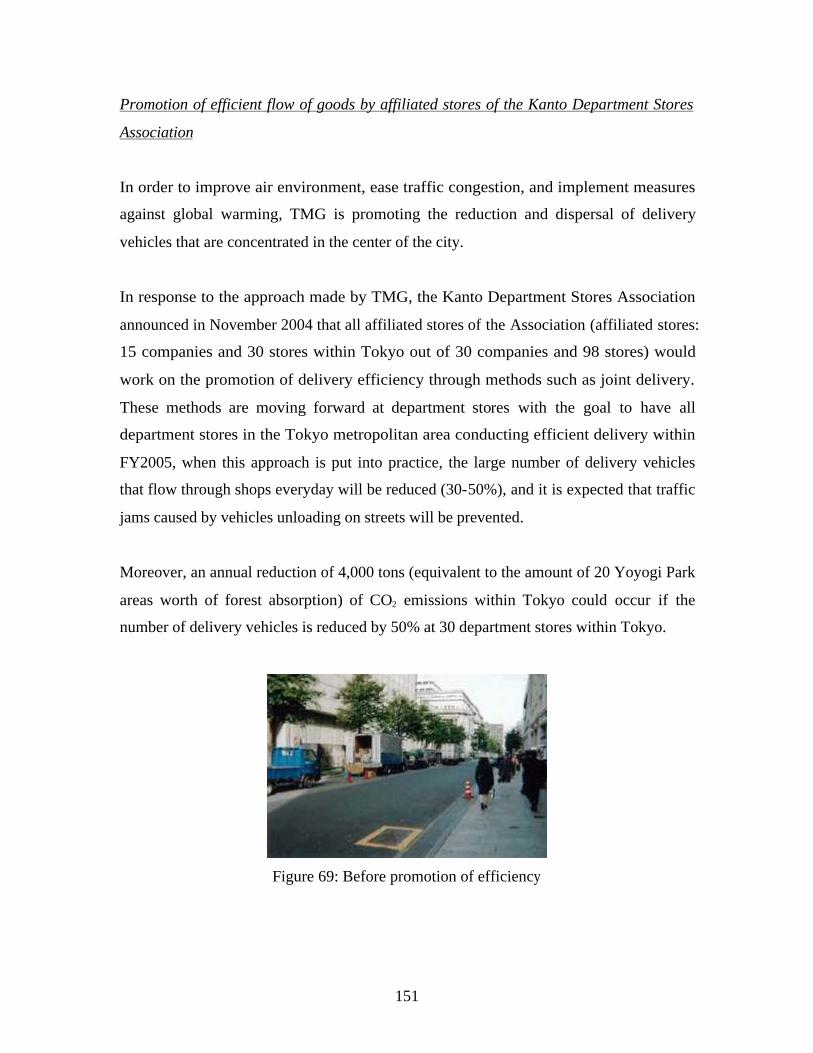
151
Promotion of efficient flow of goods by affiliated stores of the Kanto Department Stores
Association
In order to improve air environment, ease traffic congestion, and implement measures
against global warming, TMG is promoting the reduction and dispersal of delivery
vehicles that are concentrated in the center of the city.
In response to the approach made by TMG, the Kanto Department Stores Association
announced in November 2004 that all affiliated stores of the Association (affiliated stores:
15 companies and 30 stores within Tokyo out of 30 companies and 98 stores) would
work on the promotion of delivery efficiency through methods such as joint delivery.
These methods are moving forward at department stores with the goal to have all
department stores in the Tokyo metropolitan area conducting efficient delivery within
FY2005, when this approach is put into practice, the large number of delivery vehicles
that flow through shops everyday will be reduced (30-50%), and it is expected that traffic
jams caused by vehicles unloading on streets will be prevented.
Moreover, an annual reduction of 4,000 tons (equivalent to the amount of 20 Yoyogi Park
areas worth of forest absorption) of CO2 emissions within Tokyo could occur if the
number of delivery vehicles is reduced by 50% at 30 department stores within Tokyo.
Figure 69: Before promotion of efficiency

152
Figure 70: After promotion of efficiency
Promotion of efficient flow of goods within Tokyo triggered
TMG established a conference comprised of the government, developers, delivery
businesses, etc., to promote measures against CO2 emission, reduction and moderation of
heat island phenomenon and with the primary objective of promoting delivery efficiency
within Tokyo for large-scale redevelopment, building construction, etc.
At the conference, TMG positioned the promotion of delivery efficiency within Tokyo
for large-scale redevelopment, building construction, etc. as a joint business of the
administrators and constructors of large-scale buildings and delivery businesses. From
here on, TMG will implement the promotion of delivery efficiency of large-scale
buildings that are to be constructed.
153
Regulation on Particulate
Measuring the Density of Designated Particulate
Any designated particulate discharging person shall measure and keep a record of the
density of the designated particulate on the border line (the standards on the Border Line
is concluded in the next paragraph) of the ground of that person’s factory or business
establishment by Order of the Prime Minister’s Office.
The standards on the border line between the grounds of a factory or business
establishment and a neighboring property (hereinafter referred to as “standards on the
borderline”) are the maximum permissible density limits established for the discharge
and scattering into the air of each kind of designated particulate which is generated or
scattered by a factory or business establishment in which a person installs a designated
particulate discharging facility.
Notification of the Installing of General Particulate Discharging Facility
1. Any person who plans to establish a general particulate discharging facility shall
notify the following information to the governor of the prefecture in accordance
with the provisions by Order of the Prime Minister's Office.
a. That person's name or the name of the firm and address, or the name of the
representative of the legal person;
b. Name and location of the plant or business establishment;
c. Kind of proposed general particulate discharging facility;
d. Structure of the proposed general particulate discharging facility; and,
e. Proposed method of operation and management of the general particulate
discharging facility.
2. The notification in the preceding paragraph shall be accompanied by documents
stipulated by Order of the Prime Minister's Office, such as an arrangement plan of
the proposed general particulate discharging facility.
154
3. In cases where any person who provided notification under the provisions of
Paragraph 1 hereof or Paragraph 1 of the following article plans to change matters
already provided notification under Item 4 and 5 of Paragraph 1, he shall notify
the change to the governor of the prefecture to that effect in accordance with
Order of the Prime Minister's Office.
Notification of the Installing of a Designated Particulate Discharging Facility
1. Any person who discharges or scatters designated particulate shall notify the
following information to the governor of the prefecture, when he plans to install a
designated particulate discharging facility, in accordance with provisions by
Order of the Prime Minister's Office.
a. That person's name or the name of the firm and address, or the name of the
representative of the legal person;
b. Name and location of the plant or business establishment;
c. Kind of proposed designated particulate discharging facility;
d. Structure of the proposed designated particulate discharging facility;
e. Proposed method of operation of the designated particulate discharging
facility; and,
f. Proposed method of disposal or of controlling the scattering of designated
particulate.
2. The notification in the preceding paragraph shall be accompanied by documents
stipulated by Order of the Prime Minister's Office, such as a floor plan or layout
of the proposed designated particulate discharging facility, or method of discharge
of the designated particulate.
3. In cases where any person who provided notification under the provisions of
Paragraph 1 hereof or Paragraph 1 of the following article plans to change matters
already notified under Item 4 and 5 of Paragraph 1, he shall notify the changes to
that effect to the governor of the prefecture in accordance with Order of the Prime
Minister's Office.
155
4. The provisions of Paragraph 2 above shall apply to notification under the
provisions of the preceding paragraph.
Notification of a Planned Designated Particulate Discharging Activity
1. Any person who plans to start construction work which includes a designated
particulate discharging activity, hereinafter referred to as "specific construction
work", shall notify the following information to the governor in accordance with
provisions by Order of the Prime Minister's Office less than 14 days before the
start of the specific construction work, with the exception of an urgent situation
such as a disaster where it is necessary to start the designated particulate
discharging activity urgently.
a. That person's name or the name of the firm and address, or the name of the
representative of the legal person;
b. Location of the planned specific construction;
c. Kind of planned specific construction;
d. Period of time of the planned specific construction;
e. Kind of designated building material used in the building where the specific
construction work is planned, the whereabouts of the designated building
material, and the square measurements of the place the designated building
material is used; and,
f. Planned procedure of the designated particulate discharging activity.
2. In cases where of urgent situations referred to in the preceding paragraph, the
person who plans to start the specific construction work which includes a
designated particulate discharging activity shall notify the information referred to
in the preceding paragraph to the governor as soon as possible.
3. The notification shall be accompanied by documents stipulated by Order of the
Prime Minister's Office, such as the arrangement of building where the designated
particulate discharging activity is planned to take place.
156
Order for Modification of Proposed Plan
In cases where the governor of the prefecture finds that the estimated density of discharge
of designated particulate on the border line of the ground of a factory or business
establishment in which a person installs a designated particulate discharging facility fails
to meet the standards on the border line, he may order, within 60 days after receipt of
notification, the notifying person to modify the Plan relating to the structure or the
method of operation of the designated particulate discharging facility, or the method of
disposal or of controlling the scattering of designated particulate or to terminate the plan
for the installation of the proposed designated particulate discharging facility.
Restriction on the Implementation of Plans
Any person who provided notification shall not install the notified designated particulate
discharging facility or change the structure or the method of operation of his designated
particulate discharging facility, or the method of disposal or of controlling the scattering
of designated particulate within 60 days after notification is received.
Order for Improvement
In cases where the governor of the prefecture recognizes that a designated particulate
discharging person is likely to discharge or scatter designated particulate whose density
on the border line of the ground of that person's factory or business establishment will fail
to meet the emission standards on the border line, the governor may order the person to
improve, within a prescribed period, the structure or the method of operation of his
designated particulate discharging facility, or the method of disposal or of controlling the
scattering of designated particulate, or suspend the operation of the facility temporarily.
157
Promotion of Hazardous Air Pollutants
Measuring Hazardous Air Pollutants
Measures concerning air pollution by hazardous air pollutants shall be implemented so
that those measures can effectively prevent air pollution by hazardous air pollutants from
causing any long-term health damage while enriching scientific knowledge about
hazardous air pollutants.
Responsibility of Corporations
Corporations are responsible for making efforts to stay informed of their own emissions
or discharges of hazardous air pollutants and to take necessary measures to reduce those
emissions or discharges.
Responsibility of the State
1. The State is responsible for making efforts to do necessary research to stay
informed of the state of air pollution from hazardous air pollutants, in cooperation
with Local governments, and is also responsible for making efforts to enrich
scientific knowledge about the adverse health effects of hazardous air pollutants.
2. The State is responsible for evaluating, taking into consideration the results of
research and scientific knowledge, the health risks of each hazardous air pollutant,
and is also responsible for making public the results of such evaluation
periodically.
3. The State is responsible for making efforts to gather and classify technologies
which contribute to the reduction of emissions and discharges of hazardous air
pollutants and to promote those technologies for the purpose of encouraging
corporations to fulfill their responsibilities mentioned in the preceding article and
helping Local governments to fulfill their responsibilities mentioned in the next
article.
158
Responsibility of Local Government
1. Local governments are responsible for making efforts to do necessary research to
stay informed of the state of air pollution from hazardous air pollutants in their
jurisdictions.
2. Local governments are responsible for making efforts to provide corporations
with necessary information, and are also responsible for providing citizens with
information concerning prevention of air pollution from hazardous air pollutants.
159
4.3.4 Analysis and Comparison
Throughout the completion of policy comparison, the overall objective of each
regulation stated by the government is to restrain the pollutant value or any cause of
pollution. Therefore, such government policies can be considered as the pollutant control
act by political restriction.
Base on different air pollution standard values and pollutant concentrations, each
region has its specific sections for regulations. With the comparison of three regions in
general, Hong Kong is known to have the highest density of population even though its
industrial structure is not as varied as other two regions. For this reason, the most
apparent pollution problem is caused by transportation, which is directly proportional to
population. Theoretically, the two solutions, which are directed against the situation, are:
public transportation and improvement in transportation fuel. Hong Kong government
has been trying to control the vehicle emission and promote eco-vehicles. Based on
research, Hong Kong government set up regulations for vehicle emissions and also put up
roadside stations for emission inspection in order to narrowly control emissions for all
transportation. For the promotion section, the Hong Kong government not only urges
people to take public transportation and use eco-vehicles, it also promotes people to
upgrade their vehicle maintenance to reduce emission level.
Differ from Hong Kong government policy; since Taiwan has more
manufacturing industry, the government has set up regulations to restrict the contaminant
emissions produced by manufacturing factories. In order to maintain high regulation
strictness to every firm, directories and regulations of monitoring systems have been
provided to highlight the contaminant standards and methods to track the pollution level.
Due to the high population density, Taiwanese government also set up regulations based
on transportation to control the vehicle emissions. The extraordinary policies of
Taiwanese government are the regulation of environmental control regions, where
maintain high environment quality and would biologically produce particulates against
the pollutants.
160
Similar to Taiwan, Japanese government also set up regulations to control soot
and smoke emissions from manufacturing industry and regulations of hazardous pollution
particulates. Other than promote people using public transportation, Japanese
government creates a Transportation Demand Management to decrease vehicle using rate
per single person, so the total vehicle emission could decrease. Differ from Hong Kong
and Taiwan, Japan is known as one of the largest automobile manufacturing country; in
order to lower vehicle emissions, the Japanese government promotes manufacturers to
produce low-emission vehicles. For every automobile production, the government will
run inspection and classify the vehicle emission.

161
5. Conclusion
The goal of this project is to provide suggestions on solving air pollution problems by
seeking methods from the three most advanced and civilized regions in Asia: Taiwan,
Hong Kong, and Japan; compare the methods and generate the suggested solution.
Throughout the completion of air pollution understanding, contaminants are mostly
created by vehicular and industrial emissions. Since air pollution is a nationwide
environmental issue, solutions can be classified by two groups: technology and
government policy. For the technology section, before going deep inside the invented
technical solution, there is an imperative knowing the air quality detector, monitoring
system. Monitoring systems are placed to detect and record the pollutant values in case
certain numbers of pollutants exceed the standard, which will then cost human health and
environmental effects. The major significance for monitoring system is the set-up
position. Throughout the comparison of Taiwan, Hong Kong, and Japan, it was found the
best way of setting up the system around the precarious sections, such as the dense city
and a tight squeeze industry section; and like the Taiwanese strategy where the
government can possibly set up monitoring system in each individual firm that can cost
an exceeding amount of pollutant. In this case, the value of pollutants can be always
informed and easy to track the origin.
Overall, the technologies established by all three regions were set up against both
vehicular and industrial emissions. For vehicular emission, the “vehicle engine
technology” in Hong Kong presents high efficiency that reduces nitrogen oxides and
polluting particulates by 30% from its original. As the name implies, this technology is
specially made for vehicle engines where fortunately the vehicles throughout all Asia are
similar so such technology can be presented in all areas. For industrial emission, Hong
Kong has introduces a fuel technology to generate renewable energy in order to decrease
the waste of energy and secondary reduce the emission level. Taiwan uses “wet scrubber
and ventilation system” to reduce pollutants, such as acids and VOC, from electronics
and semiconductor process. On the other hand, Japan creates de-nitrification, de-
carbonization, and desulphurization equipments to decrease each pollutant’s
162
concentration in the air. For general contaminant reduction, Japan uses “smoke soot filer
plant system” as dust collector to collect pollutants, filter, and reduce the pollution level.
Likewise, Taiwan presents “cyclone scrubber” for absorbing hazardous gases,
eliminating smoke and particles, cooling and cleaning exhaust. Within all effective
technologies presented by three regions, Taiwan introduces an outstanding technology
called “oil mist eliminator” that is mainly for reducing oil emission. The oil mist
eliminator is capable to be established in kitchen for cooking emission control. Even
though there was no article related to indoor air pollution, the cooking emission produced
in individual house does have influence to the atmosphere. However, Asian food is also
found to be much greasier, which means it requires more oil, than western countries. In
order to maintain high air quality efficiently and severely, the kitchen oil eliminator will
be known as an effective technology for emission reduction.
Government policy for air quality control is found extremely efficient and helpful for the
environment. Regulations published by each region are seen as to plan or organize a
long-term solution for air pollution. Throughout the completion of comparison beyond
three regions, there are three results seem the best economical and efficient by
government policy. The first idea is to sector the environmental control regions. Instead
of depending on new technologies, it was found economical by using natural resource,
such as trees. Environmental control regions are defined as areas not very civilized, with
low pollution, nearly no contaminants sources; in another words, they are clean and have
many trees. By chemical reaction, trees generates clean air and nothing else, so
producing much more clean air than pollutants can be a solution of maintaining air
quality. The next idea is to create transportation demand management. Since it is known
that for dense cities, the source of air pollutants mostly generated from vehicular
emission; the government seem likely to have three solutions prior to this fact, which are
to promote publish transportation, restrict the vehicle emission value, and manage the
transportation demand. Promotion for publish transportation and restriction on vehicle
emission are common and easily done. Though, the transportation demand management
is simply to regulate the number of people in a car before the car can get on the roads. In
this case, the public can still demanding on cars but with less number of cars; which
163
means there will be much less vehicular emissions. The other efficient policy is to
economize pollutant sources, such as fuel for industrial usage. Governments are able to
set up regulations to restrict how much pollutant sources can be used in a period of time
or depending on the production. This act can directly control the emission produced by
industries and decrease the amount of pollutants.
Results of this project are solutions for large scale of area. Though, the pollutants can
really be controlled little by little from each individual human being. Generally, a person
can create air contaminant by cooking with large amount of oil, smoking, and using air
conditioning or refrigerators too much. Not to mention negative effects on air quality, it
is clear that eating something too greasy and smoking are bad influences for human
health. By the internal chemical reaction, air conditioning and refrigerators generate
pollutants that directly influence the ozone, and it will effect the temperature inversion
and global warming. However, refrigerators are essential in reality, though it can still be
used more economically, and so as air conditioning. Air conditioning is likewise to be
also essential for most of the Asian countries, but there are many other replacements,
such as using an electric fan, swimming in a pool, or simply just stay at places where
there is air conditioning for public so it would not even bother to pay the electricity bill.
With the public technical solutions, government policies, and individual human acts, air
pollutants can be control effectively. In this case, the air will be clean, both the Earth and
human beings will be healthy, the global environment will then be secure for human to
live safe and forever.
164
Reference
Pollutant Characteristics:
i http://210.69.101.141/emce/html/b0202.htm
Human Effects:
ii http://www.epa.vic.gov.au/Air/AQ4Kids/main_pollutants.asp
Smog:
iii http://en.wikipedia.org/wiki/Smog
Acid Rain: iv http://en.wikipedia.org/wiki/Acid_rain
Temperature Inversion: v http://en.wikipedia.org/wiki/Temperature_inversion
Global Warming:
vi http://en.wikipedia.org/wiki/Global_warming
Ozone Depletion:
vii http://en.wikipedia.org/wiki/Ozone_depletion
Taiwan General Information:
viii http://www.cia.gov/cia/publications/factbook/geos/tw.html
Hong Kong General Information: ix http://www.cia.gov/cia/publications/factbook/geos/hk.html
165
Japan General Information:
x http://www.cia.gov/cia/publications/factbook/geos/ja.html
Taiwan PSI Breakpoints:
xi www.epa.gov.tw
Taiwan PSI of Health Influence:
xii http://210.69.101.141/emce/index.aspx?pid=b0201&cid=b0201
Taiwan Air Quality Improvements: xiii http://192.192.255.165/html/docs/09-Peter%20Sun.pdf
Taiwan Air Pollution Index Chart: xiv www.epa.gov.tw
Hong Kong Air Quality Improvements:
xv http://www.epd.gov.hk/epd/english/environmentinhk/air/prob_solutions/files/Brief_Pro
gress_Report_Nov2005.pdf
Japan Air Pollution Index: xvi http://www.env.go.jp/en/air/aq/aq.html
Japan Air Quality Index: xvii http://www.env.go.jp/en/air/
Monitoring System in Taiwan:
xviii http://csur.t.u-tokyo.ac.jp/ws2004/papers/B4-Hong.pdf
Advanced Technology of Monitoring System in Taiwan:
xix http://csur.t.u-tokyo.ac.jp/ws2004/papers/B4-Hong.pdf
166
Monitoring System in Hong Kong:
xx http://www.epd.gov.hk/epd/
Monitoring System in Japan:
xxi http://www.gec.jp/CTT_DATA/index_amon.html
Quality Air Purifier:
xxii http://2005gd.tgpf.org.tw/%A5%FA%C4%CB%A4u%B7~%AC%EC%A7%DE%AA
%D1%A5%F7%A6%B3%AD%AD%A4%BD%A5qE.html#5
Oil Mist Eliminator:
xxiii http://2005gd.tgpf.org.tw/%A5%FA%C4%CB%A4u%B7~%AC%EC%A7%DE%A
A%D1%A5%F7%A6%B3%AD%AD%A4%BD%A5qE.html#5
Wet Scrubbers & Ventilation System: xxiv http://2005gd.tgpf.org.tw/%A5x%C6W%A4%BD%AE%60%B3B%B2z%A4u%B5
%7B%AA%D1%A5%F7%A6%B3%AD%AD%A4%BD%A5qE.html#2
Cyclone Scrubber:
xxv http://2005gd.tgpf.org.tw/%A5x%C6W%A4%BD%AE%60%B3B%B2z%A4u%B5%
7B%AA%D1%A5%F7%A6%B3%AD%AD%A4%BD%A5qE.html#2
Flue Gas Dry FGD System: xxvi http://2005gd.tgpf.org.tw/%A5x%C6W%A4%BD%AE%60%B3B%B2z%A4u%B5
%7B%AA%D1%A5%F7%A6%B3%AD%AD%A4%BD%A5qE.html#2
Hong Kong Pollution Technology:
xxvii http://www.cleartheair.org.hk/diesel.htm
167
Clean Coal Fuel Technology:
xxviii Source: Cleaner Coal Technology Program, Department of Trade and Industry (UK)
2002
Liquefied Natural Gas Fuel Technology: xxix China Daily, “First coal liquefaction research centre set up” (12th March 2004)
Renewable Energy Fuel Technology: xxx Source: Centre for Renewable Energy Development, China
Pollution Control Equipment:
xxxi Source: IEA Clean Coal Centre
Japan Pollution Technology:
xxxii http://www.gec.jp/JSIM_DATA/
Desulphurization Equipment:
xxxiii http://www.gec.jp/JSIM_DATA/Contents/Contents_AIR_2.html
De-Nitrification Equipment: xxxiv http://www.gec.jp/JSIM_DATA/Contents/Contents_AIR_3.html
Exhaust Gas Treatment Equipment: xxxv http://www.gec.jp/JSIM_DATA/Contents/Contents_AIR_5.html
Sulfur Recovery Unit:
xxxvi http://www.gec.jp/JSIM_DATA/
De-carbonization Equipment:
xxxvii http://www.gec.jp/JSIM_DATA/AIR/AIR_4/html/Doc_093.html

168
Taiwan Air Pollution Control Regulations:
xxxviii http://law.epa.gov.tw/en/laws/889404502.html
Hong Kong Vehicle Emissions Control Program:
xxxix http://www.epd.gov.hk/epd/english/environmentinhk/air/prob_solutions/air_problem
s.html
Japan Air Pollution Control Regulations: xl http://www2.kankyo.metro.tokyo.jp/kouhou/env/eng/index.html