Interactive matching and visual comparison of graphs
17
Interactive matching and visual comparison of graphs Mountaz Hascoët, [email protected], LIRMM, CNRS, Univ. Montpellier Pierre Dragicevic, [email protected], INRIA, Univ. Paris-Sud Problem Approach Results
-
Upload
kirby-fletcher -
Category
Documents
-
view
38 -
download
5
description
Interactive matching and visual comparison of graphs. Mountaz Hascoët , [email protected], LIRMM, CNRS, Univ. Montpellier Pierre Dragicevic , [email protected], INRIA, Univ . Paris-Sud. Problem Approach Results. Lexical network. Lexical network for French. « Jeux de mots » - PowerPoint PPT Presentation
Transcript of Interactive matching and visual comparison of graphs

Interactive matching and visual comparison of graphs
Mountaz Hascoët, [email protected], LIRMM, CNRS, Univ. Montpellier
Pierre Dragicevic, [email protected], INRIA, Univ. Paris-Sud
ProblemApproachResults
Lexical networkLexical network for French
« Jeux de mots »200 000 French terms1 200 000 lexical relations~30 types of relations (hyponymy, hyperonymy, meronymy, associated ideas, etc)~3 versions of the network each year
http://www.jeuxdemots.org/
=>Tools to analyze the quality of the network are needed

Graph comparison, what for?
Are two subgraphs different? Are subgraphs for different relations
consistent? Which graph has lower error rate?
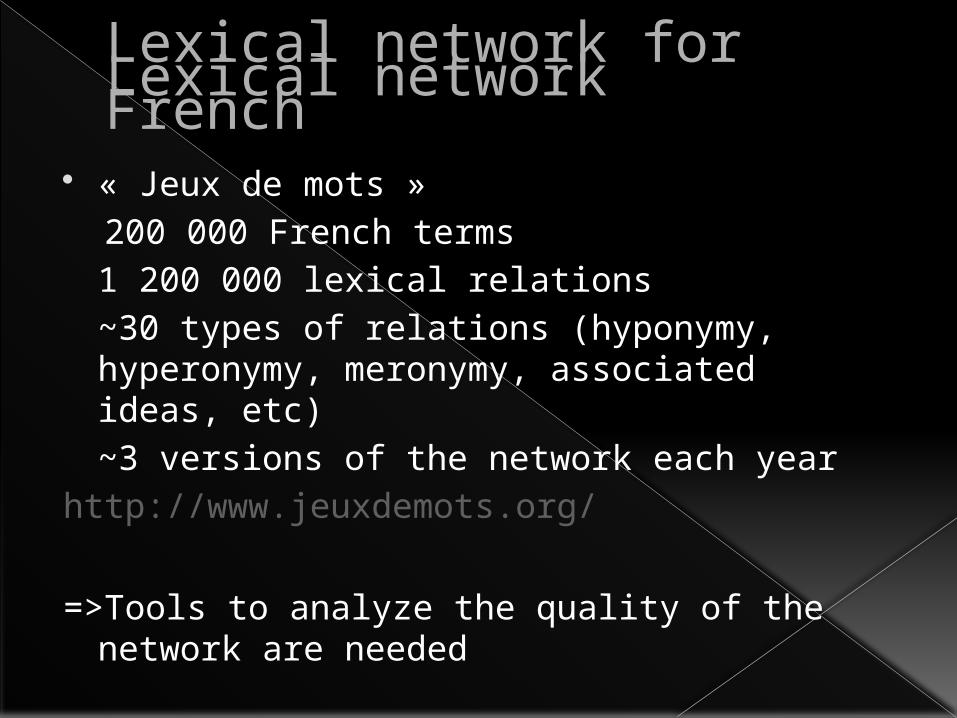
Infovis benchmark
The Infovis 2004 benchmark contains› Metadata for 614 papers› Published between 1974 and 2004
Extraction of Topic Maps› Topics from title and keyword lists› One topic map per each

Graph comparison, what for?
Do several topic maps differ significantly? How topics evolve over time
› Appear/disappear/refine How does the connectivity evolve over
time?

Approach
Optimisation› Use optimized layout from previous work
Visualization› Introduce presentation strategies suitable
for graph comparison Interaction
› Leave important matching choices to end-users
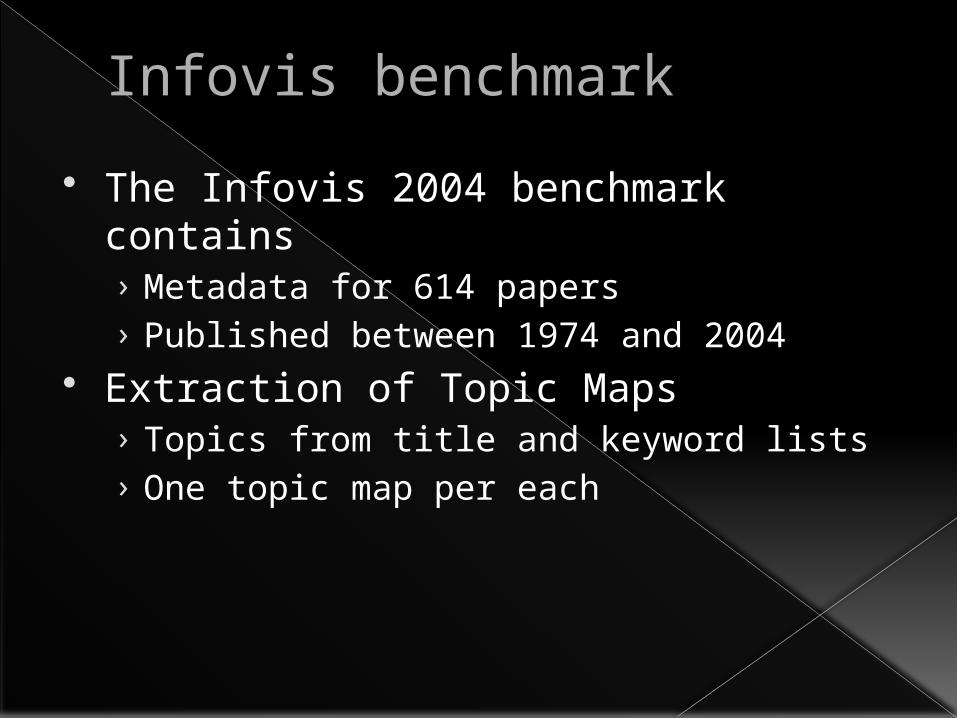
Results
Proposal1. Multi-layer model2. Animated reconfigurations3. Reification of matching functions
Proof of concept› A system named Donatien› Two case studies with real data

1. Multiple layers
Direct Manipulation on layers•Side-by-side arrangement•Superposed •Crossing

2. Animated reconfiguration
Optimized layout› Optimisation of
aesthetic criteria› Property
Enhanced legibility of graphs
› Limits If two graphs are the
exact same graph No guarantee that
layout are the same
Optimized layouts
Invariant layout› Determinist layout› Based on node
signatures› Property
2 identical graphs have the same layout
Warning: reciprocally not true
› Limits Legibility of graphs

Visual comparison through reconfiguration

Comparison with matching
Requirements› Compute matching nodes› Interactively adjust this matching› Superimpose matching nodes
Solution › Create a master graph › From invariant layout› To embody the matching function in a layer› Integrated smoothly with other layers
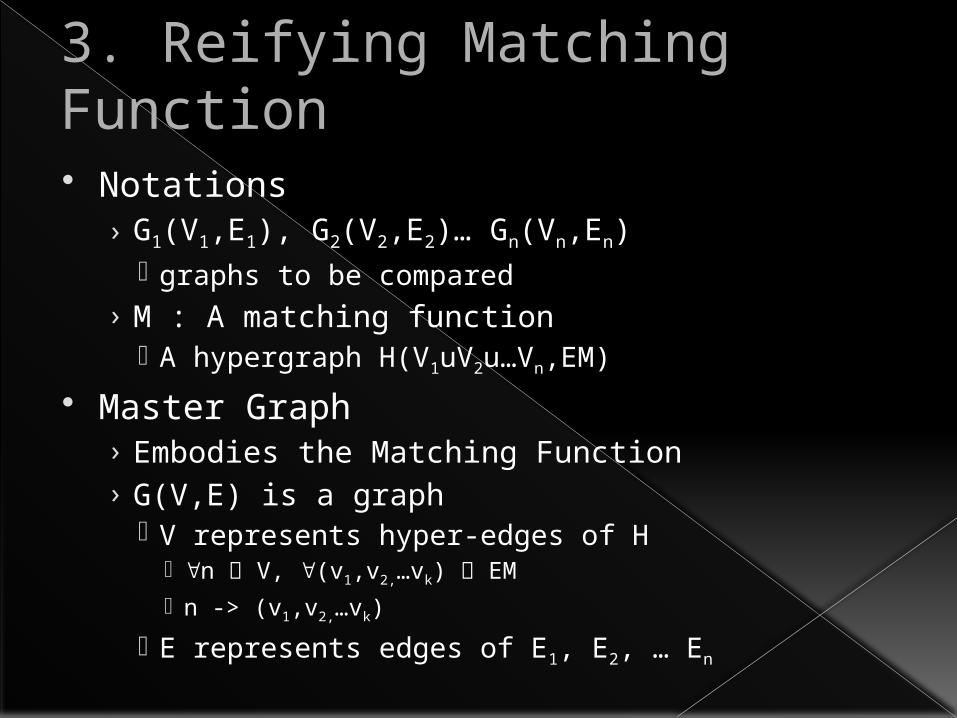
3. Reifying Matching Function
Notations› G1(V1,E1), G2(V2,E2)… Gn(Vn,En)
graphs to be compared› M : A matching function
A hypergraph H(V1uV2u…Vn,EM)
Master Graph › Embodies the Matching Function› G(V,E) is a graph
V represents hyper-edges of H n V, (v1,v2,…vk) EM
n -> (v1,v2,…vk)
E represents edges of E1, E2, … En

Reifying Matching Function

Matching Example

Conclusion
Visual comparison of graphs1. Invariant lMulti-layer model2. Animated reconfiguration3. Reifies Matching Function
Layout and superposition Smooth integration of master graph
Future work› Enhance interaction model › Enhance invariant layouts

Thanks for your attention
demo at lunch
Questions ?
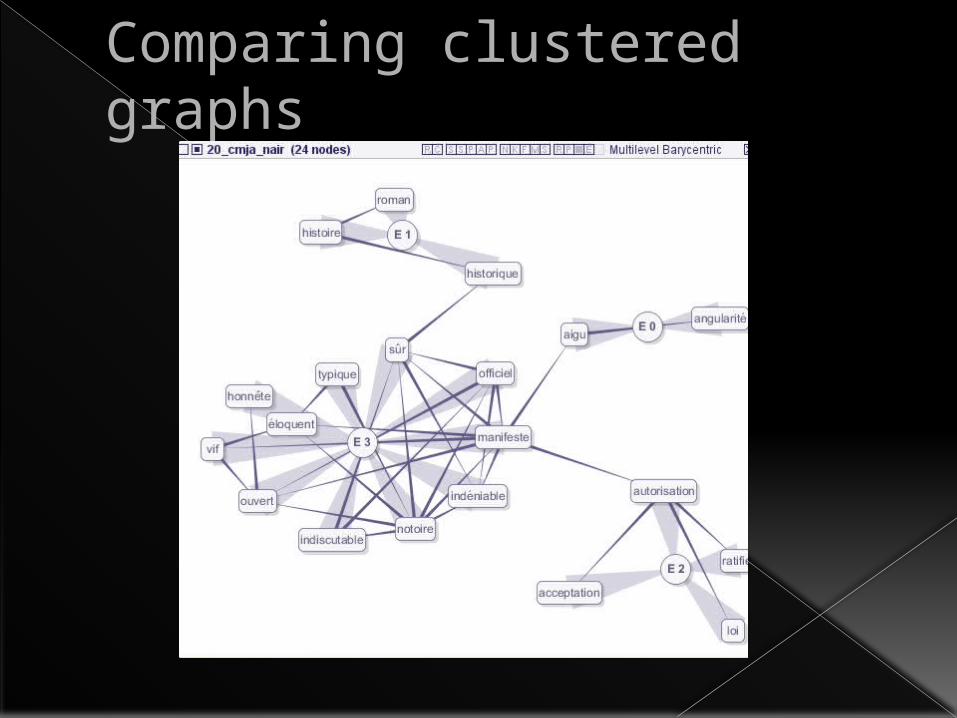
Comparing clustered graphs


![IAT 814 1 Graphs ______________________________________________________________________________________ SCHOOL OF INTERACTIVE ARTS + TECHNOLOGY [SIAT]](https://static.fdocuments.us/doc/165x107/551c4784550346a5458b486d/iat-814-1-graphs-school-of-interactive-arts-technology-siat.jpg)


![IAT 355 1 Graphs ______________________________________________________________________________________ SCHOOL OF INTERACTIVE ARTS + TECHNOLOGY [SIAT]](https://static.fdocuments.us/doc/165x107/56649e165503460f94b00b8e/iat-355-1-graphs-.jpg)