INTERACTIVE DATA VISUALIZATION AND ANALYSIS …ijme.us/issues/fall2010/Abstracts/Z__IJME fall 2010...
13
82 INTERNATIONAL JOURNAL OF MODERN ENGINEERING | VOLUME 11, NUMBER 1, FALL/WINTER 2010 INTERACTIVE DATA VISUALIZATION AND ANALYSIS FOR MOBILE-PHONE PERFORMANCE EVALUATION Yongsuk Lee, Florida Atlantic University (FAU), Xingquan Zhu, FAU, Abhijit Pandya, FAU, and Sam Hsu, FAU Abstract In this paper, the authors introduce an interactive visuali- zation and analysis system for Drive Test Data (DTD) eval- uation designed to provide first-hand mobile-phone perfor- mance assessment for different parties—including phone manufacturers and network providers—to review phone and network performance such as service coverage and voice quality. The authors propose an integrated data-visualization system, iVESTA (interactive Visualization and Evaluation System for drive Test dAta) for mobile phone drive-test da- ta. The objective was to project high-dimensional DTD data onto well-organized web pages, such that users can visually study phone performance with respect to different factors. iVESTA employs a web-based architecture, which enables users to upload DTD and immediately visualize the test re- sults and observe phone and network performance with re- spect to factors such as dropped call rate, signal quality, ve- hicle speed, handover and network delays. iVESTA provides a practical test environment for phone manufacturers and network service providers to perform comprehensive studies on their products from the real-world DTD. Introduction Drive Test Data (DTD) evaluation [1]-[5] refers to the process of evaluating mobile phone or network performance by using the data collected from the moving vehicles driving through a prearranged area with a radius of roughly 10 miles. Because DTD evaluation can provide first-hand, real- world assessments, it plays an important role for both mobile phone manufacturers and network service providers to verify the performance of their products. For example, phone man- ufacturers can use DTD evaluation to compare a newly-built phone with a baseline phone such that the overall perfor- mance of the new phone can be evaluated. On the other hand, for network service providers, DTD evaluation can also be used to validate the signal coverage and frequency planning. In order to provide a reliable DTD evaluation that reveals the actual phone/network performance, the test has to be performed multiple times under complex conditions in order to increase the accuracy of the test results [1], [6]. Depending on the DTD evaluation objectives and the par- ties actually carrying out the test, DTD data collected from the field vary significantly. For example, DTD data collected from the phone manufacturers usually have phone perfor- mance details but lack network-side information such as the status of the Mobile Switch Center or Base Stations. Due to privacy and security issues, and the fact that mobile-phone manufacturers and network service providers may have es- tablished DTD standards, they usually do not share data with each other, which unavoidably produces a low-data integrity challenge for DTD evaluation. Low integrity means that although DTD data collected from the field can tell what happened, the data may not provide sufficient information to answer a question like why it happened, due to the limita- tions of the data-collection devices and the availability of network/phone status information. In summary, then, out- lined here are several challenges for DTD evaluation and arguments for a DTD evaluation system that can effectively resolve all these challenges and provide a clear picture for users to answer these two questions: what happened and why did it happen? • Establishing proper methods for evaluating a low- quality and low-integrity DTD evaluation. A DTD eval- uation system must be able to decouple numerous fac- tors such as terrain types, interference from surrounding vehicles or buildings, network variation, and phone per- formance. • Deriving reliable comparisons based on a small number of significant events in DTD. Although a DTD database usually has a large volume of test data, the number of significant events, such as dropped calls, is actually very small, which makes it difficult to perform reliable statis- tical analyses. • Visualizing a large number of events on the screen. Mapping DTD to a visual map can provide clear inter- pretation for the data, but DTDs usually have a large volume of data and events. For web-based user interfac- es on which iVESTA is currently based, drawing and handling a large volume of data and providing immedi- ate results is a challenge. • Providing comprehensive summarized reports for DTD evaluation. DTDs usually involve a large amount of test data in which the majority of the recorded events are trivial. Consequently, it is required to provide users with comprehensive, summarized reports along with visual- ized presentations, such that users (possibly project managers) can gain a high-level understanding of the phone performance.
Transcript of INTERACTIVE DATA VISUALIZATION AND ANALYSIS …ijme.us/issues/fall2010/Abstracts/Z__IJME fall 2010...
82 INTERNATIONAL JOURNAL OF MODERN ENGINEERING | VOLUME 11, NUMBER 1, FALL/WINTER 2010
INTERACTIVE DATA VISUALIZATION AND ANALYSIS
FOR MOBILE-PHONE PERFORMANCE EVALUATION
Yongsuk Lee, Florida Atlantic University (FAU), Xingquan Zhu, FAU, Abhijit Pandya, FAU, and Sam Hsu, FAU
Abstract
In this paper, the authors introduce an interactive visuali-
zation and analysis system for Drive Test Data (DTD) eval-
uation designed to provide first-hand mobile-phone perfor-
mance assessment for different parties—including phone
manufacturers and network providers—to review phone and
network performance such as service coverage and voice
quality. The authors propose an integrated data-visualization
system, iVESTA (interactive Visualization and Evaluation
System for drive Test dAta) for mobile phone drive-test da-
ta. The objective was to project high-dimensional DTD data
onto well-organized web pages, such that users can visually
study phone performance with respect to different factors.
iVESTA employs a web-based architecture, which enables
users to upload DTD and immediately visualize the test re-
sults and observe phone and network performance with re-
spect to factors such as dropped call rate, signal quality, ve-
hicle speed, handover and network delays. iVESTA provides
a practical test environment for phone manufacturers and
network service providers to perform comprehensive studies
on their products from the real-world DTD.
Introduction
Drive Test Data (DTD) evaluation [1]-[5] refers to the
process of evaluating mobile phone or network performance
by using the data collected from the moving vehicles driving
through a prearranged area with a radius of roughly 10
miles. Because DTD evaluation can provide first-hand, real-
world assessments, it plays an important role for both mobile
phone manufacturers and network service providers to verify
the performance of their products. For example, phone man-
ufacturers can use DTD evaluation to compare a newly-built
phone with a baseline phone such that the overall perfor-
mance of the new phone can be evaluated. On the other
hand, for network service providers, DTD evaluation can
also be used to validate the signal coverage and frequency
planning. In order to provide a reliable DTD evaluation that
reveals the actual phone/network performance, the test has to
be performed multiple times under complex conditions in
order to increase the accuracy of the test results [1], [6].
Depending on the DTD evaluation objectives and the par-
ties actually carrying out the test, DTD data collected from
the field vary significantly. For example, DTD data collected
from the phone manufacturers usually have phone perfor-
mance details but lack network-side information such as the
status of the Mobile Switch Center or Base Stations. Due to
privacy and security issues, and the fact that mobile-phone
manufacturers and network service providers may have es-
tablished DTD standards, they usually do not share data with
each other, which unavoidably produces a low-data integrity
challenge for DTD evaluation. Low integrity means that
although DTD data collected from the field can tell what
happened, the data may not provide sufficient information to
answer a question like why it happened, due to the limita-
tions of the data-collection devices and the availability of
network/phone status information. In summary, then, out-
lined here are several challenges for DTD evaluation and
arguments for a DTD evaluation system that can effectively
resolve all these challenges and provide a clear picture for
users to answer these two questions: what happened and why
did it happen?
• Establishing proper methods for evaluating a low-
quality and low-integrity DTD evaluation. A DTD eval-
uation system must be able to decouple numerous fac-
tors such as terrain types, interference from surrounding
vehicles or buildings, network variation, and phone per-
formance.
• Deriving reliable comparisons based on a small number
of significant events in DTD. Although a DTD database
usually has a large volume of test data, the number of
significant events, such as dropped calls, is actually very
small, which makes it difficult to perform reliable statis-
tical analyses.
• Visualizing a large number of events on the screen.
Mapping DTD to a visual map can provide clear inter-
pretation for the data, but DTDs usually have a large
volume of data and events. For web-based user interfac-
es on which iVESTA is currently based, drawing and
handling a large volume of data and providing immedi-
ate results is a challenge.
• Providing comprehensive summarized reports for DTD
evaluation. DTDs usually involve a large amount of test
data in which the majority of the recorded events are
trivial. Consequently, it is required to provide users with
comprehensive, summarized reports along with visual-
ized presentations, such that users (possibly project
managers) can gain a high-level understanding of the
phone performance.

INTERACTIVE DATA VISUALIZATION AND ANALYSIS FOR MOBILE-PHONE PERFORMANCE EVALUATION 83
In order to resolve the above challenges, the authors pro-
pose a web-based visualization system, iVESTA, which is
able to evaluate a large volume of mobile-phone DTD data
and immediately provide summaries for the users. iVESTA
can carry out baseline comparisons and build standardized
evaluation methods from DTD, so it can help phone manu-
facturers and network service providers to analyze the col-
lected data. For example, the differences between the test
phone and the baseline phone can be easily evaluated when
the data are displayed on a map with signal strength, signal
quality, distance between a mobile phone and a base station,
different operations on a mobile phone, or network traffic at
different times.
The web-based visualization architecture ensures that
iVESTA can rely on a centralized DTD database and pro-
vide a variety of data analyses, summarization, and visuali-
zation functionalities. More specifically, the inherent merit
of iVESTA is two-fold: (1) It provides full-scale evaluation
of DTD data and is able to create baseline comparisons in
call performance and RF performance; and (2) It is a dynam-
ic visualization system, where users can easily review all
existing reports, generate a new report from the log files of a
specific product, and provide interactive charts and tools.
Consequently, iVESTA provides extensive functionalities
for phone manufactures and network providers to understand
the correlation of the cause and effect on mobile perfor-
mance during the drive test [10]. General influence factors
of the DTD data are summarized in Table 1. The rest of the
paper outlines the iDEN background to help interested read-
ers understand the drive-test process; introduces iVESTA
system architecture; provides a detailed introduction to sys-
tem functionalities, with a focus on summarization tools;
and, highlights the dynamic visualization components of
iVESTA.
Background
A. iDEN Characteristics
iDEN [10] is a digital radio system providing integrated
voice and data services to end users. The iDEN system, in
which the DTD from this study were collected, uses QPSK,
16QAM, and 64QAM digital modulation, AMBE+2 (Ad-
vanced Multi-Band Excitation), and VSELP (Vector Sum
Excited Linear Predictor) speech-coding techniques coupled
with TDMA (Time Division Multiple Access) channel-
access methodology to enhance channel capacity and system
services. It is also important to evaluate QAM modulation
performance versus RF measurements (RSSI: Radio Signal
Strength Indicator and SQE: Signal Quality Estimation).
RSSI in dBm is measured according to Eq. (1), where P1 is
the received signal strength and P0 is the unit signal strength
(1mW).
)/log(10 01 PPP = (1)
RSSI consists of three major components defined by Equa-
tion (2).
RSSI = C (Desired signal strength) + I (Inference strength) +
N (Noise strength). (2)
The calculation of SQE (Signal Quality Estimation) is thus
given by Equation (3).
)/( NICSQE += (3)
In iDEN systems, radio channel bandwidth assigned to
800Mhz and 900MHz is 25kHz, and a single in-
bound/outbound frequency pair is simultaneously shared
among six users (i.e., 6 mobile radios) for dispatch voice
quality and shared among 3 mobile radios for voice quality.
Each time slot length is 15 milliseconds, so the communica-
tion structures of the iDEN system affect call performance
during the test and require a DTD evaluation system to sepa-
rate data into different call modes.
Table 1. Summarized influence factors of DTD: this table shows the complexity of DTD evaluation, where the mobile
phone or network performance crucially depends on multi-dimensional features

84 INTERNATIONAL JOURNAL OF MODERN ENGINEERING | VOLUME 11, NUMBER 1, FALL/WINTER 2010
Figure 1 provides a high-level overview of the iDEN sys-
tem, where DAP (Dispatch Application Processor) is re-
sponsible for the overall coordination and control of dispatch
communications. An iDEN network can connect to the
PSTN through a Mobile Switching Center (MSC). The Met-
ro Packet Switch (MPS) provides one-to-many switching
between the Enhanced Base Transceiver System (EBTS) and
the Dispatch Applications Processor (DAP) for dispatch
voice and control, so it offers users the abililty to make the
Selective Dynamic Group Call (SDGC). Message Mail Ser-
vice (MMS) encompasses all of the software and hardware
required to store and deliver alphanumeric text messages,
and the InterWorking Function (IWF) is used to manage
intersystem roaming. The Base Site Controller (BSC) is the
controlling element between the EBTS cell sites and the
MSC that processes each type of transmission. The EBTS is
the cell site that links the mobile and portable subscribers to
the fixed network equipment. It is the controlling element
for phone and data services. The EBTS makes it possible for
subscribers to access any of the four services available in an
iDEN network: telephone, dispatch, text messaging, and
data.
With these dual systems, the iDEN system can be ex-
plained as a complex system, which can easily generate net-
work delays if there is no rapid response from either the
MSC or DAP system.
B. Radio Propagation Characteristics
Mobile communication is based on the propagation of the
electromagnetic wave signals through the air, which follows
the general laws of physics: the further the distance between
the receiver and the sender, the less is the signal strength.
B.1 Signal Strength vs. Distance between the Mobile Station
and the Base Station
In an open area, the power, Po, received at a mobile-
station (MS) antenna sent from a base-station (BS) antenna
is given by Equation (4) [9], where Po is the received power
at the receiver, Pt is the transmitted power from the sender, λ
is the wavelength, d is the distance between the sender and
the receiver, gb is the power gain of the BS antenna, and gm
is the power gain of the MS antenna.
mbt ggdPP )4/( 2
0 πλ= (4)
B.2 Elevated Antennas
In order to increase the mobile-station coverage area, most
BS antennas are placed on the top of a cell tower—about
200 feet on average. Denoting hb and hm the elevated height
of the base station and mobile station, respectively, the sig-
nal strength reached at the receiver is given by Equation (5)
[9]:
2
0 )/( dhhggPP mbmbr = , d>> hb and hm (5)
OMC
DAP MSC
PSTN
MMS
IWF
MPS
BSC
EBTS
Figure 1. iDEN network system diagram
B.3 Other Factors
There are many other physical factors which have a det-
rimental impact on mobile communications. For instance,
fading frequency is dependent on the receiver’s moving
speed, the reflection of the smooth objects can cause signal
phase shift, diffraction can describe the modification of
propagating waves when obstructed, and shadowing appears
when obstacles occur in the path between the receiver and
transmitter. Although DTD evaluation is assumed to consid-
er all of these factors, in practice, the impacts of these facts
are reduced through a pair of simultaneous tests: a test phone
and a baseline phone are simultaneously tested in the field.
Consequently, the DTD evaluation can provide evidence to
indicate whether the abnormal RF signals for one particular
phone are due to environmental issues, network issues, or
phone issues.
C. Terrain Profile
For comprehensive evaluation purposes, the drive-test
ground should cover different types of terrains. The test
ground of iVESTA is shown in Figure 2, which covers a
region 10 miles in diameter and includes four terrain types
according to Okumura’s morphology categorization [3].
• Open area: an area without any major obstacles –
farmland.
• Suburban area: an area with houses, trees and low-
density housing - town or small city.
• Urban area: an area with at least a two-story building -
a big city.
• Mixed area: an area with one suburban side and one
urban side.

INTERACTIVE DATA VISUALIZATION AND ANALYSIS FOR MOBILE-PHONE PERFORMANCE EVALUATION 85
Figure 2. The four types of terrains of our drive test ground in
Washington D.C (about 10 miles in diameter). Mapping tool
using Google map plots RSSI data on a route in different color
keys of RSSI whose table shows at the right side of the figure.
The drive test area is defined into 4 different terrains: Open
area in green, Suburban in red, Urban in yellow, and Mixed
area in blue
D. Phone Mode Characteristics
Like many other mobile phones, iDEN phones are de-
signed to save power, while not in use. This design generates
different operation patterns for phones to listen to the BS
and update its information.
D.1 Idle Mode
In the idle mode, a mobile phone will perform cell selec-
tion and reselection procedures. After a mobile phone is
powered up, it performs an acquisition procedure to register
to the network through a nearby base station and then listens
to the paging messages broadcasted from the base station. A
mobile phone in the idle mode will update its locations to the
BS if necessary. Because of this, the RF measurements from
scanning the neighbor cells are less accurate than the meas-
urements of the in-call mode.
D.2 Interconnect Call vs. Dispatch Call Modes
An iDEN call mode can be separated into two types: in-
terconnect call and dispatch. For an interconnect call, two
channels—one for inbound and the other for outbound—are
assigned for the call. When a call is initiated in a moving
vehicle, the phone can assist the network in determining
when a handover to another cell is expected. The mobile
continuously monitors outbound signals from neighboring
cells and measures the received power and signal quality of
the signals. When the mobile determines that the neighbor
measurement is higher than the measurement from the net-
work in its currently assigned cell, it transmits a handover
request to the network.
Unlike interconnect calls, which use two channels, a dis-
patch call uses only a single channel. The dispatch call re-
quires the message senders and receivers to take turns send-
ing their messages, i.e., the sender presses a button while
talking and then releases the button after finishing the con-
versation after which the listener will press a button to make
a response. In this way, the system knows the exact direction
of the signal transmission.
iVESTA System Architecture
As shown in Figure 3, iVESTA mainly consists of the fol-
lowing ten components: drive-test log files; automatic com-
pressor/uploader; automatic data processor; manual logs for
voice defect; an integrated database; a query-driven fil-
ter/modeling; text-based summary and interactive chart; ana-
lytical mapping tools; data charts; and, replay tool.
Figure 3. The main components of the iVESTA system
The structure of a log file is unique because a DTD evalua-
tion is generated through a Radio Application Layer Proto-
col (RALP) device attached to the mobile phone and a com-
puter inside a drive-test vehicle, as shown in Figure 4. In
addition, iVESTA is also designed to accommodate voice
quality reports, which record the voice quality of extended
conversations.
To generate drive-test data, it is necessary to have a team
of three people in order to operate the mobile phone, vehicle,
and the base counterpart of the mobile phone. For a baseline
comparison test, it is required to have a pair of two teams.
Each log file mostly contains 8 hours of drive-test data,
about 40 Mbytes. The cost of a drive test is expensive and
the quality is poor, when compared to the in-lab simulation
results. For a new product, it is required to test for several
days. Therefore, web-based visualization systems play an
important role in generating rapid, relevant comparison
86 INTERNATIONAL JOURNAL OF MODERN ENGINEERING | VOLUME 11, NUMBER 1, FALL/WINTER 2010
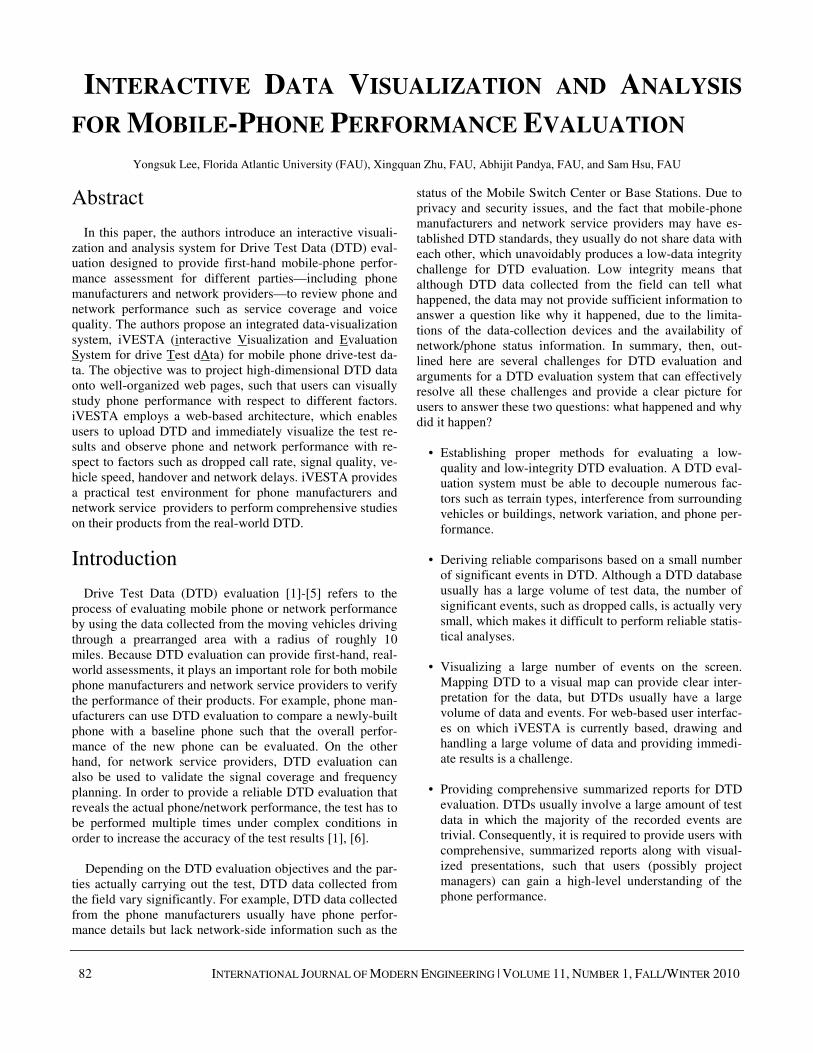
Fig. 4. The mobile drive test environment
summaries to evaluate and analyze the root cause of the de-
fects. For the drive-test data iVESTA is dealing with, since
the objective is to evaluate the new mobile phone, the base-
line phone is sometimes tested with an extra antenna in order
to receive a strong signal taking into consideration the vehi-
cle penetration loss [7].
Analysis Processes Visual Aids
Analysis on cause & effect
Evaluating performances
Modeling criteria
Sequential logs to logical data
Summary Report
Visualization Tools
Interactive Charts
Figure 5. The Architecture of iVESTA
While the iVESTA system is intended to offer full support
for the DTD evaluation, without cell site information and a
channel plan from the network service providers, it is diffi-
cult to make unbiased comparisons and conclude the
phone’s performance. To overcome this low-data integrity
hurdle, iVESTA employs a set of visual aids to bridge the
gap between different levels of data understanding. As
shown in Figure 5, the right side of the picture shows four
layers of data analysis: (1) converting sequential logs into
logical data; (2) modeling criteria; (3) performance evaluat-
ing; and (4) cause-and-effect analysis. In order to bridge the
gap between two consecutive data analysis layers, a set of
visual aids are employed to help users understand the data
and characterize the phone’s performance, such that the low-
data integrity challenge can be resolved in practice.
A. DTD Format
RALP logs are sequential messages between a Mobile
Station (MS) and the Enhanced Base Transceiver System
(EBTS), beginning with PC time stamp and a tick count to
establish ordering of additional messages within a millisec-
ond, followed by an information log specifying the phone
and conversation status. Figure 6 demonstrates the basic
elements of a DTD record. Because all records and data
fields are well-defined, an automatic data processor can be
employed to read each single record and pull corresponding
data into the database.
Figure 6. An example of a DTD log
B. Log Files Uploading
After DTD logs are collected by a drive test team, the files
are uploaded through a web-based uploading tool as shown
in Figure 7, which consists of three major parts: (1) a user
information section, (2) an uploading section for DTD logs
of one particular product, and (3) the uploading section for
DTD logs of the baseline product. Log files are guided with
proper naming conventions procedure for avoiding dupli-
cates. In addition, all log files are automatically compressed
on the local machines and sent to the server through the
HTTP protocol.
The uploading process triggers iVESTA’s automatic data
processor to read log files and populates data into the main
database (powered by MySQL), which consist of seven ta-
bles: NMS, Calls, Mobility, Events, LAPidata, Site, and
Drivetest. The uploaded information, such as transaction ID
and the uploader’s information, is stored into the upload
table. The drive-test table is a look-up table to synchronize
the relationships between database tables and the log files.
The Normal Mode Summary (NMS) table contains the
main DTD, such as geographical information and speed for
vehicle and cell tower, PC timestamp, server color code,
RSSI, SQE and measurement, the first neighbor’s RSSI,
SQE and measurement, the second neighbor’s RSSI, SQE Web server
DB server
Mail server
Upload log files
Report
Figure 7. The upload process for log files
INTERACTIVE DATA VISUALIZATION AND ANALYSIS FOR MOBILE-PHONE PERFORMANCE EVALUATION 87
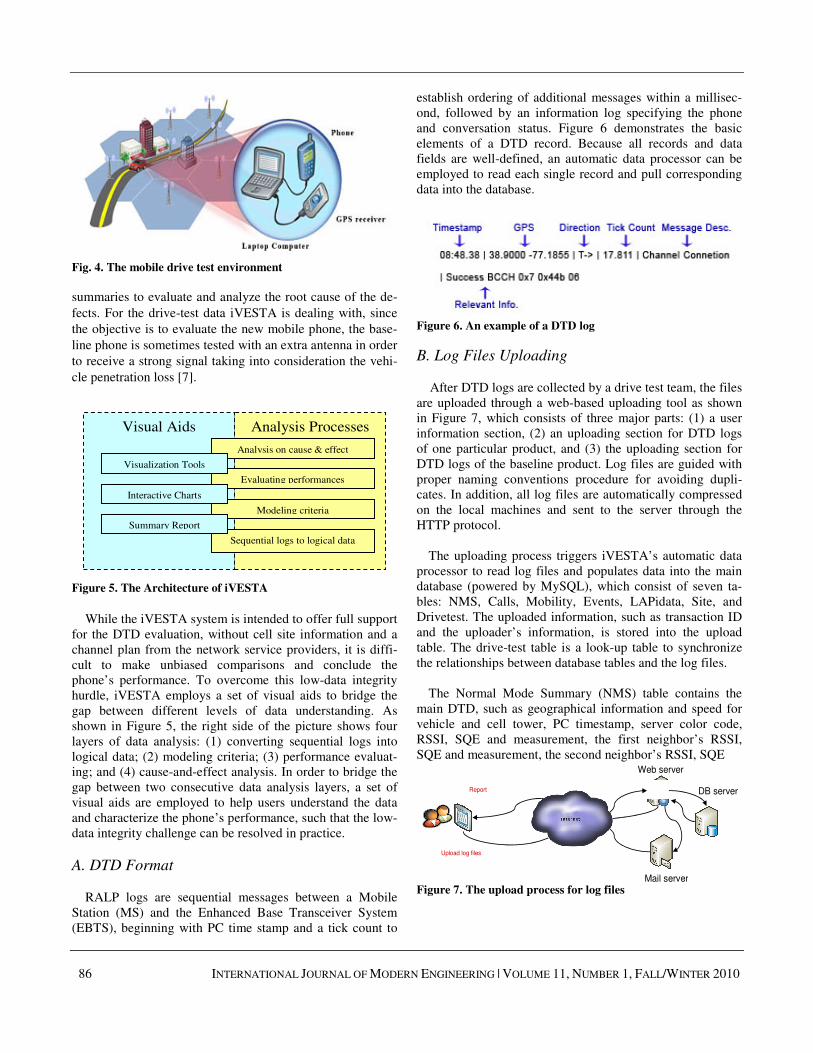
Figure 8. The data process diagram of iVESTA log file uploading
and measurement, and so on. The calls table is populated
with call information such as call type, total call length and
so on. The mobility table has mobility information such as
the cause of handover decision, oldSitePCCH,
newSitePCCH, and so on. All of the sequential event mes-
sages between MS and BS are found in the events table.
Packet data information is stored in the LAPidata table. The
site table places cell information such as GPS information of
cell, server color code, and so on.
Following the data conversion, a summary process will
create a set of charts, which may be used to help users gen-
erate a series of reports. Upon finishing the file uploading,
the mail server will notify the drive-test team and their cli-
ents through an email message. A detailed diagram of the
data process for uploading log files is shown in Figure 8.
The uploading process starts from 1 at which point a user
submits the log files, which consequently triggers pro-
cessing, and 2 returning uploading confirmation and sum-
mary to the user. In step 3, the system decompresses the
uploaded files, followed by step 4, which automatically
process the log data and pulls useful information into the
main database. In step5, the system creates a set of sum-
mary tables from the input data. Finally, then, in step 6, the
system sends an email confirmation to the submitter and the
system administrator to acknowledge the success of upload-
ing the test data.
C. Summary Reports
The objective of the summary reports for the DTD evalua-
tion is to provide users the statistical overview of a drive-test
report: the informative summaries of events, the total calls in
different modes, the average signal conditions on a route,
and so on. The summary reports provided by iVESTA con-
tain 8 main performance evaluations, which are 22 text-
based summary tables, as shown in Figure 9. Users can ac-
cess all of these tables by navigating the system submenus
(the left panel in Figure 5.)
DTD
Data Process
General call summary
General summary
Universal summary
Call performance Interconnect call summary
Dispatch call summary
Call termination summary
Mobility performance
Handover summary
Rescan summary
Normal mode summary
Idle mode summary
Dispatch mode summary
Signal condition summary
Sites summary RF performance
Packet data summary Packet data performance
Phone performance Reset summary
Software alarm summary
User note summary
Failure / FNE denied summaries
Network performance
Defect performance
Destination IP summary
Time on channel summary
Layer 1 summary
Test performance
iStats report
Figure 9. iVESTA performance summary diagram
In short, the summary tables cover two important compo-
nents: (1) the baseline comparison form and (2) the statisti-
cal calculation based on the selected comparison attributes

88 INTERNATIONAL JOURNAL OF MODERN ENGINEERING | VOLUME 11, NUMBER 1, FALL/WINTER 2010
such as the total number of dropped calls between the test
and the baseline phones. From the phone manufacturers’
perspective, the most interesting parameters are listed as
follows:
• Connected call percentage: number of calls connected to
TCH (traffic channel) over number attempted.
• Good call percentage: number of calls ended properly
over number of calls connected to TCH.
• Number of rapid handovers: two handover attempts
within 10 seconds.
• Number of delayed handovers: MR sent but no hando-
ver command received within 5 seconds of the first MR
sent.
• Number of Ping-Pong handovers: two handover at-
tempts, where the radio goes from cell site A to cell site
B and back to cell site A.
To provide statistical comparison analyses, iVESTA em-
ploys a two-proportion Z test with a default null hypothesis
(p-value> 0.05) in all summary tables. The diagram of a
two-proportion Z test is shown in Figure 10, and Figure 11
pictorially shows a summary table with statistical test re-
sults.
DTD
Process DTD
Build summary tables
P < 0.05 ?
P < 0.01 ?
No statistical diff. Statistical diff.
Significant
Statistical diff.
Report: Highlighting
Convert units
Yes No
Yes
Figure 10. The diagram of a two-proportion Z test of the sum-
mary tables
D. Interactive Charts
Evaluating RF measurements of a DTD evaluation is the
most important assessment in iVESTA because about 40%
of abnormal events, such as dropped calls, occur in poor-
signal conditions (less than -100dBm). iVESTA provides
regional comparisons of RF measurements in different call
modes since signal condition strongly relies on the distance
and terrain type between MS and BS. In addition, interactive
charts also provide spontaneous responses corresponding to
a mouse position on a chart, which is shown in Figure 12.
iVESTA provides eight groups of 40 user-interactive
charts and is able to let a user visually evaluate the phone
performance with respect to different parameter settings. For
example, the SQE (Signal Quality Estimation) charts are
drawn into CDF (cumulative distribution function) and PDF
(probability density function) forms and separated by five
Figure 11. An example of a text summary table with a statisti-
cal information panel
INTERACTIVE DATA VISUALIZATION AND ANALYSIS FOR MOBILE-PHONE PERFORMANCE EVALUATION 89
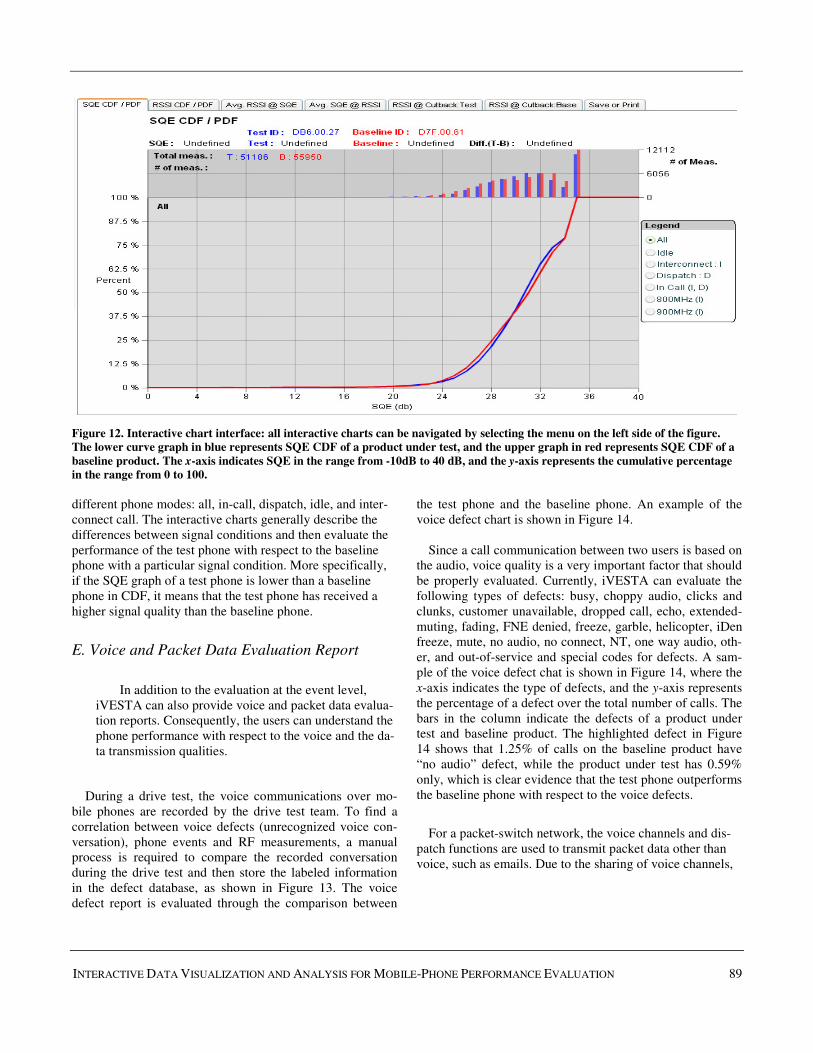
Figure 12. Interactive chart interface: all interactive charts can be navigated by selecting the menu on the left side of the figure.
The lower curve graph in blue represents SQE CDF of a product under test, and the upper graph in red represents SQE CDF of a
baseline product. The x-axis indicates SQE in the range from -10dB to 40 dB, and the y-axis represents the cumulative percentage
in the range from 0 to 100.
different phone modes: all, in-call, dispatch, idle, and inter-
connect call. The interactive charts generally describe the
differences between signal conditions and then evaluate the
performance of the test phone with respect to the baseline
phone with a particular signal condition. More specifically,
if the SQE graph of a test phone is lower than a baseline
phone in CDF, it means that the test phone has received a
higher signal quality than the baseline phone.
E. Voice and Packet Data Evaluation Report
In addition to the evaluation at the event level,
iVESTA can also provide voice and packet data evalua-
tion reports. Consequently, the users can understand the
phone performance with respect to the voice and the da-
ta transmission qualities.
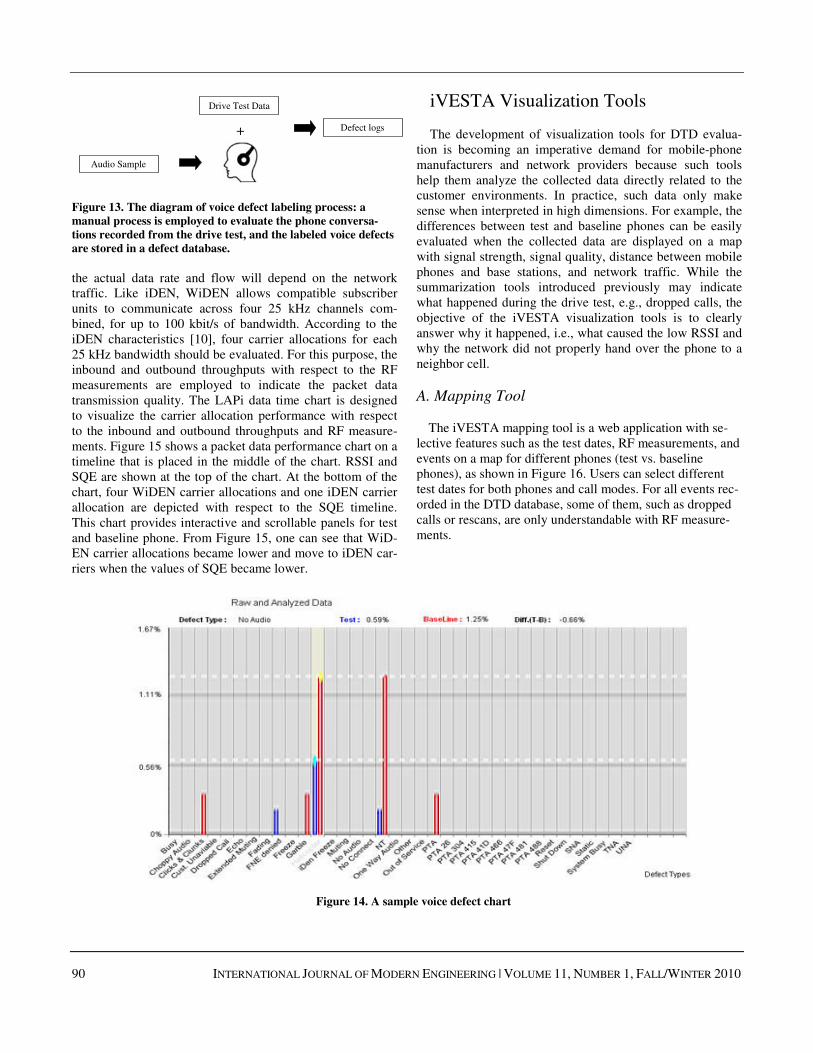
During a drive test, the voice communications over mo-
bile phones are recorded by the drive test team. To find a
correlation between voice defects (unrecognized voice con-
versation), phone events and RF measurements, a manual
process is required to compare the recorded conversation
during the drive test and then store the labeled information
in the defect database, as shown in Figure 13. The voice
defect report is evaluated through the comparison between
the test phone and the baseline phone. An example of the
voice defect chart is shown in Figure 14.
Since a call communication between two users is based on
the audio, voice quality is a very important factor that should
be properly evaluated. Currently, iVESTA can evaluate the
following types of defects: busy, choppy audio, clicks and
clunks, customer unavailable, dropped call, echo, extended-
muting, fading, FNE denied, freeze, garble, helicopter, iDen
freeze, mute, no audio, no connect, NT, one way audio, oth-
er, and out-of-service and special codes for defects. A sam-
ple of the voice defect chat is shown in Figure 14, where the
x-axis indicates the type of defects, and the y-axis represents
the percentage of a defect over the total number of calls. The
bars in the column indicate the defects of a product under
test and baseline product. The highlighted defect in Figure
14 shows that 1.25% of calls on the baseline product have
“no audio” defect, while the product under test has 0.59%
only, which is clear evidence that the test phone outperforms
the baseline phone with respect to the voice defects.
For a packet-switch network, the voice channels and dis-
patch functions are used to transmit packet data other than
voice, such as emails. Due to the sharing of voice channels,
90 INTERNATIONAL JOURNAL OF MODERN ENGINEERING | VOLUME 11, NUMBER 1, FALL/WINTER 2010
Audio Sample
Drive Test Data
Defect logs +
Figure 13. The diagram of voice defect labeling process: a
manual process is employed to evaluate the phone conversa-
tions recorded from the drive test, and the labeled voice defects
are stored in a defect database.
the actual data rate and flow will depend on the network
traffic. Like iDEN, WiDEN allows compatible subscriber
units to communicate across four 25 kHz channels com-
bined, for up to 100 kbit/s of bandwidth. According to the
iDEN characteristics [10], four carrier allocations for each
25 kHz bandwidth should be evaluated. For this purpose, the
inbound and outbound throughputs with respect to the RF
measurements are employed to indicate the packet data
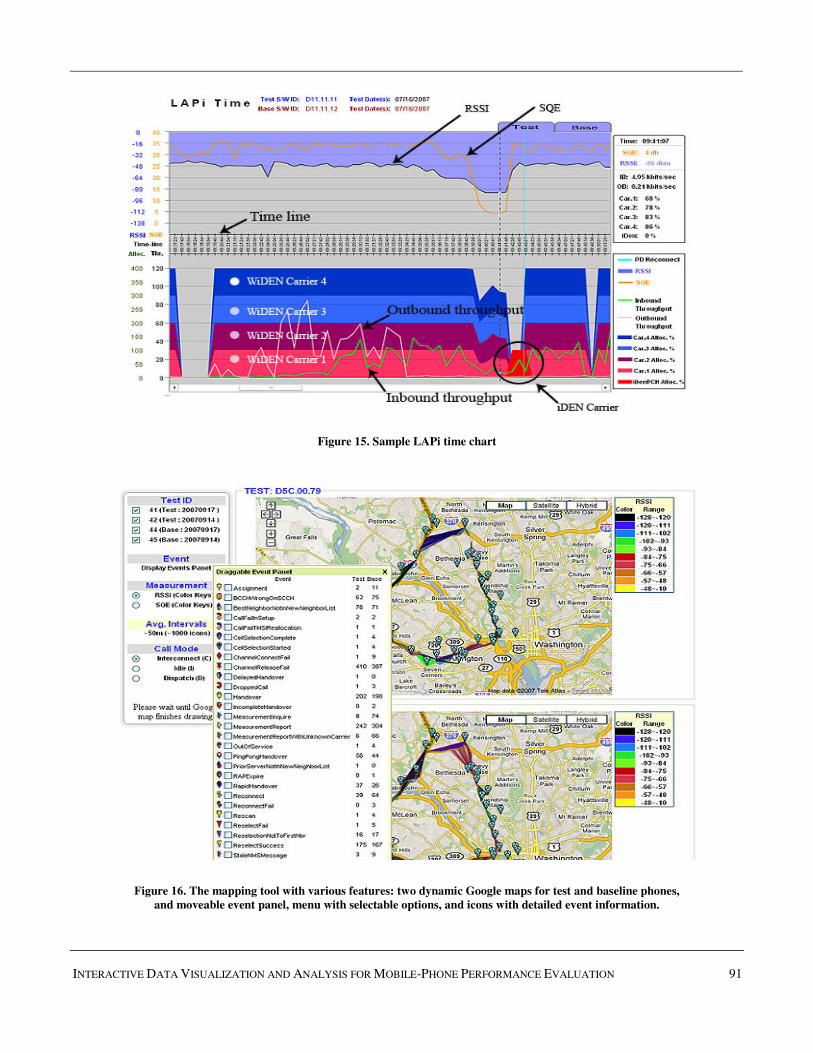
transmission quality. The LAPi data time chart is designed
to visualize the carrier allocation performance with respect
to the inbound and outbound throughputs and RF measure-
ments. Figure 15 shows a packet data performance chart on a
timeline that is placed in the middle of the chart. RSSI and
SQE are shown at the top of the chart. At the bottom of the
chart, four WiDEN carrier allocations and one iDEN carrier
allocation are depicted with respect to the SQE timeline.
This chart provides interactive and scrollable panels for test
and baseline phone. From Figure 15, one can see that WiD-
EN carrier allocations became lower and move to iDEN car-
riers when the values of SQE became lower.
iVESTA Visualization Tools
The development of visualization tools for DTD evalua-
tion is becoming an imperative demand for mobile-phone
manufacturers and network providers because such tools
help them analyze the collected data directly related to the
customer environments. In practice, such data only make
sense when interpreted in high dimensions. For example, the
differences between test and baseline phones can be easily
evaluated when the collected data are displayed on a map
with signal strength, signal quality, distance between mobile
phones and base stations, and network traffic. While the
summarization tools introduced previously may indicate
what happened during the drive test, e.g., dropped calls, the
objective of the iVESTA visualization tools is to clearly
answer why it happened, i.e., what caused the low RSSI and
why the network did not properly hand over the phone to a
neighbor cell.
A. Mapping Tool
The iVESTA mapping tool is a web application with se-
lective features such as the test dates, RF measurements, and
events on a map for different phones (test vs. baseline
phones), as shown in Figure 16. Users can select different
test dates for both phones and call modes. For all events rec-
orded in the DTD database, some of them, such as dropped
calls or rescans, are only understandable with RF measure-
ments.
Figure 14. A sample voice defect chart
INTERACTIVE DATA VISUALIZATION AND ANALYSIS FOR MOBILE-PHONE PERFORMANCE EVALUATION 91
Figure 15. Sample LAPi time chart
Figure 16. The mapping tool with various features: two dynamic Google maps for test and baseline phones,
and moveable event panel, menu with selectable options, and icons with detailed event information.

92 INTERNATIONAL JOURNAL OF MODERN ENGINEERING | VOLUME 11, NUMBER 1, FALL/WINTER 2010
In the iVESTA system, the RF measurements such as
RSSI or SQE are visualized with color keys corresponding
to the ranges of the measurements. In addition, users can
selectively decide which event(s) should be displayed such
that the users can review all event details. Another sample of
the mapping tool is shown in Figure 17, which displays all
towers and their links to the route where a mobile phone is
present. In order to provide a web-based dynamic map, this
tool is designed with Google map API. Instead of reviewing
the coverage of the network service, this tool helps users to
clearly observe abnormal mobility performances.
Figure 17. The detail information of a dropped call event with
zoom-in state: the event detail window contains Test ID, PC
time stamp, PCCH frequency and color code and RF meas-
urements on server and foreground neighbor.
In order to reduce the time of drawing all icons on the
Google map, the mapping tool is displayed in a 2-layer
structure: the transparent layer is used for RF measurements
and the icon layer is designed for the events. The data pro-
cessing flowchart for the mapping tool is shown in Figure
18. Whenever the Google event listener catches a user event,
it calls Ajax functions to retrieve data from the server and
renders the map with the event icons.
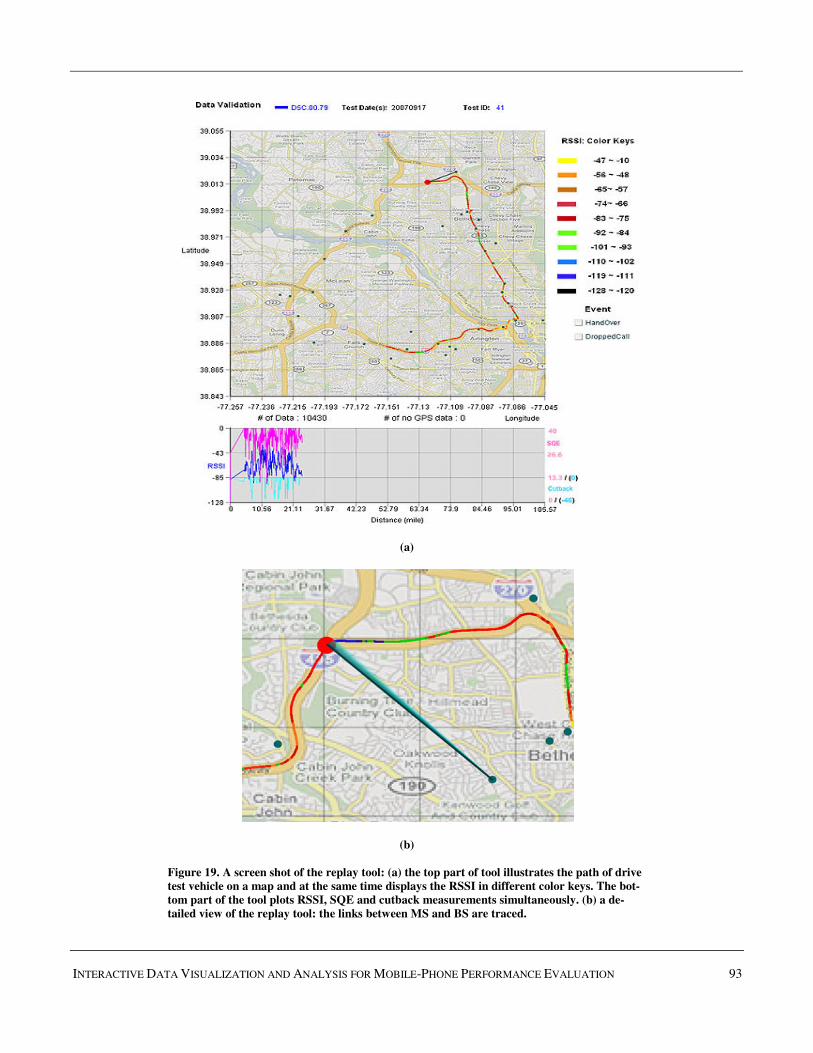
B. Replay Tool
Different from the mapping tools that simply map the events
to the web-pages, the replay tool helps users restore drive-
test scenes with respect to factors such as the directionality
and the velocity of the drive-test vehicles, through an ani-
mated web page, which dynamically shows the drive- test
trail, as shown in Figure 19. In addition, the RF measure-
ment is also dynamically visualized such that the users can
understand the test environments such as signal strength,
directions, handovers, and cell towers to which the phone
was connecting; the bottom part of Figure 19(a) displays the
Figure 18. The data process on the mapping tool.
RSSI and SQE measurements along the drive-test trip. The
directionality of the test route is a critical factor to the mobil-
ity evaluation because the zones of the mobility evaluation
are very sensitive and dependent on this factor. At the be-
ginning of the development of the iVESTA system, a large
portion of the distinct handovers between the test and the
baseline phone were observed. Later, this issue was analyzed
as a cause of the vehicle directionality. This tool animates a
drive-test vehicle with link lines between an MS and a BS,
so it helps users to review the coverage of the network ser-
vices.
Summary
Provided here was a high-level overview of the iVESTA
system, which was developed for drive test-data evaluation
with the objective of providing generic functionalities to
help a drive-test team analyze DTD evaluations and under-
stand the mobile-phone performance in comparison with the
baseline products. iVESTA delivered a practical product for
DTD evaluation, which successfully resolves the low-
integrity, low-quality, high-uncertainty, and low-
interpretability issues of the DTD. In short, iVESTA is a
web-based reporting system which provides a full-scale
evaluation of DTD through extensive comparison with the
baseline phone. In addition, iVESTA provides numerous
visualization tools to help users understand their DTD and
essentially resolve the concerns about what happened and
why it happened. This study focused mainly on the DTD
evaluations from the mobile phone manufacturers’ perspec-
tive. To extend this research, more efforts on scalability for a
large number of subscriber clients and the extension for net-
work service providers are highly recommended. In addition,
the authors plan to focus on providing automatic scoring
models for mobility and RS measurements, seamless access
from chart to DTD, analysis on the cause and effect, and
integrating data mining tools [8] to support intelligent data
analysis in a subsequent study.
INTERACTIVE DATA VISUALIZATION AND ANALYSIS FOR MOBILE-PHONE PERFORMANCE EVALUATION 93
(a)
(b)
Figure 19. A screen shot of the replay tool: (a) the top part of tool illustrates the path of drive
test vehicle on a map and at the same time displays the RSSI in different color keys. The bot-
tom part of the tool plots RSSI, SQE and cutback measurements simultaneously. (b) a de-
tailed view of the replay tool: the links between MS and BS are traced.

94 INTERNATIONAL JOURNAL OF MODERN ENGINEERING | VOLUME 11, NUMBER 1, FALL/WINTER 2010
Acknowledgement
This research was partly supported by a grant from
Motorola to Drs. Pandya and Hsu.
References
[1] Y. Lee, X. Zhu, A. Pandya, and S. Hsu, iVESTA: an
Interactive Visualization and Evaluation System for
Drive Test Data, in Proc. of the ACM Symposium on
Applied Computing, pp.1953-1957, Brazil, 2008.
[2] R. Miletic, Using Autonomous Drive Test Data to
Improve Network Quality and Engineering Efficien-
cies, in Proc. of the World Wireless Congress annual
Conference, 2006.
[3] Aircom Worldwide, 3G Live Network Optimised
using Combined ACP and Drive Test Data,
http://www.aircominternational.com/Default.aspx.locI
D-04vnew008.htm
[4] M. J. Flanagan, L. M. Drabeck, L. A. Cohen, A. H.
Diaz, J. Srinivasan, Wireless network analysis using
per call measurement data, Bell Labs Technical Jour-
nal, 11(4):307-313, 2007.
[5] Wu Jiao, Huang Yiling, Wei Zaixue, and Yang
Dacheng, A Novel Model of Drive Test Data Pro-
cessing in Wireless Network Optimization, in Proc. of
the 17th Annual IEEE International Symposium on
Personal, Indoor and Mobile Radio Communications,
2006.
[6] Jianming Zhang, Juanjuan Sun, and Dacheng Yang,
Application of Drive Test for QoS Evaluation in 3G
Wireless Networks, in Proc. of ICCT, 2003.
[7] Kostanic, I.; Hall, C.; McCarthy, J., “Measurements
of the vehicle penetration loss characteristics at
800MHz”, Vehicular Technology Conference, 1998.
VTC 98. 48th IEEE.
[8] Xingquan Zhu and Ian Davidson, Knowledge Discov-
ery and Data Mining: Challenges and Realities, IGI
publishing, April 2007.
[9] D. O. Reudink, Properties of mobile radio propaga-
tion above 400 MHz, in Proc. of the 24th
IEEE Vehic-
ular Technology Conference, Volume 24, Dec. 1973
P61 – 79.
[10] iDEN, Motorola iDEN Technical Overview,
http://webaugur.com/matt/files/nextel/techover.pdf
Biographies
YONGSUK LEE received his B.S. and M.S. degrees in
computer science from Florida Atlantic University (FAU),
Florida, and Korea in 2005 and 2007, respectively. He
joined Motorola, Florida, in 2005 and is currently working
as a programmer analyst in the Drive Test Team for iDEN
Technology Division. His current research areas of interest
include data analysis on WiMAX technology, data visualiza-
tion, and real-time web technology.
XINGQUAN ZHU is an Assistant Professor at the De-
partment of Computer Science and Engineering, Florida
Atlantic University, Boca Raton, FL. He received his Ph.D
degree in Computer Science from Fudan University, Shang-
hai, China, in 2001. From Feb. 2001 to Oct. 2002, he was a
Postdoctoral Associate in the Department of Computer Sci-
ence, Purdue University, West Lafayette, IN. From Oct.
2002 to July 2006, He was a Research Assistant Professor in
the Department of Computer Science, University of Ver-
mont, Burlington, VT. His research interests include data
mining, machine learning, multimedia systems, and infor-
mation retrieval. Since 2000, Dr. Zhu has published exten-
sively, including over 60 refereed papers in various journals
and conference proceedings.
ABHIJIT PANDYA is a professor at the Department of
Computer Science and Engineering Department, Florida
Atlantic University. He received his undergraduate educa-
tion at the Indian Institute of Technology, Bombay. He
earned his M.S. and Ph.D. in Computer Science from the
Syracuse University, New York. He has worked as a visiting
Professor in various countries including Japan, Korea, India,
etc. His areas of research include VLSI implementable algo-
rithms, Applications of AI and Image analysis in Medicine,
Financial Forecasting using Neural Networks. Dr. Pandya
has published over 150 papers and book chapters, and a
number of books in the areas of neural networks and ATM
networks. This includes a text published by CRC Press and
IEEE Press entitled “Pattern Recognition using Neural Net-
works in C++”. He consults for several industries including
IBM, Motorola, Coulter industries and the U.S. Patent Of-
fice.
SAM HSU is a Professor at the Department of Computer
Science and Engineering, Florida Atlantic University. He
received his Ph.D degree in Computer Engineering in 1993
from Florida Atlantic University His research interests in-
clude Web Technologies and Computer Networking. He has
published over 50 refereed journal/conference papers in
these areas. He also has close ties to local industries engag-
ing in joint projects that have practical applications. Dr. Hsu
is a member of ACM, IEEE, and Upsilon Pi Epsilon Honor
Society.