INTERACTIVE CLOUD SYSTEM FOR THE ANALYSIS OF …
12
H. Mora et al., Int. J. of Design & Nature and Ecodynamics. Vol. 11, No. 3 (2016) 447–458 This paper is part of the Proceedings of the International Conference on Big Data (Big Data 2016) www.witconferences.com © 2016 WIT Press, www.witpress.com ISSN: 1755-7437 (paper format), ISSN: 1755-7445 (online), http://www.witpress.com/journals DOI: 10.2495/DNE-V11-N3-447-458 INTERACTIVE CLOUD SYSTEM FOR THE ANALYSIS OF ACCESSIBILITY IN SMART CITIES H. MORA 1 , V. GILART-IGLESIAS 1 , R. PÉREZ-DELHOYO 2 , M.D. ANDÚJAR-MONTOYA 2 & H.J. COMPAÑ GABUCIO 1 1 Specialized Processors Architecture Laboratory, Department of Computer Technology and Computation, University of Alicante, Spain. 2 Department of Building Science and Urbanism, University of Alicante, Spain. ABSTRACT Recent technological progress has enabled the spread of Information and Communication Technologies (ICT) to new applications possible with the aim to improve citizens’ quality of life. This idea has been significantly increasing in political agendas as well as in the public services. The concepts of Smart-city or Sustainable-city are possible thanks to the application of technology. The focus of this work is on people with movement dis- abilities and the goal of the whole system is to meet their real needs and requirements. As a result, this article presents the possibilities offered by new ICTs to design a method for generating knowledge about accessibility issues in urban environments. In this sense, a comprehensive system aided by technology is proposed to anal- yse the transportation accessibility in a city. The research tries to make visible the most vulnerable groups of citizens, involving them as active participants and to serve as a way of social awareness. It aims to improve the knowledge of the current accessibility level and to improve the interaction and learning of all actors and groups involved – government, institutions, researchers, professionals, people with disabilities and other individuals of society in general. To perform and implement the system, the latest advances in technologies such as GPS posi- tioning, geographic information systems, smart sensing and cloud computing have been used. The combination of all these technologies allows an interactive, dynamic and constantly updated approach. Keywords: cloud system, sensing technologies, smart city, urban accessibility. 1 INTRODUCTION The continuous development of information and communication technology (ICT) has an impact on different areas such as human–computer interaction, social development, sustainability, city plan- ning, human relations, etc. ICT innovations foster development by opening new approaches to solving existing problems. The increasing body of knowledge in the field of ICTs offers methods to exploit the huge potential of technological advances and enables organizations to manage both industrial and business processes in a different way in order to increase productivity and user satis- faction [1]. Cloud computing paradigm is one of the most promising technologies to build new services for users and enterprises [2, 3]. On the one hand, cloud computing offers networking ubiquity, lower storage costs and progressive improvements in computing software and mobile computing [4]. On the other hand, mobile devices enable access to a wide range of applications and services [5, 6]. The proliferation of systems and the high penetration rate of mobile devices in the hands of citizens provides users an opportunity to conduct a citizen-centric digital revolution in many aspects of daily life. One of the contexts where this evolution can have the greatest impact on the life of citizens is the ‘Smart City’ concept. In smart cities, the latest technological advances play an important role in
Transcript of INTERACTIVE CLOUD SYSTEM FOR THE ANALYSIS OF …
H. Mora et al., Int. J. of Design & Nature and Ecodynamics. Vol. 11, No. 3 (2016) 447–458
This paper is part of the Proceedings of the International Conference on Big Data (Big Data 2016) www.witconferences.com
© 2016 WIT Press, www.witpress.comISSN: 1755-7437 (paper format), ISSN: 1755-7445 (online), http://www.witpress.com/journalsDOI: 10.2495/DNE-V11-N3-447-458
INTERACTIVE CLOUD SYSTEM FOR THE ANALYSIS OF ACCESSIBILITY IN SMART CITIES
H. MORA1, V. GILART-IGLESIAS1, R. PÉREZ-DELHOYO2, M.D. ANDÚJAR-MONTOYA2 & H.J. COMPAÑ GABUCIO1
1Specialized Processors Architecture Laboratory, Department of Computer Technology and Computation, University of Alicante, Spain.
2Department of Building Science and Urbanism, University of Alicante, Spain.
ABSTRACTRecent technological progress has enabled the spread of Information and Communication Technologies (ICT) to new applications possible with the aim to improve citizens’ quality of life. This idea has been significantly increasing in political agendas as well as in the public services. The concepts of Smart-city or Sustainable-city are possible thanks to the application of technology. The focus of this work is on people with movement dis-abilities and the goal of the whole system is to meet their real needs and requirements. As a result, this article presents the possibilities offered by new ICTs to design a method for generating knowledge about accessibility issues in urban environments. In this sense, a comprehensive system aided by technology is proposed to anal-yse the transportation accessibility in a city. The research tries to make visible the most vulnerable groups of citizens, involving them as active participants and to serve as a way of social awareness. It aims to improve the knowledge of the current accessibility level and to improve the interaction and learning of all actors and groups involved – government, institutions, researchers, professionals, people with disabilities and other individuals of society in general. To perform and implement the system, the latest advances in technologies such as GPS posi-tioning, geographic information systems, smart sensing and cloud computing have been used. The combination of all these technologies allows an interactive, dynamic and constantly updated approach.Keywords: cloud system, sensing technologies, smart city, urban accessibility.
1 INTRODUCTIONThe continuous development of information and communication technology (ICT) has an impact on different areas such as human–computer interaction, social development, sustainability, city plan-ning, human relations, etc. ICT innovations foster development by opening new approaches to solving existing problems. The increasing body of knowledge in the field of ICTs offers methods to exploit the huge potential of technological advances and enables organizations to manage both industrial and business processes in a different way in order to increase productivity and user satis-faction [1].
Cloud computing paradigm is one of the most promising technologies to build new services for users and enterprises [2, 3]. On the one hand, cloud computing offers networking ubiquity, lower storage costs and progressive improvements in computing software and mobile computing [4]. On the other hand, mobile devices enable access to a wide range of applications and services [5, 6]. The proliferation of systems and the high penetration rate of mobile devices in the hands of citizens provides users an opportunity to conduct a citizen-centric digital revolution in many aspects of daily life.
One of the contexts where this evolution can have the greatest impact on the life of citizens is the ‘Smart City’ concept. In smart cities, the latest technological advances play an important role in
448 H. Mora et al., Int. J. of Design & Nature and Ecodynamics. Vol. 11, No. 3 (2016)
many aspects of the city’s management [7, 8].Currently, the Smart City projects use the new tech-nologies of computing, sensing and telecommunications to provide knowledge and intelligence to the city [7, 9]. In general terms, the main goal is to make better use of resources [10]. The conver-gence and maturity experienced by these technologies allow the deployment of applications inside the Smart city context to generate knowledge for urban management processes. Likewise, they improve efficiency in the design of policies for sustainable resource management and public acces-sibility [11, 12].
Current urban models such as the expansion of the city or the zoning of uses, constantly generate mobility problems [13]. Mobility is one of the first challenges of sustainability. The main objectives of mobility are to facilitate movement and reduce their needs by making better use of the physical proximity relations, as well as ensuring access to goods, jobs and different services [14]. Taking into account the broad social diversity, accessibility is not only an urgent way to tackle the problems of the city by counteracting the effects of urban blight, but also one of the main challenges to be faced in sustainable development, particularly in the fields of transport and urbanization [15, 16]. Accessibility is generally understood as the facilitation of efficient ways to connect origins and des-tinations for people with movement disabilities by creating suitable street designs, removing barriers and offering other supportive approaches [7, 17].
Specifically, this work is focused on monitoring the accessibility of citizen movements across the city by taking advantage of new technologies for the dynamic analysis of urban accessibility. Even though much of the necessary technology has already been developed, three key aspects must be jointly considered to monitor events that occur in the city, which are related to the movement of the citizens: the proliferation of devices with global positioning systems (GPSs), the characteristics of wireless communication technologies and the possibilities of cloud-based applications. In addition, these possibilities allow counting on the citizens’ cooperation to monitor and supervise the accessi-bility issues. The idea behind this proposal is that the citizens can notify in real-time the accessibility deficiencies found in any place when they go around the city.
The main contribution of this work consists in the designing of a method based on the possibilities that new ICT provides to dynamically and automatically generate knowledge about urban accessibil-ity that is focused on people with movement disabilities. This research takes into account the current communication technologies. A cloud system is designed to produce value-added information about accessibility in the city. The information generated will help city managers to know and solve these issues, as well as to learn the type of urban actuations that work.
The remainder of the work is organized as follows: Section 2 describes the related work on inter-active applications for analysis of accessibility in the city; Ssection 3 describes the architecture and the main features of the proposed system; Section 4 shows an example of the prototype application deployed in working scenarios; and finally Section 5 provides details of the discussion on some of the conclusions drawn.
2 RELATED WORK
2.1 Background
There is a growing social awareness about accessibility. The accessibility in cities and public spaces has become in an important issue in official agendas due to recent European directives. The Disability Strategy 2010–2020 [18] is the last initiative in this way. This Strategy considers accessibility as the first field of action and defines accessibility as the access for people with disabilities to be on an equal basis with others, to the physical environment, transportation, information and
H. Mora et al., Int. J. of Design & Nature and Ecodynamics. Vol. 11, No. 3 (2016) 449
communications technology and systems and other facilities and services. The Strategy understands that accessibility is a prerequisite to participation, recognizes the existence of important barriers in all areas and proposes to combat the obstacles preventing having a Europe without barriers. Helping people with disabilities to participate fully in society on an equal basis with others is the main objec-tive of the Strategy. It not only agrees with the isolated action of removing existing barriers but also of promoting the model of universal accessibility and non-discrimination. Accessibility is conceived as a requirement of all spaces, facilities, services and products.
The Europe 2020 Horizon [19] highlights the importance of achieving inclusive growth based on the principles of integration, equality, solidarity and sustainability. Therefore, to make the Europe 2020 succeed it is essential to implement accessibility as a strategic line. The universal accessibility of goods, services and the built environment is not only essential for people with dis-abilities, it will also benefit and improve the quality of life for all citizens. Accessibility will also improve the quality of life for an large proportion of citizens, given the progressive aging of the population. To achieve sustainable development, we must make visible and fully integrate people with disabilities with other citizens as well as remove barriers that prevent them from participating in society.
2.2 Methods for acquiring urban accessibility
Traditionally, the most used methods for acquiring information on urban accessibility are based on evidence and street observation [20], surveys and questionnaires [21, 22] and interviews [23, 24] from disabled people and other interesting people. However, these methods cannot be performed very frequently due to the cost and time involved and, therefore, have rapidly become obsolete. In addition, it is difficul to obtain real dynamic information on accessibility issues by means of inter-views and surveys because, it is awkward for them to explain in a questionnaire how they are making use of the infrastructures in their daily life as well as to describe what is wrong in the city design. On the other hand, it is possible to know the urban accessibility actions made in the city and check its efficiency along the time. In theory, compliance with legislation may ensure the accessibil-ity of new buildings and urban plannings. However, the cities are still inaccessible. Therefore, it will be very useful dynamic knowledge to verify the presence of mobility difficulties or to determine corrective actions.
There are proposals based on technological tools to identify accessibility problems in a city. For example, there are methods that use the GPS of users’ mobile devices to track them, to determine the users’ trajectories and trace frequent paths between locations [25]. Other technologies such as Radio Frequency (RF) communication technology can also be used to trace people [7]. This method com-pares different routes of disabled and non-disabled people to infer the existence of a problem or an inadequate treatment of the accessibility. Other works are focused on public transport system such as bus, subway and train. Analyzing transport times of people with, and without, disabilities can be identified problems along the network [26].
2.3 Accessibility information applications
Recently, applications and systems have been developed to inform to the users about the accessibil-ity in urban environments [27–37]. These solutions are based mainly on the calculation of itineraries and other closely adapted resources to the user. The proposals are based on the use of the combina-tion of GPS and Geographic Information Systems (GIS) technologies. Most of the proposals offer an application for users’ mobile devices (App) in order to interface and interact with the system [35,
450 H. Mora et al., Int. J. of Design & Nature and Ecodynamics. Vol. 11, No. 3 (2016)
36]. These interactive applications allow a user to look for resources that can adapt to his/her level and type of disability. Finally, other proposals use social network communities to generate and com-plement the information about accessibility issues in the city [33, 37]. In these cases, the proposals obtain information from the user by means of self-reporting tools.
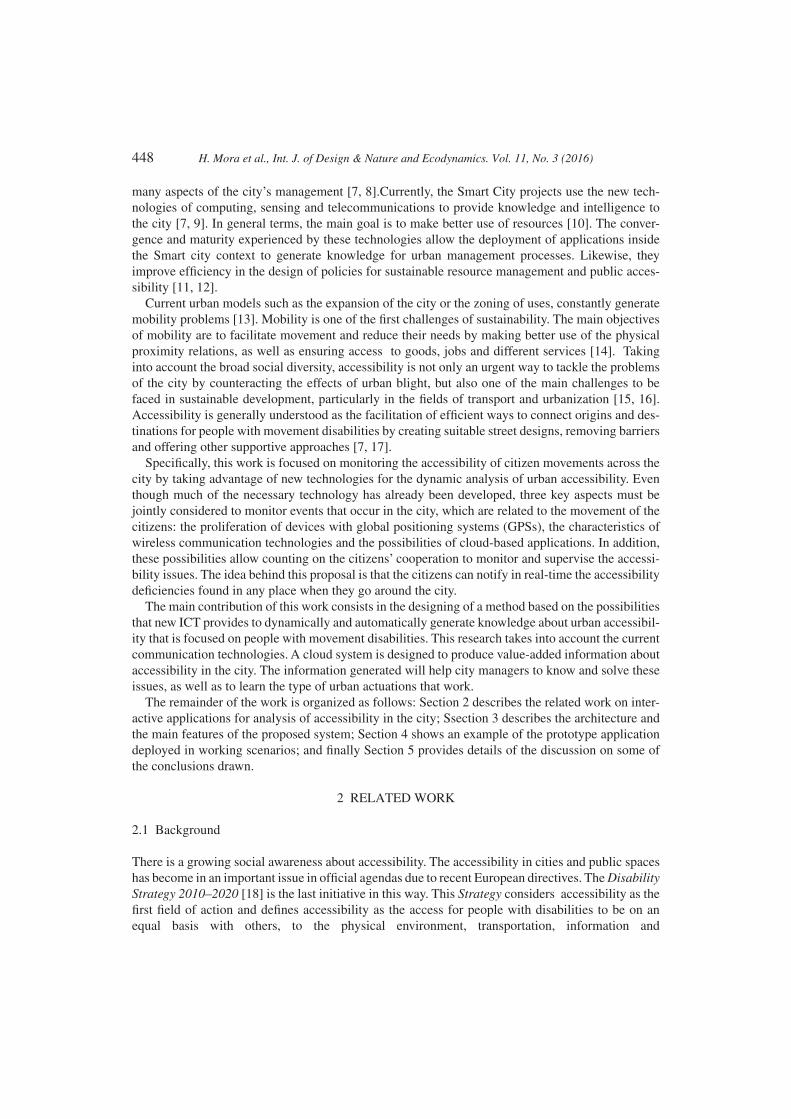
3 SYSTEM ARCHITECTUREThe architecture of the system consists of three main parts: (1) Urban Accessibility Citizen Application; (2) Urban Accessibility Management Government Application; and (3) Accessibility Information Service. The general overview of the proposed system is shown in Fig. 1.
• The Urban Accessibility Citizen Application is an end-user mobile application (App) for users with or without disability. The application focuses on the design of a series of functionalities that can achieve specific objectives towards promoting the involvement of social players and citizens in the management processes of urban accessibility in cities.
• The Urban Accessibility Management Government Application is the management part of the system and allows dynamic monitoring of urban accessibility. This tool is designed to address governance of urban planning responsibilities.
• The Accessibility Information Service is hosted on a Cloud platform to allow ubiquitous access. This part of the system performs storage and analysis of the information. It also contains the presentation modules to show the information to the users.
The next section describes the design of a prototype of this application in detail.
4 PROTOTYPE APPLICATION
4.1 Urban accessibility citizen application
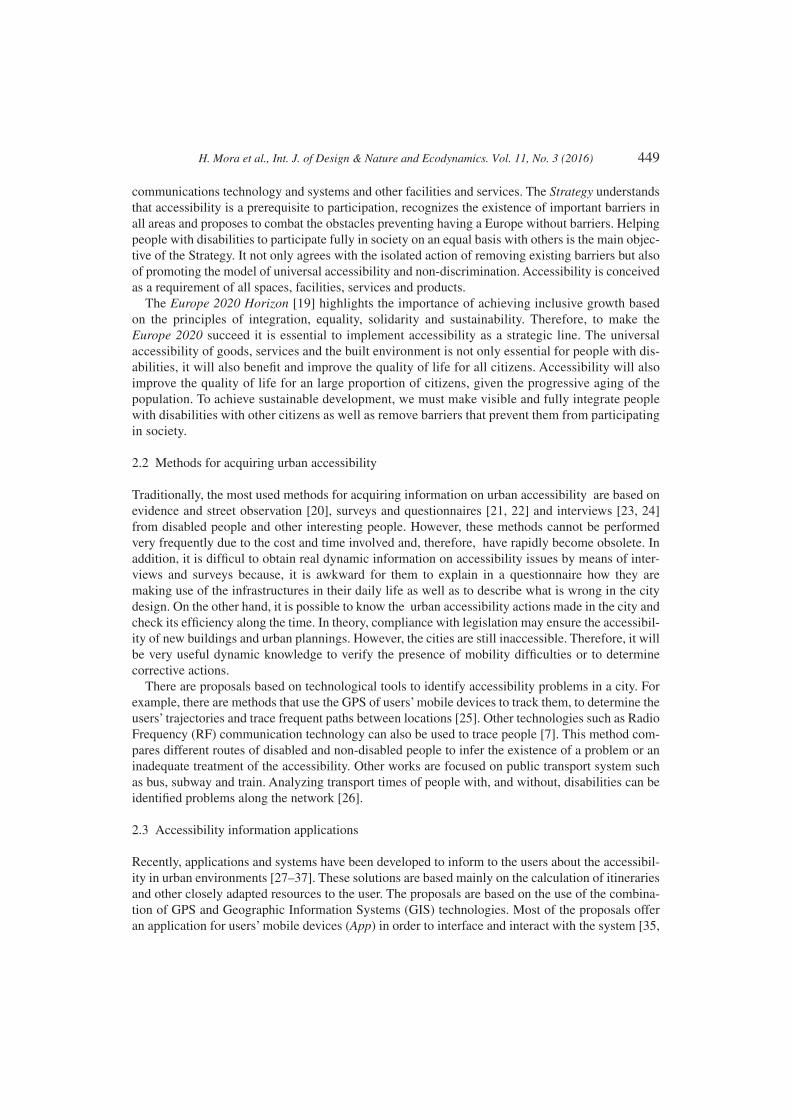
The first aspect that has been taken into account when designing the application is the identification of citizens in the system and the request for information about their possible disabilities (Fig. 2). In the first place, once the user has been identified an interface is offered, which allows the interaction of the citizen in a friendly way for the purpose of categorization. This interface enables the catego-rization of the different users according to their disabilities. Citizens without disabilities should not mark any option. All this information enables the analysis of behavioural patterns, which will
Figure 1: General overview of the proposed system.
H. Mora et al., Int. J. of Design & Nature and Ecodynamics. Vol. 11, No. 3 (2016) 451
facilitate the accurate identification of inaccessible points locations or those with reduced accessibil-ity, which have been classified by the particulars previously obtained from the route tracking of each individual via GPS. Then, from the initial information provided by each citizen it will be possible to offer a fully personalized service based on their needs, by identifying inaccessible points or those with reduced accessibility, or from complaints from other citizens in accessibility routes.
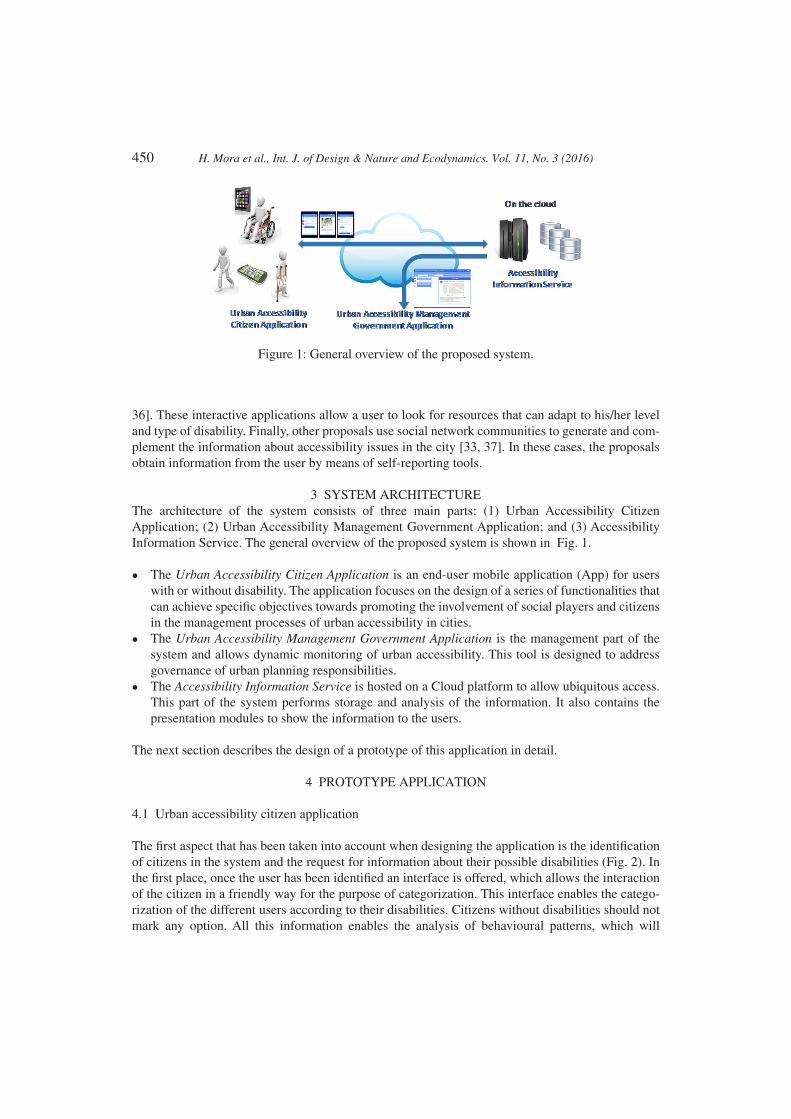
Another relevant functionality that the citizen application offers is the optimization of accessible routes location as shown in Fig. 3. The system allows to search for free routes of inaccessible or inefficient points. Therefore, citizens can set the origin and destination of their route as well as the intermediate points. The system locates all possible routes sorting them from highest to lowest accessibility.
Once identified, routes will be displayed to citizens who will be able to access each of them in order to refer to the details about existing problem points on the routes or close to them. Further, if
Figure 2: Initial access screens to the citizen application.
Figure 3: Screens finding accessible routes.
452 H. Mora et al., Int. J. of Design & Nature and Ecodynamics. Vol. 11, No. 3 (2016)
any route is selected, the system will alert with notifications of trouble points in proximity to the user through GPS monitoring of citizens.
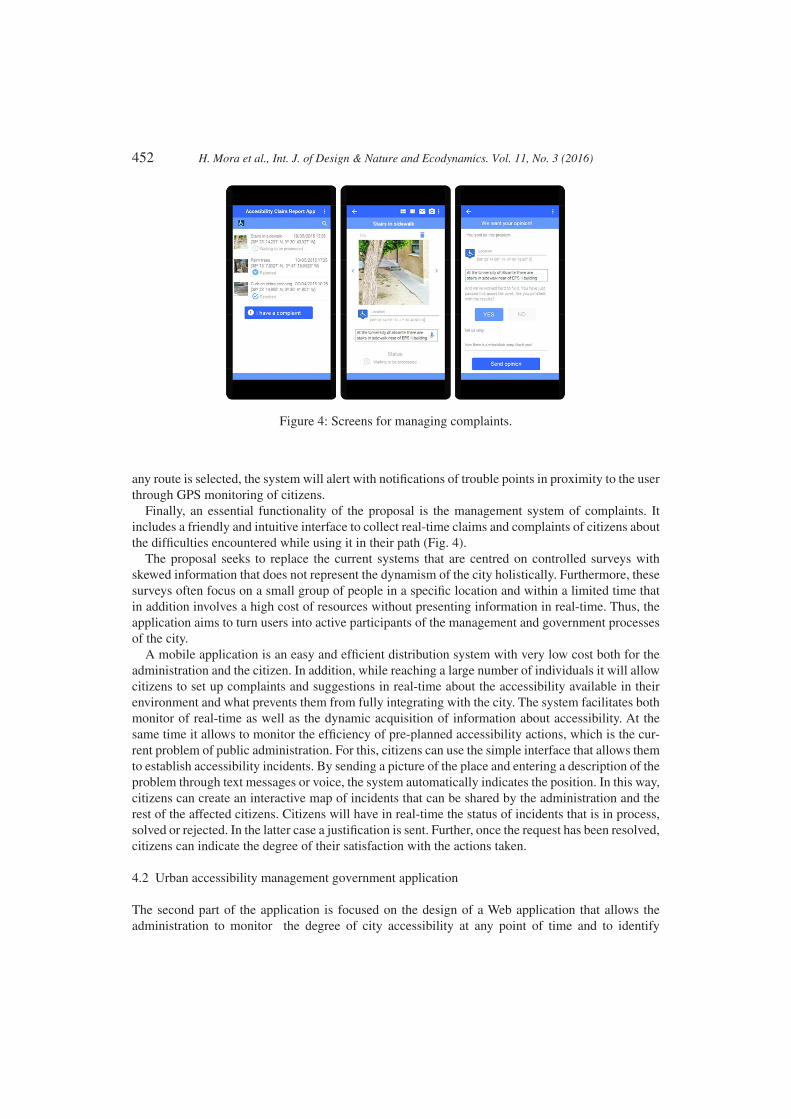
Finally, an essential functionality of the proposal is the management system of complaints. It includes a friendly and intuitive interface to collect real-time claims and complaints of citizens about the difficulties encountered while using it in their path (Fig. 4).
The proposal seeks to replace the current systems that are centred on controlled surveys with skewed information that does not represent the dynamism of the city holistically. Furthermore, these surveys often focus on a small group of people in a specific location and within a limited time that in addition involves a high cost of resources without presenting information in real-time. Thus, the application aims to turn users into active participants of the management and government processes of the city.
A mobile application is an easy and efficient distribution system with very low cost both for the administration and the citizen. In addition, while reaching a large number of individuals it will allow citizens to set up complaints and suggestions in real-time about the accessibility available in their environment and what prevents them from fully integrating with the city. The system facilitates both monitor of real-time as well as the dynamic acquisition of information about accessibility. At the same time it allows to monitor the efficiency of pre-planned accessibility actions, which is the cur-rent problem of public administration. For this, citizens can use the simple interface that allows them to establish accessibility incidents. By sending a picture of the place and entering a description of the problem through text messages or voice, the system automatically indicates the position. In this way, citizens can create an interactive map of incidents that can be shared by the administration and the rest of the affected citizens. Citizens will have in real-time the status of incidents that is in process, solved or rejected. In the latter case a justification is sent. Further, once the request has been resolved, citizens can indicate the degree of their satisfaction with the actions taken.
4.2 Urban accessibility management government application
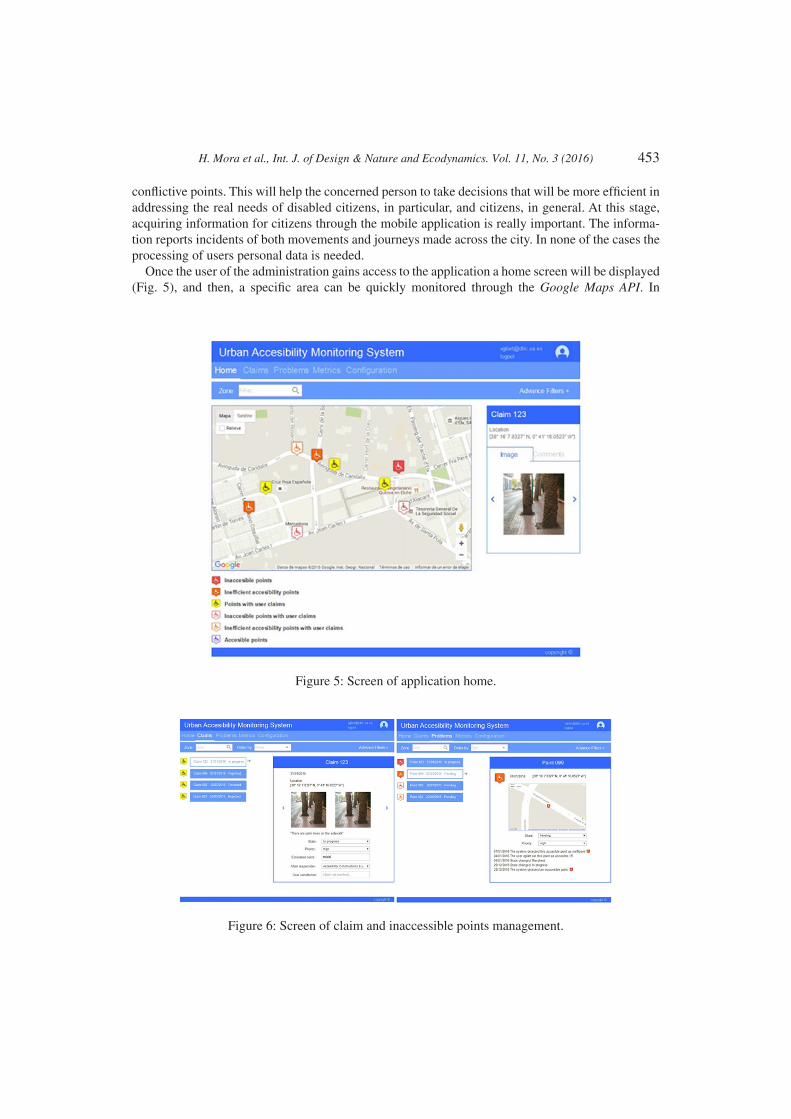
The second part of the application is focused on the design of a Web application that allows the administration to monitor the degree of city accessibility at any point of time and to identify
Figure 4: Screens for managing complaints.
H. Mora et al., Int. J. of Design & Nature and Ecodynamics. Vol. 11, No. 3 (2016) 453
conflictive points. This will help the concerned person to take decisions that will be more efficient in addressing the real needs of disabled citizens, in particular, and citizens, in general. At this stage, acquiring information for citizens through the mobile application is really important. The informa-tion reports incidents of both movements and journeys made across the city. In none of the cases the processing of users personal data is needed.
Once the user of the administration gains access to the application a home screen will be displayed (Fig. 5), and then, a specific area can be quickly monitored through the Google Maps API. In
Figure 5: Screen of application home.
Figure 6: Screen of claim and inaccessible points management.
454 H. Mora et al., Int. J. of Design & Nature and Ecodynamics. Vol. 11, No. 3 (2016)
particular, the different points related to urban accessibility of the selected area can be displayed, i.e., inaccessible, inefficient, with complaints or accessible points.
Following this, the administrator can select each of the points shown in the screen to see the details and monitor the performance. The application provides two further views for managing incidents about accessibility. Hence, the citizen complaints management are separated from management of incidents that is automatically detected by the system from the patterns of citizens’ movement (Fig. 6).
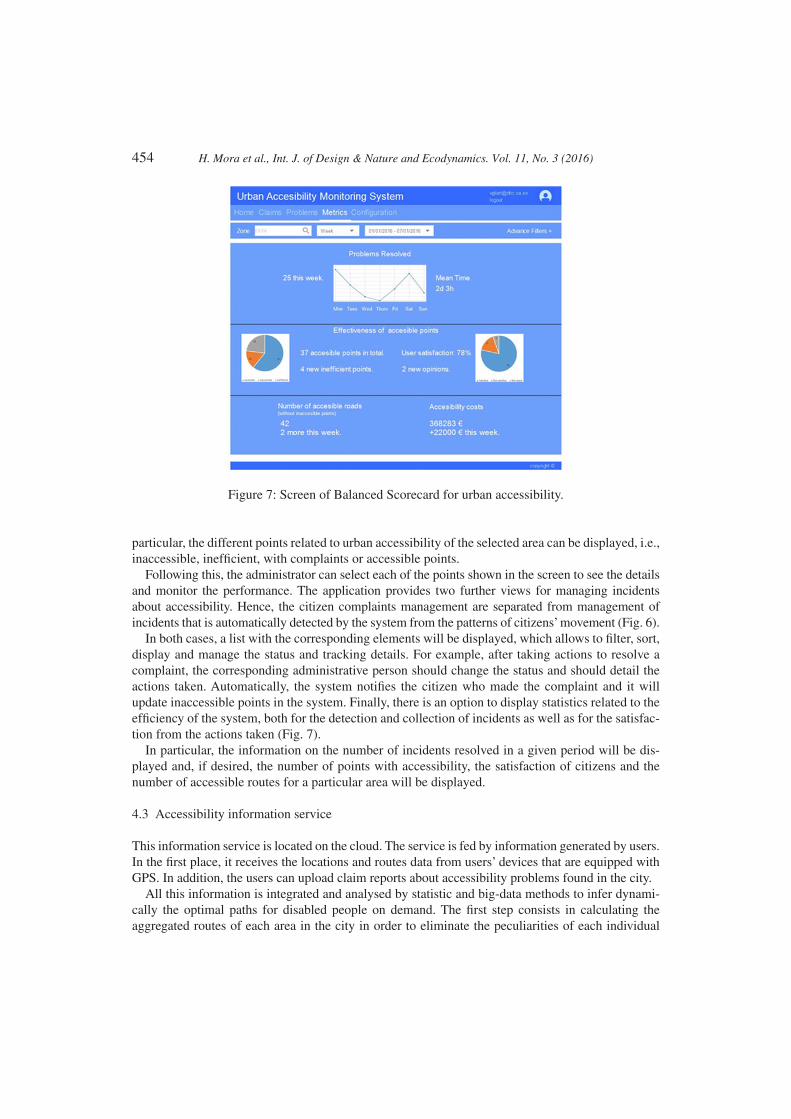
In both cases, a list with the corresponding elements will be displayed, which allows to filter, sort, display and manage the status and tracking details. For example, after taking actions to resolve a complaint, the corresponding administrative person should change the status and should detail the actions taken. Automatically, the system notifies the citizen who made the complaint and it will update inaccessible points in the system. Finally, there is an option to display statistics related to the efficiency of the system, both for the detection and collection of incidents as well as for the satisfac-tion from the actions taken (Fig. 7).
In particular, the information on the number of incidents resolved in a given period will be dis-played and, if desired, the number of points with accessibility, the satisfaction of citizens and the number of accessible routes for a particular area will be displayed.
4.3 Accessibility information service
This information service is located on the cloud. The service is fed by information generated by users. In the first place, it receives the locations and routes data from users’ devices that are equipped with GPS. In addition, the users can upload claim reports about accessibility problems found in the city.
All this information is integrated and analysed by statistic and big-data methods to infer dynami-cally the optimal paths for disabled people on demand. The first step consists in calculating the aggregated routes of each area in the city in order to eliminate the peculiarities of each individual
Figure 7: Screen of Balanced Scorecard for urban accessibility.
H. Mora et al., Int. J. of Design & Nature and Ecodynamics. Vol. 11, No. 3 (2016) 455
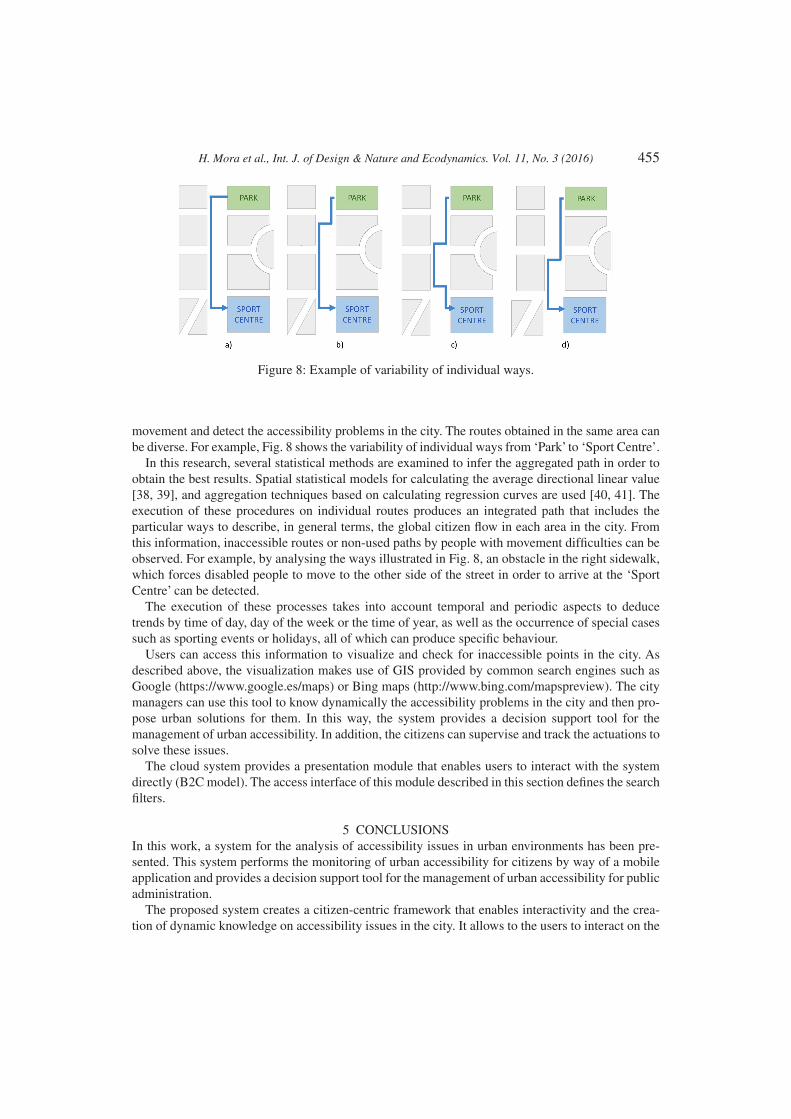
movement and detect the accessibility problems in the city. The routes obtained in the same area can be diverse. For example, Fig. 8 shows the variability of individual ways from ‘Park’ to ‘Sport Centre’.
In this research, several statistical methods are examined to infer the aggregated path in order to obtain the best results. Spatial statistical models for calculating the average directional linear value [38, 39], and aggregation techniques based on calculating regression curves are used [40, 41]. The execution of these procedures on individual routes produces an integrated path that includes the particular ways to describe, in general terms, the global citizen flow in each area in the city. From this information, inaccessible routes or non-used paths by people with movement difficulties can be observed. For example, by analysing the ways illustrated in Fig. 8, an obstacle in the right sidewalk, which forces disabled people to move to the other side of the street in order to arrive at the ‘Sport Centre’ can be detected.
The execution of these processes takes into account temporal and periodic aspects to deduce trends by time of day, day of the week or the time of year, as well as the occurrence of special cases such as sporting events or holidays, all of which can produce specific behaviour.
Users can access this information to visualize and check for inaccessible points in the city. As described above, the visualization makes use of GIS provided by common search engines such as Google (https://www.google.es/maps) or Bing maps (http://www.bing.com/mapspreview). The city managers can use this tool to know dynamically the accessibility problems in the city and then pro-pose urban solutions for them. In this way, the system provides a decision support tool for the management of urban accessibility. In addition, the citizens can supervise and track the actuations to solve these issues.
The cloud system provides a presentation module that enables users to interact with the system directly (B2C model). The access interface of this module described in this section defines the search filters.
5 CONCLUSIONSIn this work, a system for the analysis of accessibility issues in urban environments has been pre-sented. This system performs the monitoring of urban accessibility for citizens by way of a mobile application and provides a decision support tool for the management of urban accessibility for public administration.
The proposed system creates a citizen-centric framework that enables interactivity and the crea-tion of dynamic knowledge on accessibility issues in the city. It allows to the users to interact on the
Figure 8: Example of variability of individual ways.
456 H. Mora et al., Int. J. of Design & Nature and Ecodynamics. Vol. 11, No. 3 (2016)
fly with the system when they find a problem in the urban spaces in the city. The system is hosted on a cloud platform to provide ubiquity, flexibility and computing performance.
As the final result of the proposal, the design of a prototype application of this system has been presented. With this application, it has been possible to make all the undertaken actions related to accessibility visible to the citizens, and the monitoring of the urban accessibility and efficiency by the administration in real-time.
REFERENCES[1] Etro, F., The economics of cloud computing. The IUP Journal of Managerial Economics,
IX(2), pp. 7–22, 2011.[2] Targio Hashem, I.A., Yaqoob, I., Anuar, N.B., Mokhtar, S., Gani, A. & Khan, A.U., The rise
of “big data” on cloud computing: review and open research issues. Information Systems, 47, pp. 98–115, 2015.http://dx.doi.org/10.1016/j.is.2014.07.006
[3] Marston, S., Cloud computing — the business perspective. Decision Support Systems, 51(1), pp. 176–189, 2011.http://dx.doi.org/10.1016/j.dss.2010.12.006
[4] Pallis, G., Cloud computing: the new frontier of internet computing. IEEE Internet Computing, 14(5), pp. 70–73, 2010.http://dx.doi.org/10.1109/MIC.2010.113
[5] Mora, H.M., Gil, D., Colom Lopez, J.F. & Signes Pont, M.T., Flexible framework for real-time embedded systems based on mobile cloud computing paradigm. Mobile Information Systems, 2015(2015), p. 14, 2015.http://dx.doi.org/10.1155/2015/652462
[6] Makris, P., Skoutas, D.N. & Skianis, C., A survey on context-aware mobile and wireless networking: on networking and computing environments’ integration. IEEE Communnication Surveys & Tutorials, 15(1), pp. 362–386, 2013.http://dx.doi.org/10.1109/SURV.2012.040912.00180
[7] Gilart-Iglesias, V., Mora, H., Perez-delHoyo, R. & Garcia-Mayor, C., A computational method based on radio frequency technologies for the analysis of accessibility of disabled people in sustainable cities. Sustainability, 7(11), pp. 14935–14963.
[8] Angelidou, M., Smart cities: a conjuncture of four forces. Cities, 47, pp. 95–106, 2015.http://dx.doi.org/10.1016/j.cities.2015.05.004
[9] Gabrys, J., Programming environments: environmentality and citizen sensing in the smart city. Environment and Planning D: Society and Space, 32(1), pp. 30–48, 2014.http://dx.doi.org/10.1068/d16812
[10] Neirotti, P., Marco, A.D., Cagliano, A.C., Mangano, G. & Scorrano, F., Current trends in smart city initiatives: some stylized facts. Cities, 38, pp. 25–36, 2014.http://dx.doi.org/10.1016/j.cities.2013.12.010
[11] Yigitcanlar, T., Empirical approaches in knowledge city research. Expert System with Application, 41(12), pp. 5547–5548, 2014.http://dx.doi.org/10.1016/j.eswa.2014.02.005
[12] Mora-Mora, H., Gilart-Iglesias, V., Gil, D. & Sirvent-Llamas, A., A computational architecture based on RFID sensors for traceability in smart cities. Sensors, 15, pp. 13591–13626, 2015.http://dx.doi.org/10.3390/s150613591
[13] Macário, R., Managing Urban Mobility Systems, Emerald Group Publishing: Bingley, UK, 2011.http://dx.doi.org/10.1108/9780857246127
H. Mora et al., Int. J. of Design & Nature and Ecodynamics. Vol. 11, No. 3 (2016) 457
[14] Schmale, J., von Schneidemesser, E. & Dörrie, A., An integrated assessment method for sustainable transport system planning in a middle sized German city. Sustainability, 7, pp. 1329–1354, 2015.http://dx.doi.org/10.3390/su7021329
[15] Marquet, O. & Miralles-Guasch, C., The walkable city and the importance of the proximity environments for Barcelona’s everyday mobility. Cities, 42, pp. 258–266, 2015.http://dx.doi.org/10.1016/j.cities.2014.10.012
[16] Bromley, R.D.F., Matthews, D.L. & Thomas, C.J., City center accessibility for wheelchair users: the consumer perspective and the planning implications. Cities, 24, pp. 229–241, 2007.http://dx.doi.org/10.1016/j.cities.2007.01.009
[17] Marquet, O. & Miralles-Guasch, C., The walkable city and the importance of the proximity environments for Barcelona’s everyday mobility. Cities, 42, pp. 258–266, 2015.http://dx.doi.org/10.1016/j.cities.2014.10.012
[18] European Commission, European Disability Strategy 2010–2020: A Renewed Commitment to a Barrier-Free Europe, 2010.
[19] European Comission, Horizon 2020, The EU framework programme for research and innova-tion, available at https://ec.europa.eu/ programmes/horizon2020/, (accessed 2 February 2016).
[20] Mackett, R.L., Kamalasudhan, A. & Helena, T., AMELIA: making streets more accessible for people with mobility difficulties. Urban Design International, 13, pp. 81–89, 2008.http://dx.doi.org/10.1057/udi.2008.12
[21] Beale, L., Field, K., Briggs, D., Picton, P. & Matthews, H., Mapping for wheelchair users: route navigation in urban spaces. The Cartographic Journal, 43, pp. 68–81, 2006.http://dx.doi.org/10.1179/000870406X93517
[22] Le-Klähn, D.-T., Hall, C.M. & Gerike, R., Analysis of visitor satisfaction with public transport in munich. Journal of Public Transportation, 17, pp. 68–85, 2014.http://dx.doi.org/10.5038/2375-0901.17.3.5
[23] Hashim, A.E., Samikon, S.A., Ismail, F., Kamarudin, H., Mohdjalil, M.N. & Arrif, N.M., Access and accessibility audit in commercial complex: effectiveness in respect to People with Disabilities (PWDs). Procedia Social and Behavioral Sciences, 50, pp. 452–461, 2012.http://dx.doi.org/10.1016/j.sbspro.2012.08.049
[24] Venter, C., Savill, T., Rickert, T., Bogopane, H., Venkatesh, A., Camba, J., Mulikita, N., Khau-la, C., Stone, J. & Maunder, D., Enhancing accessibility for people with disabilities living in urban areas, 2002, available at http://www.globalride-sf.org/images/DFID.pdf (accessed 1 February 2016).
[25] Palazzi, C.E., Teodori, L. & Roccetti, M., Path 2.0: a participatory system for the genera-tion of accessible routes. IEEE International Conference on Multimedia and Expo (ICME), pp. 1707–1711, 2010.http://dx.doi.org/10.1109/icme.2010.5583240
[26] Ferrari, L., Berlingerio, M., Calabrese, F. & Reades, J., Improving the accessibility of urban transportation networks for people with disabilities. Transportation Research Part C: Emerg-ing Technologies, 45, pp. 27–40, 2014.http://dx.doi.org/10.1016/j.trc.2013.10.005
[27] Inada, Y., Izumi, S., Koga, M. & Matsunara, S., Development of planning support system for welfare urban design—optimal route finding for wheelchair users. Procedia Environmental Sciences, 22, pp. 61–69, 2014.http://dx.doi.org/10.1016/j.proenv.2014.11.006
458 H. Mora et al., Int. J. of Design & Nature and Ecodynamics. Vol. 11, No. 3 (2016)
[28] Comai, S., Kayange, D., Mangiarotti, R., Matteucci, M., Ugur Yavuz, S. & Valentini, F., Mapping city accessibility: review and analysis. Studies in Health Technology and Informat-ics, 217, pp. 325–331, 2015.
[29] Mavoa, S., Witten, K., McCreanor, T. & O’Sullivan, D., GIS based destination accessibility via public transit and walking in Auckland. Journal of Transport Geography, 20, pp. 15–22, 2012.http://dx.doi.org/10.1016/j.jtrangeo.2011.10.001
[30] Ford, A.C., Barr, S.L., Dawson, R.J. & James, P., Transport accessibility analysis using gis: assessing sustainable transport in London. International Journal of Geo-Information, 4, pp. 124–149, 2015.http://dx.doi.org/10.3390/ijgi4010124
[31] Matthews, H., Beale, L., Picton, P. & Briggs, D., Modelling Access with GIS in Urban Systems (MAGUS): capturing the experiences of wheelchair users. Area, 35(1), pp. 34–45, 2003.http://dx.doi.org/10.1111/1475-4762.00108
[32] Karimi, H.A., Zhang, L. & Benner, J.G., Personalized Accessibility Maps (PAMs) for com-munities with special needs, web and wireless geographical information systems. LNCS, 7820, pp. 199–213, 2013.
[33] Menkens, C., Sussmann, J., Al-Ali, M., Breitsameter, E., Frtunik, J., Nendel, T. & Schneider-bauer, T., Easywheel—a mobile social navigation and support system for wheelchair users. Information Technology New Gener, 2011.http://dx.doi.org/10.1109/itng.2011.149
[34] Mancini, A. & Zingaretti, P., Point to point navigation for people with mobility impairments. International Conference on Mechatronic and Embedded Systems and Applications (MESA), pp. 1–6, 2014.http://dx.doi.org/10.1109/mesa.2014.6935622
[35] Wheelmap project, available at http://wheelmap.org/, (accessed 2 February 2016)[36] Accessible.net project, available at http://accessible.net/, (accessed 2 February 2016)[37] Prandi, C., Salomoni, P. & Mirri, S., mPASS: integrating people sensing and crowdsourc-
ing to map urban accessibility. IEEE Consumer Communications and Networking Conference (CCNC), pp. 591–595, 2014.http://dx.doi.org/10.1109/ccnc.2014.6940491
[38] Omrani, H., Charif, O., Klein, O., Gerber, P. & Trigano, P., An approach for spatial and temporal data analysis: application for mobility modelling of workers in Luxembourg and its bordering areas. IEEE International Conference on Systems Man and Cybernetics (SMC), pp. 1437–1442, 2010.http://dx.doi.org/10.1109/icsmc.2010.5642474
[39] Kafai, M., Miao, Y. & Okada, K., Directional mean shift and its application for topology clas-sification of local 3d structures. IEEE Conference on Computer Vision and Pattern Recognition Workshops (CVPRW), pp. 170–177, 2010.http://dx.doi.org/10.1109/cvprw.2010.5543591
[40] Dominici, F., Parmigiani, G., Reckhow, K.H. & Wolpert, R.L., Combining information from related regressions. Journal of Agricultural, Biological, and Environmental Statistics, 2(3). pp. 313–332, 1997.http://dx.doi.org/10.2307/1400448
[41] Yuan, Z. & Yang, Y., Combining linear regression models: when and how? Journal of the American Statistical Association, 100(472), 2005.http://dx.doi.org/10.1198/016214505000000088


![INTERACTIVE CLOUD SYSTEM FOR THE ANALYSIS OF …...Cloud computing paradigm is one of the most promising technologies to build new services for users and enterprises [2, 3]. On the](https://static.fdocuments.us/doc/165x107/603238d05111616d996d48f4/interactive-cloud-system-for-the-analysis-of-cloud-computing-paradigm-is-one.jpg)