Interactive Advertising Bureau - IAB Canada · PDF fileInteractive Advertising Bureau 2015...
23
Interactive Advertising Bureau 2015 Actual + 2016 Estimated Canadian Internet Advertising Revenue Survey DETAILED REPORT An Industry Survey conducted by EY, Sponsored by the Interactive Advertising Bureau of Canada Published: September 12, 2016 IAB Canada 2 St. Clair Avenue West, Suite 602, Toronto, Ontario M4V 1L5 Phone 416.598.3400 • iabcanada.com
Transcript of Interactive Advertising Bureau - IAB Canada · PDF fileInteractive Advertising Bureau 2015...
Interactive Advertising Bureau
2015 Actual + 2016 Estimated
Canadian Internet Advertising Revenue Survey
DETAILED REPORT
An Industry Survey conducted by EY,
Sponsored by the Interactive Advertising Bureau of Canada
Published: September 12, 2016
IAB Canada 2 St. Clair Avenue West, Suite 602, Toronto, Ontario M4V 1L5 Phone
416.598.3400 • iabcanada.com
IAB Canada 2 St. Clair Avenue West, Suite 602, Toronto, Ontario M4V 1L5
Phone 416.598.3400 • iabcanada.com 2
Table of Contents
A. Executive Summary 3
B. Detailed Findings
2015 Canadian Internet Revenue: Total Canada, French Canada 6
2016 Canadian Internet Revenue Forecast 7
Canadian Internet Advertising Revenues Over Time: 2006-2015 7
Concentration of Internet Advertising Revenues in Canada 9
Revenue + Growth Trends by Advertising Vehicle/Format 9
Share of Total Internet Ad Revenue by Advertising Vehicle 11
NEW in this Report: Mobile (+Tablet) Ad Revenues by Format 12
Percent of Internet Revenue by Advertising Category 13
C. Appendix
Background: About this Report 15
Survey Scope + Methodology 15
Definitions of 2015 Internet and Mobile Advertising Formats 18
Definitions of Leading Industry Categories 22
About IAB Canada 23
IAB Canada 2 St. Clair Avenue West, Suite 602, Toronto, Ontario M4V 1L5
Phone 416.598.3400 • iabcanada.com 3
A. Executive Summary:
2015 Full-Year Highlights and 2016 Forecast
“This year’s IAB Canada Internet Revenue Report firmly places mobile in its rightful position, as leading the charge in online advertising growth in Canada. Advertisers have reached a level of confidence investing in the mobile channel and are successfully adapting to consumers’ multi-platform behavior”. Sonia Carreno, President, IAB Canada.
2015 Internet Ad Revenue Trends: Up +21% to $4.6 billion; Mobile surges
almost +80% to $1.6 billion, more than 1-in-3 of all Internet ad dollars
Canadian Internet advertising revenue reached $4.604 billion in 2015, up 21% from 3.793 billion
in 2014. This is a remarkable ten percentage points higher than the previous survey’s 2015
forecast of 11% growth and more than $800 million over last year. Furthermore, the Internet
increased its revenue lead to +43% over Television’s $3.220 billion in 2015 (from +12% last
year).
Mobile (including Tablets) drove overall 2015 revenue growth again this year, rising to over 1.6
billion revenue ($1.620 billion), up from $903 million in 2014. With a staggering 79% growth rate
Mobile now accounts for over 1-in-3 digital ad revenue dollars, way up from almost 1-in-4 in
2015. Online which still represents the bulk of Internet ad revenue (65%) grew 3% to just under
$3 billion (2.984 billion). Mobile’s 35% share of Canadian Internet ad revenue is now at parity
with the US.
French Language Internet advertising revenue grew by 17% to almost $800 million ($794
Million) in 2015. French language Internet revenue represents 17% of total Canada in 2015,
down one point from 18% last year and 19% in 2013.
2016 Revenue Forecast: Up +21% to hit $5.6 billion, with French Canada
approaching $1 Billion mark
Respondents to IAB Canada’s 2015 Survey have forecasted that Internet Ad Revenues will again grow 21% by the end of
2016, rising to $5.553 billion in Total Canada. This forecast includes a return to comparable growth in French
language ad revenues (also +21%) which are budgeted to increase to $962 million, stabilizing its 17% share of Total
Canada revenue. Cautionary note: This forecast is an aggregate of budgets submitted by survey respondents in the 1st and
2nd quarters of 2016. As such, it may be superseded by later marketplace developments that make it more or less certain of being
achieved, or possibly even surpassed.
Concentration of Internet Revenues in Canada: Up slightly in 2015
The Top 10 Internet Advertising Earners in this survey brought in 86% of all Canadian Internet Ad Revenues in 2015, up
3 percentage points over last year (83%). The Top 20 Earners accounted for a stable 90% of total Internet
revenues in 2015, unchanged since 2010.
IAB Canada 2 St. Clair Avenue West, Suite 602, Toronto, Ontario M4V 1L5
Phone 416.598.3400 • iabcanada.com 4
Revenue by Advertising Vehicle/Format in 2015: Search/Display up +22% each, approaching 90% of Internet ad revenue; Video rises faster at +35%. NEW in this report - Spend by Mobile format.
The top two Internet formats of Search and Display collectively represent $4.1 billion in 2015 -- up from 3.3 billion in
2014. This is almost 90% of total 2015 Internet revenue in Canada (89%). With +22% growth each, these are the two key
formats behind the overall 21% Internet revenue expansion in 2015, assisted by Video’s much faster +35% trajectory to
$358 million (which also upped Video’s share of Total Internet revenue by 1 share point to 8%).
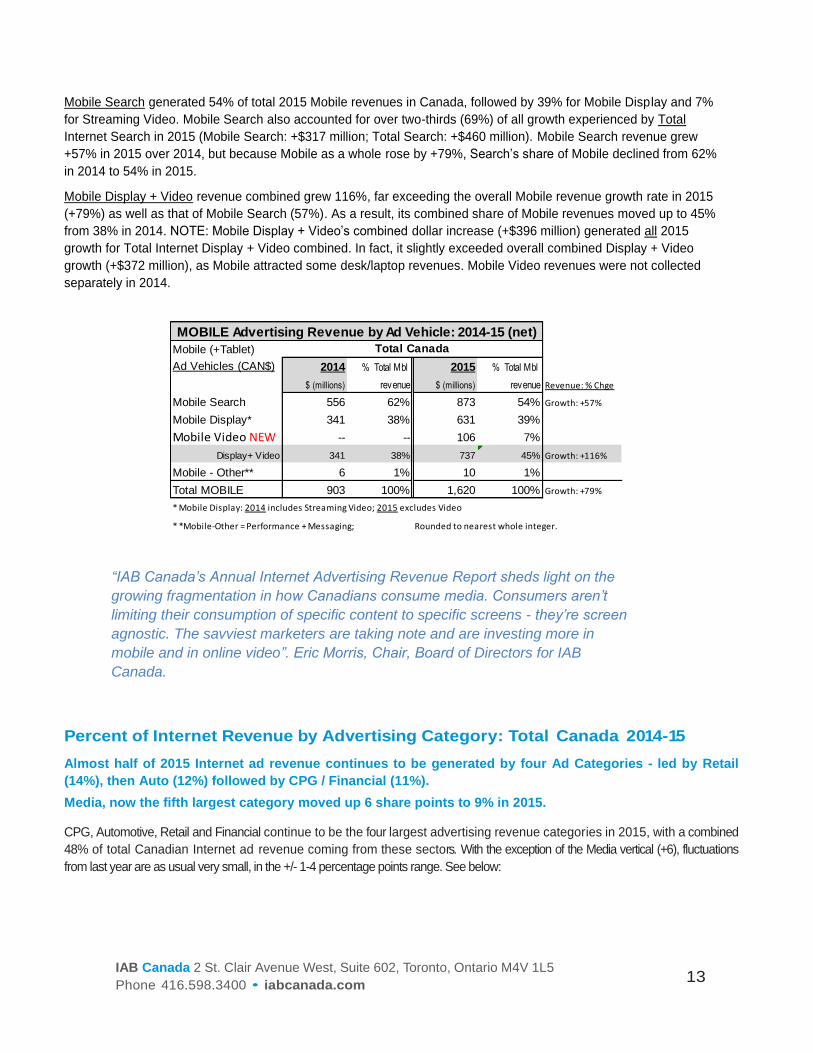
NEW! Mobile Search generated 54% of total 2015 Mobile revenues in Canada, followed by 39% for Mobile Display and
7% for Mobile Streaming Video. These Mobile format share levels are directionally similar to the Internet as a whole.
Mobile Search also accounted for over two-thirds (69%) of all growth experienced by Total Internet Search in 2015.
Mobile Display/Video combined grew a lot faster in 2015 (+116%) than Mobile overall (+79%) or Mobile Search
(+57%), so its share of Mobile grew in 2015 while Mobile Search’s declined somewhat as a result. (Mobile Video
revenues not reported separately in 2014).
French language Display is the principal driver behind French Canada revenue growth in 2015, rising by +46% over
2014. Only Video grew faster, +48% in French Canada.
Revenue by Advertising Product Category: Top 4 near 50%, ‘Media’ makes Top-5
CPG, Automotive, Retail and Financial continue to be the four largest advertising revenue categories in 2015 out of a total
of 16 reported, with a combined 48% of total Canadian Internet ad revenue coming from these sectors. Fluctuations from
last year are as usual very small, in the +/- 1-4 percentage points range. The exception is the Media category which jumped up by +6
percentage points to a strong fifth place in 2015.
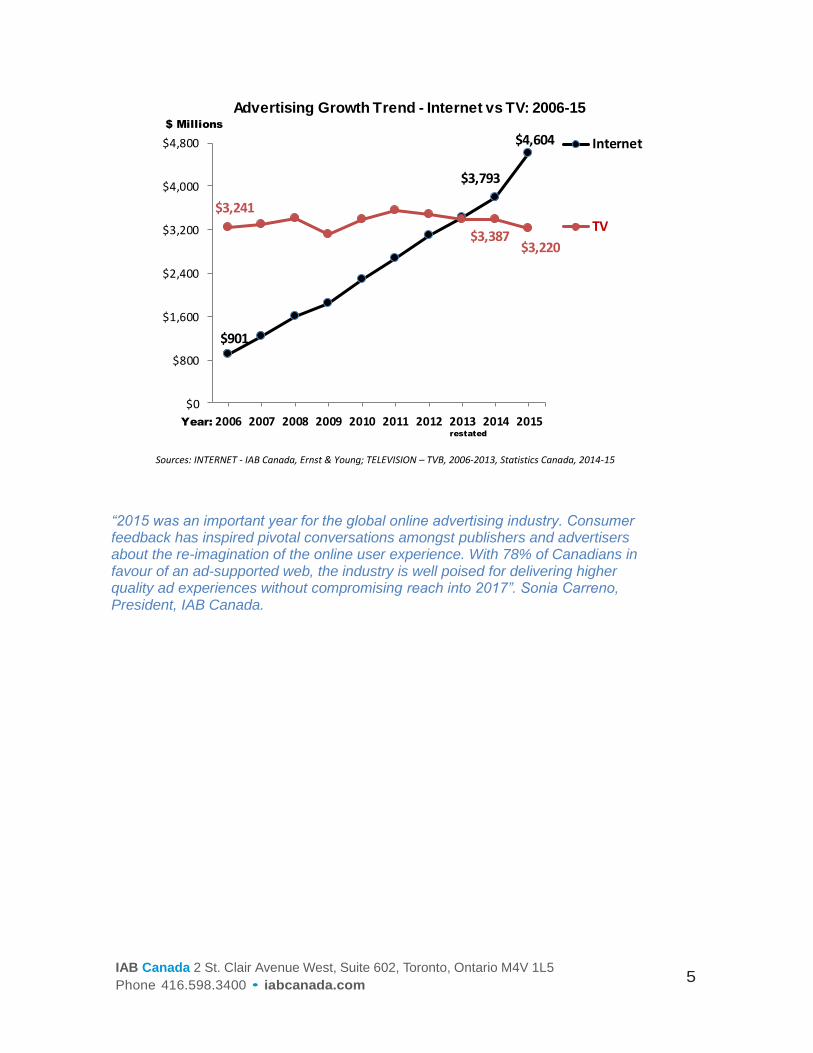
Internet Ad Growth Compared to Television: Lead Grows to +43%
In 2013, 20 years after the first banner ran, Canadian Digital advertising rose above TV with the largest share
of ad spend among the 6 major consumer media (latter also include Radio, Out-of-Home, Dailies, Magazines).
In 2015, Internet ad revenue, including Online & Mobile (+Tablets) experienced a steep double-digit growth rate
(+21%), increasing its revenue lead over TV from +12% last year to +43% in 2015. TV revenue declined by -4.9%
in 2015 to $3.220 billion from 3.387 billion (Source: Statistics Canada, July 5, 2016).
"In 2013, Digital first outpaced TV in ad dollars, and this trend has continued in 2015. Digital is now firmly in the lead as the solution for brands to reach and engage consumers." Claude Galipeau, Country Manager, Canada, Yahoo
The Internet’s steep revenue growth curve over the past ten years becomes dramatically evident in the following line
graph:
IAB Canada 2 St. Clair Avenue West, Suite 602, Toronto, Ontario M4V 1L5
Phone 416.598.3400 • iabcanada.com 5
Sources: INTERNET - IAB Canada, Ernst & Young; TELEVISION – TVB, 2006-2013, Statistics Canada, 2014-15
“2015 was an important year for the global online advertising industry. Consumer feedback has inspired pivotal conversations amongst publishers and advertisers about the re-imagination of the online user experience. With 78% of Canadians in favour of an ad-supported web, the industry is well poised for delivering higher quality ad experiences without compromising reach into 2017”. Sonia Carreno, President, IAB Canada.
$901
$3,793
$4,604
$3,241
$3,387$3,220
$0
$800
$1,600
$2,400
$3,200
$4,000
$4,800
2006 2007 2008 2009 2010 2011 2012 2013 2014 2015
Internet
TV
$ Millions
Year:
Advertising Growth Trend - Internet vs TV: 2006-15
restated
IAB Canada 2 St. Clair Avenue West, Suite 602, Toronto, Ontario M4V 1L5
Phone 416.598.3400 • iabcanada.com 6
B. Internet Advertising Revenue Findings - Detailed 2015 Canadian Internet Revenue: Total Canada, French Language
Internet increases by 21% in 2015, keeping pace with similar U.S. double digit growth* -
reaching $4.6 billion; Mobile surges almost 80% to 1.6 billion, almost 4X as fast.
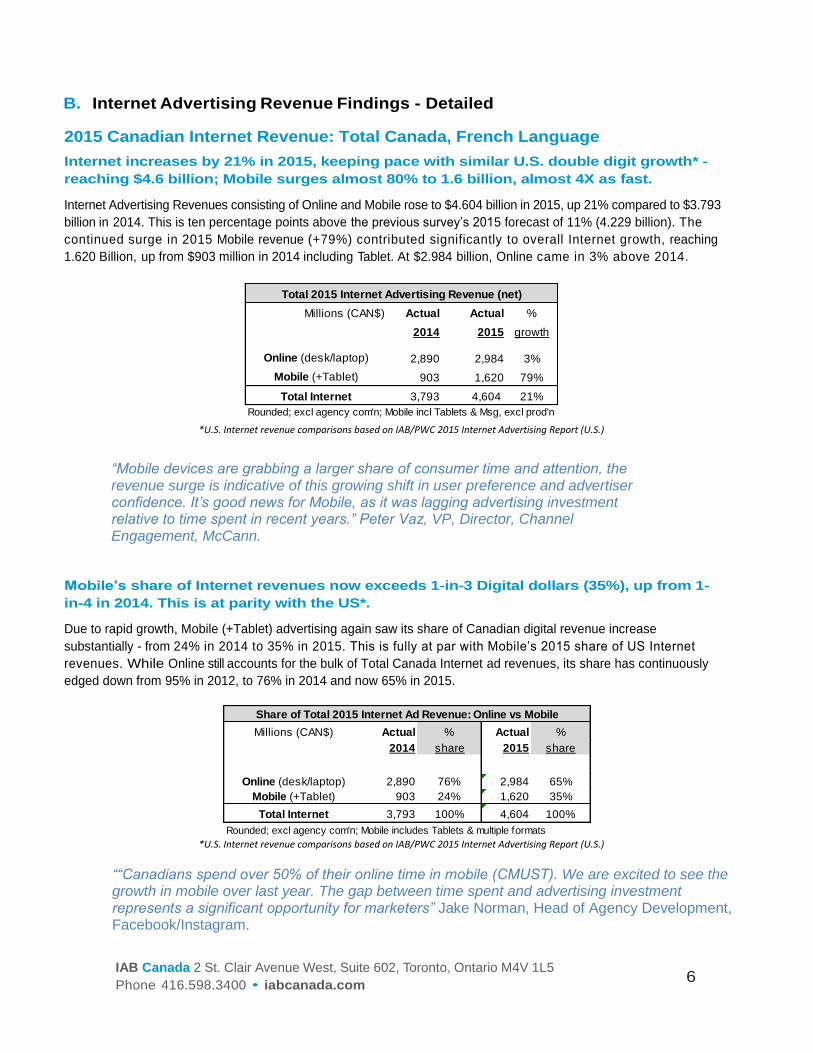
Internet Advertising Revenues consisting of Online and Mobile rose to $4.604 billion in 2015, up 21% compared to $3.793
billion in 2014. This is ten percentage points above the previous survey’s 2015 forecast of 11% (4.229 billion). The
continued surge in 2015 Mobile revenue (+79%) contributed significantly to overall Internet growth, reaching
1.620 Billion, up from $903 million in 2014 including Tablet. At $2.984 billion, Online came in 3% above 2014.
*U.S. Internet revenue comparisons based on IAB/PWC 2015 Internet Advertising Report (U.S.)
“Mobile devices are grabbing a larger share of consumer time and attention, the revenue surge is indicative of this growing shift in user preference and advertiser confidence. It’s good news for Mobile, as it was lagging advertising investment relative to time spent in recent years.” Peter Vaz, VP, Director, Channel Engagement, McCann.
Mobile’s share of Internet revenues now exceeds 1-in-3 Digital dollars (35%), up from 1-
in-4 in 2014. This is at parity with the US*.
Due to rapid growth, Mobile (+Tablet) advertising again saw its share of Canadian digital revenue increase
substantially - from 24% in 2014 to 35% in 2015. This is fully at par with Mobile’s 2015 share of US Internet
revenues. While Online still accounts for the bulk of Total Canada Internet ad revenues, its share has continuously
edged down from 95% in 2012, to 76% in 2014 and now 65% in 2015.
*U.S. Internet revenue comparisons based on IAB/PWC 2015 Internet Advertising Report (U.S.)
““Canadians spend over 50% of their online time in mobile (CMUST). We are excited to see the growth in mobile over last year. The gap between time spent and advertising investment represents a significant opportunity for marketers” Jake Norman, Head of Agency Development, Facebook/Instagram.
Millions (CAN$) Actual Actual %
2014 2015 growth
Online (desk/laptop) 2,890 2,984 3%
Mobile (+Tablet) 903 1,620 79%
Total Internet 3,793 4,604 21%
Rounded; excl agency com'n; Mobile incl Tablets & Msg, excl prod'n
Total 2015 Internet Advertising Revenue (net)
Millions (CAN$) Actual % Actual %
2014 share 2015 share
Online (desk/laptop) 2,890 76% 2,984 65%
Mobile (+Tablet) 903 24% 1,620 35%
Total Internet 3,793 100% 4,604 100%
Rounded; excl agency com'n; Mobile includes Tablets & multiple formats
Share of Total 2015 Internet Ad Revenue: Online vs Mobile
IAB Canada 2 St. Clair Avenue West, Suite 602, Toronto, Ontario M4V 1L5
Phone 416.598.3400 • iabcanada.com 7
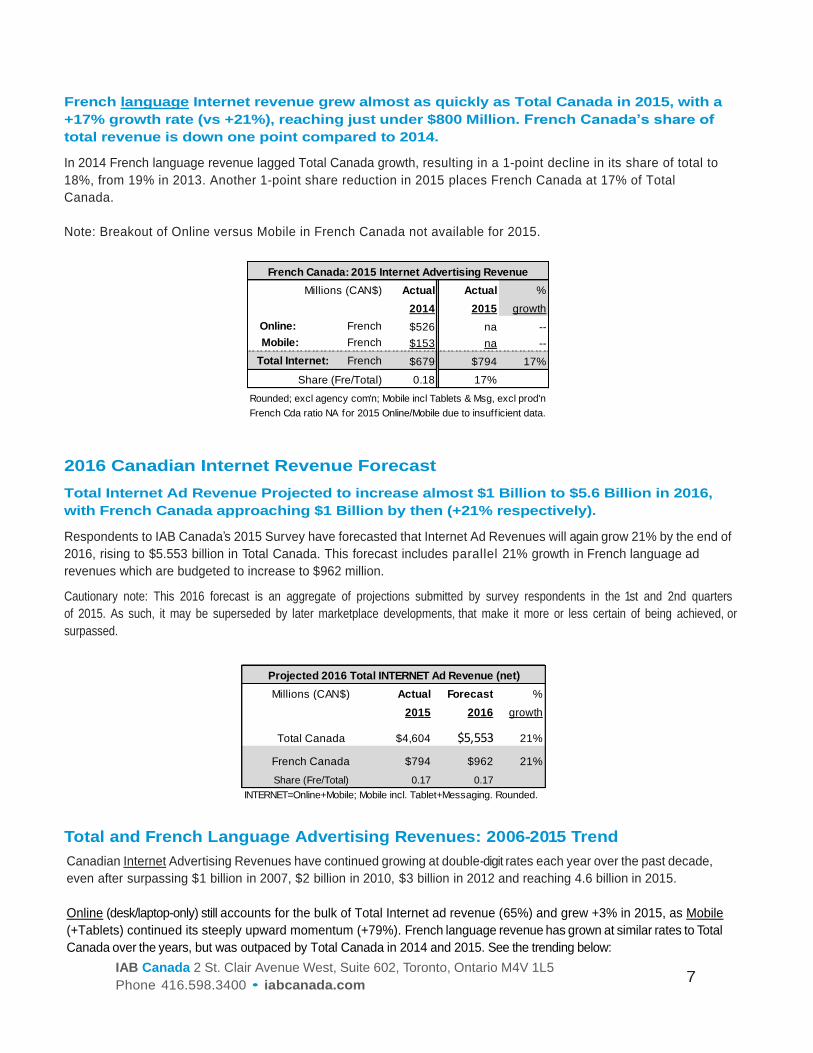
French language Internet revenue grew almost as quickly as Total Canada in 2015, with a
+17% growth rate (vs +21%), reaching just under $800 Million. French Canada’s share of
total revenue is down one point compared to 2014.
In 2014 French language revenue lagged Total Canada growth, resulting in a 1-point decline in its share of total to
18%, from 19% in 2013. Another 1-point share reduction in 2015 places French Canada at 17% of Total
Canada.
Note: Breakout of Online versus Mobile in French Canada not available for 2015.
2016 Canadian Internet Revenue Forecast
Total Internet Ad Revenue Projected to increase almost $1 Billion to $5.6 Billion in 2016,
with French Canada approaching $1 Billion by then (+21% respectively).
Respondents to IAB Canada’s 2015 Survey have forecasted that Internet Ad Revenues will again grow 21% by the end of
2016, rising to $5.553 billion in Total Canada. This forecast includes parallel 21% growth in French language ad
revenues which are budgeted to increase to $962 million.
Cautionary note: This 2016 forecast is an aggregate of projections submitted by survey respondents in the 1st and 2nd quarters
of 2015. As such, it may be superseded by later marketplace developments, that make it more or less certain of being achieved, or
surpassed.
Total and French Language Advertising Revenues: 2006-2015 Trend
Canadian Internet Advertising Revenues have continued growing at double-digit rates each year over the past decade,
even after surpassing $1 billion in 2007, $2 billion in 2010, $3 billion in 2012 and reaching 4.6 billion in 2015.
Online (desk/laptop-only) still accounts for the bulk of Total Internet ad revenue (65%) and grew +3% in 2015, as Mobile
(+Tablets) continued its steeply upward momentum (+79%). French language revenue has grown at similar rates to Total
Canada over the years, but was outpaced by Total Canada in 2014 and 2015. See the trending below:
Millions (CAN$) Actual Actual %
2014 2015 growth
Online: French $526 na --
Mobile: French $153 na --
Total Internet: French $679 $794 17%
Share (Fre/Total) 0.18 17%
Rounded; excl agency com'n; Mobile incl Tablets & Msg, excl prod'n
French Cda ratio NA for 2015 Online/Mobile due to insufficient data.
French Canada: 2015 Internet Advertising Revenue
Millions (CAN$) Actual Forecast %
2015 2016 growth
Total Canada $4,604 $5,553 21%
French Canada $794 $962 21%
Share (Fre/Total) 0.17 0.17
INTERNET=Online+Mobile; Mobile incl. Tablet+Messaging. Rounded.
Projected 2016 Total INTERNET Ad Revenue (net)
IAB Canada 2 St. Clair Avenue West, Suite 602, Toronto, Ontario M4V 1L5
Phone 416.598.3400 • iabcanada.com 8
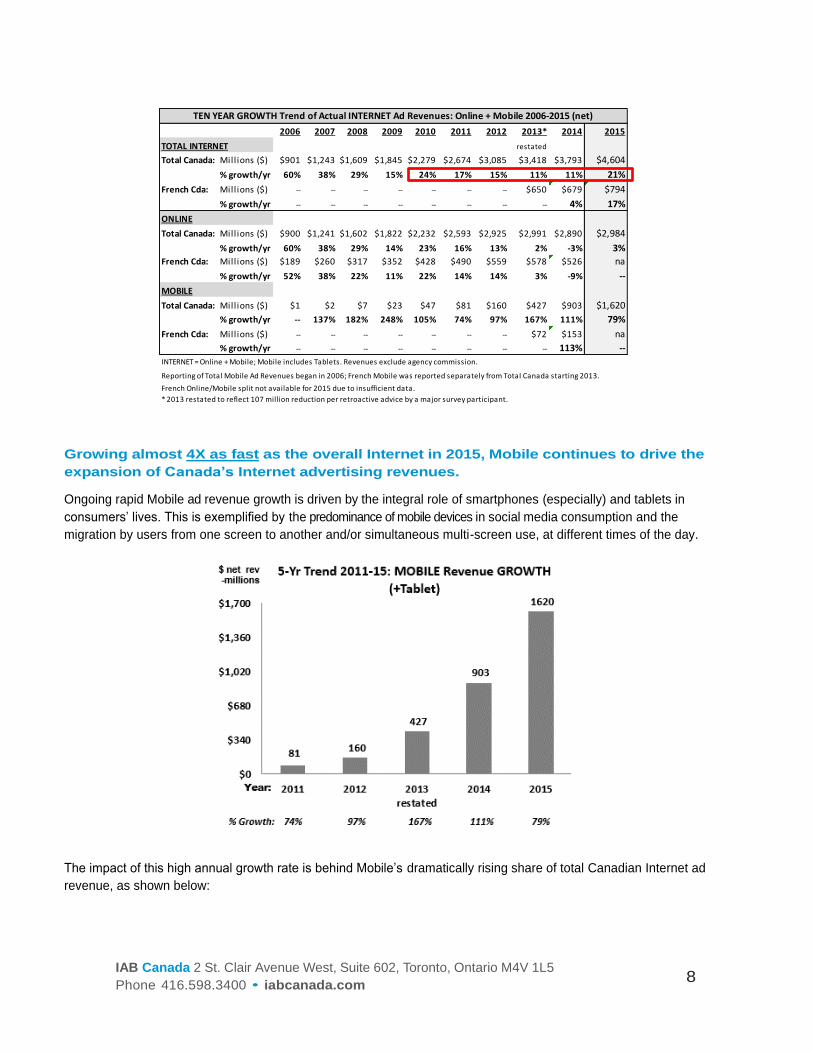
Growing almost 4X as fast as the overall Internet in 2015, Mobile continues to drive the
expansion of Canada’s Internet advertising revenues.
Ongoing rapid Mobile ad revenue growth is driven by the integral role of smartphones (especially) and tablets in
consumers’ lives. This is exemplified by the predominance of mobile devices in social media consumption and the
migration by users from one screen to another and/or simultaneous multi-screen use, at different times of the day.
The impact of this high annual growth rate is behind Mobile’s dramatically rising share of total Canadian Internet ad
revenue, as shown below:
2006 2007 2008 2009 2010 2011 2012 2013* 2014 2015
TOTAL INTERNET restated
Total Canada: Millions ($) $901 $1,243 $1,609 $1,845 $2,279 $2,674 $3,085 $3,418 $3,793 $4,604
% growth/yr 60% 38% 29% 15% 24% 17% 15% 11% 11% 21%
French Cda: Millions ($) -- -- -- -- -- -- -- $650 $679 $794
% growth/yr -- -- -- -- -- -- -- -- 4% 17%
ONLINE
Total Canada: Millions ($) $900 $1,241 $1,602 $1,822 $2,232 $2,593 $2,925 $2,991 $2,890 $2,984
% growth/yr 60% 38% 29% 14% 23% 16% 13% 2% -3% 3%
French Cda: Millions ($) $189 $260 $317 $352 $428 $490 $559 $578 $526 na
% growth/yr 52% 38% 22% 11% 22% 14% 14% 3% -9% --
MOBILE
Total Canada: Millions ($) $1 $2 $7 $23 $47 $81 $160 $427 $903 $1,620
% growth/yr -- 137% 182% 248% 105% 74% 97% 167% 111% 79%
French Cda: Millions ($) -- -- -- -- -- -- -- $72 $153 na
% growth/yr -- -- -- -- -- -- -- -- 113% --
INTERNET = Online + Mobile; Mobile includes Tablets. Revenues exclude agency commission.
Reporting of Total Mobile Ad Revenues began in 2006; French Mobile was reported separately from Total Canada starting 2013.
French Online/Mobile split not available for 2015 due to insufficient data.
* 2013 restated to reflect 107 million reduction per retroactive advice by a major survey participant.
TEN YEAR GROWTH Trend of Actual INTERNET Ad Revenues: Online + Mobile 2006-2015 (net)
IAB Canada 2 St. Clair Avenue West, Suite 602, Toronto, Ontario M4V 1L5
Phone 416.598.3400 • iabcanada.com 9
" It is clear that consumers are moving across media platforms very fluidly. In
2016 and beyond, agile marketers will continue to invest in smart digital
advertising solutions that reflect changing consumer behaviour. This means that
we would expect to see continued growth in expenditure in mobile”. Monika
Federau, SVP & Chief Strategy Officer, Intact Financial Corporation.
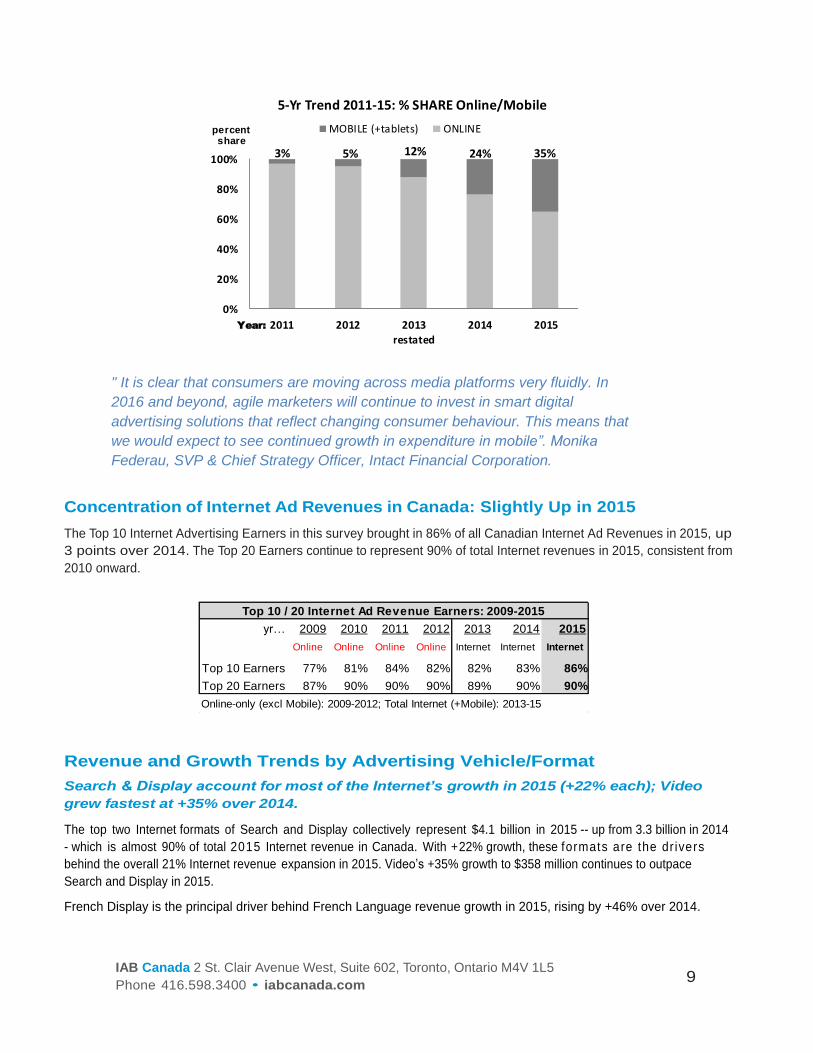
Concentration of Internet Ad Revenues in Canada: Slightly Up in 2015
The Top 10 Internet Advertising Earners in this survey brought in 86% of all Canadian Internet Ad Revenues in 2015, up
3 points over 2014. The Top 20 Earners continue to represent 90% of total Internet revenues in 2015, consistent from
2010 onward.
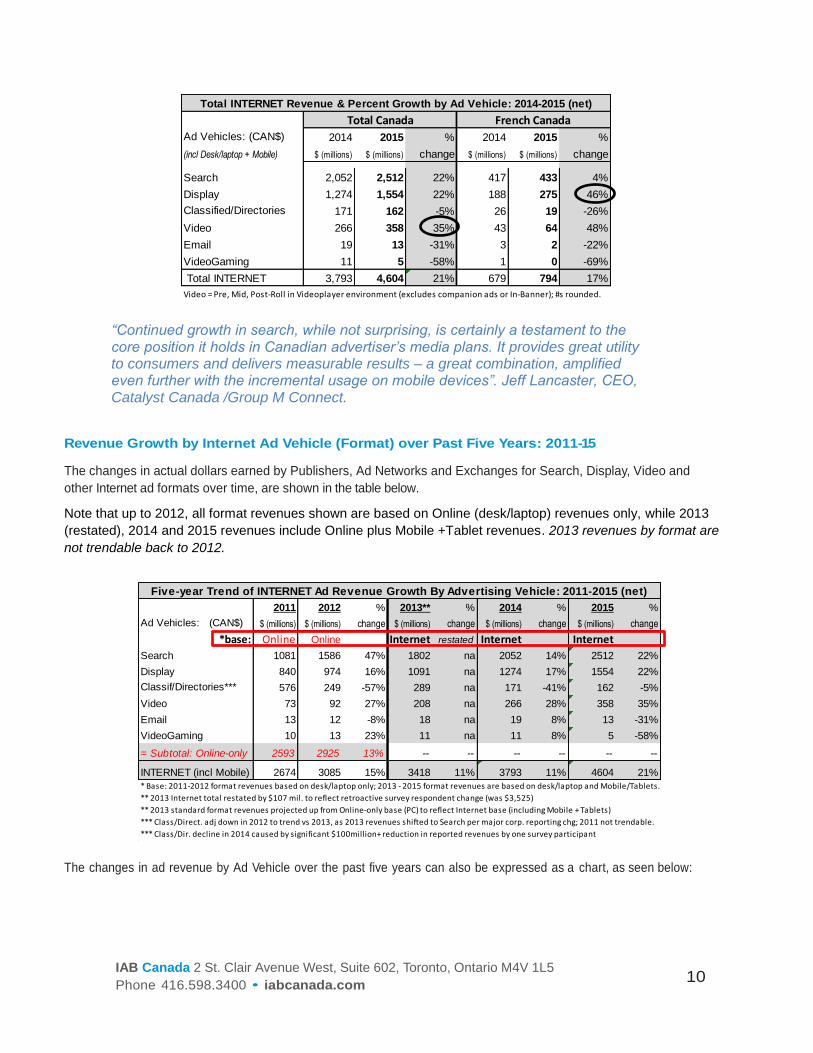
Revenue and Growth Trends by Advertising Vehicle/Format
Search & Display account for most of the Internet’s growth in 2015 (+22% each); Video
grew fastest at +35% over 2014.
The top two Internet formats of Search and Display collectively represent $4.1 billion in 2015 -- up from 3.3 billion in 2014
- which is almost 90% of total 2015 Internet revenue in Canada. With +22% growth, these formats are the dr ivers
behind the overall 21% Internet revenue expansion in 2015. Video’s +35% growth to $358 million continues to outpace
Search and Display in 2015.
French Display is the principal driver behind French Language revenue growth in 2015, rising by +46% over 2014.
3% 5% 12% 24% 35%
0%
20%
40%
60%
80%
100%
2011 2012 2013restated
2014 2015
5-Yr Trend 2011-15: % SHARE Online/Mobile
MOBILE (+tablets) ONLINEpercentshare
Year:
yr… 2009 2010 2011 2012 2013 2014 2015
Online Online Online Online Internet Internet Internet
Top 10 Earners 77% 81% 84% 82% 82% 83% 86%
Top 20 Earners 87% 90% 90% 90% 89% 90% 90%
Online-only (excl Mobile): 2009-2012; Total Internet (+Mobile): 2013-15
Top 10 / 20 Internet Ad Revenue Earners: 2009-2015
IAB Canada 2 St. Clair Avenue West, Suite 602, Toronto, Ontario M4V 1L5
Phone 416.598.3400 • iabcanada.com 10
“Continued growth in search, while not surprising, is certainly a testament to the core position it holds in Canadian advertiser’s media plans. It provides great utility to consumers and delivers measurable results – a great combination, amplified even further with the incremental usage on mobile devices”. Jeff Lancaster, CEO, Catalyst Canada /Group M Connect.
Revenue Growth by Internet Ad Vehicle (Format) over Past Five Years: 2011-15
The changes in actual dollars earned by Publishers, Ad Networks and Exchanges for Search, Display, Video and
other Internet ad formats over time, are shown in the table below.
Note that up to 2012, all format revenues shown are based on Online (desk/laptop) revenues only, while 2013
(restated), 2014 and 2015 revenues include Online plus Mobile +Tablet revenues. 2013 revenues by format are
not trendable back to 2012.
The changes in ad revenue by Ad Vehicle over the past five years can also be expressed as a chart, as seen below:
Ad Vehicles: (CAN$) 2014 2015 % 2014 2015 %
(incl Desk/laptop + Mobile) $ (millions) $ (millions) change $ (millions) $ (millions) change
Search 2,052 2,512 22% 417 433 4%
Display 1,274 1,554 22% 188 275 46%
Classified/Directories 171 162 -5% 26 19 -26%
Video 266 358 35% 43 64 48%
Email 19 13 -31% 3 2 -22%
VideoGaming 11 5 -58% 1 0 -69%
Total INTERNET 3,793 4,604 21% 679 794 17%
Video = Pre, Mid, Post-Roll in Videoplayer environment (excludes companion ads or In-Banner); #s rounded.
Total INTERNET Revenue & Percent Growth by Ad Vehicle: 2014-2015 (net)
Total Canada French Canada
2011 2012 % 2013** % 2014 % 2015 %
Ad Vehicles: (CAN$) $ (millions) $ (millions) change $ (millions) change $ (millions) change $ (millions) change
*base: Online Online Internet restated Internet Internet
Search 1081 1586 47% 1802 na 2052 14% 2512 22%
Display 840 974 16% 1091 na 1274 17% 1554 22%
Classif/Directories*** 576 249 -57% 289 na 171 -41% 162 -5%
Video 73 92 27% 208 na 266 28% 358 35%
Email 13 12 -8% 18 na 19 8% 13 -31%
VideoGaming 10 13 23% 11 na 11 8% 5 -58%
= Subtotal: Online-only 2593 2925 13% -- -- -- -- -- --
INTERNET (incl Mobile) 2674 3085 15% 3418 11% 3793 11% 4604 21%
* Base: 2011-2012 format revenues based on desk/laptop only; 2013 - 2015 format revenues are based on desk/laptop and Mobile/Tablets.
** 2013 Internet total restated by $107 mil. to reflect retroactive survey respondent change (was $3,525)
** 2013 standard format revenues projected up from Online-only base (PC) to reflect Internet base (including Mobile + Tablets)
*** Class/Direct. adj down in 2012 to trend vs 2013, as 2013 revenues shifted to Search per major corp. reporting chg; 2011 not trendable.
*** Class/Dir. decline in 2014 caused by significant $100million+ reduction in reported revenues by one survey participant
Five-year Trend of INTERNET Ad Revenue Growth By Advertising Vehicle: 2011-2015 (net)
IAB Canada 2 St. Clair Avenue West, Suite 602, Toronto, Ontario M4V 1L5
Phone 416.598.3400 • iabcanada.com 11
“With the rapid increase in online video ad spend, savvy marketers are
strategically assembling the right combination of online video solutions to reach
their audiences. By accessing premium inventory, targeting consumers through
different content categories and having a mobile presence, marketers can make
a greater impact with their online video spend”. Eric Morris, Chair, Board of
Directors for IAB Canada.
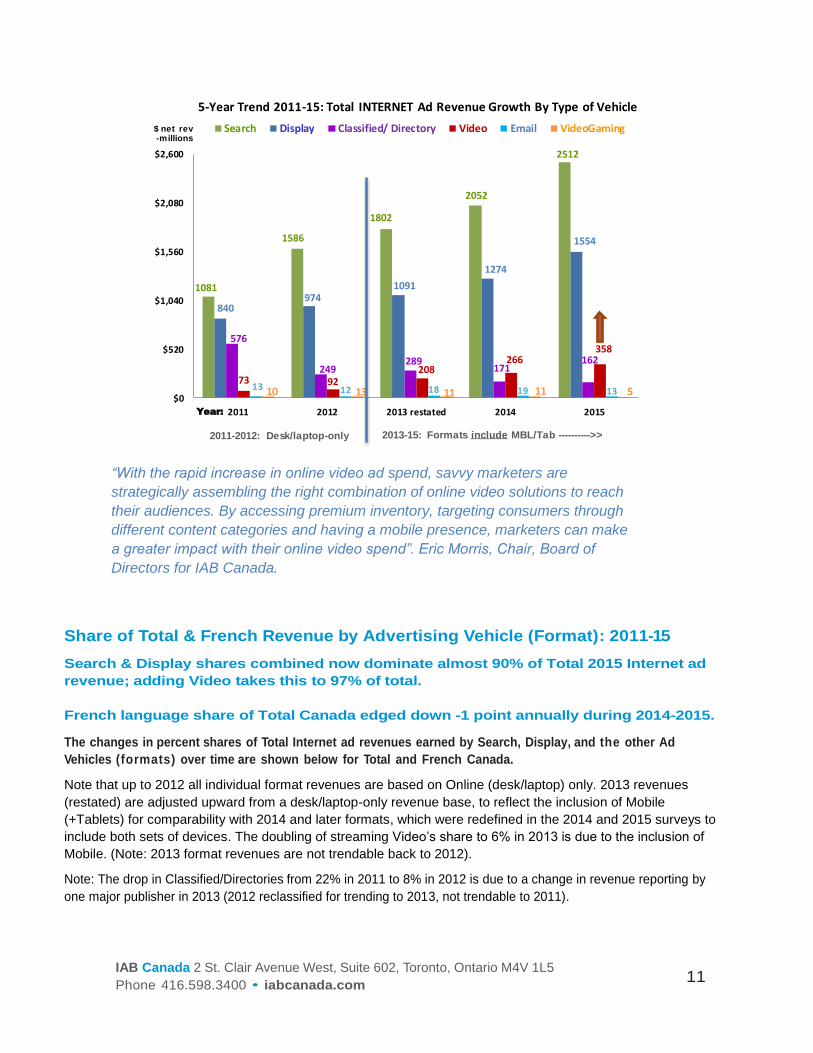
Share of Total & French Revenue by Advertising Vehicle (Format): 2011-15
Search & Display shares combined now dominate almost 90% of Total 2015 Internet ad
revenue; adding Video takes this to 97% of total.
French language share of Total Canada edged down -1 point annually during 2014-2015.
The changes in percent shares of Total Internet ad revenues earned by Search, Display, and the other Ad
Vehicles (formats) over time are shown below for Total and French Canada.
Note that up to 2012 all individual format revenues are based on Online (desk/laptop) only. 2013 revenues
(restated) are adjusted upward from a desk/laptop-only revenue base, to reflect the inclusion of Mobile
(+Tablets) for comparability with 2014 and later formats, which were redefined in the 2014 and 2015 surveys to
include both sets of devices. The doubling of streaming Video’s share to 6% in 2013 is due to the inclusion of
Mobile. (Note: 2013 format revenues are not trendable back to 2012).
Note: The drop in Classified/Directories from 22% in 2011 to 8% in 2012 is due to a change in revenue reporting by
one major publisher in 2013 (2012 reclassified for trending to 2013, not trendable to 2011).
1081
1586
1802
2052
2512
840974
1091
1274
1554
576
249289
171162
73 92208
266358
13 12 18 19 13$0
$520
$1,040
$1,560
$2,080
$2,600
2011 2012 2013 restated 2014 2015
Search Display Classified/ Directory Video Email VideoGaming$ net rev -millions
Year:
5-Year Trend 2011-15: Total INTERNET Ad Revenue Growth By Type of Vehicle
511111310
2013-15: Formats include MBL/Tab ---------->>2011-2012: Desk/laptop-only
IAB Canada 2 St. Clair Avenue West, Suite 602, Toronto, Ontario M4V 1L5
Phone 416.598.3400 • iabcanada.com 12
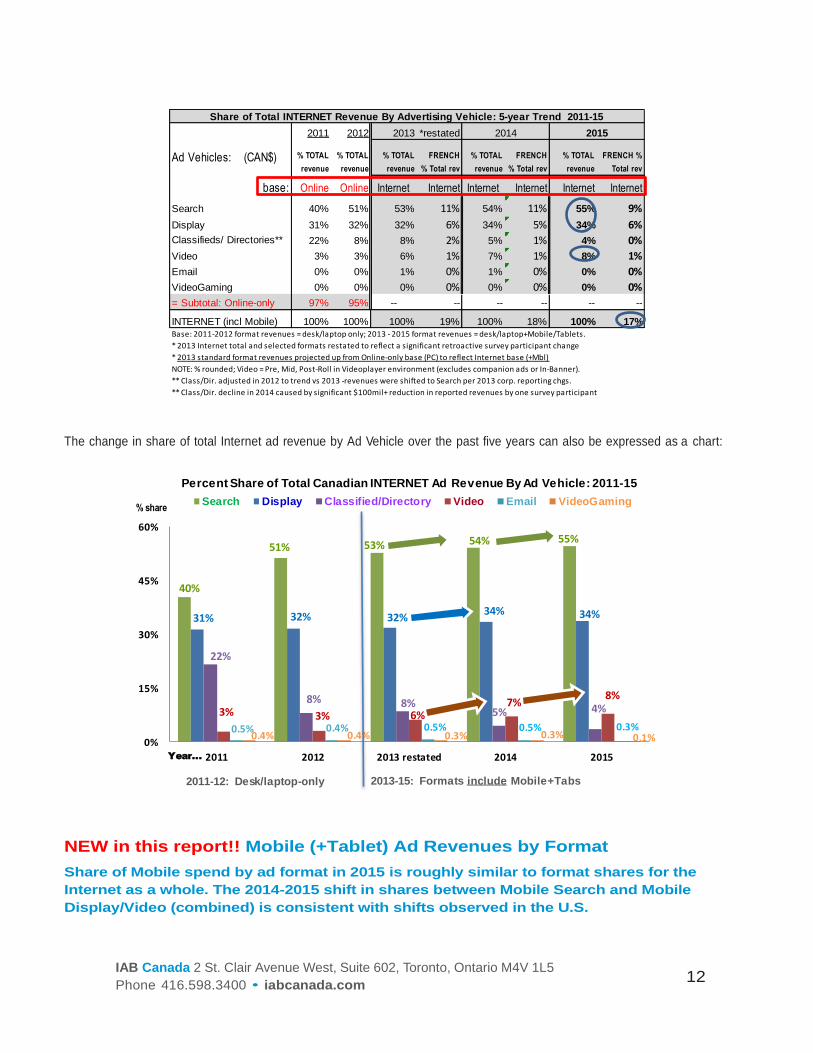
The change in share of total Internet ad revenue by Ad Vehicle over the past five years can also be expressed as a chart:
NEW in this report!! Mobile (+Tablet) Ad Revenues by Format
Share of Mobile spend by ad format in 2015 is roughly similar to format shares for the
Internet as a whole. The 2014-2015 shift in shares between Mobile Search and Mobile
Display/Video (combined) is consistent with shifts observed in the U.S.
2011 2012 2013 *restated
Ad Vehicles: (CAN$) % TOTAL
revenue
% TOTAL
revenue
% TOTAL
revenue
FRENCH
% Total rev
% TOTAL
revenue
FRENCH
% Total rev
% TOTAL
revenue
FRENCH %
Total rev
base: Online Online Internet Internet Internet Internet Internet Internet
Search 40% 51% 53% 11% 54% 11% 55% 9%
Display 31% 32% 32% 6% 34% 5% 34% 6%
Classifieds/ Directories** 22% 8% 8% 2% 5% 1% 4% 0%
Video 3% 3% 6% 1% 7% 1% 8% 1%
Email 0% 0% 1% 0% 1% 0% 0% 0%
VideoGaming 0% 0% 0% 0% 0% 0% 0% 0%
= Subtotal: Online-only 97% 95% -- -- -- -- -- --
INTERNET (incl Mobile) 100% 100% 100% 19% 100% 18% 100% 17%Base: 2011-2012 format revenues = desk/laptop only; 2013 - 2015 format revenues = desk/laptop+Mobile/Tablets.
* 2013 Internet total and selected formats restated to reflect a significant retroactive survey participant change
* 2013 standard format revenues projected up from Online-only base (PC) to reflect Internet base (+Mbl)
NOTE: % rounded; Video = Pre, Mid, Post-Roll in Videoplayer environment (excludes companion ads or In-Banner).
** Class/Dir. adjusted in 2012 to trend vs 2013 -revenues were shifted to Search per 2013 corp. reporting chgs.
** Class/Dir. decline in 2014 caused by significant $100mil+ reduction in reported revenues by one survey participant
20152014
Share of Total INTERNET Revenue By Advertising Vehicle: 5-year Trend 2011-15
40%
51% 53% 54% 55%
31% 32% 32%34% 34%
22%
8% 8%5% 4%3% 3% 6%
7%8%
0.5% 0.4%0.4% 0.3% 0.3% 0.1%0%
15%
30%
45%
60%
2011 2012 2013 restated 2014 2015
Search Display Classified/Directory Video Email VideoGaming
Percent Share of Total Canadian INTERNET Ad Revenue By Ad Vehicle: 2011-15
% share
Year...
0.5% 0.5% 0.3%0.4%
2011-12: Desk/laptop-only 2013-15: Formats include Mobile+Tabs
IAB Canada 2 St. Clair Avenue West, Suite 602, Toronto, Ontario M4V 1L5
Phone 416.598.3400 • iabcanada.com 13
Mobile Search generated 54% of total 2015 Mobile revenues in Canada, followed by 39% for Mobile Display and 7%
for Streaming Video. Mobile Search also accounted for over two-thirds (69%) of all growth experienced by Total
Internet Search in 2015 (Mobile Search: +$317 million; Total Search: +$460 million). Mobile Search revenue grew
+57% in 2015 over 2014, but because Mobile as a whole rose by +79%, Search’s share of Mobile declined from 62%
in 2014 to 54% in 2015.
Mobile Display + Video revenue combined grew 116%, far exceeding the overall Mobile revenue growth rate in 2015
(+79%) as well as that of Mobile Search (57%). As a result, its combined share of Mobile revenues moved up to 45%
from 38% in 2014. NOTE: Mobile Display + Video’s combined dollar increase (+$396 million) generated all 2015
growth for Total Internet Display + Video combined. In fact, it slightly exceeded overall combined Display + Video
growth (+$372 million), as Mobile attracted some desk/laptop revenues. Mobile Video revenues were not collected
separately in 2014.
“IAB Canada’s Annual Internet Advertising Revenue Report sheds light on the
growing fragmentation in how Canadians consume media. Consumers aren’t
limiting their consumption of specific content to specific screens - they’re screen
agnostic. The savviest marketers are taking note and are investing more in
mobile and in online video”. Eric Morris, Chair, Board of Directors for IAB
Canada.
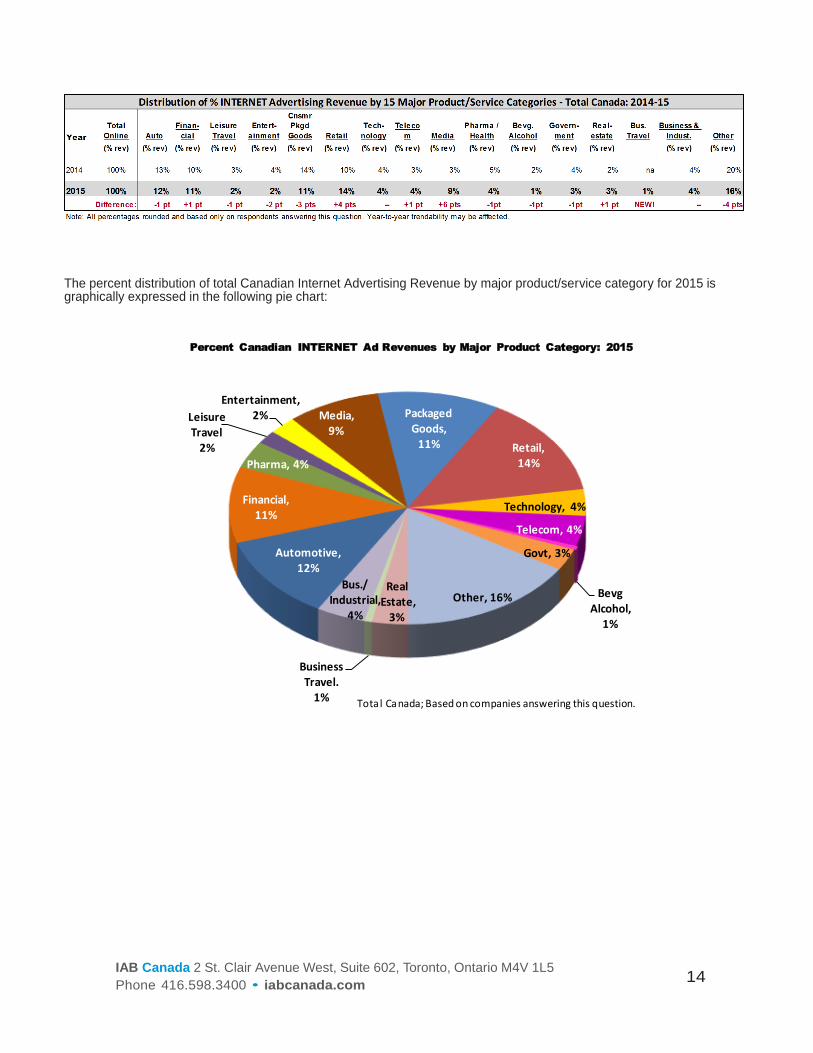
Percent of Internet Revenue by Advertising Category: Total Canada 2014-15
Almost half of 2015 Internet ad revenue continues to be generated by four Ad Categories - led by Retail
(14%), then Auto (12%) followed by CPG / Financial (11%).
Media, now the fifth largest category moved up 6 share points to 9% in 2015.
CPG, Automotive, Retail and Financial continue to be the four largest advertising revenue categories in 2015, with a combined
48% of total Canadian Internet ad revenue coming from these sectors. With the exception of the Media vertical (+6), fluctuations
from last year are as usual very small, in the +/- 1-4 percentage points range. See below:
Mobile (+Tablet)
Ad Vehicles (CAN$) 2014 % Total Mbl 2015 % Total Mbl
$ (millions) revenue $ (millions) revenue Revenue: % Chge
Mobile Search 556 62% 873 54% Growth: +57%
Mobile Display* 341 38% 631 39%
Mobile Video NEW -- -- 106 7%
Display+ Video 341 38% 737 45% Growth: +116%
Mobile - Other** 6 1% 10 1%
Total MOBILE 903 100% 1,620 100% Growth: +79%
* Mobile Display: 2014 includes Streaming Video; 2015 excludes Video
* *Mobile-Other = Performance + Messaging; Rounded to nearest whole integer.
Total Canada
MOBILE Advertising Revenue by Ad Vehicle: 2014-15 (net)
IAB Canada 2 St. Clair Avenue West, Suite 602, Toronto, Ontario M4V 1L5
Phone 416.598.3400 • iabcanada.com 14
The percent distribution of total Canadian Internet Advertising Revenue by major product/service category for 2015 is graphically expressed in the following pie chart:
Automotive, 12%
Financial, 11%
Pharma, 4%
Leisure Travel
2%
Entertainment,2% Media,
9%
Packaged Goods,
11% Retail, 14%
Technology, 4%
Telecom, 4%
Bevg Alcohol,
1%
Govt, 3%
Other, 16%Real
Estate, 3%
Business Travel.
1%
Bus./ Industrial,
4%
Percent Canadian INTERNET Ad Revenues by Major Product Category: 2015
Total Canada; Based on companies answering this question.
IAB Canada 2 St. Clair Avenue West, Suite 602, Toronto, Ontario M4V 1L5
Phone 416.598.3400 • iabcanada.com 15
C. APPENDIX: Background, Survey Scope and Methodology
Background: About IAB Canada’s 2015-16 Canadian Internet Advertising Revenue Report
First commissioned in 1998 by the Interactive Advertising Bureau of Canada (IAB), this marks the 18th consecutive year
that Canadian Internet Advertising Revenues are being reported and the 10th consecutive year reporting Mobile ad
format revenues (which also include Tablets).
The results of IAB Canada’s Annual Canadian Internet (Online & Mobile) Advertising Revenue Surveys are widely
considered the most accurate measurement of Canadian Interactive advertising revenues. The data is compiled directly from
information supplied by Canadian Publishers who sell advertising on Canadian Websites, Online/Mobile Ad Networks
and Exchanges who sell advertising on both the Canadian and U.S. Websites they represent to reach Canadians, leading
Mobile Carriers, Mobile Aggregators, Mobile Marketing companies and Publishers offering Mobile advertising solutions
(including Mobile Search advertising). It should be noted that EY (formerly known as Ernst & Young), does not formally audit the information supplied by participants in
their Survey responses, and provides no opinion or other form of assurance with respect to the information submitted.
Results of individual respondent submissions are held in strict confidence by EY and are released in aggregate form only,
so as to maintain individual participant confidentiality.
The technical summary that follows in this appendix contains basic Survey Methodology and the Definitions of the various
Online/Mobile Advertising Vehicles (Ad Formats) and Advertiser product/service categories reported on.
Martin Lundie
Canadian Media and Technology Leader
Ernst & Young LLP
Survey Scope
The Canadian Internet Advertising Revenue Report is a big part of IAB Canada’s ongoing mission to provide an accurate
barometer of Digital advertising growth in Canada.
IAB Canada has retained EY to jointly establish, maintain and continuously update comprehensive Survey standards for
measuring the growth of Online and Mobile advertising revenues in Canada.
To achieve and sustain industry-wide acceptance, key aspects of IAB Canada’s Annual Canadian Internet Advertising
Revenue Surveys include: • Making the Survey as inclusive as possible, encompassing direct data results from Canadian Internet Publishers who
sell advertising on Canadian Websites, Online/Mobile Ad Networks and Exchanges who sell advertising on both
the Canadian and U.S. Websites they represent to reach Canadians, leading Mobile Carriers, Mobile Aggregators,
Mobile Marketing companies and Publishers offering Mobile advertising solutions (including Mobile Search
advertising). • Ensuring and maintaining a confidential process, both in terms of methodology, and in terms of releasing only
aggregate data; and, • Analyzing historical data from within the Survey, to identify broader trends over time.
IAB Canada 2 St. Clair Avenue West, Suite 602, Toronto, Ontario M4V 1L5
Phone 416.598.3400 • iabcanada.com 16
Survey Methodology
EY and IAB Canada work jointly to: • Compile a database of potential revenue earners to survey annually, in relation to Online and Mobile advertising revenues,
in both the Total and French Canada markets; • Conduct an annual quantitative, web-served (i.e. online) Survey with the above industry players; note that Publisher
surveys previous to 2013 were conducted through the mail (Canada Post) • Acquire supplemental data through the use of publicly-disclosed information.
• Request and compile several specific data items from digital media vendors:
These include total annual Gross commissionable Advertising Revenue if applicable, and total annual Net Advertising
Revenue. Net Revenue is calculated by subtracting the following from the Gross figure: (a) Agency commissions, (b)
Publisher Revenues derived from Ad Networks and Exchanges (c) Ad Network/Exchange Revenues derived from
other Ad Networks/Exchanges, (d) Mobile Carrier fees (as applicable).
Annual Net In te rne t Revenues are requested to be broken down by Advertising Vehicle (i.e. Display, Search,
Classified, Video etc) along with a percentage breakdown for each Vehicle based on English and French Canada.
Annual Net Mobile (+Tablet) Revenues are also requested separately, to be broken down by Advertising Vehicle.
Percentage breakdown of Annual Net Revenues is also requested across sixteen (16) different Advertiser product/service
categories that sum back to 100% of the Net Revenue reported by respondents answering this question; examples include
Automotive, Financial, Technology, etc. • Identify incomplete responses from actual respondent returns and apply a conservative revenue estimate for missing answers.
• Identify non-participating revenue earners, and apply a conservative revenue estimate for these companies, based on
available public sources. • Report the aggregate findings of the Survey, and report key trends within the Survey responses.
Confidentiality Procedure
All the information submitted by respondents within IAB Canada’s annual Canadian Internet Advertising Revenue Surveys
is completely confidential, due to the “double-blind” data collection methodology that is rigorously employed by
IAB Canada and EY. IAB Canada’s role is simply to …
(a) Identify industry participants who sell Internet advertising;
(b) Assign a unique, non-identifying, anonymous, alpha-numeric code to potential Survey participants;
(c) Send out Survey invitations by email to these potential participants, including (a) a non-traceable generic link to access
the survey and (b) a confidential anonymous code that is unique to each media seller, in order to log-in to the survey.
(d) Report on the results of the Survey, as tabulated and reported in aggregate by EY.
IAB Canada 2 St. Clair Avenue West, Suite 602, Toronto, Ontario M4V 1L5
Phone 416.598.3400 • iabcanada.com 17
Double-Blind Methodology
I. Internet Publishers/Ad Networks/Exchanges/Mobile aggregators etc to be surveyed are derived from IAB
Canada Member lists, from comScore’’s AdFocus list (a list of Web properties selling digital advertising in Canada)
and from members of the IAB Revenue Methodology Committee. II. Each Internet Publisher/Ad Network/Exchange/Mobile aggregator etc selected for surveying is assigned a unique alpha-
numeric code that only the IAB Canada President and Research Director are aware of, and sent a Survey invitation by
email, containing a non-traceable generic link to the survey and unique alpha-numeric codes for each participant to log-in. III. Once completed by a respondent, the secure online survey platform automatically sends notification of this to EY
and IAB Canada (no data). The data from each completed survey is aggregated in the online survey system
database, with access restricted to Martin Lundie, EY.
IV. Once all the Surveys are in, the responses are averaged and extrapolated by segment - by EY - to the total
Canadian Internet advertising market. NOTE: Respondent data cannot be traced back to its origin. V. Aggregated Canadian market totals are sent to the IAB Canada President and Research Director for verification, and
then presented to the IAB Canada Board for final approval. The IAB Board confirms that the Survey methodology is
sound and the tabulations are correct, and votes to approve the publication of the Revenue Survey numbers.
VI. A Report detailing final Survey actuals and respondents’ estimated next year’s Canadian Internet Advertising
Revenues (for both English and French markets) is created. The Report also includes estimates of percent revenues by
Advertising Vehicle (i.e. Display, Search, Mobile, Video, Classifieds, etc.), d e v i c e ( O n l i n e v s M o b i l e ) and
by Advertiser Category (Automotive, Financial, Technology, etc.).
Industry Survey and Report Guidance Provided to IAB Canada
Internet Revenue Methodology Committee
This specially-convened member committee, representing a cross-section of Canada’s leading Internet ad revenue
earners (as defined earlier in this document), as well as selected ad agencies with trading desks, was created to
recommend and oversee updates to IAB Canada’s Annual Canadian Internet Advertising Revenue Survey distribution
lists and questionnaire design, when/as needed, in response to changing conditions within the Canadian Internet
advertising marketplace.
IAB Canada 2 St. Clair Avenue West, Suite 602, Toronto, Ontario M4V 1L5
Phone 416.598.3400 • iabcanada.com 18
Detailed Definitions of Advertising Vehicles (Formats) and Categories: 2015-16
------------------------------------------------------------------------------------------------------------------------
SECTION A – Definitions of INTERNET Advertising Vehicles (Formats): 2015-16
Includes revenue from ALL Devices (i.e. Desktop/laptop Computer, Mobile and Tablets
EXCLUDES Production, eCommerce
Introduction:
This survey is meant only for companies involved in the SELLING/supply-side of the Internet media advertising
space business.
What We Mean By “NET Revenue”:
To ensure there is NO duplication of reported ad revenues between Publishers, Ad Networks or Exchanges/SSPs
(SSP = supply-side platforms), ONLY report revenues that you earned from DIRECT SALES of your own
advertising inventory or inventory you sold on behalf of a 3rd party. These consist of DIRECT TRANSACTIONS
between your company and the ADVERTISERS themselves and/or their Media AGENCIES and/or their TRADING
DESKS/DSPs. REPORT 100% of any DIRECT SALES revenue you earn. Do NOT subtract the cost-of-sale; i.e.
revenues you paid back to an original (3rd party) vendor for selling their inventory”. (Contact Steve Rosenblum,
Research, with questions: [email protected]).
The INTERNET Advertising Formats:
Standard/Rich Media Display Advertising (CPM, CPE* only) – Advertiser pays an Internet Publisher or Ad
Network/Exchange for space to display the following:
(a) STANDARD - hyper linked text, banner, big‐box, skyscraper, button, or other basic unit (can animate or contain
Flash), on one or more of the Publishers Web pages.
(b) RICH MEDIA - hyper linked banner, bigbox, skyscraper, expanding or floating ad, etc., that contains user
interaction functionality of various types (including the ability to fill out forms, play games, mouse-over areas for
more info, etc.) and/or Video or XML content (e.g. In-Banner Video executions), as opposed to solely animation. All
IAB Rising Stars ad formats are considered Rich Media; so are Interstitials (i.e. full/partial-page server-push ads
appearing in the transition between two pages of content) or overlays (appearing over top of the page). Digital
audio ads that appear before, during or after streaming audio content are also considered rich media.
* Note: CPE = Cost per Engagement
Not included: Video Pre, Mid, Post-roll etc (ie. In-Stream Video) in a Video-player environment should be
entered in the Digital In-Stream Video section - NOT Rich Media.
Sponsorship / Contest / Advertorial Advertising (Flat Fee) – An Advertiser sponsors part or all of a targeted
Internet Publisher Website, usually existing content (e.g., entire Website, site area, an event, etc.). Sponsorships
may contain a Display advertising component (e.g. banners, pre-roll, etc), but are usually negotiated on a flat fee
basis. Contests/Advertorials are custom branded sponsorships created for the Advertiser, and often contain listing
fees, as well as net contest/microsite creation revenue.
Direct Response / Lead Generation Performance Advertising (CPC, CPA*, CPLead only) – Fees Advertisers
pay to Internet Publishers that refer qualified purchase inquiries/potential customers (e.g., auto dealers which pay a
IAB Canada 2 St. Clair Avenue West, Suite 602, Toronto, Ontario M4V 1L5
Phone 416.598.3400 • iabcanada.com 19
fee in exchange for receiving a qualified purchase inquiry over the Internet) or provide consumer information
(demographic, contact, behavioral), where the consumer opts into being contacted by a marketer (email, postal,
telephone, fax). These processes are priced on a performance basis (e.g., cost-per-action, cost-per-lead or cost-
per-inquiry), and can include user applications for service (e.g., applying for credit card, mortgage or insurance),
surveys, contests or registrations. * Note: CPA = Cost per action/acquisition
NOTE - In final report: Display = Standard/Rich Media Display, Sponsorship + Direct Response (sum of
all the above).
Digital In-Stream Video Advertising (CPM, CPV* only) – Pre-, Mid-, Post-Roll TV-like advertisements that may
appear as Video commercials or before, during, and/or after a variety of content, or on a Standalone basis, in an
actual Video-player environment ONLY, including but not limited to streaming Video, animation, gaming, and music
Video content. Video overlays contained within the video-player are also categorized as digital video ads. This
definition includes Digital Video commercials that appear in live, archived and downloadable / streaming content.
NOTE: DO NOT include companion ad revenue or In-Banner ad revenue, unless your Digital Video package is sold
in such a way that you cannot separate the revenue (i.e. please DO NOT record companion ad revenue in both
Video & Display). DO NOT include revenue from Video within in-banner executions (i.e. not in a player) in this
category, as it is covered in the Standard/Rich Media Display Advertising section above.
* Note: CPV = Cost per View
Videogaming / Advergaming Advertising – This can range from an Advertiser buying all the ad units around a
game or a “Sponsored by” link, to creating a custom branded game experience.
Search Advertising – Fees advertisers pay Internet Publishers to list and/or link their company site/domain name
to a specific search word or phrase via paid listings or contextual search.
Search categories include:
- Paid listings – Text links appear at the top, bottom or side of search engine’s results for specific keywords.
The more a marketer pays, the higher the position it gets. Marketers only pay when a user clicks on the text link.
- Contextual search – Text and image ads appear in an article on a Publisher’s site, based on the context of
the content. Marketers only pay when the link is clicked.
Note: EXCLUDES SEO (search engine optimization) techniques, that can be used to make a website ‘search
engine friendly’, in order to improve the site’s ranking in search engine results pages (SERPs).
E-mail – Banner ads, links or advertiser sponsorships that appear in Internet Publisher’s e-mail newsletters, e-mail
marketing campaigns and other commercial e-mail communications. Includes all types of electronic mail (e.g.,
basic text or HTML-enabled).
Classifieds / Auctions – Revenues that Internet Publishers receive to list specific advertiser products or services
(e.g. Internet job boards and employment listings, real estate listings, automotive listings, personals listings,
business to business, auction-based listings and merchandise). NOTE: please DO NOT include e-commerce
revenue.
Directories – Revenues that Internet Publishers receive to list specific advertiser products or services on city sites,
yellow or white pages, etc.
NOTE - In final report: Classifieds / Directories = Classifieds / Auctions + Directories (summed).
IAB Canada 2 St. Clair Avenue West, Suite 602, Toronto, Ontario M4V 1L5
Phone 416.598.3400 • iabcanada.com 20
SECTION B - Definitions of MOBILE Platform Advertising Vehicles (Formats): 2015-16
NOTE – INCLUDES Mobile + Tablets; EXCLUDES Computers (desktop/laptop),
EXCLUDES any Production or eCommerce
Introduction: This survey is meant only for companies involved in the SELLING/supply-side of the Internet media
advertising space business.
Definition of Mobile:
Advertising tailored to and delivered through wireless mobile devices such as smartphones (e.g. iPhone, Android,
Blackberry), feature phones (i.e.. lower-end mobile phones capable of accessing mobile content), and tablets (e.g.
iPad, Samsung Galaxy Tab). Typically taking the form of static or rich media display ads, text messaging ads,
search ads, or audio/video spots, such advertising generally appears within mobile websites (i.e. websites
optimized for viewing on mobile devices), adaptive or responsive sites (i.e. which adjust correctly to fit the screen of
the device it's being served on), mobile apps (i.e. applications for Smartphones or Tablet devices running iOS,
Android, Windows Mobile or other operating systems), text messaging services (i.e. SMS, MMS) or within mobile
search results (i.e., 416 listings, directories, mobile-optimized search engines).
What we mean by “NET’ Revenues”:
To ensure there is NO duplication of reported revenues, ONLY report Mobile (+Tablet) ad revenues that you earned
from DIRECT SALES of your own advertising inventory or inventory you sold on behalf of a 3rd party; i.e. ACTUAL
Insertion Orders issued DIRECTLY to your company by the ADVERTISERS themselves and/or their Media
AGENCIES, and/or their Trading Desks / DSPs. Report 100% of any DIRECT SALES revenue you earn. Do NOT
subtract the cost-of-sale; i.e. revenues you paid back to an original (3rd party) vendor for selling their inventory”.
(Contact Steve Rosenblum, Research Director with any questions, [email protected]).
The 4 Formats that make-up the Mobile (+Tablet) Advertising Platform:
Mobile advertising formats include: ‘Display/Sponsorship’ (banner ads, digital audio, sponsorships, and rich media),
‘Search’, ‘In-Stream Video’ and ‘Other’ advertising served to mobile and tablet devices. Mobile revenues include
Tablets; Tablet revenues include all advertising served on Tablet devices, including Apps & Websites. Production is
excluded in its entirety.
MOBILE PLATFORM FORMAT SPEND = Mobile Display/Sponsorship + Mobile Search + Mobile In-
Stream Video + Mobile Other (i.e. Mobile Messaging + Mobile Performance)
1) Revised!! Mobile DISPLAY/SPONSORSHIP Advertising Revenue (Standard/Rich Media; Sponsored App,
Game, "Push" e.g. location-based etc) – CPM/Flat fee only
Mobile Display/Sponsorship advertising consists of advertising served specifically to mobile devices on Mobile
Optimized sites (e.g. m., .mobi, /mobile), Responsive sites or within Mobile Applications (such as on News and
Weather or within Mobile Games). Please EXCLUDE Production Revenues for the development of Mobile Content
or Mobile-only/Tablet-only Applications, if any.
Here we include all revenues received for: (a) Standard Display ads (Banners; Interstitial or Full-page ads; Mobile
Flyers; etc.); or Sponsorship ads (this includes Sponsored “push” notifications e.g. date, contextual or location-
based notifications; Sponsored Apps, Games, etc. “brought to you by…”). Also included are (b) Rich-media ads (i.e.
IAB Canada 2 St. Clair Avenue West, Suite 602, Toronto, Ontario M4V 1L5
Phone 416.598.3400 • iabcanada.com 21
expandables, take-overs etc., and/or in-banner video executions, as opposed to solely animation). Digital audio is
also included. For a full description of Rich Media, see Section A, page 1.
Included in Mobile Display/Sponsorship Revenue: CPM/Flat Fee revenues only
Not Included: In-Stream Video Advertising in a video-player environment; Mark-up by ad Agencies (gross); Ad
creation/production revenues; End-user data charges.
2) Mobile SEARCH Advertising Revenue
In this category, include all revenues received for Paid Search advertising directed specifically at Mobile devices.
Not Included: Mark-up by ad Agencies (gross); Search Ad creation/production revenues; Search Engine
Optimization (SEO) revenues.
3) NEW!! Mobile IN-STREAM VIDEO Advertising Revenue (Video Pre/Mid/Post-roll etc;) – CPM/CPV only
Mobile Video advertising consists of Video Pre/Mid/Post-roll and Standalone video commercials in a video-player
environment, served specifically to mobile devices on Mobile Optimized sites, Responsive sites or within Mobile
Applications.
Not Included: Mark-up by ad Agencies (gross); Video creation/production revenues; End-user data charges;
Companion ad revenue or In-Banner ad revenue, unless your Digital Video package is sold in such a way that you
cannot separate the revenue (i.e. please DO NOT record companion ad revenue in both Video & Display); Video
revenue from within in-banner executions (i.e. not in a player).
4) Mobile OTHER Advertising Revenue
A. Mobile MESSAGING (SMS, MMS, Bluetooth, IVR) Advertising Revenue
Revenue generated from Mobile advertising/marketing campaigns that promote a product or service via
Messaging delivered to and from short-codes/long-codes. This encompasses standard, zero-rated and
premium-rated Messaging. When counting revenue for Mobile Messaging campaigns, the goal is to calculate the
total amount of money that the brand is spending on the Mobile Messaging campaign, which could include
premium Messaging revenue from consumers that is used to offset these costs.
Included in Mobile Messaging Revenue: Campaign set-up and operating fees; Short code fees; Transactional
fees charged to the brand (Message, hosting and maintenance) or to consumers (premium end-user Message
fees).
Not Included: Mark-up by ad Agencies (gross); Mobile Messaging production revenues; Contest prizing or
redemption charges; Mobile Content (e.g. Ringtones, Wallpapers, etc.).
Note: For Carriers completing the Survey: Please do not count any revenue generated on cross-Carrier Short-
code/long-code programs, as this will be captured by the Mobile marketing providers
B. Mobile PERFORMANCE Advertising Revenue – (e.g. QR codes) – CPC, CPA, CPLead only
Fees Advertisers pay to Digital or Mobile Publishers that are priced on a Mobile performance basis (e.g. cost-
per-click, cost-per-action, cost-per-download, cost-per-lead or cost-per-inquiry), and can include user
applications for service (e.g., applying for credit card, mortgage or insurance), surveys or registrations. They can
also refer to qualified purchase inquiries (e.g. auto dealers which pay a fee in exchange for receiving a qualified
purchase inquiry via Mobile) or provide consumer information (demographic, contact, behavioral), where the
consumer opts into being contacted by a marketer (alerts, SMS, email, postal, telephone, fax).
IAB Canada 2 St. Clair Avenue West, Suite 602, Toronto, Ontario M4V 1L5
Phone 416.598.3400 • iabcanada.com 22
Included In Mobile Performance Revenue: CPC, CPA, CPLead only;
Not Included: Mark-up by ad Agencies (gross); Production revenues;
SECTION C - Definitions of Leading Industry Categories: 2015-16
The product and service categories in IAB Canada’s Internet Advertising Revenue Surveys are consistent with those used
by the U.S. IAB for its Internet Revenue Study. The categories were drawn, with some exceptions, from the North
American Industry Classification System (NAICS), which is an index of types of business establishments with
corresponding descriptions, developed jointly by the U.S, Statistics Canada and Mexico to allow comparability in
business statistics among the North American countries.
Alcoholic Beverages – includes fermented and distilled alcoholic beverages; i.e. Beer/Ale, Wine and Liquor.
Automotive – includes all automotive-related categories including sale/purchase of vehicles and parts and maintenance.
Business & Industrial – products and services, this also includes manufacturing
Consumer Packaged Goods – includes packaged goods, food products, household products, toiletries and tobacco.
Entertainment – includes film, music, TV, box office, video games and amusement & recreation.
Financial Services – includes commercial banks, credit agencies, personal credit institutions, consumer finance companies,
loan companies, business credit institutions and credit card agencies. Also includes companies engaged in the underwriting, purchase, sale or brokerage of securities and other financial contracts.
Government, Social, Political Organizations – includes federal, provincial, and local government departments/agencies
that administer, oversee and manage public programs; social and political organisations including unions and political parties, charities, educational institutions and services.
Leisure Travel – includes travel, hotel, airlines and resorts.
NEW!! Business Travel – includes travel, hotel, airlines and resorts.
Media – includes establishments primarily engaged in radio and television broadcasting (network and station) including
commercial, religious, educational and other radio or television stations. Also includes establishments primarily engaged in publishing newspapers, periodicals and books.
Expanded!! Pharma & Healthcare – includes pharmaceutical and medicine manufacturing of prescription and non-
prescription/ generic and brand drugs/remedies; healthcare and social assistance including offices of health practitioners, home health care services/other ambulatory services, medical/diagnostic laboratories, nursing/residential care facilities, community care facilities for the elderly. Also includes personal care, toiletries and cosmetic products.
Real Estate – includes establishments primarily engaged in managing real estate for others; selling, renting and/or buying
of real estate for others; and appraising real estate.
Expanded!! Retail – includes mail order/catalog and stores for apparel, restaurants/fast food, home furnishings/textiles, toys/
games, pet food/supplies, appliances, jewelry, drug / cosmetics stores, sporting / athletics goods retailers.
Technology – includes hardware (computers, computer storage devices, and computer peripheral equipment), consumer
electronics, prepackaged software (operating, utility and applications programs), local area network systems and network systems integration, computer processing and data preparation and data processing services.
Telecommunications – includes point-to-point communications services, including telephone voice and data
communications, two-way mobile/cellular communications services and other non-vocal message communications services (e.g., cablegram, electronic mail and facsimile); includes multi-channel video providers on a subscription fee basis (e.g., cable television, wireless cable television and direct broadcast satellite services) including ISPs.
IAB Canada 2 St. Clair Avenue West, Suite 602, Toronto, Ontario M4V 1L5
Phone 416.598.3400 • iabcanada.com 23
About IAB Canada
Who We Are
The Interactive Advertising Bureau of Canada (IAB Canada) is the national voice and thought leader of the
Canadian interactive marketing and advertising industry. We are the only trade association exclusively dedicated to
the development and promotion of the digital marketing and advertising sector in Canada.
As a not-for-profit association, IAB Canada represents over 250 of Canada’s most well-known and respected
advertisers, ad agencies, media companies, service providers, educational institutions and government
associations. Our members represent a diverse range of stakeholders in the rapidly growing Canadian digital
marketing and advertising sector, and include numerous small and medium sized enterprises.
What We Do
As the only organization fully-dedicated to the development and promotion of digital/interactive advertising in
Canada, IAB Canada works with its members to:
Conduct original, Canadian digital/interactive research;
Establish and promote digital/interactive advertising standards & best practices;
Build human capital, through educational courses, certification, our job board, and other initiatives that assist
the industry in attracting, training and motivating human resources;
Act as an advocate for the Canadian digital/interactive advertising industry to the Canadian government; and,
Organize networking events that enhance communication between members.
IAB Canada & IAB US
IAB Canada is an independently-organized and operated organization, and is neither owned, controlled nor operated
by the Interactive Advertising Bureau, Inc. (USA), and all trademarks and names are used under license.
IAB Canada and IAB US work together closely on major projects and endeavours, but both require individual
memberships. View the Global IAB list as well as our synopsis of IAB US guidelines that IAB Canada fully endorses.
Have a Question about IAB Canada’s Annual Internet Advertising Revenue Survey?
Please don’t hesitate to Contact Us!


![Online Advertising · [PWC, Internet Advertising Bureau, April 2013] Higher revenue in USA than cable TV and nearly the same as broadcast TV [PWC, Internet Advertising Bureau, Oct](https://static.fdocuments.us/doc/165x107/5c165fa809d3f28f1e8c60f2/online-advertising-pwc-internet-advertising-bureau-april-2013-higher-revenue.jpg)