
Interactions cations - argiles : le cas du Fe(II). Application au ...
211
HAL Id: tel-00710111 https://tel.archives-ouvertes.fr/tel-00710111 Submitted on 20 Jun 2012 HAL is a multi-disciplinary open access archive for the deposit and dissemination of sci- entific research documents, whether they are pub- lished or not. The documents may come from teaching and research institutions in France or abroad, or from public or private research centers. L’archive ouverte pluridisciplinaire HAL, est destinée au dépôt et à la diffusion de documents scientifiques de niveau recherche, publiés ou non, émanant des établissements d’enseignement et de recherche français ou étrangers, des laboratoires publics ou privés. Interactions cations - argiles : le cas du Fe(II). Application au contexte de stockage profond des déchets radioactifs Christophe Tournassat To cite this version: Christophe Tournassat. Interactions cations - argiles : le cas du Fe(II). Application au contexte de stockage profond des déchets radioactifs. Ingénierie de l’environnement. Université Joseph-Fourier - Grenoble I, 2003. Français. <tel-00710111>
Transcript of Interactions cations - argiles : le cas du Fe(II). Application au ...
HAL Id: tel-00710111https://tel.archives-ouvertes.fr/tel-00710111
Submitted on 20 Jun 2012
HAL is a multi-disciplinary open accessarchive for the deposit and dissemination of sci-entific research documents, whether they are pub-lished or not. The documents may come fromteaching and research institutions in France orabroad, or from public or private research centers.
L’archive ouverte pluridisciplinaire HAL, estdestinée au dépôt et à la diffusion de documentsscientifiques de niveau recherche, publiés ou non,émanant des établissements d’enseignement et derecherche français ou étrangers, des laboratoirespublics ou privés.
Interactions cations - argiles : le cas du Fe(II).Application au contexte de stockage profond des déchets
radioactifsChristophe Tournassat
To cite this version:Christophe Tournassat. Interactions cations - argiles : le cas du Fe(II). Application au contexte destockage profond des déchets radioactifs. Ingénierie de l’environnement. Université Joseph-Fourier -Grenoble I, 2003. Français. <tel-00710111>

OBSERVATOIRE DE GRENOBLEet
LABORATOIRE DE GEOPHYSIQUE INTERNE ET TECTONOPHYSYQUE
THESEprésentée par
Christophe Tournassat
pour obtenir le titre deDocteur de l'Université Joseph Fourier - Grenoble I
Spécialité : Géochimie environnementale
Interactions cations – argiles : le cas du Fe(II).
Application au contexte de stockage profond des déchets radioactifs
Cations – clays interactions: the Fe(II) case.
Application to the problematic of the French deep nuclear repository field concept
7 juillet 2003
Composition du jury :
Murray B. McBride rapporteur Pr, Cornell University, Ithaca, New York, USA
Kastriott Spahiu rapporteur Dr, Research Coordinator, SKB, Stockholm, Suède
Marc Fontecave examinateur, président du jury Pr, CEA Grenoble, France.
Eric Simoni examinateur Pr, Université Paris XI, Orsay, France
Nicolas Michau examinateur, encadrant ANDRA Dr, ANDRA, Châtenay-Malabry, France
Laurent Charlet examinateur, directeur de thèse Pr, Université Joseph Fourier Grenoble-I, France
REMERCIEMENTS
Voici chronologiquement le dernier chapitre de la thèse et peut-être le plus difficileà écrire. J’espère n’oublier personne.
La première personne que je tiens à remercier est tout naturellement mon directeurde thèse, Laurent Charlet. Merci Laurent donc, pour ces trois ans de travail commun. Laliberté et la confiance que tu m’as accordées m’ont permis de réaliser cette thèse dans lesmeilleures conditions. Tu as toujours su m’aiguiller vers des directions de recherchefructueuses sans rien m’imposer : je ne compte plus le nombre de tes idées dont je me suisfinalement accaparé. Malgré ton emploi du temps (sur)chargé, c’est toujours avec bonnehumeur que tu m’as accueilli dans ton bureau même si souvent, tu savais que, quand jeressortirai, tu aurais les bras chargés d’un nouveau travail pour la nuit ou pour le week-end(Pardon Barbara, Alvaro et Anaïs, pour ce temps que je vous ai volé ces derniers mois).
Nicolas Michau m’a encadré au niveau de l’ANDRA tout au long de ces trois années.Merci Nicolas pour m’avoir accueilli et introduit au sein de l’agence, et pour ton soutienindéfectible quand il s’agissait de m’envoyer aux quatre coins de la France et de l’Europe. Atravers toi, c’est également l’ANDRA que je remercie pour les très bonnes conditions detravail que l’agence m’a offertes.
Le Professeur Murray McBride a accepté d’être rapporteur de cette thèse. C’est unhonneur et un immense plaisir personnel d’avoir été évalué par un grand nom de la géochimieenvironnementale. Thank you Murray for your corrections and pertinent remarks on thiswork. Dr Kastriot Spahiu a également accepté d’être rapporteur de cette thèse. J’aibeaucoup apprécié les corrections très détaillées sur le fond scientifique mais égalementsur la forme qu’il m’a fait parvenir. Je tiens également à le remercier pour le soutien qu’il aaccordé à ce projet qui, peut-être, n’aurait pas vu le jour sans lui. Tack, Dr Kastriot Spahiu,för att du stött detta projekt och gått med på att vara opponent. Les Professeurs MarcFontecave et Eric Simoni ont jugé ce travail en tant qu’examinateurs. Je les en remercievivement.
Ce travail n’aurait pas été aussi riche sans les nombreuses collaborations dont il abénéficié. Dirk Bosbach m’a toujours accueilli chaleureusement à l’INE Karlsruhe pour mefaire profiter de son AFM et de la bière locale. Ses étudiants Heike et Felix ontgrandement participé au bon déroulement de mes séjours. Dirk, Heike und Felix, Danke fürdie schöne Zeit bei euch. Tony Appelo m’a appris toutes les arcanes du logiciel Phreeqc etas toujours été là pour répondre chaleureusement à mes questions sur la modélisation.Bedankt voor jouw hulp, Tony. Au cours des derniers six mois de thèse, Jean-MarcGreneche s’est incroyablement impliqué dans ce travail. Merci Jean-Marc pour taréactivité record et tes superbes spectres Mössbauer. Ces expériences au Mans n’auraientpas été possibles sans Jean-Pierre Jolivet. Je l’en remercie donc vivement. FrédéricVilliéras m’a fait connaître le Groupe Français des Argiles et m’a beaucoup aidé dans la

promotion de certains résultats. Merci, Frédéric pour ces échanges fructueux et toujoursagréables. Yves Chapron m’a fait découvrir la dynamique moléculaire. Yves, je ne désespèrepas de m’y impliquer un jour plus complètement. Outre la bonne humeur qu’il distille dans lelabo, Eric Ferrage m’a initié aux joies de l’infrarouge et m’a permis ainsi d’éviter bien desécueils. Christiane Poinsignon a complété cette formation en m’apportant une touche desavoir-faire expérimental. Merci à vous deux. Enfin, je tiens à remercier DelphineTisserand pour son sourire et son aide indéfectible sur mes problèmes analytiques.
D’autres personnes ont participé plus indirectement à ce travail. Merci donc à tousceux qui m’ont ouvert leur porte au laboratoire pour discuter de science, Alain, Bruno,Lorenzo et Géraldine. Alain, je te remercie également tout particulièrement pour nosdiscussions non-scientifiques. Enfin le laboratoire ne pourrait fonctionner sans le travailconsciencieux de Martine et Nicolas. Je les remercie vivement pour préserver nosconditions de travail. Merci également à Véronique Ensergueix, secrétaire à l’ANDRA, àFrance et à toute l’équipe du secrétariat du LGIT pour leur efficacité à résoudre mesproblèmes administratifs.
Un laboratoire sans étudiant (ou assimilé) serait bien morne. Merci donc à Francis,Anne-Claire, Marie-Pierre, Alix, Virginie, Tanya et Ahmad, premiers compagnons de routeainsi qu’à ceux (et celles) qui ont suivi Gabriela, Sudipto, Ana, Tatiana et Frédéric pouravoir animé les locaux de géochimie du LGIT, mais aussi de nombreuses salles de bar etsurtout de restaurants. Quand j’aurai quitté définitivement les lieux, j’espère d’ailleursperdre quelques kilos. Antoine et Mariette prennent à présent le relais, soignez les bien.
Durant la thèse, il y a le travail mais surtout les à-côtés partagés avec la famille etles amis. Merci Maman, Papa, Thierry, Mémé, Pépé pour votre enthousiasme à suivre,envers et contre tout, mes travaux de thèse, Hélène, Marcel, Julie, Pierre, Jeanne, Josephet tous les autres (vous vous reconnaîtrez, j’espère) pour votre accueil qui vous faitvraiment mériter le nom de « belle » famille. Merci à tous les amis avec qui j’ai partagé mesmoments de détente. Je ne vous cite pas car j’ai peur d’en oublier. Une petite pensée pourceux qui vont finir un peu plus tard : le dernier arrivé paye le coup à boire (pendant le potde thèse par exemple).
Enfin je tiens à te remercier, Delphine, pour avoir tracé avec justesse les limitesentre le travail et le reste, et pour m’avoir donné Estelle, une si bonne raison de rentrerplus tôt à la maison. Delphine, c’est en grande partie à toi que je dois mon équilibre pendantces trois années.
RESUME
Les interactions entre du Fe(II) en solution et une montmorillonite sont étudiées dans desconditions anoxiques et à température ambiante, sur une échelle de temps variant de l’heure àla semaine.
Le Fe2+ s’adsorbe sur les sites d’échange cationique de l’argile avec la même affinité quele Ca2+ ; en présence de chlore, le Fe(II) forme des paires ioniques, FeCl+, qui s’adsorbent avecune affinité comparable à celles de CaCl+ et MgCl+. Les simulations montrent qu’en fondanionique chloré concentré (comme l’eau de mer) les ions monovalents (Na+ et paires ioniquesdu type CaCl+ et MgCl+) sont majoritaires sur les sites d’échange cationique.
Le Fe2+ s’adsorbe sur les surfaces de bordure de la montmorillonite avec une affinité trèsforte. Cette adsorption spécifique peut être modélisée convenablement avec des modèlessimples de complexation de surface. Le Fe2+ s’adsorbe sur l’argile avec une affinité d’environ1000 fois plus forte que celle du Zn2+. Des expériences couplées d’adsorption, de titrage, dedissolution et de spectroscopie Mössbauer montrent que l’adsorption spécifique du Fe2+ est dueà plusieurs réactions distinctes :
� une adsorption compétitive avec remplacement de cations présents sur les surfaces debordure ou dans la structure (ex : Mg2+, Zn2+) ;
� une adsorption coopérative avec H4SiO4, ce mécanisme étant compatible avec laprécipitation de surface d’une phase Fe – Si ;
� un mécanisme d’adsorption suivi d’une oxydation du Fe2+ en Fe3+, cette réaction libérantdeux H+ en solution par Fe2+ adsorbé.
Ces phénomènes ne peuvent pas tous être pris en compte dans les modèles classiquesde complexation de surface. Une approche nouvelle pour les argiles est donc développée pourmodéliser les interactions solutés – argiles, basée sur une approche morphologique etstructurale de l’argile. Les surfaces de la montmorillonite sont caractérisées par deux méthodesindépendantes, la microscopie à force atomique (AFM) et l’adsorption de gaz à très bassepression, qui donnent le même résultat pour les surfaces de bordure : 8,5 m2 g-1. L’étudethéorique de la structure de l’interface argiles – solutés montre qu’elle ne porte pas moins de 27sites réactionnels différents pour les interactions argile – H+. Le modèle MUSIC est utilisé pourprédire leur réactivité. L’excellent accord entre les données expérimentales de titragepotentiométrique et leur simulation nous encourage à poursuivre dans cette voie et à compléterle modèle pour prédire les interactions surface – cations métalliques.

ABSTRACT
Solute Fe(II) – montmorillonite interactions are studied in anoxic conditions and at roomtemperature for reaction times from hour to week.
Fe2+ is shown to be sorbed on cation exchange site with the same affinity than Ca2+. Inchloride anionic medium, Fe(II) form ionic pairs – FeCl+ - which is sorbed with almost the sameaffinity than CaCl+ and MgCl+ are. The exchange thermodynamics constants derived from thisstudy are used to simulate the change in the exchanger composition as clay river particles enterseawater. In high concentration chloride medium, as seawater, monovalent ions (Na+ andCaCl+, MgCl+ ionic pairs) are shown to be the major species of the exchanger.
Fe2+ is sorbed specifically on the montmorillonite edge surfaces with a very high affinity.Simple complexation model are able to model the sorption data and show that the Fe2+ affinityfor clay edge surfaces is ~1000 times higher than the Zn2+ one. Mössbauer experimentscombined to sorption, titration and dissolution experiments show that the Fe2+ sorption is due toseveral different reactions:
� effective competitive sorption with replacement of previously sorbed or structural cations(Zn2+, Mg2+);
� cooperative sorption together with H4SiO4, in agreement with a possible surface precipitationof a Fe – Si phase;
� a sorption mechanism followed by an oxidation reaction, with a release of two H+ in solutionper Fe(II) sorbed, and a product (Fe(III)) fitting better octahedral surface “sites”.
All these phenomena can not be taken into account in a classical surface complexationmodel. Hence, an innovative model is developed to model clay – solute interactions, based on amorphological and structural approach. Montmorillonite edge surface area was determinedusing two independent methods, AFM measurement and low-pressure gas adsorption, that givethe same value for this area, i.e. 8.5 m2 g-1. The clay – solute interface was found to beconstituted by a mix of, at least, 27 reactive sites. Their reactivity towards H+ was modeled withthe MUSIC model. An excellent agreement is found between potentiometric measurement dataand predicted curves. This model should be further developed to predict the clay surfaces –metallic cations interactions.

Note sur les publications issues de cette thèse
Cette thèse se présente majoritairement sous forme d'article dont la succession necorrespond pas forcement à la chronologie d'écriture. Ainsi, le lecteur pourra se trouverconfronté à des renvois bibliographiques concernant des articles introduits plus loin dans lathèse. Les publications issues de cette thèse et en cours d'élaboration sont donc énumérées,ci-dessous, dans l'ordre chronologique d'écriture.
Articles soumis et en préparation
Auteurs, titre et journal Outils analytiques
Tournassat, C., Neaman, A., Villiéras, F., Bosbach, D. and Charlet, L.Nanomorphology of montmorillonite particles: Estimation of the clayedge sorption site density by low-pressure gas adsorption and AFMobservations, American Mineralogist.
AFM, Absorption de gaz àbasse pression.
Tournassat, C. and Charlet, L. Competitive specific sorption of Fe(II) onclay minerals in anoxic waters, Environmental Science and Technology.
Chimie analytique,modélisation numériquethermodynamique.
Tournassat, C., Greneche, J. M., Tisserand, D. and Charlet, L. Thetitration of clay minerals. Part I. Discontinuous backtitration techniquecombined to CEC measurements, Journal of Colloid and InterfaceScience.
Chimie analytique,Mössbauer.
Tournassat, C., Ferrage, E., Poinsignon, C. and Charlet, L. The titrationof clay minerals. Part II. Insights from infrared spectroscopy, andmodels using Bradbury and Baeyens or MUSIC approach. Journal ofColloid and Interface Science.
FTIR, modélisationstructurale, modélisationnumériquethermodynamique.
Charlet, L. and Tournassat, C. Fe(II)-Na(I)-Ca(II) cation exchange onmontmorillonite in chloride medium; evidence for preferential clayadsorption of chloride – metal ion pairs in seawater. AquaticGeochemistry.
Chimie analytique,Mössbauer, modélisationnumérique.
Tournassat, C., Charlet, L. and Greneche, J. M. Sorption of Fe onmontmorillonite in anoxic conditions: evidence for a new Fe-Si phaseprecipitation and for oxidation of Fe(II). Geochimica et CosmochimicaActa.
Chimie analytique,Mössbauer.
Articles en projet
Thématiques et auteurs Outils analytiques
Modélisation par dynamique moléculaire des phénomènes d’adsorptiondu Fe(II) sur les surfaces basales et de côté des argiles. Yves Chapron,Laurent Charlet, Christophe Tournassat.
Dynamique moléculaire,modélisation structurale.
Modélisation de la diffusion d’un panache de Fe(II) dans un aquifèreanoxique. Tony Appelo, Christophe Tournassat, Laurent Charlet. Modèle de transport réactif

1 / 204
SOMMAIRE
1. INTRODUCTION............................................................................................... 3
1.1. concept actuel du stockage en formation géologique profonde. ...............................5
1.2. La réactivité du Fe(II) dans la barrière ouvragée. .........................................................7
1.3. Les propriétés de sorption des argiles..........................................................................8
1.4. Moyens d’étude de la sorption à la surface des argiles.............................................17
1.5. difficultés associées au système Fe(II) – argile..........................................................19
2. MÉTHODOLOGIE........................................................................................... 21
2.1. Choix du matériau argileux ..........................................................................................23
2.2. Stratégie des expériences de sorption........................................................................24
2.3. Représentation des données .......................................................................................25
2.4. Approches pour modéliser l'adsorption spécifique...................................................32
2.5. Code de calcul et base de donnees thermodynamiques ...........................................33
3. LE FE(II) À LA SURFACE DE L'ARGILE, ADSORPTION ET PHÉNOMÈNESASSOCIÉS ......................................................................................................... 35
3.1. Adsorption du Fe(II) en position d'échange cationique ; importance des pairesioniques.................................................................................................................................37
FE(II)-NA(I)-CA(II) CATION EXCHANGE ON MONTMORILLONITE IN CHLORIDE MEDIUM; EVIDENCEFOR PREFERENTIAL CLAY ADSORPTION OF CHLORIDE – METAL ION PAIRS IN SEAWATER............41
3.2. Adsorption spécifique du Fe(II) sur les montmorillonites et phénomènes decompétition ...........................................................................................................................60
COMPETITIVE SPECIFIC SORPTION OF FE(II) ON CLAY MINERALS IN ANOXIC WATERS ................63
3.3. Evidences éxpérimentales de precipitation d’une phase Si-Fe et d’oxydation duFe(II) à la surface des argiles ..............................................................................................77
SORPTION OF FE(II) ON MONTMORILLONITE IN ANOXIC CONDITIONS: EVIDENCE FOR A NEW FE-SISOLID PHASE PRECIPITATION AND FOR SURFACE OXIDATION OF FE(II).....................................79
4. MODÉLISATION MORPHOLOGICO - STRUCTURALE DE LA RÉACTIVITÉDES ARGILES.................................................................................................. 103
4.1. Quantification des aires des différentes surfaces de l'argile ..................................105

2 / 204NANOMORPHOLOGY OF MONTMORILLONITE PARTICLES: ESTIMATION OF THE CLAY EDGESORPTION SITE DENSITY BY LOW-PRESSURE GAS ADSORPTION AND AFM OBSERVATIONS. .....107
4.2. Caractérisation des propriétés ACIDO-BASIQUES de l'argile et des sitesd’adsorption........................................................................................................................121
THE TITRATION OF CLAY MINERALS. PART I. DISCONTINUOUS BACKTITRATION TECHNIQUECOMBINED TO CEC MEASUREMENTS .................................................................................123
THE TITRATION OF CLAY MINERALS. PART II. STRUCTURAL BASED MODEL AND IMPLICATIONS ONCLAY REACTIVITY. ............................................................................................................143
5. CONCLUSION GÉNÉRALE ......................................................................... 169
5.1. Démarche scientifique appliquée lors de ces trois années de recherche..............171
5.2. Retour sur la problématique du stockage des déchets radioactifs en profondeur172
5.3. Back to the problematic of the nuclear wastes deep repository field ....................173
5.4. Synopsis des résultats ...............................................................................................175
5.5. Champs d'applications des résultats de cette thèse ...............................................179
5.6. Perspectives ................................................................................................................180
6. ANNEXES..................................................................................................... 183
6.1. Préparation des argiles...............................................................................................185
6.2. Méthode de dosage du Fe(II) et du Fe(III) par spectrophotométrie d’absorption :méthode Ferrozine .............................................................................................................188
6.3. Méthode pour limiter la quantité de O2 présente dans les suspensions et lessolutions .............................................................................................................................189
7. BIBLIOGRAPHIE GÉNÉRALE ..................................................................... 191

3 / 204
1. INTRODUCTION.
N.B. : les textes de cette introduction sont, pour la plupart, issus de documents de référence del’ANDRA. J’invite donc le lecteur, désireux d’obtenir plus de détails, à consulter les "référentielsANDRA" (http://www.andra.fr).
Les travaux présentés dans cette thèse ont été initiés et financés par l’ANDRA dans lecadre de son programme sur le stockage géologique profond. Ce programme concerne lesdéchets les plus dangereux, qui présentent un niveau élevé de radioactivité et/ou une durée devie très longue. Ces déchets, nommés HAVL (pour « Haute Activité Vie Longue ») nécessitentd’être confinés pendant des durées de l’ordre du million d’années, avant que leur radioactiviténe retombe au niveau de la radioactivité naturelle. Le stockage profond correspond à une desvoies envisagées pour ce confinement.
Les résultats de cette thèse ne se limitent pas à cette application et leur extension àd'autres domaines (par exemple d’autres aspects de l'ingiénerie environnementale ou encore lachimie des océans) a toujours été recherchée.

4 / 204
5 / 204
1.1. CONCEPT ACTUEL DU STOCKAGE EN FORMATION GEOLOGIQUEPROFONDE.
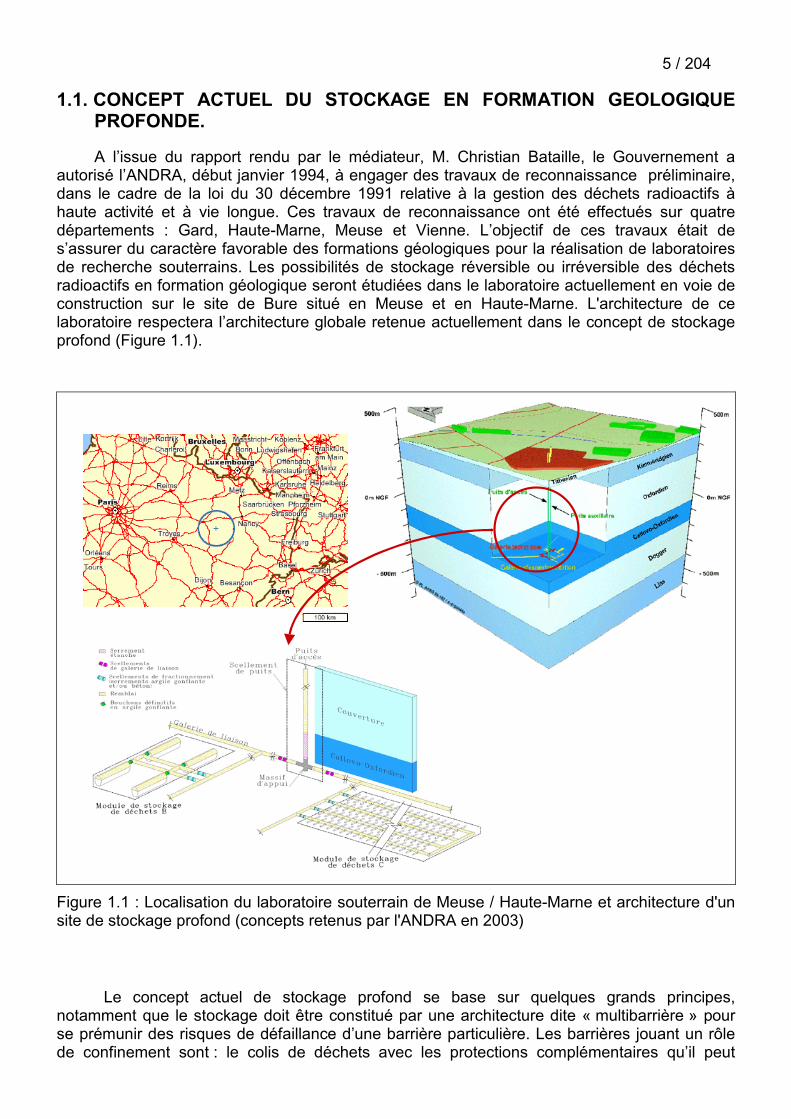
A l’issue du rapport rendu par le médiateur, M. Christian Bataille, le Gouvernement aautorisé l’ANDRA, début janvier 1994, à engager des travaux de reconnaissance préliminaire,dans le cadre de la loi du 30 décembre 1991 relative à la gestion des déchets radioactifs àhaute activité et à vie longue. Ces travaux de reconnaissance ont été effectués sur quatredépartements : Gard, Haute-Marne, Meuse et Vienne. L’objectif de ces travaux était des’assurer du caractère favorable des formations géologiques pour la réalisation de laboratoiresde recherche souterrains. Les possibilités de stockage réversible ou irréversible des déchetsradioactifs en formation géologique seront étudiées dans le laboratoire actuellement en voie deconstruction sur le site de Bure situé en Meuse et en Haute-Marne. L'architecture de celaboratoire respectera l’architecture globale retenue actuellement dans le concept de stockageprofond (Figure 1.1).
Figure 1.1 : Localisation du laboratoire souterrain de Meuse / Haute-Marne et architecture d'unsite de stockage profond (concepts retenus par l'ANDRA en 2003)
Le concept actuel de stockage profond se base sur quelques grands principes,notamment que le stockage doit être constitué par une architecture dite « multibarrière » pourse prémunir des risques de défaillance d’une barrière particulière. Les barrières jouant un rôlede confinement sont : le colis de déchets avec les protections complémentaires qu’il peut

6 / 204comporter (exemple : conteneur et surconteneur en acier), la barrière ouvragée – i.e. lesmatériaux placés entre le colis et la roche naturelle – et le milieu géologique (Figure 1.2). Dansle cas des déchets de type C vitrifiés (Tab. 1.1), le concept actuel repose sur un empaquetagedu colis de déchet par un conteneur en acier noir ou en alliage passivable. Les argiles, sousforme de bentonite, sont de bons candidats pour la constitution de la barrière ouvragée, entreautres, pour leur forte capacité de rétention des cations, qui devrait permettre à la barrièred’immobiliser les radionucléides et empêcher leur migration vers la biosphère.
Figure 1.2 : A gauche : photo d'un conteneur en acier pour déchet de type C. A droite : principede l'architecture "multibarrière".

7 / 204
Dénomination Déchets A Déchets B Déchets C
Type dedéchet
Déchets faiblementet moyennement
radioactifs à vie courte
Déchets issus duretraitement des
combustibles usés, dufonctionnement
d’installation du CEA(recherche ou
défense), ou dudémantèlement des
installations nucléaires.
Matière non valorisablede combustible usé
Type destockageutilisé ouenvisagé
Stockage de surface(opérationnel) Stockage profond (en cours d’évaluation)
Tab. 1.1 : Classification des déchets radioactifs selon leur provenance et le type de stockageenvisagé.
1.2. LA REACTIVITE DU FE(II) DANS LA BARRIERE OUVRAGEE.
Cette thèse porte sur la réactivité des argiles vis-à-vis du Fe(II) en solution et s’inscritdans la thématique de recherche de l’ANDRA sur le comportement des barrières ouvragées.Elle s’est déroulée au sein du service colis et matériaux (DS/CM), anciennement servicematériaux (DS/MA). Les domaines d’activité couverts par ce service sont :
� la conception des barrières ouvragées ;
� la conception des scellements ;
� l’évaluation du comportement des colis de déchets ; et,
� l’évaluation du comportement des radionucléides au sein des différentes barrières deconfinement.
Plus spécifiquement cette thèse a été suivie au sein du programme Fer – Argile. Ceprogramme se focalise sur les transformations de la barrière ouvragée induites par la libérationde Fe(II) occasionnée par la dissolution des conteneurs en acier entourant les colis de déchetsC et de combustible usé. Durant les travaux de réalisation, les ouvrages de stockage resterontouverts pendant plusieurs dizaines d’années ce qui modifiera les conditions physico-chimiqueslocales par rapport aux conditions naturelles initiales. En particulier, sont attendues desmodifications des contextes hydrologique (désaturation en eau), mécanique (création defissures), thermique et géochimique (exemple : équilibre avec l’oxygène et les carbonates) etbiologique (apparition de bactéries). Une fois refermé, le lieu du stockage redeviendraprogressivement anoxique et saturé en eau. Dans ces conditions, le Fe(0) des containeurs enacier ne sera pas thermodynamiquement stable. La réaction d’oxydation du Fe(0) par l’eaudevrait libérer des ions fer ferreux – Fe2+ – selon la réaction :
Fe0+ 2 H2O � Fe2+ + H2 (g) + 2 OH- reaction 1.1

8 / 204Le fer ferreux – Fe(II), présent sous forme Fe2+, FeCl+ ou FeHCO3
+ – libéré par le containeurinteragira avec les argiles de confinement. Le but initial de cette thèse était donc de caractériseret de quantifier les interactions du Fe(II) avec une bentonite. Les principales interactionsétudiées ont été les phénomènes d’adsorption.
1.3. LES PROPRIETES DE SORPTION DES ARGILES
Les mots « sorption » et « adsorption » désignent, dans toute cette thèse, l’ensemble desmécanismes permettant l’accumulation de matière sur une interface solide – solution.Classiquement, le mot adsorption est réservé aux phénomènes se déroulant sur une surface(2D) et absorption aux phénomènes faisant intervenir un volume (3D, exemple : précipitation)(Stumm and Morgan, 1996). La signification des mots « sorption » et « adsorption » englobedonc, dans cette thèse, des mécanismes parfois très distincts tels que l’échange cationique oula précipitation de surface.
1.3.1. La sorption des métaux dans les milieux naturels
L’adsorption des cations métalliques sur les surfaces de minéraux est un processusnaturel contrôlant les concentrations de la plupart des cations métalliques, considérés commepolluants ou non, dans les sols, sédiments et aquifères. Parmi les minéraux constituants dessols et des sédiments, les argiles et les oxydes jouent un rôle majeur. Leur petite taille encondition naturelle (inférieure à 1 µm) fait que ces minéraux développent de grandes surfacesspécifiques. Du fait de leur réactivité vis-à-vis des cations, ces minéraux sont considéréscomme des « puits » naturels vis-à-vis des polluants métalliques.
1.3.2. La sorption sur les oxydesLes oxydes dits « simples » sont les oxydes ne comportant qu’un seul type d’atome
métallique dans leur formule structurale. Il s’agit par exemple des oxyhydroxydes de fer(magnétite, goethite, hématite, ferrihydrite …), de la silice (SiO2) et de ses variétés cristallinespolymorphes (ex : quartz, cristobalite), du rutile (oxyde de titane, TiO2), des alumines (Al2O3)…A l’échelle macroscopique, les solides sont décrits comme des matériaux de charge neutre.Cependant à l’échelle nanoscopique, l’interface entre le solide et le milieu extérieur constitueune rupture du réseau cristallographique qui entraîne la création de charges en surface sur dessites fonctionnels de surface (Hiemstra et al., 1989a; Hiemstra et al., 1989b; Hiemstra et al.,1996). La charge ainsi créée peut être quantifiée à partir du modèle de Pauling sur les forces deliaison (Pauling, 1929). Dans un oxyde, chaque cation de valence VM forme avec chacun desanions O2- de son polyèdre de coordination une liaison électrostatique de force fM-O = VM/n, où nest le nombre d’anions du polyèdre de coordination. Au milieu de la structure, la valence VO = -2d’un oxygène est compensée par la somme des forces de liaisons établies avec ses m cationsvoisins :
� ���
mOM Vf
m2 Eq. 1.1
Sur les bordures des particules, certains oxygènes ne sont pas "entourés" complètement decations métalliques mais sont en contact avec la solution. Ils sont alors dits insaturés etprésentent des charges (Figure 1.3). Ces charges ne peuvent pas être neutraliséescomplètement au sein même du solide (Manceau and Gates, 1997), mais le sont au niveau de

9 / 204l’interface par des interactions avec le milieu extérieur. La création de liaisons hydrogène avecl'eau environnante, l’adsorption d’un cation et la formation d’un complexe de surface font partiede ces interactions (e.g. Brown, 1976; Sposito, 1984; McBride, 1994; Hiemstra et al., 1996).
a
b
c
Oxygène insaturé
Oxygène saturé
Figure 1.3 : Structure du quartz et présence d’oxygène insaturés en surface. La charge formellede Si est +4, et est distribuée sur quatre atomes d’oxygène. La charge donnée à chaque atomed’oxygène est de donc de +1. Un atome d’oxygène n’est saturé que si il relie deux tétraèdres etqu’il reçoit ainsi la contribution de deux atomes de Si voisins.
Pour comprendre le phénomène de complexation de surface, une analogie avec laformation de complexes en solution peut être faite (Stumm and Morgan, 1996, p.520).Considérons un ligand en solution ayant une terminaison carboxylique (RCOOH). Cetteterminaison peut réagir avec l'ion Cu2+ selon la réaction :
+ H+R – C O – H
OR – C
O – Cu+
O+ Cu2+ + H+R – C
O – H
OR – C
O – Cu+
O+ Cu2+R – C
O – H
OR – C
O – H
OR – C
O – Cu+
OR – C
O – Cu+
O+ Cu2+
reaction 1.2
Remarque : dans l’ensemble des réactions, la forme simplifiée de H3O+, marquée ici H+, seradésignée sous le terme de « proton », bien que cette forme H+ ne soit pas trouvée libre ensolution et bien que proton désigne rigoureusement un constituant atomique portant une chargeélémentaire positive.
Les groupes fonctionnels de surface hydroxo (–OH), présents à la surface des oxydes, etdésignés par le symbole générique >SOH, peuvent interagir avec l'ion Cu2+ selon une réactionanalogue à la réaction 1.2 :
+ H+>SOH >SOCu++ Cu2+ + H+>SOH >SOCu++ Cu2+reaction 1.3
les ligands >SO- se comportant, de la même façon que RCOO-, comme des bases de Lewis.
La quantification des phénomènes d’adsorption est souvent faite à l’aide d’isothermesd’adsorption. Ces isothermes sont en fait des courbes montrant la quantité de métal adsorbé enfonction d’un paramètre variable qualifiant la composition de la solution, les autres paramètres

10 / 204étant fixés. Ce paramètre variable est souvent le pH, la concentration en métal libre de lasolution ou sa fraction équivalente au sein du cortège de cations présents. Le choix de cettereprésentation se comprend parfaitement si l’on considère que d’après la réaction 1.3, le cationmétallique entre en compétition avec les protons pour former un complexe avec le sitefonctionnel de surface. Faire varier le pH (qui est en quelque sorte la mesure du nombre deprotons libres en solution sur une échelle logarithmique) à concentration totale en cationmétallique fixée ou faire varier la concentration du cation métallique à pH fixé, permet d’évaluerles affinités relatives de la surface vis-à-vis du cation et du proton (Figure 1.4).
Figure 1.4 : Exemple d'isotherme de sorption. Adsorption de Cu2+ sur de la silice (SiO2) enfonction du pH (Schindler et al., 1976).
Récemment un modèle a été proposé pour prédire, à l'aide d'informations structurales,l'affinité des sites fonctionnels de surface vis-à-vis des protons. Dans ce modèle � MUSIC(Hiemstra et al., 1996) �, l'affinité pour le proton est calculée à partir de la charge partielleportée par l'oxygène de surface et de la somme des valences de la liaison apportés par lescations entourant cet oxygène (Hiemstra et al., 1996; Venema et al., 1998) :
���
����
��� � VsAK
jjlog Eq. 1.2
où A est une constante égale à +19.8 (Hiemstra et al., 1996), V est la valence de l'oxygène (V=-2), et �
jjs est la somme des valences de liaison des cations entourant l'oxygène (métaux plus
protons) :
� �HHi
Mej
j snsmssi
�������� 1 . Eq. 1.3
où�i
iMes est la contribution des i cations structuraux Mei ions, sH la valence de liaison d'une
liaison O-H (sH = 0.8), et (1 - sH) la valence de liaison d'une liaison hydrogène. m et n sontrespectivement le nombre de protons complexés et le nombre de protons engagés dans une
11 / 204liaison hydrogène. La contribution de chaque cation structural (sMe) est calculée grâce à laformule de Brown et Altermatt (Brown and Altermatt, 1985) :
� �b
RR
Me es�
�
0
Eq. 1.4
où R est la distance Me-O, R0 est une distance spécifique de l'élément Me et tabulée par Brownet Altermatt (Brown and Altermatt, 1985) et b est une constante égale à 0.37 Å.
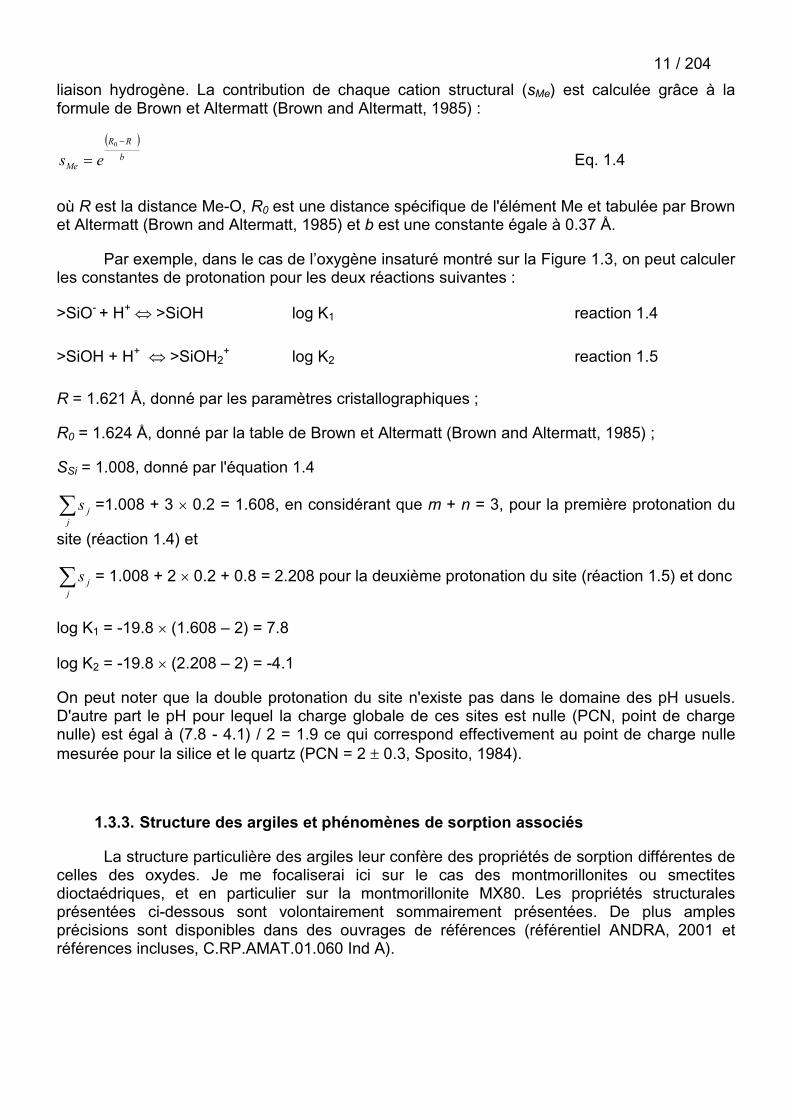
Par exemple, dans le cas de l’oxygène insaturé montré sur la Figure 1.3, on peut calculerles constantes de protonation pour les deux réactions suivantes :
>SiO- + H+ � >SiOH log K1 reaction 1.4
>SiOH + H+ � >SiOH2+ log K2 reaction 1.5
R = 1.621 Å, donné par les paramètres cristallographiques ;
R0 = 1.624 Å, donné par la table de Brown et Altermatt (Brown and Altermatt, 1985) ;
SSi = 1.008, donné par l'équation 1.4
�j
js =1.008 + 3 � 0.2 = 1.608, en considérant que m + n = 3, pour la première protonation du
site (réaction 1.4) et
�j
js = 1.008 + 2 � 0.2 + 0.8 = 2.208 pour la deuxième protonation du site (réaction 1.5) et donc
log K1 = -19.8 � (1.608 – 2) = 7.8
log K2 = -19.8 � (2.208 – 2) = -4.1
On peut noter que la double protonation du site n'existe pas dans le domaine des pH usuels.D'autre part le pH pour lequel la charge globale de ces sites est nulle (PCN, point de chargenulle) est égal à (7.8 - 4.1) / 2 = 1.9 ce qui correspond effectivement au point de charge nullemesurée pour la silice et le quartz (PCN = 2 � 0.3, Sposito, 1984).
1.3.3. Structure des argiles et phénomènes de sorption associés
La structure particulière des argiles leur confère des propriétés de sorption différentes decelles des oxydes. Je me focaliserai ici sur le cas des montmorillonites ou smectitesdioctaédriques, et en particulier sur la montmorillonite MX80. Les propriétés structuralesprésentées ci-dessous sont volontairement sommairement présentées. De plus amplesprécisions sont disponibles dans des ouvrages de références (référentiel ANDRA, 2001 etréférences incluses, C.RP.AMAT.01.060 Ind A).

12 / 2041.3.3.1. Structure cristalline et surfaces développées
Les montmorillonites font parties des argiles T.O.T. Elles sont formées par unempilement de feuillets constitués d’une couche octaédrique (couche O) prise en sandwich pardeux couches tétraédriques (couches T). Dans l’empilement, les feuillets sont séparés par unespace dit interfoliaire. Les couches tétraédriques sont constituées principalement d’ions Si4+,dont les tétraèdres de coordination partagent uniquement des sommets. L’agencement destétraèdres forme une structure en « nid d’abeille » dont les cavités sont appelées cavitéssiloxane ditrigonales (Figure 1.1). La couche octaédrique des feuillets est composéemajoritairement de cations Al3+, dont les octaèdres de coordination partagent uniquement desarêtes entre eux. Cet arrangement ménage, lui aussi, une structure en « nid d’abeille » avec laprésence d’un site lacunaire sur 3 sites octaédriques (Figure 1.6). Chaque tétraèdre descouches T partage un coin avec la couche octaédrique. Les oxygènes de la couche octaédriquequi ne partagent pas une liaison avec les tétraèdres sont protonés (Figure 1.7). Cette structureparticulière crée une grande diversité de surfaces en contact avec le milieu extérieur, surfacede bordure de feuillet, surface interfoliaire et surface externe de la particule (Figure 1.8).
a
b
Atome de Si
Cavité siloxane ditrigonale
Figure 1.5 : Agencement des tétraèdres de Si et aménagement des cavités siloxane (vue selonl’axe cristallographique c et dans le plan ab).

13 / 204
Atome de Al
Site lacunaire
a
b
Figure 1.6 : Agencement des octaèdres d’Al dans le feuillet octaédrique et aménagement dessites lacunaires (vue selon l’axe cristallographique c et dans le plan ab).
Liaison Si-O-(Al)2
Sites (Al)2-OH
a
b
Figure 1.7 : Structure d’un feuillet TOT et position des sites protonés au centre des cavitéssiloxane (vue selon l’axe cristallographique c et dans le plan ab).

14 / 204
TOT
TOT
TOT
Figure 1.8 : Les différentes surfaces des particules argileuses constituées d’un empilement defeuillets TOT ; en rouge, les surfaces de bordures ; en bleu, les surfaces interfoliaires ; et, envert la surface externe de la particule.
1.3.3.2. Formule structurale et échange cationique
Idéalement, la formule structurale d’une montmorillonite devrait s’écrire :(AlIII2)Oc(SiIV4)TO10(OH)2. Cependant des substitutions ont lieu au sein des couchestétraédriques et octaédriques. En position octaédrique, un ion divalent (principalement MgII etFeII) ou un autre ion trivalent (FeIII) peut remplacer un Al. Un ion trivalent (AlIII ou FeIII) peutégalement se substituer à un SiIV tétraédrique. Si le nombre de substitutions dans la coucheoctaédrique est supérieur au nombre de substitutions dans la couche tétraédrique, on a affaireà une smectite, et sinon à une vermiculite. Ces substitutions créent un déficit de charge qui estcompensé par l’introduction d’un cation dans l’espace interfoliaire (Figure 1.9). La formuledevient alors : Catz+
(x+y)/z(MeIII2-xMeII
x)Oc(SiIV4-yMeIIIy)TO10(OH)2 où Catz+ représente un cation de
charge z en position interfoliaire, MeIII représente un cation trivalent et MeII un cation divalent.Les cations interfoliaires sont peu liés à la structure, à de rares exceptions près (exemple : Cs+
et K+). Ils forment en général des complexes de sphère externe, c’est à dire qu’ils gardent leursphère d’hydratation. La plupart de ces cations s’échangent facilement avec d’autres cationsprésents dans le milieu extérieur, au cours d’un processus nommé échange cationique.
CatCat
CatCat Cat
CatCat
Espace interfoliaire
Figure 1.9 : Schéma d’une particule d’argile avec ses cations interfoliaires

15 / 204
1.3.3.3. Terminaison des feuillets et adsorption spécifique
A l’instar des oxydes, les feuillets des argiles ont des surfaces de bordure présentant desgroupes hydroxo (Figure 1.10). Ces sites fonctionnels sont un deuxième lieu potentiel pour lesphénomènes de sorption (Schlegel et al., 1999; Schlegel, 2000; Schlegel et al., 2001a; Dähn etal., 2003). Comme dans le cas des oxydes, la complexation de cation métallique à la surface deces sites (Figure 1.11) est, entre autres, contrôlée par le pH (Figure 1.12) (Charlet et al., 1993;Stadler and Schindler, 1993; Zachara and Smith, 1994; Baeyens and Bradbury, 1997; Bradburyand Baeyens, 1997, 1998; Turner et al., 1998; Bradbury and Baeyens, 2002…).
a b
c
Oxygène insaturé de la couchetétraédrique
Oxygène insaturé de la coucheoctaédrique
Figure 1.10 : Structure du feuillet TOT de l'argile et de ses terminaisons sur les bordures. Lesoxygènes insaturés indiqués par les flèches sont à l'origine des phénomènes de sorptionspécifique.
a b
c
Me
Me
Figure 1.11 : Représentation schématique de deux types de sorption sur les bordures desfeuillets. En bas à droite : cation métallique Me en solution avec sa sphère d'hydratation. Enhaut à gauche : sorption en complexe de sphère interne et liaison à la structure de l'argile parun sommet partagé avec un tétraèdre de bordure de l'argile. En haut à droite : sorption en
16 / 204complexe de sphère interne et liaison à la structure de l'argile par une arète partagée avec unoctaèdre de bordure de l'argile.
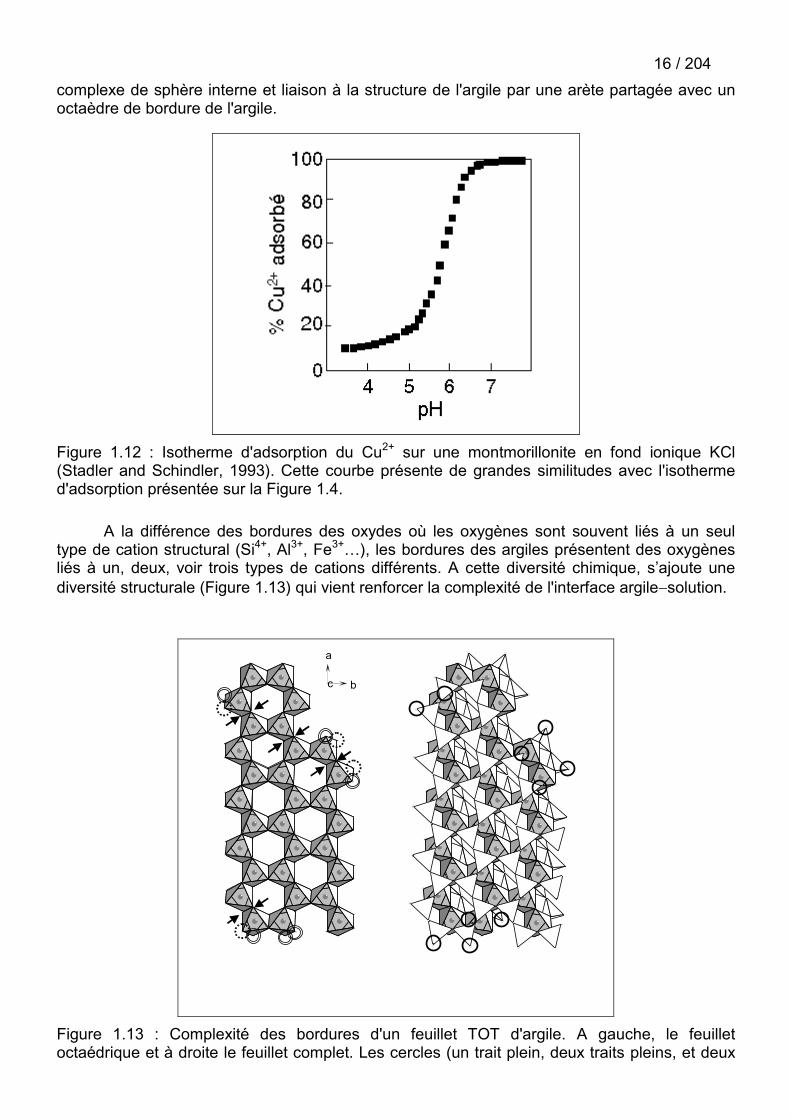
Figure 1.12 : Isotherme d'adsorption du Cu2+ sur une montmorillonite en fond ionique KCl(Stadler and Schindler, 1993). Cette courbe présente de grandes similitudes avec l'isothermed'adsorption présentée sur la Figure 1.4.
A la différence des bordures des oxydes où les oxygènes sont souvent liés à un seultype de cation structural (Si4+, Al3+, Fe3+…), les bordures des argiles présentent des oxygènesliés à un, deux, voir trois types de cations différents. A cette diversité chimique, s’ajoute unediversité structurale (Figure 1.13) qui vient renforcer la complexité de l'interface argile�solution.
a
bc
Figure 1.13 : Complexité des bordures d'un feuillet TOT d'argile. A gauche, le feuilletoctaédrique et à droite le feuillet complet. Les cercles (un trait plein, deux traits pleins, et deux
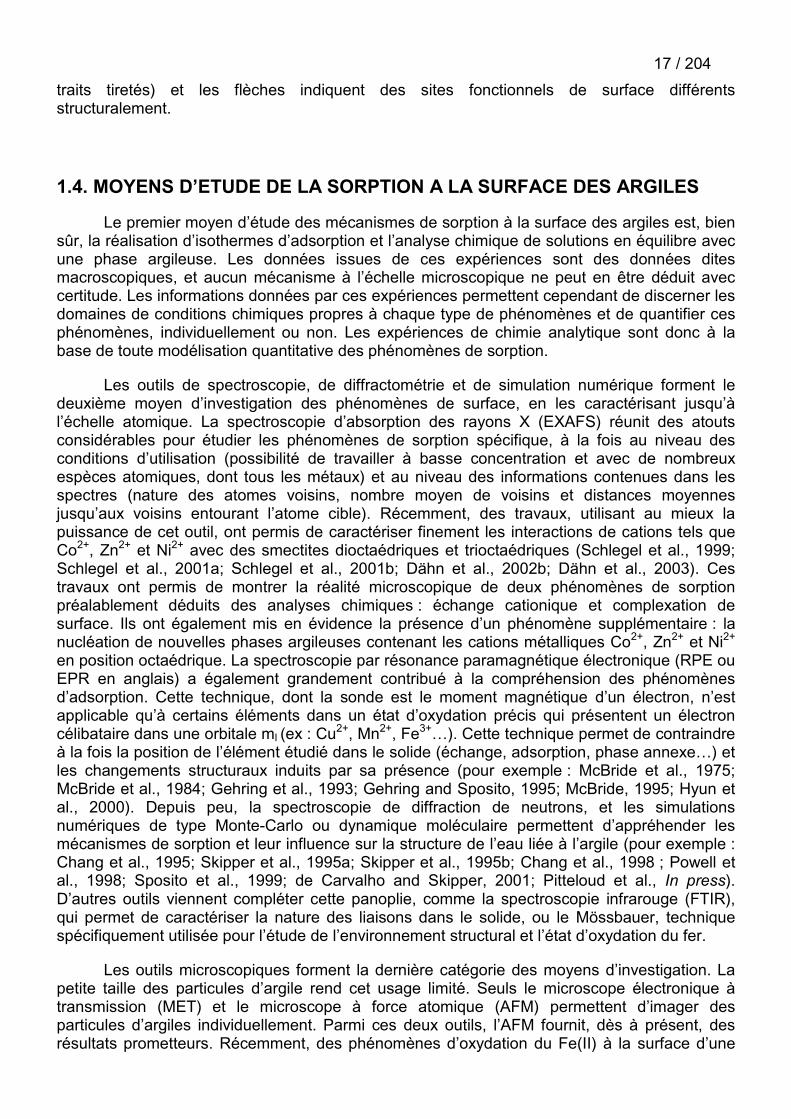
17 / 204traits tiretés) et les flèches indiquent des sites fonctionnels de surface différentsstructuralement.
1.4. MOYENS D’ETUDE DE LA SORPTION A LA SURFACE DES ARGILES
Le premier moyen d’étude des mécanismes de sorption à la surface des argiles est, biensûr, la réalisation d’isothermes d’adsorption et l’analyse chimique de solutions en équilibre avecune phase argileuse. Les données issues de ces expériences sont des données ditesmacroscopiques, et aucun mécanisme à l’échelle microscopique ne peut en être déduit aveccertitude. Les informations données par ces expériences permettent cependant de discerner lesdomaines de conditions chimiques propres à chaque type de phénomènes et de quantifier cesphénomènes, individuellement ou non. Les expériences de chimie analytique sont donc à labase de toute modélisation quantitative des phénomènes de sorption.
Les outils de spectroscopie, de diffractométrie et de simulation numérique forment ledeuxième moyen d’investigation des phénomènes de surface, en les caractérisant jusqu’àl’échelle atomique. La spectroscopie d’absorption des rayons X (EXAFS) réunit des atoutsconsidérables pour étudier les phénomènes de sorption spécifique, à la fois au niveau desconditions d’utilisation (possibilité de travailler à basse concentration et avec de nombreuxespèces atomiques, dont tous les métaux) et au niveau des informations contenues dans lesspectres (nature des atomes voisins, nombre moyen de voisins et distances moyennesjusqu’aux voisins entourant l’atome cible). Récemment, des travaux, utilisant au mieux lapuissance de cet outil, ont permis de caractériser finement les interactions de cations tels queCo2+, Zn2+ et Ni2+ avec des smectites dioctaédriques et trioctaédriques (Schlegel et al., 1999;Schlegel et al., 2001a; Schlegel et al., 2001b; Dähn et al., 2002b; Dähn et al., 2003). Cestravaux ont permis de montrer la réalité microscopique de deux phénomènes de sorptionpréalablement déduits des analyses chimiques : échange cationique et complexation desurface. Ils ont également mis en évidence la présence d’un phénomène supplémentaire : lanucléation de nouvelles phases argileuses contenant les cations métalliques Co2+, Zn2+ et Ni2+
en position octaédrique. La spectroscopie par résonance paramagnétique électronique (RPE ouEPR en anglais) a également grandement contribué à la compréhension des phénomènesd’adsorption. Cette technique, dont la sonde est le moment magnétique d’un électron, n’estapplicable qu’à certains éléments dans un état d’oxydation précis qui présentent un électroncélibataire dans une orbitale ml (ex : Cu2+, Mn2+, Fe3+…). Cette technique permet de contraindreà la fois la position de l’élément étudié dans le solide (échange, adsorption, phase annexe…) etles changements structuraux induits par sa présence (pour exemple : McBride et al., 1975;McBride et al., 1984; Gehring et al., 1993; Gehring and Sposito, 1995; McBride, 1995; Hyun etal., 2000). Depuis peu, la spectroscopie de diffraction de neutrons, et les simulationsnumériques de type Monte-Carlo ou dynamique moléculaire permettent d’appréhender lesmécanismes de sorption et leur influence sur la structure de l’eau liée à l’argile (pour exemple :Chang et al., 1995; Skipper et al., 1995a; Skipper et al., 1995b; Chang et al., 1998 ; Powell etal., 1998; Sposito et al., 1999; de Carvalho and Skipper, 2001; Pitteloud et al., In press).D’autres outils viennent compléter cette panoplie, comme la spectroscopie infrarouge (FTIR),qui permet de caractériser la nature des liaisons dans le solide, ou le Mössbauer, techniquespécifiquement utilisée pour l’étude de l’environnement structural et l’état d’oxydation du fer.
Les outils microscopiques forment la dernière catégorie des moyens d’investigation. Lapetite taille des particules d’argile rend cet usage limité. Seuls le microscope électronique àtransmission (MET) et le microscope à force atomique (AFM) permettent d’imager desparticules d’argiles individuellement. Parmi ces deux outils, l’AFM fournit, dès à présent, desrésultats prometteurs. Récemment, des phénomènes d’oxydation du Fe(II) à la surface d’une

18 / 204phlogopite (mica de structure proche des montmorillonites mais formant des cristaux de grandetaille) ont été observés par AFM et ont pu être localisés préférentiellement sur des terminaisonsde feuillets (Figure 1.14). Les dissolutions de l'hectorite (une smectite trioactédriquemagnésienne) et de l'illite (argile potassique) ont également été observées "en direct" à bas pH.Ces expériences ont permis de montrer que la dissolution est localisée sur les bordures desfeuillets (Figure 1.15). Le développement de nouveaux dispositifs, permettant d’observer desparticules d’argiles sous l’eau (in situ) et en boîte à gants, ouvre la voie à l’observation en directde nucléations de phase et de réactions d'oxydo-réduction à la surface des argiles (Bosbach etal., 2002).
A BA B
Figure 1.14 : A. Image AFM in-situ d’une surface fraîchement clivée de phlogopite. B. ImageAFM in-situ d’une surface de phlogopite ayant réagi avec du Fe(II) et de l’As(V) sans fondionique (temps de réaction : 2 h). D’après Charlet et al. (Charlet et al., 2002).
Figure 1.15 : Images AFM de la dissolution d’hectorite à bas pH 2 (Bosbach et al., 2000). Agauche : état initial. A droite, l’image de droite clairement l’apparition de marches sur les bordsde la particule).
En résumé, les outils actuels peuvent être groupés en trois grandes catégories, ayantchacune leur fonction dans la compréhension des phénomènes à la surface de l’argile :

19 / 204� chimie analytique des solutions : quantification, identification des phénomènes ;
� spectroscopie (ex : RPE, FTIR, Mössbauer, EXAFS, diffraction de neutrons) et modélisationnumérique (dynamique moléculaire et simulation de type Monte Carlo) : caractérisation desphénomènes à l’échelle atomique ;
� microscopie (ex : AFM) : localisation des phénomènes.
1.5. DIFFICULTES ASSOCIEES AU SYSTEME FE(II) – ARGILE
Le système Fe(II) – argile présente deux types de difficultés. Le premier est lié à lanécessité de conserver le fer sous forme ferreuse pendant les expériences, ce qui est d'autantplus difficile que l'adsorption catalyse les réactions d'oxydation (Liger et al., 1999). Le deuxièmeest lié à la présence systématique de fer dans les systèmes naturels, et donc, dans les argiles.
La première difficulté m’a contraint à travailler en boîte à gants où des conditionsd’anoxie stricte sont respectées (pO2 < 10 ppm ou 0.5 ppm selon la boîte à gants utilisée). Lessuspensions et solutions utilisées sont préalablement purifiées de leur O2 dissous avant d’êtrerentrées dans l’enceinte de la boîte (protocole en 6.2). La plupart des solutions sont préparéesà l’intérieur de la boîte en mélangeant de l’eau purifiée et des sels préalablement pesés àl’extérieur. Les véritables problèmes apparaissent quand il faut sortir les échantillons de la boîteà gants, comme, par exemple, pour effectuer des mesures spectroscopiques. Le moyen le plusefficace a été de sceller chaque échantillon dans des boîtes individuelles sous atmosphèreanoxique, puis de les sortir de la boîte à gant et les mettre immédiatement dans une glacièrecontenant de la carboglace afin de bloquer au maximum les réactions d’oxydation du Fe(II).Une fois le transport terminé, les échantillons sont rapidement transférés dans l’azote liquide.
La deuxième difficulté m’a empêché d’utiliser certaines techniques, dont l’EXAFS auseuil du fer. En effet, l’EXAFS fournit une information moyenne sur tous les atomes cibles. Iln’est donc pas possible de distinguer le fer ajouté dans le système du fer déjà présent dansl’argile. Celui-ci excédant largement la quantité de fer ajoutée dans les expériences, desexpériences EXAFS auraient caractérisé majoritairement le fer structural. Pour pallier à cetinconvénient, des expériences de chimie originales, bien que simples, et l'utilisation coupléed'outils tels que les spectroscopies Mössbauer et infrarouge (FTIR) ont été utilisées afin decontraindre au mieux les phénomènes et de les identifier aux phénomènes déjà caractériséspour d’autres cations divalents (Zn2+, Co2+, Ni2+…).

20 / 204

21 / 204
2. METHODOLOGIE

22 / 204
23 / 204
2.1. CHOIX DU MATERIAU ARGILEUX
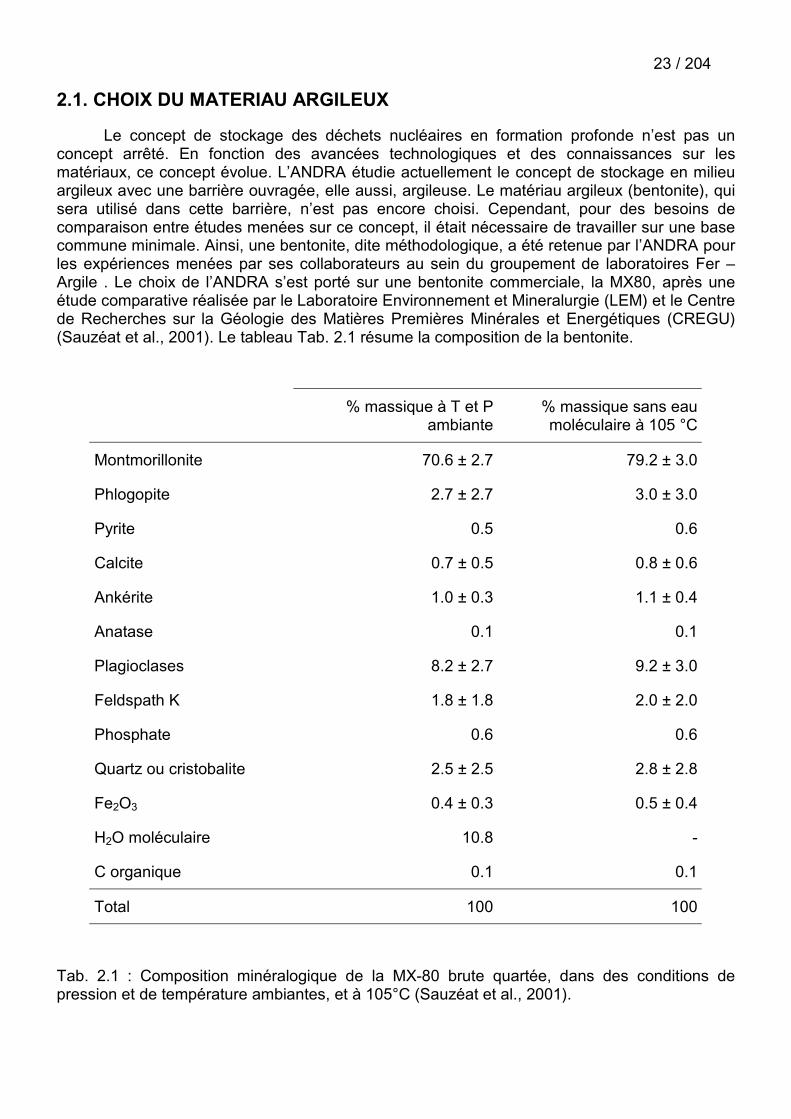
Le concept de stockage des déchets nucléaires en formation profonde n’est pas unconcept arrêté. En fonction des avancées technologiques et des connaissances sur lesmatériaux, ce concept évolue. L’ANDRA étudie actuellement le concept de stockage en milieuargileux avec une barrière ouvragée, elle aussi, argileuse. Le matériau argileux (bentonite), quisera utilisé dans cette barrière, n’est pas encore choisi. Cependant, pour des besoins decomparaison entre études menées sur ce concept, il était nécessaire de travailler sur une basecommune minimale. Ainsi, une bentonite, dite méthodologique, a été retenue par l’ANDRA pourles expériences menées par ses collaborateurs au sein du groupement de laboratoires Fer –Argile . Le choix de l’ANDRA s’est porté sur une bentonite commerciale, la MX80, après uneétude comparative réalisée par le Laboratoire Environnement et Mineralurgie (LEM) et le Centrede Recherches sur la Géologie des Matières Premières Minérales et Energétiques (CREGU)(Sauzéat et al., 2001). Le tableau Tab. 2.1 résume la composition de la bentonite.
% massique à T et Pambiante
% massique sans eaumoléculaire à 105 °C
Montmorillonite 70.6 ± 2.7 79.2 ± 3.0
Phlogopite 2.7 ± 2.7 3.0 ± 3.0
Pyrite 0.5 0.6
Calcite 0.7 ± 0.5 0.8 ± 0.6
Ankérite 1.0 ± 0.3 1.1 ± 0.4
Anatase 0.1 0.1
Plagioclases 8.2 ± 2.7 9.2 ± 3.0
Feldspath K 1.8 ± 1.8 2.0 ± 2.0
Phosphate 0.6 0.6
Quartz ou cristobalite 2.5 ± 2.5 2.8 ± 2.8
Fe2O3 0.4 ± 0.3 0.5 ± 0.4
H2O moléculaire 10.8 -
C organique 0.1 0.1
Total 100 100
Tab. 2.1 : Composition minéralogique de la MX-80 brute quartée, dans des conditions depression et de température ambiantes, et à 105°C (Sauzéat et al., 2001).

24 / 204La bentonite est constituée en majorité de montmorillonite. Cependant, des impuretés
sont présentes en quantités non négligeables. La plupart des minéraux accessoires, présentsdans cette bentonite, ainsi que la matière organique possèdent des propriétés de sorption vis-à-vis des cations métalliques. L’interprétation des données d’adsorption sur la bentonite est doncd’autant moins aisée que le nombre des composants actifs est grand. Par conséquent, lafraction argileuse de cette bentonite a été extraite afin d’étudier spécifiquement les interactionsFe(II) – argile et simplifier les interprétations. Le procédé d’extraction de la phase argileuse estprésenté en annexe 2.
2.2. STRATEGIE DES EXPERIENCES DE SORPTION
2.2.1. Expériences d'adsorption spécifique sur les bordures des argiles
L'étendue de l'adsorption spécifique d'un métal sur les surfaces de bordure des argilesest principalement contrôlée par le pH, tandis que l'adsorption en position d'échange cationiqueest liée aux concentrations relatives des éléments dans la solution en équilibre avec l'argile.Pour ne "voir" que l'adsorption spécifique, il suffit donc d'augmenter la concentration du fondcationique jusqu'à ce que les phénomènes d'échange ne représente plus qu'une quantitéinférieure à la barre d'erreur sur la quantité adsorbée totale. C'est pourquoi les expériencesd'adsorption spécifiques ont été réalisées à haute concentration en NaCl ou CaCl2, typiquementde 0.5 à 1 mol l-1 de NaCl et de 0.05 à 0.5 mol l-1 de CaCl2. Les expériences consistaient en lamesure de l'adsorption du Fe(II) en fonction du pH, la concentration totale en Fe(II) et les autresconditions expérimentales (teneur en solide, force ionique…) étant maintenues constantes. Cesexpériences ont été réalisées, soit dans des réacteurs chimiques (expériences en continu, àtemps d'équilibre solide - solution court, de l'ordre de la demi-heure) soit dans des tubes(expériences discontinues ou en "batch", à temps d'équilibre long, de l'ordre du jour à lasemaine).
2.2.2. Expériences d'échange cationique
Dans ces expériences, les phénomènes d'adsorption spécifique devaient être minimisés.L'adsorption spécifique étant plus importante à mesure que le pH augmente, les expériencesd'échange cationique ont donc été réalisées à bas pH. Les premières expériences d'adsorptionspécifique ont montré que le Fe(II) pouvait commencer à s'adsorber spécifiquement vers pH 2-3. Les expériences d'échange cationiques ont donc été réalisées dans cette fourchette de pH,où l'influence de l'adsorption spécifique était moins grande que les barres d'erreur sur la mesuredu Fe(II) adsorbé en site d'échange cationique. Les expériences consistent à mesurer lavariation des ions Na(I), Ca(II) et Fe(II) adsorbés en fonction des concentrations relatives deNa(I), Ca(II) et Fe(II) en solution. Des masses identiques d'argile sont mises à équilibrer dansdes tubes avec des solutions contenant des concentrations relatives en Na(I), Ca(II) et Fe(II)différentes. La normalité totale (qui est égale à la concentration en ion Cl-, dans notre cas) et lepH sont identiques dans chaque tube. Le temps d'équilibre varie d'une journée à une semaineselon les expériences.
2.2.3. Expériences de titration, de dissolution, de compétition…
Il est rapidement apparu que les deux types d’expériences décrites plus haut ne suffisaitpas à comprendre entièrement les phénomènes d’échange et de sorption spécifique. Desexpériences complémentaires de chimie ont été menées pour caractériser les sites d’adsorption(expériences de titration), la dissolution de l’argile à haut et bas pH, et enfin les phénomènes decompétition entre éléments pouvant s’adsorber sur l’argile. Ces expériences ont été réalisées

25 / 204soit en "batch" soit en réacteur chimique. Leur description complète est disponible dans lesarticles qui constituent les parties 3 et 4 de cette thèse.
2.3. REPRESENTATION DES DONNEES
2.3.1. Echange cationique
2.3.1.1. Description thermodynamique de l'échange cationique
De nombreuses publications des années 1980 traitent de la description de l'échangecationique sur les surfaces des argiles (Sposito, 1981; McBride, 1994). Dans le court rappel quisuit je présente brièvement les paramètres de cette description en partant d'un exemple, le casde l'échange Na+ - Fe2+, et en suivant les développements et les notations présentés parSposito et McBride (Sposito, 1981; McBride, 1994).
L’échange binaire :
2 NaX + Fe2+ � FeX2 + 2 Na+ reaction 2.1
a pour constante thermodynamique d’échange :
� �� ��
�
��22
2
2/
FeN
NaNff
KNa
Fe
Na
FeFeNaex Eq. 2.1
où fA est le coefficient d’activité de l’espèce adsorbée A, NA est la fraction de l’échangeuroccupée par l’espèce A, et (A) est l’activité en solution de l’espèce A. NA s’exprime dans notrecas par les relations suivantes :
et ][][
][][][
][
2
2
2 FeXNaXFeX
NFeXNaX
NaXN FeNa�
�
�
� Eq. 2.2
Dans le cas d’un échange purement binaire, tous les termes de l’équation sontaccessibles à la mesure sauf les coefficients d’activité. La constante thermodynamique del’échange n’est donc pas mesurable directement. En revanche, il est possible de calculer uneconstante conditionnelle d’échange en posant des valeurs pour les coefficients d’activité apriori. Plusieurs conventions d'écriture, issus de modèles légèrement différent existent. Seul lemodèle utilisé dans cette thèse, celui de Vanselow (Vanselow, 1932), est présenté. Dans cemodèle, les activités des espèces adsorbées sont considérées égales à 1 : fNa = fFe =1. Larelation avec la constante thermodynamique d’échange est donnée par la relation :
FeNav
Na
FeFeNaex K
ff
K /2
/� Eq. 2.3
où Kv est la constante conditionnelle d’échange de Vanselow. Toutes les grandeurs permettantle calcul de la constante de Vanselow sont accessibles à la mesure. De plus, dans un système

26 / 204binaire, il est, théoriquement, possible d’obtenir la constante thermodynamique d’échange Kex àpartir des données de Kv obtenues en fonction des fractions équivalentes de l’échangeuroccupées par les ions ainsi qu’une estimation des coefficients d’activité de chacune desespèces adsorbées (Sposito, 1981) :
RTG
dEKKFeNa
exFe
FeNav
FeNaex
/1
0
// lnln�
��� � Eq. 2.4
���
FeE
FeFeNa
vFeNa
vFeNa dEKKEf0
// 'lnlnln2 Eq. 2.5
�����
1// 'lnln)1(ln
FeEFe
FeNav
FeNavFeFe dEKKEf Eq. 2.6
où EA est la fraction équivalente adsorbée de l'espèce A :
et ][2][
][2][2][
][
2
2
2 FeXNaXFeX
EFeXNaX
NaXE FeNa��
�
�
��
� Eq. 2.7
Le nombre de points expérimentaux nécessaires et la précision requise sur ces points rendentla détermination des coefficients d'activité difficile, voir impossible. Toutefois, dans la plupartdes systèmes binaires, les argiles se comportent comme des échangeurs idéaux, dans la limitedes barres d'erreur expérimentales. Les coefficients d'activité sont alors égaux à 1 et leconstante de Vanselow peut être considérée comme la constante thermodynamique del'échange. C'est cette hypothèse qui sera faite tout au long de cette thèse.
2.3.1.2. Représentation des données
Dans l'échange cationique, la fraction adsorbée d'un cation est comparée à la fraction dece même cation en solution. Il est donc logique de représenter les données de la même façon.Il est fréquent de représenter la fraction équivalente sur le solide de l'espèce A (EA) en fonctionde la fraction équivalente de l'espèce A en solution ( AE~ ) (Sposito, 1981; McBride, 1994). Dansle système binaire Fe2+ - Na+, la réaction d'échange peut s'écrire :
2 NaX + Fe2+ � FeX2 + 2 Na+
où X- représente un site de l'échangeur.
et AE~ se calcule comme suit :
][2][
][2~et ][2][
][~2
2
2 ��
�
��
�
��
�
�
��
�
FeNaFeE
FeNaNaE FeNa Eq. 2.8
En travaillant à normalité totale (T.N.) constante dans tous les tubes, le dénominateur [Na+] + 2� [Fe2+] reste constant et égal à cette normalité. De même le dénominateur [NaX] + 2 � [FeX2]reste constant et égal à la capacité d'échange cationique de l'argile. Nous verrons par la suiteque certains phénomènes peuvent empêcher cette dernière égalité. Cette représentation acertains avantages. Par exemple, il est possible de directement comparer la position des points

27 / 204expérimentaux avec l'isotherme de non-préférence qui est la courbe matérialisant une affinitéde l'argile égale pour les deux cations. Dans le cas d'un échange homoionique (i.e. entre deuxions de même charge), cet isotherme est une droite de pente 1 passant par l'origine. Pour deséchanges hétéroioniques (ex : Na(I) – Fe(II)), cet isotherme est une courbe de formule (Sposito,1981) :
2/1
2 ~1
~121
�
���
�
���
����
�
�
����
NaNaNa EETN
E Eq. 2.9
avec
� �� �� �� �32
4
FeClNaCl
�
���
�
� Eq. 2.10
� �� � ���
����
��
��
�I
IIANaCl 3,0
1log � Eq. 2.11
� �� � ���
����
��
��
�I
IIAFeCl 3,0
14log 2� Eq. 2.12
I étant la force ionique.
Si les points expérimentaux sont au-dessus de cette courbe, alors le cation représentésur le graphique est préféré par l'argile à l'autre cation échangé (Figure 2.1).
Figure 2.1 : Isothermes de non préférence dans un système binaire homovalent (à gauche, parexemple Fe2+ - Ca2+) et dans un système binaire hétérovalent (à droite, par exemple Fe2+ -Na+). Si Me2+ représente Fe2+, alors, les domaines notés « Affinité plus forte » correspondent à
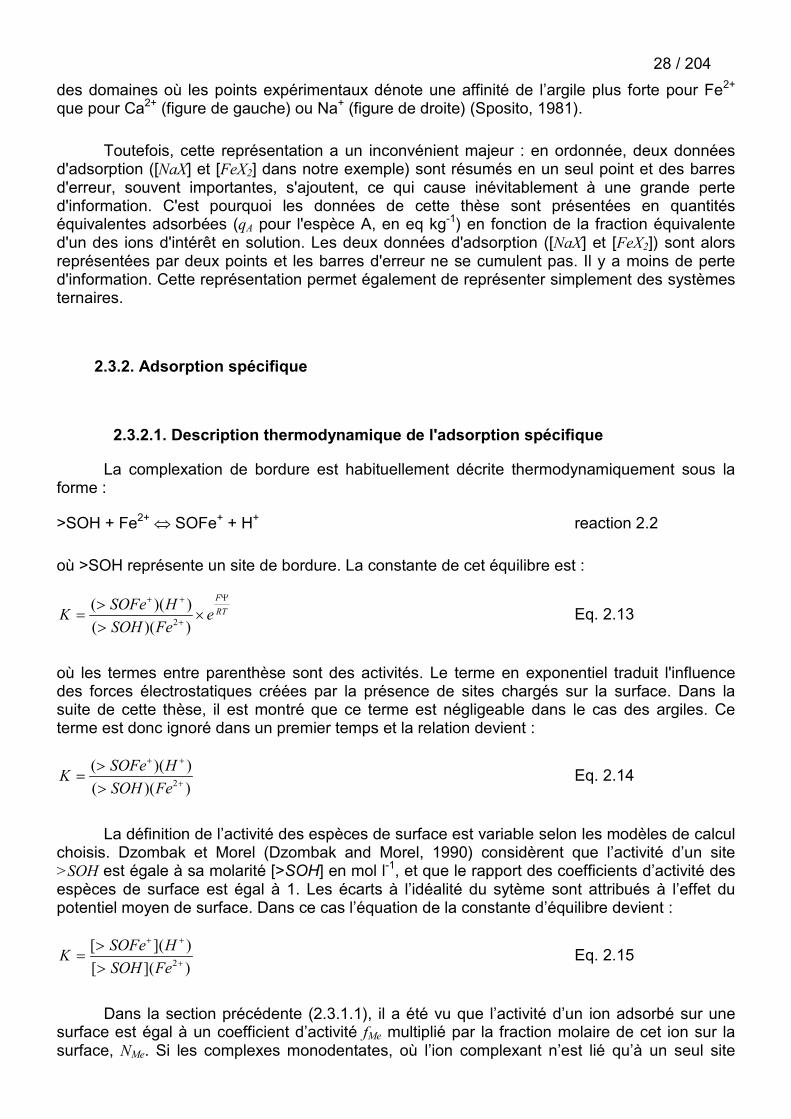
28 / 204des domaines où les points expérimentaux dénote une affinité de l’argile plus forte pour Fe2+
que pour Ca2+ (figure de gauche) ou Na+ (figure de droite) (Sposito, 1981).
Toutefois, cette représentation a un inconvénient majeur : en ordonnée, deux donnéesd'adsorption ([NaX] et [FeX2] dans notre exemple) sont résumés en un seul point et des barresd'erreur, souvent importantes, s'ajoutent, ce qui cause inévitablement à une grande perted'information. C'est pourquoi les données de cette thèse sont présentées en quantitéséquivalentes adsorbées (qA pour l'espèce A, en eq kg-1) en fonction de la fraction équivalented'un des ions d'intérêt en solution. Les deux données d'adsorption ([NaX] et [FeX2]) sont alorsreprésentées par deux points et les barres d'erreur ne se cumulent pas. Il y a moins de perted'information. Cette représentation permet également de représenter simplement des systèmesternaires.
2.3.2. Adsorption spécifique
2.3.2.1. Description thermodynamique de l'adsorption spécifique
La complexation de bordure est habituellement décrite thermodynamiquement sous laforme :
>SOH + Fe2+ � SOFe+ + H+ reaction 2.2
où >SOH représente un site de bordure. La constante de cet équilibre est :
RTF
eFeSOH
HSOFeK�
�
��
�
�
�
�
))(())((
2 Eq. 2.13
où les termes entre parenthèse sont des activités. Le terme en exponentiel traduit l'influencedes forces électrostatiques créées par la présence de sites chargés sur la surface. Dans lasuite de cette thèse, il est montré que ce terme est négligeable dans le cas des argiles. Ceterme est donc ignoré dans un premier temps et la relation devient :
))(())((
2�
��
�
�
�
FeSOHHSOFeK Eq. 2.14
La définition de l’activité des espèces de surface est variable selon les modèles de calculchoisis. Dzombak et Morel (Dzombak and Morel, 1990) considèrent que l’activité d’un site>SOH est égale à sa molarité [>SOH] en mol l-1, et que le rapport des coefficients d’activité desespèces de surface est égal à 1. Les écarts à l’idéalité du sytème sont attribués à l’effet dupotentiel moyen de surface. Dans ce cas l’équation de la constante d’équilibre devient :
)]([)]([
2�
��
�
�
�
FeSOHHSOFeK Eq. 2.15
Dans la section précédente (2.3.1.1), il a été vu que l’activité d’un ion adsorbé sur unesurface est égal à un coefficient d’activité fMe multiplié par la fraction molaire de cet ion sur lasurface, NMe. Si les complexes monodentates, où l’ion complexant n’est lié qu’à un seul site
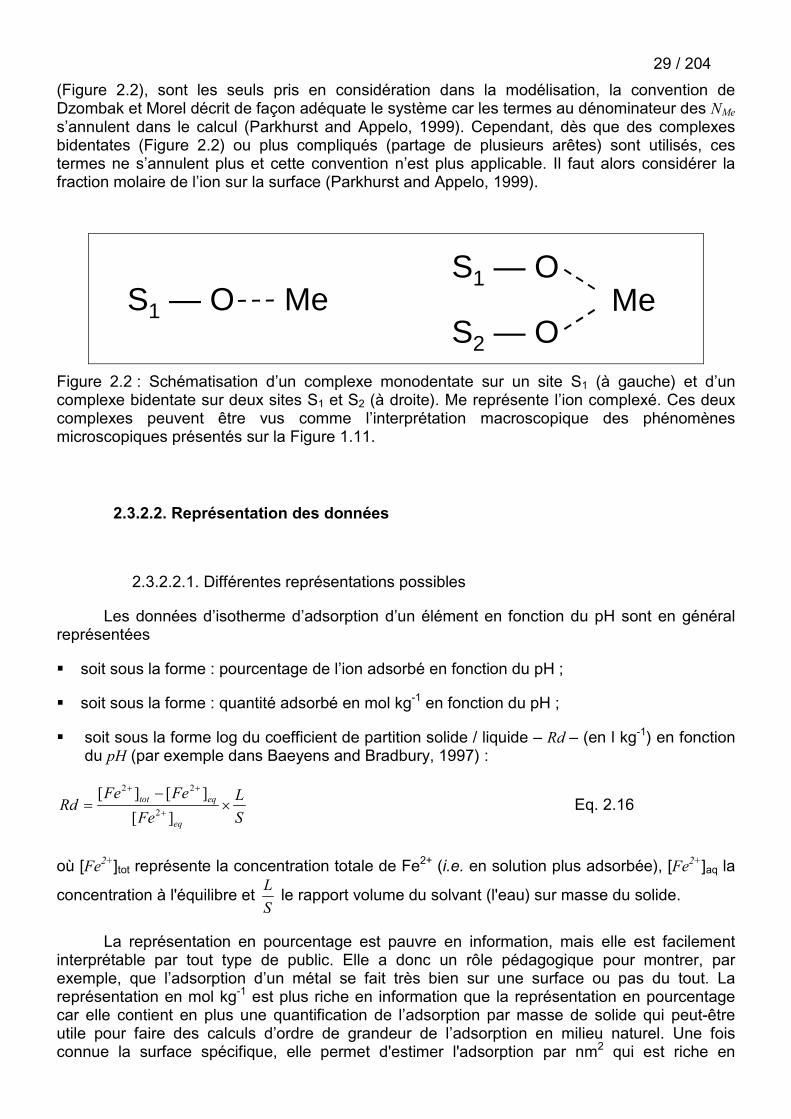
29 / 204(Figure 2.2), sont les seuls pris en considération dans la modélisation, la convention deDzombak et Morel décrit de façon adéquate le système car les termes au dénominateur des NMes’annulent dans le calcul (Parkhurst and Appelo, 1999). Cependant, dès que des complexesbidentates (Figure 2.2) ou plus compliqués (partage de plusieurs arêtes) sont utilisés, cestermes ne s’annulent plus et cette convention n’est plus applicable. Il faut alors considérer lafraction molaire de l’ion sur la surface (Parkhurst and Appelo, 1999).
S1 — O
S2 — O Me S1 — O Me
Figure 2.2 : Schématisation d’un complexe monodentate sur un site S1 (à gauche) et d’uncomplexe bidentate sur deux sites S1 et S2 (à droite). Me représente l’ion complexé. Ces deuxcomplexes peuvent être vus comme l’interprétation macroscopique des phénomènesmicroscopiques présentés sur la Figure 1.11.
2.3.2.2. Représentation des données
2.3.2.2.1. Différentes représentations possibles
Les données d’isotherme d’adsorption d’un élément en fonction du pH sont en généralreprésentées
� soit sous la forme : pourcentage de l’ion adsorbé en fonction du pH ;
� soit sous la forme : quantité adsorbé en mol kg-1 en fonction du pH ;
� soit sous la forme log du coefficient de partition solide / liquide – Rd – (en l kg-1) en fonctiondu pH (par exemple dans Baeyens and Bradbury, 1997) :
SL
FeFeFe
Rdeq
eqtot�
�
��
��
][][][
2
22
Eq. 2.16
où [Fe2+]tot représente la concentration totale de Fe2+ (i.e. en solution plus adsorbée), [Fe2+]aq la
concentration à l'équilibre et SL le rapport volume du solvant (l'eau) sur masse du solide.
La représentation en pourcentage est pauvre en information, mais elle est facilementinterprétable par tout type de public. Elle a donc un rôle pédagogique pour montrer, parexemple, que l’adsorption d’un métal se fait très bien sur une surface ou pas du tout. Lareprésentation en mol kg-1 est plus riche en information que la représentation en pourcentagecar elle contient en plus une quantification de l’adsorption par masse de solide qui peut-êtreutile pour faire des calculs d’ordre de grandeur de l’adsorption en milieu naturel. Une foisconnue la surface spécifique, elle permet d'estimer l'adsorption par nm2 qui est riche en

30 / 204informations de type structural. La représentation en Rd a des avantages et des inconvénients.Elle est appréciée du monde des radioisotopes, car elle permet de caractériser des systèmesoù presque 100% de l'isotope est adsorbé mais où des traces présentes en solution présententun danger. Pour les autres systèmes, elle présente un avantage de représentation expliquédans les paragraphes suivants.
2.3.2.2.2. Représentation en Rd et adsorption sur un seul site
On ne considère ici que des sites monodentates et on peut donc utiliser la convention deDzombak et Morel (Dzombak and Morel, 1990) pour les activités des espèces surfaciques. Soitun site >S1OH, la constante d’équilibre qui lui est associée est :
)]([)]([
21
11 �
��
�
�
�
FeOHSHOFeS
K Eq. 2.17
en incorporant Rd dans cette équation, K1 devient :
LS
OHSHRdK
Fe
�
�
�
�
�
2][)(
11
�Eq. 2.18
où �2Fe� est le coefficient d'activité de l'ion Fe2+ en solution. En considérant que :
][][][ 111�
����� OFeSOSOHS tot Eq. 2.19
et en posant :
][
][
][
1
1
1
2
1
1
1
SLOFeSq
SLOHSq
SLOSq
FeS
HS
totS
���
���
���
��
Eq. 2.20
où 1Sq est la quantité de site 1 par kg d'argile, H
Sq1 est la quantité de site 1 protonée par kg
d'argile, et �2
1
FeSq est la quantité de site 1 complexée par Fe2+ par kg d'argile, la relation devient
alors
�
�
�
�
�
�
2
2
11)(
)( 1
FeFeSS qq
HRdK�
Eq. 2.21
et donc si �
��
2
11 Fe
SS qq , alors :
log(Rd) = pH + Constante Eq. 2.22
31 / 204Cette condition sur l’occupation des sites n’est vérifiée que pour une concentration totale enFe2+ très inférieure à la concentration totale de sites. Dans ce cas il est intéressant de tracerlog(Rd) en fonction du pH. Si la pente obtenue est de 1, alors la sorption se faitvraisemblablement sur un seul site.
2.3.2.2.3. Cas de l’adsorption sur deux sites
Soit deux sites >S1O et >S2O, les constantes d’équilibre qui leur sont associée sont :
)]([)]([
)]([)]([
22
222
1
11 �
��
�
��
�
�
�
�
�
�
FeOHSHOFeS
KFeOHS
HOFeSK Eq. 2.23
Plusieurs cas de figure peuvent se présenter :
� aucun des deux sites n’est saturé ;
� un site est saturé ;
� les deux sites sont saturés.
Le dernier cas ne présente aucun intérêt pour le calcul car l’équilibre thermodynamique n’estpas respecté. Choisissons le deuxième cas de figure et supposons que le site 1 soit saturé(
�
�
2
11
FeSS qq ). Posons
21 SStot qqq �� avec les mêmes significations que précédemment.
)()(
)()()()(
222
1
2
2
1
2
2
2
2
�
�
�
�
���
��
�
�
�
��
��
Feqqq
HqqFeq
HqK
SFeStotS
SFeStot
HS
FeS Eq. 2.24
et
][][ 221
2
2
2
��
�
��
��
Feqq
Feq
Rd SFeS
FeStot Eq. 2.25
donc
)()(
)(
)()(
22
1
2
2
1
1
2
22
�
��
���
�
�
���
�
���
�Feqqq
Hq
qqqHRdK
SFeStotS
S
SFeStotSFe�
Eq. 2.26
Dans ce cas, même�
��
2
2
FeStotS qq si log(Rd) ne peut pas être relié simplement au pH car le
système a trois composantes indépendantes : )(HFeRd �� et )(, 2 . A fortiori, si cette relation dedominance du nombre de sites total par rapport au nombre de sites occupés par le Fe2+ n’estplus vraie ce système de représentation n’est plus valide. Il convient alors de représenter lesystème en trois dimensions dont les vecteurs principaux sont
�2FeStotq , (Fe2+) et (H+), tous les
autres paramètres étant constants.
Enfin dans le dernier cas de figure, à savoir quand aucun site n’est saturé, le système serésume à :

32 / 204
)()()(
)())((
)(
))((
21
21
21
1
2
1
2
112
1
2
1
2
2
2
1
2
11
2
1
2
��
�
�
�
�
�
�
�
���
��
�
�
�
���
���
FeKHqFeK
HqqFeK
q
qqqq
qqqqKK
SFeSSFe
S
FeS
FeStotS
Fes
FeSS
FeS
FeStot
avec Eq. 2.27
Le système peut alors encore être décrit avec les trois vecteurs indépendants citésprécédemment.
Des études précédentes ont montré que les phénomènes d'adsorption spécifique sur lesargiles ne pouvaient pas être décrits avec un seul type de site (ex. : Wanner et al., 1994;Zachara and Smith, 1994; Bradbury and Baeyens, 1997; Avena, 2002) et que les adsorptionsne se font pas forcément par le biais de complexes monodentates (ex. : Schlegel et al., 1999;Schlegel, 2000; Schlegel et al., 2001a; Dähn et al., 2003). La représentation en Rd a donc peud'intérêt dans notre cas particulier. Elle ne sera donc pas utilisée dans cette thèse.
2.4. APPROCHES POUR MODELISER L'ADSORPTION SPECIFIQUE
2.4.1. Utiliser des modèles déjà existants : les limites des modèles empiriques
La modélisation de la complexation de surface sur les argiles est un domaine derecherche encore jeune mais de multiples modèles sont déjà disponibles. Ils sont souvent issusdes modèles développés sur les oxydes (Charlet et al., 1993; Stadler and Schindler, 1993;Zachara and Smith, 1994; Bradbury and Baeyens, 1997; Turner et al., 1998) et sont construitsde manière empirique, c’est-à-dire, que le modèle est conçu en fonction des pointsexpérimentaux à ajuster. Il est donc logique qu’il existe presque autant de modèles qued’études, chacun ayant leurs constantes de complexation et leur description de l’interface solide– liquide. La multiplicité des modèles est un problème, car les constantes de complexation nesont pas transposables d’un modèle à l’autre.
Il m’a semblé préférable de ne pas développer un nouveau modèle empirique pourajuster mes données. Celles-ci sont modélisées avec la même approche que celle de Bradburyet Baeyens (Bradbury and Baeyens, 1997, 1998, 2002), afin de pouvoir comparer lesconstantes de complexation du Fe(II) avec celles disponibles pour d’autres ions (Ni2+, Zn2+,Eu3+). Pouvant modéliser un grand nombre de données d’adsorption, ce modèle a l’avantage dela simplicité. Il en a aussi les inconvénients, à savoir une grande rigidité et donc l’impossibilitéde prendre en compte tous les phénomènes mesurés et observés lors des expériences.
2.4.2. Développer un modèle morphologico-structural de sorption
Les travaux de Hiemstra et Van Riemsdijk sur les phénomènes de sorption à la surfacedes oxydes « simples » a ouvert la voie à une nouvelle forme de modélisation des phénomènesde complexation de surface (Hiemstra et al., 1989a; Hiemstra et al., 1989b; Hiemstra et al.,1996). Ce type de modèle s’appuie sur des données morphologiques et structurales pourobtenir les types de sites réactionnels en surface, leur quantité massique et leur réactivité (voir
33 / 204section 1.3.2). C’est ce type d’approche qui a été tenté dans cette thèse pour modélisercertaines des interactions argiles – solutés.
2.5. CODE DE CALCUL ET BASE DE DONNEES THERMODYNAMIQUES
Le code de calcul Phreeqc2 (Parkhurst and Appelo, 1999) a été choisi pour sa grandesouplesse d’utilisation. Un module intégré est spécialement conçu pour la modélisation de lacomplexation de surface. L’activité des espèces en surface y est égale à leur fraction molairesur la surface (NMe). Il est donc possible, en utilisant ce module, de modéliser l’échangecationique en utilisant la convention de Vanselow.
La base de données thermodynamiques utilisée est la base Llnl.dat, du LawrenceLivermore National Laboratory. Elle est fournie avec la dernière version de Phreeqc2 (Parkhurstand Appelo, 1999).

34 / 204

35 / 204
3. LE FE(II) A LA SURFACE DE L'ARGILE,ADSORPTION ET PHENOMENES ASSOCIES

36 / 204

37 / 204
3.1. ADSORPTION DU FE(II) EN POSITION D'ECHANGE CATIONIQUE ;IMPORTANCE DES PAIRES IONIQUES
L’affinité du Fe(II) pour les sites d’échange cationique a été mesurée grâce à desexpériences d’échange dans les systèmes Na(I)-Fe(II), Ca(II)-Fe(II) et Na(I)-Ca(II)-Fe(II) enfond ionique chloré. Des expériences préliminaires d’adsorption spécifique ayant montré que leFe(II) pouvait s’adsorber sur l’argile à bas pH, les expériences d’échange ont été réalisées à pH2-3.
Cette étude montre que le Fe(II) s’adsorbe avec la même affinité que le Ca(II) sur lessites d’échange (Figure 3.1), confirmant la relative homogénéité des ions divalents vis-à-vis del’échange cationique (Fletcher and Sposito, 1989).
0.00.10.20.30.40.50.60.70.80.91.0
0.0 0.2 0.4 0.6
q i (
eq k
g-1)
FeE~
i = Fe(II)
i = Ca(II)
Figure 3.1 : Quantités de Ca(II) et de Fe(II) adsorbé sur les sites d’échange cationique (en eqkg-1) en fonction du rapport équivalent de Fe(II) en solution (sans unité). Les lignes indiquentune relation de non-préférence de l’argile vis-à-vis des deux cations.
Il est également montré, par les données de chimie et de spectroscopie Mössbauer, queles paires d’ions FeCl+ s’adsorbent avec une grande affinité. Ce comportement confirme ce quia déjà été observé pour les ions CaCl+ et MgCl+ (Sposito et al., 1983a; Sposito et al., 1983b).Les affinités des sites d’échange de la montmorillonite pour H+, Na+, K+, Ca2+, CaCl+, CaOH+,Mg2+, MgCl+, Fe2+ et FeCl+ ont été calculées à partir de données issues de cette thèse, ou de lalittérature et sont présentées sur le tableau Tab. 3.1.

38 / 204
Réactions d’échange Log Kv Source des données expérimentales
�XNa + H+ � �XH + Na+ 0.0 Cette thèse
�XNa + K+ � �XK + Na+ 0.6 Jensen, 1973
�XNa + CaCl+ � �XCaCl + Na+ 2.5 Sposito et al., 1983a
�XNa + CaOH+ � �XCaOH + Na+ 2.5 Cette thèse
�XNa + MgCl+ � �XMgCl + Na+ 1.9 Sposito et al., 1983a
�XNa + FeCl+ � �XFeCl + Na+ 2.3 Cette thèse
2 �XNa + Ca2+ � �X2Ca + 2 Na+ 0.5 Cette thèse
2 �XNa + Mg2+ � �X2Mg + 2 Na+ 0.5 Sposito et al., 1983a
2 �XNa + Fe2+ � �X2Fe + 2 Na+ 0.4 Cette thèse
Tab. 3.1 : Réactions d’échange à la surface de la montmorillonite et coefficients de sélectivité(convention de Vanselow)
La simulation de données de terrain trouvées dans la littérature ont permis de valider cesrésultats de laboratoire sur les milieux naturels. La grande affinité des paires ioniques chloréespour les surfaces argileuses a des implications sur la chimie des particules argileuses desrivières et des océans. Par le calcul, on montre ainsi que les particules argileuses océaniquesportent presque uniquement des cations monovalents (simples ou paires ioniques) sur leur sited’échange, alors que les particules d’argile des rivières portent surtout des divalents. Lescations monovalents ayant moins tendance à faire floculer les particules que les cationsdivalents, la vitesse de floculation des argiles à l’embouchure des deltas et estuaires, et donc ladistance de transport des particules, doivent être controlées, en partie, par ce phénomèned’adsorption de paires ioniques (Figure 3.2).
Une autre implication de ce résultat est que les surfaces des argiles en milieu alcalin etchloré devraient être couvertes en partie par des paires d’ions CaCl+ et CaOH+. Ces cationsmonovalents ont beaucoup moins tendance à générer des aggrégats de particules que lescations divalents (Sposito, 1984). Ils devraient donc théoriquement créer des conditions defaible conductivité hydraulique, la circulation d’eau étant défavorisée par l’absence desaggrégats qui structurent normalement les sols et les sédiments.
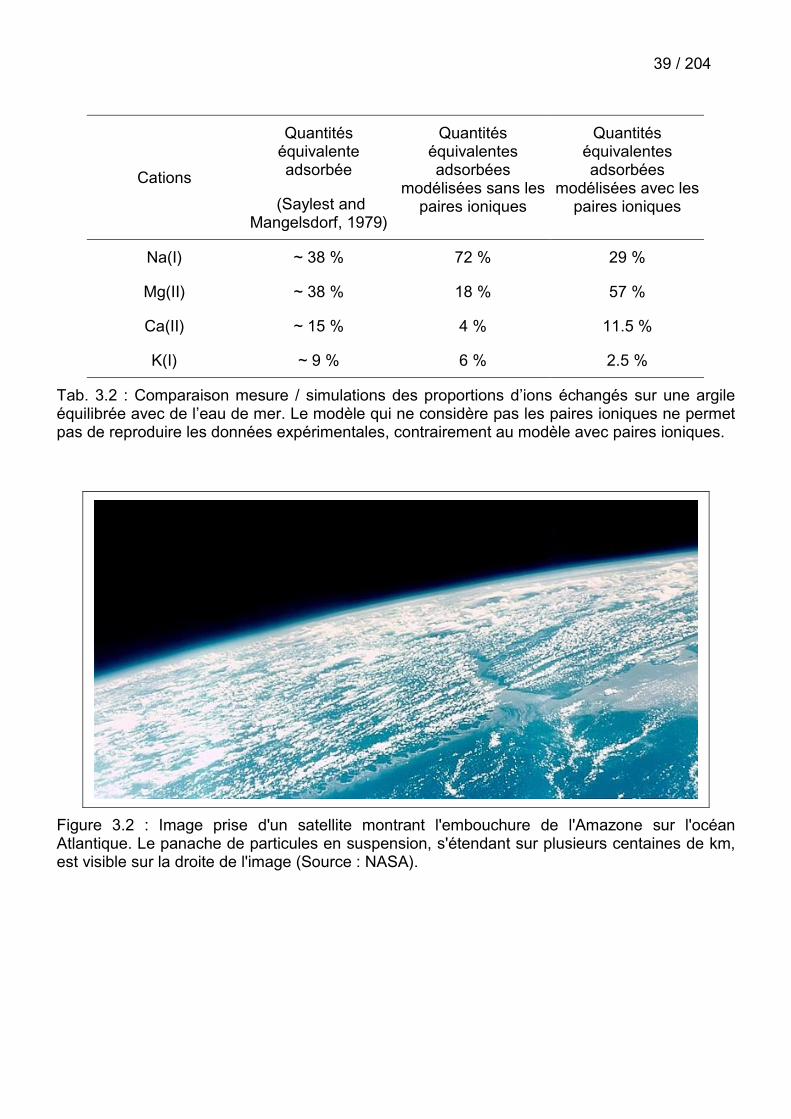
39 / 204
Cations
Quantitéséquivalenteadsorbée
(Saylest andMangelsdorf, 1979)
Quantitéséquivalentesadsorbées
modélisées sans lespaires ioniques
Quantitéséquivalentesadsorbées
modélisées avec lespaires ioniques
Na(I) ~ 38 % 72 % 29 %
Mg(II) ~ 38 % 18 % 57 %
Ca(II) ~ 15 % 4 % 11.5 %
K(I) ~ 9 % 6 % 2.5 %
Tab. 3.2 : Comparaison mesure / simulations des proportions d’ions échangés sur une argileéquilibrée avec de l’eau de mer. Le modèle qui ne considère pas les paires ioniques ne permetpas de reproduire les données expérimentales, contrairement au modèle avec paires ioniques.
Figure 3.2 : Image prise d'un satellite montrant l'embouchure de l'Amazone sur l'océanAtlantique. Le panache de particules en suspension, s'étendant sur plusieurs centaines de km,est visible sur la droite de l'image (Source : NASA).

40 / 204

41 / 204
FE(II)-NA(I)-CA(II) CATION EXCHANGE ON MONTMORILLONITE INCHLORIDE MEDIUM; EVIDENCE FOR PREFERENTIAL CLAY
ADSORPTION OF CHLORIDE – METAL ION PAIRS IN SEAWATER.
Laurent Charlet1, Christophe Tournassat1,2
1 LGIT - CNRS/UJF, Université Joseph Fourier (Grenoble), P.O. Box 53, F 38041 Grenoble,France2 ANDRA, Parc de la Croix Blanche, 1/7 rue Jean Monnet, F-92298 Châtenay-Malabry CEDEX,France

42 / 204

43 / 204
ABSTRACT
Fe(II)-Ca(II), Fe(II)-Na(I), and Fe(II)-Ca(II)-Na(I) exchange experiments onmontmorillonite were performed in chloride background. These experiments show the possiblesorption of Fe2+ and FeCl+ ions pair in exchange site position. This result was confirmed with 77K 57Fe Mössbauer experiments. The results were modeled and the cation exchange selectivityfor Fe(II) is found to be nearly equal to this of Ca(II). The Vanselow activity coefficients, for Na-Fe2+ and Na-FeCl+ reactions respectively, were found to be equal to 0.4 (0.5 for Ca2+) and 2.3(2.5 for CaCl+). The sorption of chloride ions pairs with high affinity on montmorillonite seems tobe a common mechanism as first stated by Sposito et al. (Sposito et al., 1983a), and shouldhave implications on the chemistry of seawater sediments. Exchange selectivity coefficientsderived from this study and others were used to model experimental data on river water andseawater equilibrated particles. The agreement between simulations and experimental data isvery good. The simulation shows the predominance of monovalent ion sorption (Na+ andchloride ionic pairs) on clay particles in seawater. This sorption of monovalent ion contribute tothe dispersion of particles in seawater and to the extension of particles “plumes” away from thedelta of rivers like Amazon River. Besides, the high clay exchanger affinity for FeCl+ might havelead to a significant contribution of clay sedimentation in the Banded Iron Formation (BIF) at theproterozoic era.

44 / 204
INTRODUCTION
Aqueous ferrous iron is a major cation and an important reductant in a variety of naturalanoxic environments (eutrophic lakes, ocean and swamp sediments, hydromorphic soils, anoxicgroundwaters, fjords and ocean trenches). The fate of this cation depends on its uptake – orsorption – at the surface of natural particles, such as organic matter, oxides and phyllosilicates.Sorption mechanisms vary from uptake by hydrophobic forces to uptake leading to theformation of covalent bonds. On phyllosilicate surfaces, according to chemical analyses andspectroscopic studies, cations are sorbed by two distinct mechanisms: cation exchange in theinterlayer planes of the clay particles, and specific sorption at the edges of the platelets (e.g.Fletcher and Sposito, 1989; Charlet et al., 1993; Zachara and Smith, 1994; Bradbury andBaeyens, 1997, 1998; Schlegel et al., 2001b; Bradbury and Baeyens, 2002). The clay sorptioncapacity has been well established for a wide range of potential pollutants in Na+ and Ca2+
background cationic media. The influence of background anionic media such as Cl(-I) is poorlydocumented and data on sorption of Fe(II), a species which had a great importance in seawaterin the proterozoic era and is still important in anoxic surface water, does not exist. The aim ofthis study is the investigation of the Fe(II) sorption in cation exchange site positions in chloridemedium. The results are discussed in terms of Ca(II), Mg(II) and Fe(II) partitioning in chloriderich media, and the change of partitioning as particles move through an estuary.
MATERIALS AND METHODS
Chemicals
All solutions and suspensions were prepared in a glove box with boiled, argon-degassedMillipore Milli-Q 18 M��water. NaOH and HCl stock solutions were made from Titrisol ampoules.FeCl2, NaCl, and CaCl2 solutions were prepared from analytical grade salts.
Clay material preparation and characterization
MX80 clay sample (commercial Wyoming bentonite, reference BF100, CETCO France)material was obtained after an homogenization treatment from ANDRA (the French NationalRadioactive Waste Management Agency) and was dispersed in deionized water. The finefraction (< 2 µm) was isolated by sedimentation. After saturating the suspension with NaCl (0.5M), it was successively treated with a 0.1 M acetic acid, 0.5 M NaCl solution to removecarbonates, then with a dithionate-citrate-bicarbonate solution (DCB + 0.5 M NaCl), and finallywith 3% H2O2, 0.5 M NaCl to remove mineral impurities and organic matter (Schlegel, 2000).The final suspensions were washed with either 0.5 M NaCl or 0.05 M CaCl2 solutions and thenargon-degassed.
The fine fraction of the MX80 montmorillonite has the following structural formula (Tournassat etal., submitted-c):
(Si3.98Al0.02)(Al1.61Fe3+0.13Fe2+
0.02Mg0.24)O10(OH)2Na0.28 for the Na-saturated form and(Si3.98Al0.02)(Al1.61Fe3+
0.13Fe2+0.02Mg0.24)O10(OH)2Ca0.14 for the Ca-saturated form.
Its cation exchange capacity corresponds to its structural charge, i.e. is equal to about 0.76 eqkg-1 (Tournassat et al., submitted-b).
Fe(II) – Na(I), Fe(II) – Ca(II) and Fe(II) – Ca(II) – Na(I) Exchange experiments
Tournassat and Charlet have shown that Fe(II) sorbs specifically onto clay minerals inacidic conditions (Tournassat and Charlet, submitted). Hence, to avoid specific sorption ofFe(II), the following exchange experiments were conducted at low pH (pH value between 2.1

45 / 204and 3.6 depending on the experiment). We used the experiment procedure designed by Spositoet al. for exchange experiments (Sposito et al., 1981; Sposito et al., 1983a; Sposito et al.,1983b). All experiments were conducted in a N2/H2 atmosphere glove box in which the pO2 wasmonitored continuously by a Jacomex O2 sensor. The O2 content never exceeded 10 ppm in theglove box atmosphere. Centrifugation tubes were numbered and precisely weighed (mtube in g)with a Mettler Toledo AG285 balance. All volumes were added with a calibrated micropipette. Aknown volume of clay suspension was added in each 17-ml centrifuge tube (Vsusp, clay content�). Adequate volumes of acidified NaCl, CaCl2 and FeCl2 were then added (VNaCl, VCaCl2 andVFeCl2, concentrations CNaCl, CCaCl2 and CFeCl2). In each experiment, the concentrations of NaCl,CaCl2 and FeCl2 solutions were chosen to obtain a constant total normality of the finalsuspension. Total normalities and clay contents are shown in Tab. 3.3 for each experiment. Thetubes were shaken for one week, then centrifuged and filtrated . The pH was measured with amicroelectrode (Mettler Toledo, inlab 423). An aliquot of supernatant was filtrated and diluted forNa, Ca and Fe measurement. Na and Ca were measured on a Perkin-Elmer Optima 3300 DVinductively coupled plasma atomic emission spectrometer (ICP-AES). Fe(II) was measured inthe glove box on a HACH DR/2010 spectrophotometer using the O-phenantrolin method(Rodier, 1996). The centrifuged reaction tubes, containing the clay slurry, were weighed (mcentrif)and 10 ml of 1 M ammonium acetate were added to each tube. They were shaken for oneweek. The supernatant was then filtrated and diluted, and the concentration of Na and Ca weremeasured (NaAmm
Na and CaAmmNa respectively) by ICP-AES. Exchanged Na(I) and Ca(II) in eq
kg-1 were then calculated according to:
� �� �� ��
�
�
��������
�
susp
susptubecentrifNasol
NaAmm
Na VdVmmCdC
q10
in eq kg-1 Eq. 3.1
� �� �� ��
�
�
��������
��
susp
susptubecentrifCasol
CaAmm
Ca VdVmmCdC
q10
2 in eq kg-1 Eq. 3.2
where volumes are given in ml, concentration in mol l-1, clay content in g l-1 and masses in g.The density d of all solutions is taken equal to 1.0. The exchanged Fe(II) (qFe) was determinedby subtracting the Fe(II) measured in the supernatant (Cmeas
Fe) from total Fe(II) added in thetube (Cadded
Fe):
� ���
�
��
susp
Femeas
Feadded
Fe VCC
q 2 in eq kg-1 Eq. 3.3
The total Fe(II) corresponds to the Fe(II) added concentration plus the Fe(II) originatedfrom the dissolution of the clay material. This value was approximated using dissolutionexperiments at low pH and high Ca concentration to avoid re-adsorption of dissolved Fe(II) inexchange site position. The error bars were calculated using a 2% standard error on theconcentration measurements for Na, Ca and 3% for Fe(II).

46 / 204
ExperimentA
ExperimentB
ExperimentC
ExperimentD
ExperimentE
ExperimentF
pH 3.37 � 0.05 3.23 � 0.02 2.17 � 0.03 2.22 � 0.09 3.59 � 0.10 3.40 � 0.08Clay content(g l-1) 5.85 3.90 8.25 8.25 and
5.50 * 5.85 3.90
Cations Ca(II) –Fe(II)
Ca(II) –Fe(II)
Na(I) –Fe(II)
Na(I) –Fe(II)
Na(I) –Ca(II) –Fe(II)
Na(I) –Ca(II) –Fe(II)
T.N.(meq l-1) =[Cl-]
49 � 1 49 � 3 132 � 3 127 � 8 50 � 3 † 50 � 3 ‡
* 8.25 g l-1 for the first four experimental points and 5.50 g l-1 for the other experimentalpoints† [Ca(II)] = 13.1 mmol l-1 � 0.5‡ [Ca(II)] = 9.1 mmol l-1 � 0.3
Tab. 3.3 : Cation exchange experimental conditions
Mössbauer Experiments
The preparation of the samples was conducted in a Jacomex N2 atmosphere glove box inwhich the pO2 was monitored continuously by a Jacomex O2 sensor. For this experiment, TheO2 content never exceeded 1 ppm in the glove box atmosphere. 100 mg of 57Fe(0) weredissolved in concentrated HCl (0.1 mol l-1) at ~100°C. Then, the dissolved iron was put in theglove box and diluted in deionized water to a final volume of 100 ml, to obtain a ~1000 ppm57Fe(II) stock solution. The acidic conditions prevented the oxidation of the suspension prior toits transfer in the glove box. Several cycles of centrifugation and washing with deionized waterwere conducted to decrease the NaCl concentration in the Na-conditioned clay stocksuspension outside of the glove box. This washing of the clay facilitates the sorption of Fe(II) incation exchange site position by mass action phenomenon: the less Na+ in solution, the lesscompetitive Na+ in exchange site position. This new Na-conditioned clay stock suspension wasdegassed with a stream of N2 during one night, put in the glove box and allowed to equilibratewith the free O2 atmosphere during one day. Then, the suspension and the 57Fe(II) stocksolution were mixed to obtain a 57Fe(II) exchanged clay. After three days reaction time, thesample was centrifuged, the supernatant was removed and the clay slurry was frozen beforebeing transported to the Mössbauer facility. The Mössbauer spectrum of the Na-conditionedsmectite was recorded at 77 K using a constant acceleration spectrometer and a 57Co sourcediffused into a rhodium matrix. Velocity calibrations were made using �-Fe foil at 300 K. Thehyperfine parameters were refined using a least-squared fitting procedure (program MOSFIT,Teillet and Varret).
RESULTS
Exchange experiments
In many cation exchange studies (e.g. Sposito, 1981; McBride, 1994), the equivalentfraction of one cation in solution ( CatE~ , where Cat is a cation species) is plotted as a function ofthe equivalent fraction of the cation on the exchanger phase (ECat). For Fe(II) in a Na(I) – Ca(II)– Fe(II) system, these equivalent fractions are calculated according to the following formulas:

47 / 204
)]([)]([2)]([2)]([2~
INaIICaIIFeIIFeEFe
����
�� Eq. 3.4
NaCaFe
FeFe qqq
qE
��
� Eq. 3.5
where [Fe(II)], [Ca(II)] and [Na(I)] are the solution concentration of Fe(II), Ca(II) and Na(I) (in moll-1) respectively . Due to the large error bar on the measurement of sorbed Fe(II) in ourexperiments, the error on the EFe is large and no quantitative information can be obtained fromEFe. Thus, we decided to plot qi (in eq kg-1), the amount of sorbed cation species i, as a functionof the equivalent fraction of Fe(II) in solution ( FeE~ ). Figure 3.3 shows the results of theexchange experiments. As first stated by Sposito et al. (Sposito et al., 1983a; Sposito et al.,1983b) and re-demonstrated by Tournassat et al. (Tournassat et al., submitted-b; Tournassat etal., submitted-c), the sorbed amount of divalent species in Cl- anionic background is anapparent quantity, since ionic pairs (e.g. CaCl+, CaOH+…) are also adsorbed in cationexchange positions. Thus, the apparent CEC, which is equal to the sum of all qi, varies from oneexperiment to another (figure 1). For example, qCa in the first point of experiment A (i.e. in caseof a pure Ca – exchanged clay) is greater than qNa in the first point of experiment C (i.e. in caseof a pure Na-exchanged clay). This difference is due to the sorption of CaCl+ ionic pairs, whichare taken twice into account in Eq. 3.2 (Sposito et al., 1983a; Sposito et al., 1983b; Tournassatet al., submitted-c). If FeCl+ sorbed like CaCl+ on the clay exchanger phase, then one wouldexpect the apparent CEC to increase as a function of FeE~ in the Na(I)-Fe(II) exchangeexperiment. The trend of the results shown on Figure 3.3 confirms this point but the error barsassociated to qFe are too large to prove the sorption of FeCl+. Nevertheless, Fe(II) and Ca(II)seem to have the same overall behavior towards the clay exchanger phase. The Fe(II) – Ca(II)exchange is a homoionic exchange. Then, the non – preference isotherm is very easy to buildsince each desorbed Ca(II) corresponds to one adsorbed Fe(II). The experimental results ofexperiment A, plotted together with a non-preference isotherm, show that this non-preferenceisotherm fit perfectly the data. Then, we can conclude that FeCl+ sorb on the clay exchangerphase exactly in the way CaCl+ does.

48 / 204
0.00.10.20.30.40.50.60.70.80.91.0
0.0 0.2 0.4 0.6
q i (e
q kg
-1)
0.0
0.2
0.4
0.6
0.8
1.0
1.2
0.0 0.1 0.2 0.3 0.4
q i (e
q kg
-1)
0.00.10.20.30.40.50.60.70.80.91.0
0.0 0.2 0.4 0.6 0.8
q i (e
q kg
-1)
0.0
0.2
0.4
0.6
0.8
1.0
1.2
1.4
0.0 0.2 0.4 0.6
q i (e
q kg
-1)
0.00.10.20.30.40.50.60.70.80.91.0
0.0 0.2 0.4 0.6
q i (e
q kg
-1)
0.00.10.20.30.40.50.60.70.80.91.0
0.0 0.2 0.4 0.6
q i (e
q kg
-1)
A B
C D
E F
FeE~
FeE~
i = Ca(II)
i = Na(I)
i = Fe(II)
i = Ca(II)
i = Ca(II) i = Ca(II)
i = Na(I)
i = Na(I) i = Na(I)
i = Fe(II)
i = Fe(II)
i = Fe(II)
i = Fe(II)
i = Fe(II)
Figure 3.3 : Fe(II) – Na(I) and Fe(II) – Ca(II) exchange data plotted as equivalent sorbedamount of ion i (qi, eq kg-1), together with simulations whose parameters are given in Tab. 3.4.Experimental conditions are given in Tab. 3.3.
Model
The Vanselow convention (Vanselow, 1932; Sposito, 1981) was used to model the data.The Phreeqc2 code (Parkhurst and Appelo, 1999) is used as this versatile computer code is

49 / 204amenable to the various conventions used to describe cation exchange and surfacecomplexation. The Llnl.dat database is used for the calculation of speciation in solution togetherwith the structural CEC of the MX80 montmorillonite and the cation exchange selectivitycoefficients for H+, Na+, Ca2+ and CaCl+, obtained from Tournassat et al. (Tournassat et al.,submitted-b), allowing only two parameters to be refined: the cation exchange selectivitycoefficients for Fe2+ and FeCl+. The refined values are shown in Tab. 3.4. We need to slightlyadjust the previously obtained Ca2+ exchange selectivity coefficient to obtain a better fit of thedata, but this adjustment lies in the error bar of the given parameter (Tournassat et al.,submitted-b). Figure 3.3 shows the goodness of the fit. According to the goodness of fit reportedin Figure 3.3, one has to emphasize that binary systems – Na(I)-Fe(II) or Ca(II)-Fe(II) –, as wellas ternary systems – Na(I)-Ca(II)-Fe(II) – are described in the limits of the error bars. It was notpossible to fit the data reasonably well without introducing a cation exchange selectivitycoefficient for FeCl+. Fe2+ and Ca2+ have similar exchange selectivity coefficients (log Kv = 0.4and 0.5 in respect with Na+, respectively). CaCl+ has a greater exchange selectivity coefficientthan that of FeCl+ (log Kv = 2.5 and 2.3 in respect with Na+, respectively), but the associationconstant of reaction (Llnl.dat database, given with the Phreeqc2 new version)
Ca2+ + Cl- � CaCl+ log Ka = -0.696
is weaker than the association constant of reaction
Fe2+ + Cl- � FeCl+ log Ka = -0.167
Thus, CaCl+ is slightly preferred over FeCl+ on the exchanger phase, but FeCl+ forms ingreater amount than CaCl+, at equal solution total normality. Consequently, the two ion pairs aresorbed in comparable amounts and, as a result, the clay exchanger appears not to have anypreference for Fe(II) or Ca(II): Figure 3.3A looks the same as Figure 3.4. For comparison,Sposito et al. (Sposito et al., 1983a) had demonstrated the high affinity of clay surface for MgCl+ion pairs, Ca(II) and Mg(II) behaving similarly towards exchange on clay in chloride ionicbackground. Their experimental Mg(II)-Na(I) exchange data in ClO4
- and Cl- ionic media werefitted (Figure 3.5), together with Ca(II)-K(I) exchange data from Jensen (Jensen, 1973) (Figure3.6). The results of the fitting procedure (Tab. 3.4) indicate that:
the Mg2+ - Na+ and Ca2+ - Na+ exchange reactions have close cation exchange selectivitycoefficients (log Kv = 0.4 and 0.5, respectively);
the MgCl+ - Na+ exchange selectivity coefficient (log Kv = 1.9) corresponds to the differencebetween the association reaction constants for CaCl+ (log Ka = -0.6956) and MgCl+ (log Ka = -0.1349) ionic pairs formation plus the CaCl+ - Na+ exchange selectivity coefficient (log Kv = 2.5)and then, at equal solution total normality, MgCl+ and CaCl+ have the same apparent affinity forclay exchange sites;
the MgCl+ - Na+, CaCl+ - Na+, and FeCl+ - Na+ exchange selectivity coefficients are significantlylarger than the K+-Na+ and H+-Na+ exchange selectivity coefficient.

50 / 204
0.00.10.20.30.40.50.60.70.80.91.0
0.0 0.2 0.4 0.6
q i (
eq k
g-1)
FeE~
i = Fe(II)
i = Ca(II)
Figure 3.4 : Comparison of Fe(II) – Ca(II) exchange data with a non-preference isotherm (seetext for details).

51 / 204
0
0.2
0.4
0.6
0.8
1
1.2
0.0 0.5 1.0
q i(e
q kg
-1)
0
0.2
0.4
0.6
0.8
1
1.2
0.0 0.5 1.0
q i (
eq k
g-1)
MgE~
i = Mg(II)
i = Na(I)
i = Na(I)
i = Mg(II)
Figure 3.5 : Mg(II) – Na(I) exchange isotherm. Experimental data are from Sposito et al.(Sposito et al., 1983a). Model curves were computed with the parameters given in Tab. 3.4.Top: experiment in ClO4
- anionic background medium. Bottom: experiment in Cl- anionicbackground medium

52 / 204
KE~
0
0.2
0.4
0.6
0.8
1
0 0.2 0.4 0.6 0.8 1
q i (e
q kg
-1)
0
0.2
0.4
0.6
0.8
1
0 0.2 0.4 0.6 0.8 1
q i (e
q kg
-1)
Figure 3.6 : Ca(II) – K(I) exchange isotherm dependence on the ionic strength (Chloridemedium). Data are from Jensen (Jensen, 1973) and simulated curves were computed with theselectivity coefficients given in Tab. 3.4. The data are plotted as apparent equivalent sorbedamounts (qi where i denotes K+, circles, or Ca(II), diamonds) as a function of equivalent K+
fraction in solution. Ionic strength: I = 0.005 mol l-1 (top), and 0.05 mol l-1 (bottom). Error barswere not available from reference publication.
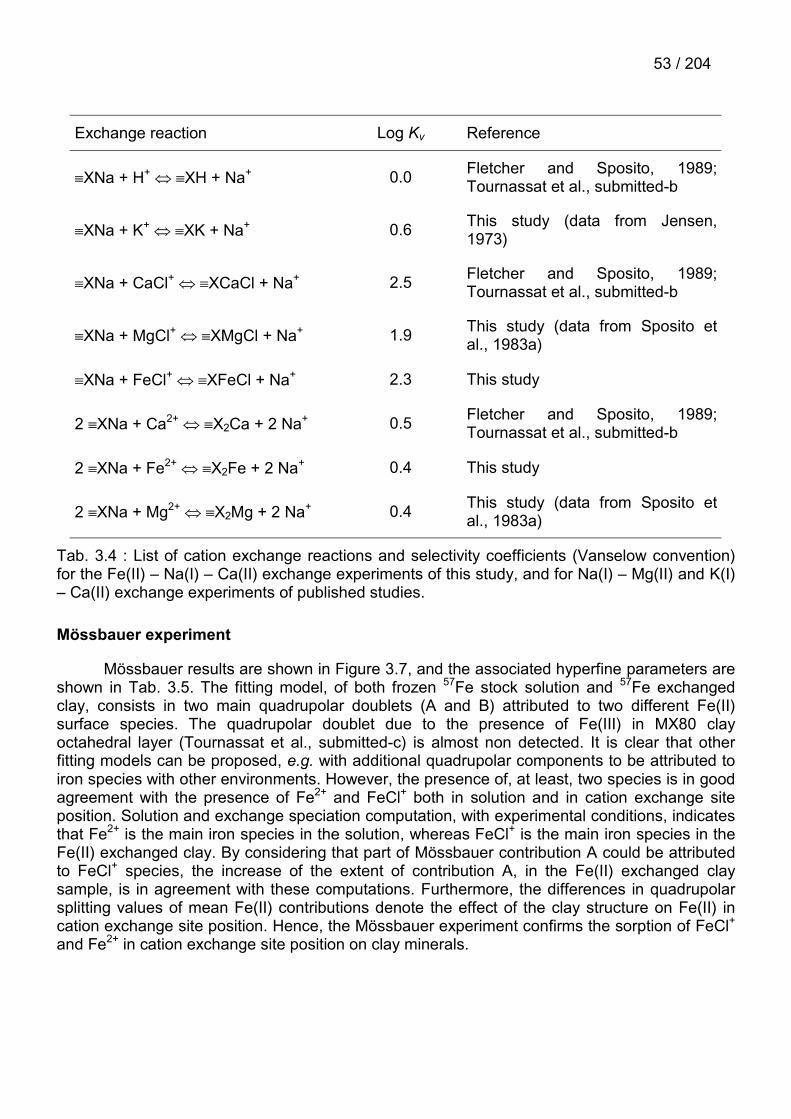
53 / 204
Exchange reaction Log Kv Reference
�XNa + H+ � �XH + Na+ 0.0 Fletcher and Sposito, 1989;Tournassat et al., submitted-b
�XNa + K+ � �XK + Na+ 0.6 This study (data from Jensen,1973)
�XNa + CaCl+ � �XCaCl + Na+ 2.5 Fletcher and Sposito, 1989;Tournassat et al., submitted-b
�XNa + MgCl+ � �XMgCl + Na+ 1.9 This study (data from Sposito etal., 1983a)
�XNa + FeCl+ � �XFeCl + Na+ 2.3 This study
2 �XNa + Ca2+ � �X2Ca + 2 Na+ 0.5 Fletcher and Sposito, 1989;Tournassat et al., submitted-b
2 �XNa + Fe2+ � �X2Fe + 2 Na+ 0.4 This study
2 �XNa + Mg2+ � �X2Mg + 2 Na+ 0.4 This study (data from Sposito etal., 1983a)
Tab. 3.4 : List of cation exchange reactions and selectivity coefficients (Vanselow convention)for the Fe(II) – Na(I) – Ca(II) exchange experiments of this study, and for Na(I) – Mg(II) and K(I)– Ca(II) exchange experiments of published studies.
Mössbauer experiment
Mössbauer results are shown in Figure 3.7, and the associated hyperfine parameters areshown in Tab. 3.5. The fitting model, of both frozen 57Fe stock solution and 57Fe exchangedclay, consists in two main quadrupolar doublets (A and B) attributed to two different Fe(II)surface species. The quadrupolar doublet due to the presence of Fe(III) in MX80 clayoctahedral layer (Tournassat et al., submitted-c) is almost non detected. It is clear that otherfitting models can be proposed, e.g. with additional quadrupolar components to be attributed toiron species with other environments. However, the presence of, at least, two species is in goodagreement with the presence of Fe2+ and FeCl+ both in solution and in cation exchange siteposition. Solution and exchange speciation computation, with experimental conditions, indicatesthat Fe2+ is the main iron species in the solution, whereas FeCl+ is the main iron species in theFe(II) exchanged clay. By considering that part of Mössbauer contribution A could be attributedto FeCl+ species, the increase of the extent of contribution A, in the Fe(II) exchanged claysample, is in agreement with these computations. Furthermore, the differences in quadrupolarsplitting values of mean Fe(II) contributions denote the effect of the clay structure on Fe(II) incation exchange site position. Hence, the Mössbauer experiment confirms the sorption of FeCl+and Fe2+ in cation exchange site position on clay minerals.

54 / 204
-3 0 3
0,94
0,96
0,98
1,00
rela
tive
trans
mis
sion
V [mm/s]
-3 0 3
0,90
0,95
1,00
rela
tive
trans
mis
sion
V [mm/s]
Rel
ativ
e tr
ansm
issi
onR
elat
ive
tran
smis
sion
V (mm s-1)-3 0 3
Fe(III) contribution
57Fe exchanged clay
57Fe stock solution
Figure 3.7 : Dots: 77 K Mössbauer spectrum of 57Fe exchanged clay (top) and frozen 57Fe stocksolution (bottom). Thin lines: sum of all the contributions of the decomposition. The parametersof the decomposition are given in Tab. 3.5. Contributions of Fe(II) A and Fe(II) B are summedup. Arrows indicate the contribution of Fe(III).

55 / 204
I.S.
mm s-1
�
mm s-1
Q.S.
mm s-1
%
Fe(II) A 1.37 (0.01) 0.29 (0.04) 3.37 (0.05) 40 (5)
Fe(II) B 1.36 (0.01) 0.47 (0.04) 3.02 (0.05) 60 (5)Frozen 57Festock solution
Mean A+B 1.36 (0.02) 3.13 (0.05) 100
Fe(II) A 1.38 (0.01) 0.30 (0.04) 3.43 (0.05) 63 (5)
Fe(II) B 1.40 (0.01) 0.49 (0.04) 3.10 (0.05) 37 (5)57Feexchangedclay
Mean A+B 1.39 (0.02) 3.31 (0.05) 100
I.S. = isomer shift value quoted to that of �-Fe at 300 K; � = linewidth; Q.S. =quadrupolar splitting value ; % = ratio of each component.
Tab. 3.5 : Mössbauer parameters of the 57Fe-exchanged smectite and of the HCl acidified 57Fefrozen solution. Error bars are indicated in parenthesis.
DISCUSSION
The clay high affinity for chloride-bivalent cation ion pairs should have importantimplications in the modifications in exchanger composition of river suspended particles as theyenter seawater. This change is modelled based on the cation exchange selectivity coefficientsgiven in Tab. 3.4.
The Saylest and Mangelsdorf’s study on Amazon River particles (Saylest andMangelsdorf, 1979) was taken as a reference experimental study, as the Amazon River carriesa large amount of clay particles. Indeed the < 2 µm fraction of Amazon River suspendedparticles represents 54 % of the CEC. In this study, the authors measured the composition ofthe river particle exchanger, together with the cation composition of the river water. Afterwards,they equilibrated their particles with seawater and analysed the composition of the exchanger.Since no data on anionic composition is given, concentrations of HCO3
- and Cl- were chosen sothat (i) [HCO3
-] + [Cl-] is equal to the total equivalent concentration of cations in solution and (ii)[Cl-] is equal to 0.13 mmol l-1 (= mean Cl- concentration in South America river water: Holland,1978). We considered a simplified composition of ocean water, shown in Tab. 3.6, to calculatethe clay exchanger composition in seawater.
Figure 3.8 and Figure 3.9 show the good agreement between experimental and modeledequivalent sorbed fraction (XMe) on the particles in equilibrium with Amazon River. Therefore amodel based on montmorillonite surface chemistry is able to simulate these river sedimentsalthough the < 2 µm fraction of these sediments represents only 54 % of the total CEC andalthough kaolinite is quite widely reported in Amazonian environment. This may account for theunderestimation of K+ sorption (Figure 3.9). By analyzing more precisely the results of thesimulation, we note that the major cations on the exchanger are Ca2+ and Mg2+. CaCl+ andMgCl+ do not sorbed in any significant amount on the particles, since the river water is a dilutesystem (Imean � 0.6 mmol l-1) and Cl- is not the predominant anion.
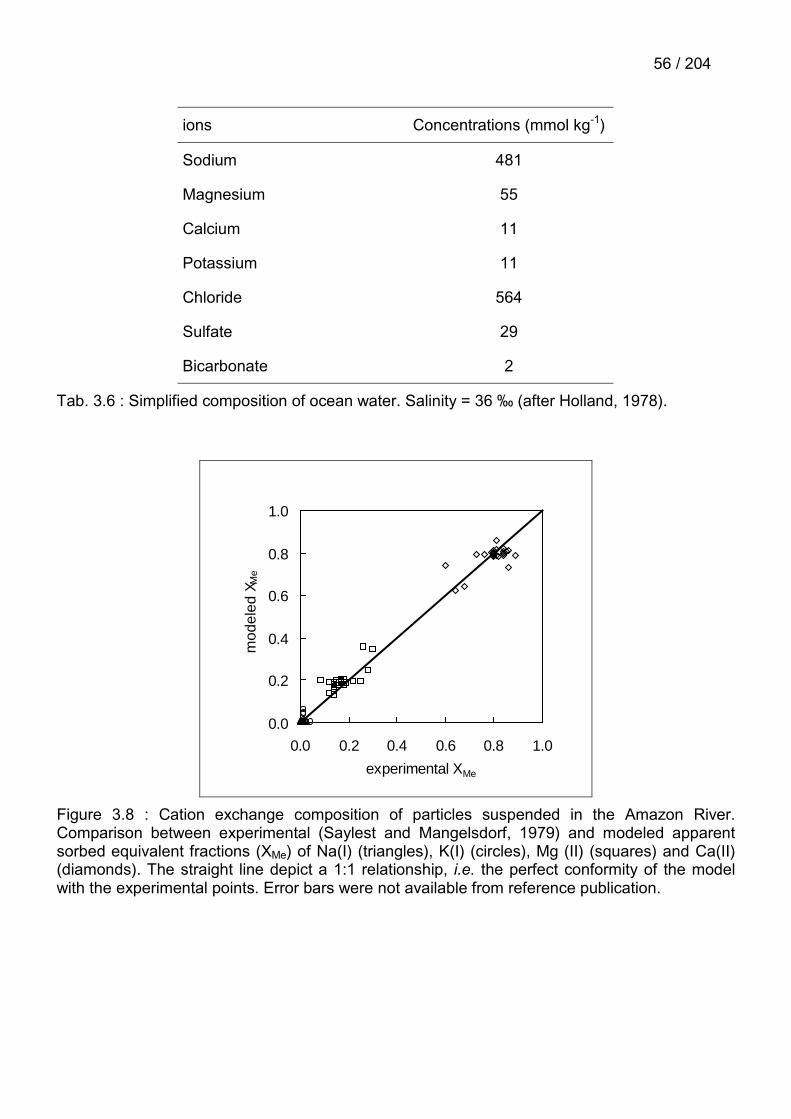
56 / 204
ions Concentrations (mmol kg-1)
Sodium 481
Magnesium 55
Calcium 11
Potassium 11
Chloride 564
Sulfate 29
Bicarbonate 2
Tab. 3.6 : Simplified composition of ocean water. Salinity = 36 ‰ (after Holland, 1978).
0.0
0.2
0.4
0.6
0.8
1.0
0.0 0.2 0.4 0.6 0.8 1.0
experimental XMe
mod
eled
XM
e
Figure 3.8 : Cation exchange composition of particles suspended in the Amazon River.Comparison between experimental (Saylest and Mangelsdorf, 1979) and modeled apparentsorbed equivalent fractions (XMe) of Na(I) (triangles), K(I) (circles), Mg (II) (squares) and Ca(II)(diamonds). The straight line depict a 1:1 relationship, i.e. the perfect conformity of the modelwith the experimental points. Error bars were not available from reference publication.

57 / 204
Mg(II)
0.0
0.1
0.2
0.3
0.4
0.5
0.0 0.1 0.2 0.3 0.4 0.5
mod
eled
Ca(II)
0.5
0.6
0.7
0.8
0.9
1.0
0.5 0.6 0.7 0.8 0.9 1.0
Na(I)
0.000
0.005
0.010
0.015
0.020
0.025
0.000 0.005 0.010 0.015 0.020 0.025experimental
K(I)
0.00
0.01
0.02
0.03
0.04
0.05
0.00 0.01 0.02 0.03 0.04 0.05
experimental
mod
eled
Figure 3.9 : Details of Figure 3.7. Cation exchange composition of particles suspended in theAmazon River. Comparison between experimental (Saylest and Mangelsdorf, 1979) andmodeled apparent sorbed equivalent fractions (XMe) of Na(I) (triangles), K(I) (circles), Mg (II)(squares) and Ca(II) (diamonds). The straight line depict a 1:1 relationship, i.e. the perfectconformity of the model with the experimental points. Error bars were not available fromreference publication.
Saylest and Mangelsdorf (Saylest and Mangelsdorf, 1979) have equilibrated theirparticles with seawater and analysed the changes in exchanger composition. As already stated,their experimental measurement method leads to an apparent overestimation of metalequivalent fraction, as they did take twice into account the amount of CaCl+ and MgCl+ sorbedonto the solid. The mean values for Na(I), Mg(II), Ca(II), and K(I) experimental sorbedequivalent fractions are shown in Tab. 3.7, for particles equilibrated with seawater, together withthe equivalent fractions calculated with the exchange selectivity coefficients for montmorillonitetaking account free species cation exchange listed in Tab. 3.4. As shown in Tab. 3.7 in thirdcolumn, Amazon particles suspended in seawater show an exchanged composition at variancewith that predicted, based on cation exchange of free species only, i.e. not of ionic pairs. On thecontrary, the simulation including ionic pairs adsorption, while underestimating slightly thesorbed Na(I) and Ca(II) fraction, and overestimating slightly the Mg(II) sorbed fraction, givesaltogether a much better account of the experimental exchanger composition. The < 2 µm claycontribution to the CEC of sediment collected in Saylest and Mangelsdorf’s study is

58 / 204approximately 50%. Then, the difference between the simulated and the experimental resultsfor K+ might originate from the presence of illite or kaolinite whose cation exchange selectivitycoefficients are greater than in case of montmorillonite particles (Jensen, 1973). The activitycoefficient of ionic species can also lead to some inaccuracy, since one may only use, withPhreeqc2, the Davies or Debye-Hückel activity coefficient relations, which are not appropriateconventions for concentrated systems. However, in general, the whole tendency of sorption isrespected and the sorption of ionic pairs (CaCl+ and MgCl+) are obviously taking place in marineenvironment, due to high Ca(II), Mg(II) and Cl(-I) concentrations. Then, as particle move in theestuary, the surface of Amazonian clay particles becomes increasingly saturated with MgCl+,Na+, and CaCl+ species, i.e. with monovalent species. The critical coagulation concentration forthese species is two orders of magnitude higher for monovalent than for divalent species (e.g.Sposito, 1984) and thus, the particles will tend not to flocculate, i.e. to remain monodispersed,against what could be expected from the double layer thickness contraction observed as ionicstrength increases. This clearly contributes to the formation of the particles “plume” which isobserved several hundred km away from the Amazon River delta, e.g. along the Guyanacoasts.
Cation
Experimental sorbedequivalent fraction
(Saylest and Mangelsdorf,1979)
modeled sorbedequivalent fraction
(model without ionicpairs)
modeled sorbedequivalent fraction(model with ionic
pairs)
Na(I) ~ 38 % 72 % 29 %
Mg(II) ~ 38 % 18 % 57 %
Ca(II) ~ 15 % 4 % 11.5 %
K(I) ~ 9 % 6 % 2.5 %
Tab. 3.7 : Comparison of measured and simulated equivalent fraction of main cations sorbed onAmazon River suspended particles equilibrated with seawater . Simulation parameters aregiven in Tab. 3.4.
In Figure 3.10A, the sorbed equivalent fraction of major cations on a montmorillonite clayis computed, in seawater, as a function of possible Fe(II) concentrations in solution, showing thehigh affinity of the clay exchanger for FeCl+. Figure 3.10B shows the repartition of Fe(II) specieson the exchanger phase: almost all surface ferrous iron is present as FeCl+. In the Proterozoicera global ocean, as well as yet in the Black Sea or in the Carioca Trench, seawater was or isrich in dissolved ferrous iron (Holland, 1978; Millero, 2002). Since sedimentation of clayparticles could remove a high amount of FeCl+ present as cation exchange species, claysedimentation might have played a significant role in the Banded Iron Formation (BIF) at theProterozoic era.

59 / 204
0
5
10
15
20
25
30
35
40
45
50
0 5 10 15 20
Fe(II) concentration in solution (mmol l-1)
equi
vale
nt s
orbe
d fr
actio
n (%
)
CaCl+
FeCl+
Na+
MgCl+ A
FeCl+
Fe2+
B
0
10
20
30
40
50
60
70
80
90
100
0 5 10 15 20
Fe(II) concentration in solution (mmol l-1)
Per
cent
age
of s
orbe
d F
e(II)
spe
cies
[Fe(II)] (mmol l-1)
[Fe(II)] (mmol l-1)
100
× q
Fe(
II)/Q
100
× q
i/Q
Figure 3.10 : A. Simulation of a montmorillonitic exchanger phase composition at equilibriumwith seawater as a function of a hypothetical Fe(II) content in paleo - seawaters. Monovalentspecies (Na+ or Cl- - divalent cation ion pairs) are the main components of sorbed species. B.Partitioning of Fe(II) species on the exchanger phase as a function of Fe(II) concentration inseawater.
ACKNOWLEDGEMENTS
This research was partially funded by the French National radioactive waste managementagency (ANDRA), and by the CNRS “Geomex” grant. Mössbauer facilities at the “Laboratoire dePhysique de l'Etat Condensé” in the University of Maine (Le Mans, France) were used. Specialthanks to J.M. Greneche for his help with the Mössbauer.

60 / 204
3.2. ADSORPTION SPECIFIQUE DU FE(II) SUR LES MONTMORILLONITES ETPHENOMENES DE COMPETITION
Des expériences d’adsorption du Fe(II) sur l’argile montrent la très forte affinité de cetélément pour les bordures des argiles (Figure 3.11).
0.000
0.005
0.010
0.015
0.020
1 2 3 4 5 6 7
pH
Qua
ntité
de
Fe(
II ) a
d so r
b ée
(m
ol k
g-1 ar
g ile
)
Figure 3.11 : isotherme d’adsorption du Fe(II) en fonction du pH. Conditions expérimentales :1.7 g d’argile l-1, [Fe(II)]totale =26 µM, fond ionique 1 mol l-1 NaCl.
Après modélisation des résultats, grâce à un modèle déjà disponible dans la littérature(Bradbury and Baeyens, 1997), il est apparu que l’affinité du Fe(II) pour les bordures de l’argileétait au moins 1000 fois plus importante que celle d’autres cations divalents pourtant similaires(Zn2+ et Ni2+). Un grand nombre de polluants (métaux lourds par exemple) peut être fixé par lesargiles des aquifères et des sols. La présence de Fe(II) en grande concentration pourrait limitercette action « nettoyante » des argiles en libérant les polluants déjà présents (effet compétitif,Figure 3.12) ou en empêchant de nouveaux polluants de se fixer (effet de saturation des sites,Figure 3.12). Dans l’article qui suit, l’effet compétitif est prouvé dans le système Fe(II) – Zn(II)sur un type de site de sorption spécifique.

61 / 204
MeMe
Me
FeFeFeFe
Me
Fe
Fe
Effet de compétition
Effet de saturation
Figure 3.12. Illustration des principes de l’effet de saturation et de l’effet compétitif. Mereprésente un cation métallique pouvant s’adsorber sur les mêmes sites que le Fe(II).

62 / 204

63 / 204
COMPETITIVE SPECIFIC SORPTION OF FE(II) ON CLAY MINERALS INANOXIC WATERS
Christophe Tournassat1, 2, Laurent Charlet1
1 LGIT - CNRS/UJF, Université Joseph Fourier (Grenoble), P.O. Box 53, F 38041 Grenoble, France
2 ANDRA, Parc de la Croix Blanche, 1/7 rue Jean Monnet, F-92298 Châtenay-Malabry CEDEX, France

64 / 204

65 / 204
ABSTRACT
Clay minerals are among the most efficient natural materials for immobilizing pollutants innatural and engineered systems. Although clay affinity has been well established for a widerange of pollutants in Na+ and Ca2+ salt backgrounds, clay sorption capacity in iron-containingwaters is poorly documented. In this study, we show that Fe(II) can strongly sorb to smectiteparticles. Complexation constants for Fe(II) specific sorption on clay edge reactive sites aremuch higher than those published for other divalent cations, such as Zn(II) and Ni(II). Thus,based on thermodynamic models, sorption of Fe(II) on clay particles may potentially have astrong impact on the clay immobilization capacity towards a variety of inorganic pollutants inanoxic environments. Fe(II) – Zn(II) competitive sorption experiments clearly show that Fe(II)displaces Zn(II) on clay edge sites. This competition could lead to a weakening of clayimmobilization capacity towards heavy metals and radionuclides in natural iron-rich ground- andpore-waters, and in engineered systems such as zero-valent iron permeable reactive barriersand deep radioactive waste depository sites.
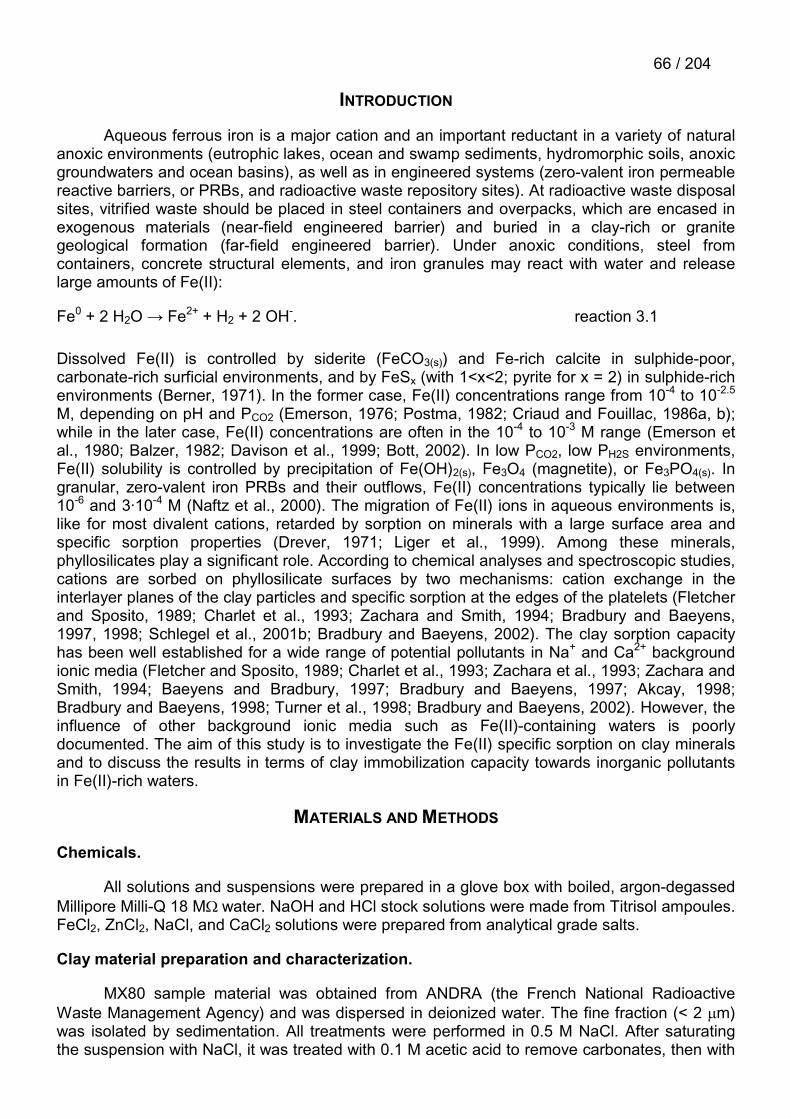
66 / 204
INTRODUCTION
Aqueous ferrous iron is a major cation and an important reductant in a variety of naturalanoxic environments (eutrophic lakes, ocean and swamp sediments, hydromorphic soils, anoxicgroundwaters and ocean basins), as well as in engineered systems (zero-valent iron permeablereactive barriers, or PRBs, and radioactive waste repository sites). At radioactive waste disposalsites, vitrified waste should be placed in steel containers and overpacks, which are encased inexogenous materials (near-field engineered barrier) and buried in a clay-rich or granitegeological formation (far-field engineered barrier). Under anoxic conditions, steel fromcontainers, concrete structural elements, and iron granules may react with water and releaselarge amounts of Fe(II):
Fe0 + 2 H2O → Fe2+ + H2 + 2 OH-. reaction 3.1
Dissolved Fe(II) is controlled by siderite (FeCO3(s)) and Fe-rich calcite in sulphide-poor,carbonate-rich surficial environments, and by FeSx (with 1<x<2; pyrite for x = 2) in sulphide-richenvironments (Berner, 1971). In the former case, Fe(II) concentrations range from 10-4 to 10-2.5
M, depending on pH and PCO2 (Emerson, 1976; Postma, 1982; Criaud and Fouillac, 1986a, b);while in the later case, Fe(II) concentrations are often in the 10-4 to 10-3 M range (Emerson etal., 1980; Balzer, 1982; Davison et al., 1999; Bott, 2002). In low PCO2, low PH2S environments,Fe(II) solubility is controlled by precipitation of Fe(OH)2(s), Fe3O4 (magnetite), or Fe3PO4(s). Ingranular, zero-valent iron PRBs and their outflows, Fe(II) concentrations typically lie between10-6 and 3·10-4 M (Naftz et al., 2000). The migration of Fe(II) ions in aqueous environments is,like for most divalent cations, retarded by sorption on minerals with a large surface area andspecific sorption properties (Drever, 1971; Liger et al., 1999). Among these minerals,phyllosilicates play a significant role. According to chemical analyses and spectroscopic studies,cations are sorbed on phyllosilicate surfaces by two mechanisms: cation exchange in theinterlayer planes of the clay particles and specific sorption at the edges of the platelets (Fletcherand Sposito, 1989; Charlet et al., 1993; Zachara and Smith, 1994; Bradbury and Baeyens,1997, 1998; Schlegel et al., 2001b; Bradbury and Baeyens, 2002). The clay sorption capacityhas been well established for a wide range of potential pollutants in Na+ and Ca2+ backgroundionic media (Fletcher and Sposito, 1989; Charlet et al., 1993; Zachara et al., 1993; Zachara andSmith, 1994; Baeyens and Bradbury, 1997; Bradbury and Baeyens, 1997; Akcay, 1998;Bradbury and Baeyens, 1998; Turner et al., 1998; Bradbury and Baeyens, 2002). However, theinfluence of other background ionic media such as Fe(II)-containing waters is poorlydocumented. The aim of this study is to investigate the Fe(II) specific sorption on clay mineralsand to discuss the results in terms of clay immobilization capacity towards inorganic pollutantsin Fe(II)-rich waters.
MATERIALS AND METHODS
Chemicals.
All solutions and suspensions were prepared in a glove box with boiled, argon-degassedMillipore Milli-Q 18 M��water. NaOH and HCl stock solutions were made from Titrisol ampoules.FeCl2, ZnCl2, NaCl, and CaCl2 solutions were prepared from analytical grade salts.
Clay material preparation and characterization.
MX80 sample material was obtained from ANDRA (the French National RadioactiveWaste Management Agency) and was dispersed in deionized water. The fine fraction (< 2 m)was isolated by sedimentation. All treatments were performed in 0.5 M NaCl. After saturatingthe suspension with NaCl, it was treated with 0.1 M acetic acid to remove carbonates, then with
67 / 204dithionate-citrate-bicarbonate (DCB), and finally with 3% H2O2 to remove mineral impurities andorganic matter. The final suspensions were washed with either 0.5 M NaCl or 0.05 M CaCl2solutions.
The fine fraction of the MX80 montmorillonite has the following structural formula in theNa-saturated form (Sauzéat et al., 2001):
(Si3.98Al0.02)(Al1.55Fe3+0.09Fe2+
0.08Mg0.28)O10(OH)2Na0.38
and the following formula in the Ca-saturated form:
(Si3.98Al0.02)(Al1.55Fe3+0.09Fe2+
0.08Mg0.28)O10(OH)2Ca0.19
The X ray diffraction patterns were found to be in agreement with Na- and Ca-saturatedsmectites and showed that few impurities (mostly quartz and cristobalite) were present afterpreparation.
Fe(II) specific sorption experiments.
All experiments were conducted in a N2/H2 atmosphere glove box in which the pO2 wasmonitored continuously by a Jacomex O2 sensor. The O2 content never exceeded 10 ppm in theglove box atmosphere. For sorption experiments a constant flux of purified N2 gas ensured thatthe suspensions were under O2- and CO2-free conditions in the reactor. N2 gas was purified bybubbling it through acidic (H2SO4, 10%) and basic (NaOH, 10%) solutions to remove impurities,including possible traces of CO2, and then through a solution of the ionic medium (NaCl orCaCl2) to saturate the gas with water. After 1 – 2 hours of purging, pyrogallol powder was addedto the NaOH solution to reduce any remaining O2. The redox potential of the suspension wasmonitored with a Pt combined redox electrode.
Cation exchange between Fe(II) ions and the clay surface was minimized by using aconcentrated salt background solution, which limits cation exchange by mass effect (Fletcherand Sposito, 1989). The total normality of the suspensions was fixed between 0.5 and 1 M in aNaCl ionic background or 0.05 and 1 M in a CaCl2 ionic background, depending on the totalFe(II) added to the system.
Experiments were carried out in 350-mL glass reactors in which an aliquot of clay stocksuspension was added to a NaCl or CaCl2 ionic background solution. The suspension wasacidified with HCl to a pH between 1 and 2 and then allowed to reach a quasi-equilibriumovernight (approximately 16 hrs), upon which FeCl2 solution was added. The total Fe(II)concentration and clay content varied from one experiment to another and are indicated in thelegend of figures 1 and 2. Sorption experiments proceeded by increasing the pH incrementallywith successive additions of NaOH until all Fe(II) was sorbed. After each addition of NaOH, a 10ml sample of suspension was filtered through a 0.22 µm pore size membrane and analyzed fordissolved Fe(II) using two spectrophotometric methods: the Ferrozin method (Viollier et al.,2000) and the O-phenantrolin method (Rodier, 1996). The Ferrozin method was used tomeasure separately Fe(II) and Fe(III) concentrations up to 30 µM, and to check that no Fe(II) toFe(III) oxidation occurred in solution. The O-phenantrolin method was used to measure Fe (II)concentrations up to 200 µM, before dilution.
Equilibrium was assumed when either the Fe(II) concentration or the pH were constant(i.e. no change in the Fe(II) concentration within the precision of the analytical method (~ � 2%),or no variation in the pH greater than 0.02 pH units for more than 15 minutes). These criteriaare operational as the clay particles dissolve at pH<4, and hence true equilibrium cannot beattained. Preliminary experiments showed that Fe(II) sorbs onto clay mineral surfaces at very

68 / 204low pH (down to pH 2). Hence, some Fe(II) could have already been sorbed on the clay prior to
the experiments. In order to desorb this iron, clay suspensions were “equilibrated” at pH1.5 – 2 before each experiment . The sorbed Fe(II) was determined as the difference betweenthe initial dissolved Fe(II) – i.e. the sum of initial Fe(II) and the added Fe(II) – and the dissolvedFe(II) after each addition of NaOH. At the end of each experiment, the pH was dropped tobelow pH 2 and all the Fe(II) was allowed to desorb back into solution. Preliminary experimentsconfirmed that desorption of Fe(II) is much slower (~ 1 day) than sorption (~ 1 hour, dependingon the pH). The final dissolved Fe(II) in solution was compared to the initial total dissolved Fe(II)to confirm that sorption was fully reversible and that no reactions, besides sorption, hadoccurred.
Zn – Fe(II) competition experiment.
In a separate competition experiment, a clay suspension was prepared and allowedequilibrating overnight at pH 5.82. In order to minimize any influence of a pH change, thesuspension was pH buffered with a 0.1 M HEPPS buffer (4-(2-Hydroxyethyl)-piperazine-1-propane-sulfonic acid) and remained at a pH of 5.82 � 0.02 throughout the experiment. Sorptionvia cation exchange was minimized using a 0.05 M CaCl2 background solution. Zn(II) wasadded to the suspension and allowed to sorb specifically on strong sites. After 73 hrs, Fe(II) wasadded to the suspension and the subsequent desorption of Zn was monitored. For thisexperiment, the O2 content of the confined atmosphere never exceeded 0.5 ppm. Otherexperimental conditions were chosen on the basis of calculated Zn sorption edges afterBradbury and Baeyens data and models (Bradbury and Baeyens, 1998). The clay content in thesuspension was 3.5 g/L. The added dissolved Zn was 3.6 10-6 mol L-1, i.e. ~0.83 mmol of Znper kg of clay. After 73 hours, 0.63 mmol of Zn per kg of clay was sorbed and Fe(II) was addedto the suspension; the added Fe(II) concenetration in the suspension was ~69 10-6 mol L-1.Zn(II) concentrations were measured using a Perkin-Elmer Optima 3300 DV inductively coupledplasma atomic emission spectrometer (ICP-AES).
RESULTS AND DISCUSSION
Figure 3.13 presents the results of the specific sorption experiments. Results ofexperiments during which Fe(OH)3 could have precipitated, based on thermodynamiccalculations made using Phreeqc2 (Parkhurst and Appelo, 1999), were excluded. The sorptionisotherms are represented as the percentage of sorbed iron as a function of pH and shows howefficiently Fe(II) sorbs onto clay particles. Figure 3.13A corresponds to an experiment where noFe(II) was added to the suspension at the start of the experiment, and thus represents thesorption curve of the initially desorbed Fe(II). Figure 3.13B corresponds to a sorptionexperiment conducted with the same suspension after decreasing the pH down to pH = 1.7 andadding a small amount of Fe(II). Between pH 2 and 4, the amount of sorbed Fe(II) is higher inFigure 3.13B than in Figure 3.13A.

69 / 204
0
20
40
60
80
100
1 2 3 4 5 6 7pH
Per
cen
tag
e o
f S
orb
ed F
e(II)
0
20
40
60
80
100
1 2 3 4 5 6 7pH
Per
cen
tag
e o
f S
orb
ed F
e(II)
0
20
40
60
80
100
1 2 3 4 5 6 7pH
Per
cen
tag
e o
f S
orb
ed F
e(II)
A B
C
Figure 3.13 : Fe(II) specific sorption experiments at high ionic strengths, and various [Fe(II)]tot to[solid] ratio. A. 2.3 g clay/L, 10 µM Fe(II), 1 M NaCl. B. 1.7 g clay/L 26 µM Fe(II), 1 M NaCl. C.1.4 g clay/L, 15 µM Fe(II), 1 M CaCl2. For the asymmetry of the error bars, see Results andDiscussion.
Figure 3.14 presents the same experimental results with the model results (discussedbelow) in a different way: the sorption isotherms are plotted as the amount of sorbed Fe(II) perkilogram of clay as a function of pH. This representation allows us to directly compare theresults of experiments conducted under different experimental conditions and shows theplateaus and edges which are characteristic of the different sorption sites. The sorptionisotherms are relatively complex with at least two different domains: the first increase occursbetween pH 2 and pH 3 – 4, and the second one above pH 4.

70 / 204
0.000
0.005
0.010
0.015
0.020
1 2 3 4 5 6 7pH
So
rbed
Fe(
II) in
mo
l/kg
cla
y
0.000
0.005
0.010
0.015
0.020
1 2 3 4 5 6 7pH
So
rbed
Fe(
II) in
mo
l/kg
cla
y
0.000
0.005
0.010
0.015
0.020
1 2 3 4 5 6 7pH
So
rbed
Fe(
II) in
mo
l/kg
cla
yA B
C
Figure 3.14 : Sorption of Fe(II) on high and low energy sites of clay edges. Solid line: total Fe(II)sorption model curve. Dotted line: high-energy site Fe(II) sorption. A. 2.3 g clay/L, 10 µM Fe(II),1 M NaCl. B. 1.7 g clay/L 26 µM Fe(II), 1 M NaCl. C. 1.4 g clay/L, 15 µM Fe(II), 1 M CaCl2. Forthe asymmetry of the error bars, see Results and Discussion.
The experimental method introduces some uncertainties to the results since we cannotbe sure that all the Fe(II) desorbs over one night, and it is difficult to estimate the Fe(II) releasedfrom the dissolution of the clay material. We must also take into account the uncertainties in thetotal added Fe(II) and the dissolved Fe(II) measurements. Error bars are plotted with results inFigure 3.13 and Figure 3.14. The positive error bar is calculated on the basis of a standard errorof 20 % on the initial Fe(II) amount, i.e. the total amount in solution and previously sorbed onthe clay surface before any addition of Fe(II), plus a standard error of 5% for the measurementof dissolved Fe(II). The negative error bar includes only the 5% standard error for themeasurement of dissolved Fe(II).
The reactive sites corresponding to the sorption behavior at low pH (2 – 4) can beconsidered as a unique type of site, the so-called “strong sites”. A comparison between Figure3.13A and Figure 3.13C shows that there is little difference between Fe(II) sorption at thesesites when experiments were performed either in a Ca2+ or in a Na+ salt background. Thedensity of strong sites is not easily measurable by sorption isotherms. Indeed, if enough Fe(II) isavailable, a second sorption edge occurs at pH 4 (Figure 3.14B) limiting the accuracy of theplateau site density. Besides, as explained previously, the initial amount of sorbed iron is not anabsolute, reliable value. Therefore as a rough estimate, the strong sites density is estimated tobe between 0.005 and 0.015 mole sites per kilogram of clay.
The sites responsible for the second sorption edge are called the “weak sites”. It was notpossible to evaluate the exact density of these sites, as experiments conducted to attain a
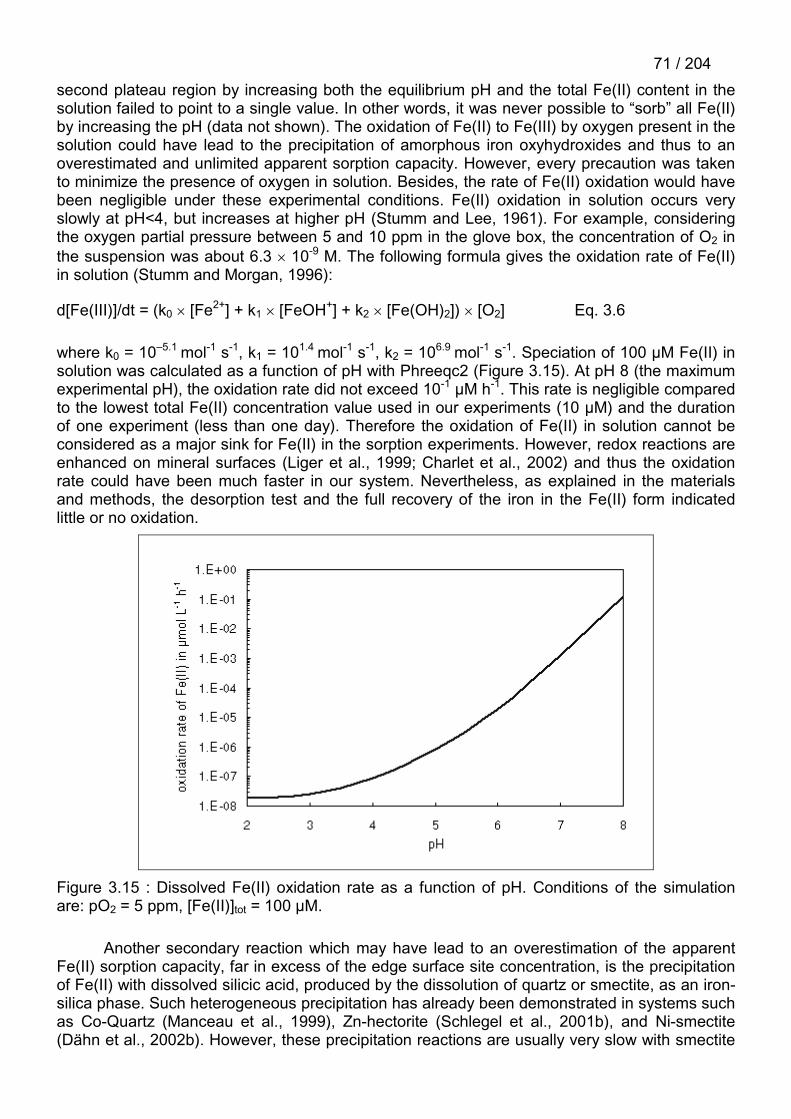
71 / 204second plateau region by increasing both the equilibrium pH and the total Fe(II) content in thesolution failed to point to a single value. In other words, it was never possible to “sorb” all Fe(II)by increasing the pH (data not shown). The oxidation of Fe(II) to Fe(III) by oxygen present in thesolution could have lead to the precipitation of amorphous iron oxyhydroxides and thus to anoverestimated and unlimited apparent sorption capacity. However, every precaution was takento minimize the presence of oxygen in solution. Besides, the rate of Fe(II) oxidation would havebeen negligible under these experimental conditions. Fe(II) oxidation in solution occurs veryslowly at pH<4, but increases at higher pH (Stumm and Lee, 1961). For example, consideringthe oxygen partial pressure between 5 and 10 ppm in the glove box, the concentration of O2 inthe suspension was about 6.3 10-9 M. The following formula gives the oxidation rate of Fe(II)in solution (Stumm and Morgan, 1996):
d[Fe(III)]/dt = (k0 [Fe2+] + k1 [FeOH+] + k2 [Fe(OH)2]) [O2] Eq. 3.6
where k0 = 10–5.1 mol-1 s-1, k1 = 101.4 mol-1 s-1, k2 = 106.9 mol-1 s-1. Speciation of 100 µM Fe(II) insolution was calculated as a function of pH with Phreeqc2 (Figure 3.15). At pH 8 (the maximumexperimental pH), the oxidation rate did not exceed 10-1 µM h-1. This rate is negligible comparedto the lowest total Fe(II) concentration value used in our experiments (10 µM) and the durationof one experiment (less than one day). Therefore the oxidation of Fe(II) in solution cannot beconsidered as a major sink for Fe(II) in the sorption experiments. However, redox reactions areenhanced on mineral surfaces (Liger et al., 1999; Charlet et al., 2002) and thus the oxidationrate could have been much faster in our system. Nevertheless, as explained in the materialsand methods, the desorption test and the full recovery of the iron in the Fe(II) form indicatedlittle or no oxidation.
Figure 3.15 : Dissolved Fe(II) oxidation rate as a function of pH. Conditions of the simulationare: pO2 = 5 ppm, [Fe(II)]tot = 100 µM.
Another secondary reaction which may have lead to an overestimation of the apparentFe(II) sorption capacity, far in excess of the edge surface site concentration, is the precipitationof Fe(II) with dissolved silicic acid, produced by the dissolution of quartz or smectite, as an iron-silica phase. Such heterogeneous precipitation has already been demonstrated in systems suchas Co-Quartz (Manceau et al., 1999), Zn-hectorite (Schlegel et al., 2001b), and Ni-smectite(Dähn et al., 2002b). However, these precipitation reactions are usually very slow with smectite
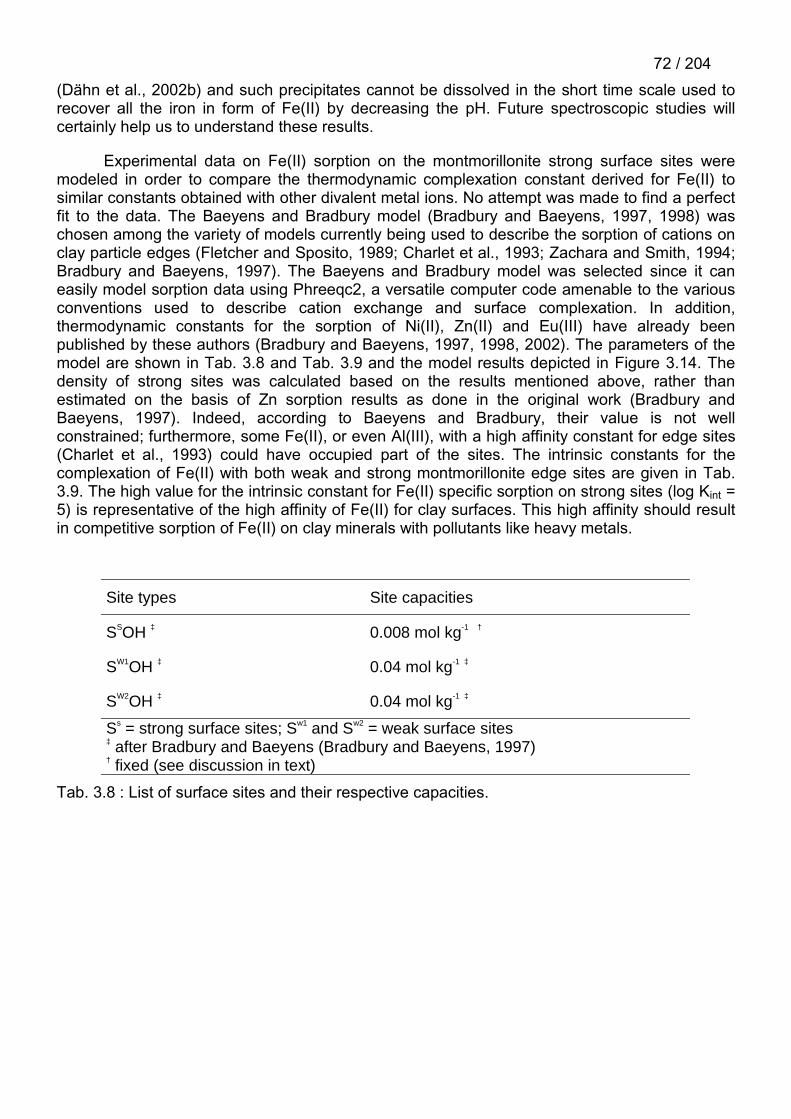
72 / 204(Dähn et al., 2002b) and such precipitates cannot be dissolved in the short time scale used torecover all the iron in form of Fe(II) by decreasing the pH. Future spectroscopic studies willcertainly help us to understand these results.
Experimental data on Fe(II) sorption on the montmorillonite strong surface sites weremodeled in order to compare the thermodynamic complexation constant derived for Fe(II) tosimilar constants obtained with other divalent metal ions. No attempt was made to find a perfectfit to the data. The Baeyens and Bradbury model (Bradbury and Baeyens, 1997, 1998) waschosen among the variety of models currently being used to describe the sorption of cations onclay particle edges (Fletcher and Sposito, 1989; Charlet et al., 1993; Zachara and Smith, 1994;Bradbury and Baeyens, 1997). The Baeyens and Bradbury model was selected since it caneasily model sorption data using Phreeqc2, a versatile computer code amenable to the variousconventions used to describe cation exchange and surface complexation. In addition,thermodynamic constants for the sorption of Ni(II), Zn(II) and Eu(III) have already beenpublished by these authors (Bradbury and Baeyens, 1997, 1998, 2002). The parameters of themodel are shown in Tab. 3.8 and Tab. 3.9 and the model results depicted in Figure 3.14. Thedensity of strong sites was calculated based on the results mentioned above, rather thanestimated on the basis of Zn sorption results as done in the original work (Bradbury andBaeyens, 1997). Indeed, according to Baeyens and Bradbury, their value is not wellconstrained; furthermore, some Fe(II), or even Al(III), with a high affinity constant for edge sites(Charlet et al., 1993) could have occupied part of the sites. The intrinsic constants for thecomplexation of Fe(II) with both weak and strong montmorillonite edge sites are given in Tab.3.9. The high value for the intrinsic constant for Fe(II) specific sorption on strong sites (log Kint =5) is representative of the high affinity of Fe(II) for clay surfaces. This high affinity should resultin competitive sorption of Fe(II) on clay minerals with pollutants like heavy metals.
Site types Site capacities
SSOH ‡ 0.008 mol kg-1 †
SW1OH ‡ 0.04 mol kg-1 ‡
SW2OH ‡ 0.04 mol kg-1 ‡
Ss = strong surface sites; Sw1 and Sw2 = weak surface sites‡ after Bradbury and Baeyens (Bradbury and Baeyens, 1997)† fixed (see discussion in text)
Tab. 3.8 : List of surface sites and their respective capacities.

73 / 204
Reactions Log Kint
SSOH + H+ = SSOH2
+ 4.5 ‡
SSOH = SSO- + H+ -7.9 ‡
SW1OH + H+ = SW1OH2
+ 4.5 ‡
SW1OH = SW1O- + H+ -7.9 ‡
SW2OH + H+ = SW2OH2
+ 6.0 ‡
SW2OH = SW2O- + H+ -10.5 ‡
SSOH + Fe2+ = SSOFe+ + H+ 5.0 *
SW1OH + Fe2+ = SW1OFe+ + H+ 0.5 **
Ss = strong surface sites; Sw1 and Sw2 = weak surface sites‡ after Bradbury and Baeyens (Bradbury and Baeyens, 1997)* adjusted value** The log K value for weak sites -SW1OH- is given as an indicative value andmay be overestimated due to high uncertainty associated with the amount ofstrong sites and the position of the second sorption edge.
Tab. 3.9 : List of reactions with known and estimated intrinsic constants.
Figure 3.16 presents the results of the Zn – Fe(II) competition experiment at pH ~5.8.The initial Zn(II) concentration was calculated based on the dilution of the Zn(II) stock solutionconcentration in the clay suspension. The error bar of the first point represents a standard errorof 2% on the concentration measurement, plus an error of 2% for the dilution. The error bars ofthe other points include only the 2% standard error for the measurement of dissolved Zn(II).After 73 hours, 0.5 mmol of Zn per kg of clay was sorbed on the clay particles. More than 250hours after the Fe(II) addition in the suspension, the dissolved Zn(II) increased to 100% of itsoriginal concentration of 3.4 µM (within the confidence limit of the error bars). Clearly, theaddition of Fe(II) is responsible for the desorption of all the sorbed Zn.

74 / 204
Time (hr)
0 5 10 15 50 100 150 200 250 300 350
Zn
in s
olut
ion
(µm
ol/L
)
0.0
0.5
1.0
1.5
2.0
2.5
3.0
3.5
4.0
Zn Adsorption Zn Desorption
Addition of3.4 µM Znat t = 0 h
Addition of69 µM Fe2+
at t = 73 h
Figure 3.16 : Zn(II) sorption and desorption at pH 5.82, by successive additions of 3.4 µM Zn(II)at t = 0 hrs and 69 µM Fe(II) at t = 73 hrs to a 4.35 g L-1 and 0.05 M CaCl2 clay suspension.
In Tab. 3.10, the log Kint value obtained in the present study for Fe(II) is compared withthose obtained in previous studies for Zn(II), Ni(II) (Bradbury and Baeyens, 1997, 1998), Eu(III)(Bradbury and Baeyens, 2002) and U(VI) (log Kint value adjusted with the present model afterthe results of Pabalan et al. (Pabalan et al., 1994) presented by Turner (Turner, 1995)). The logKint value for Fe(II) sorption is more than three orders of magnitude larger than the valuesreported for Zn(II), Ni(II), Eu(III) or U(VI) (Tab. 3.9). In other words, the affinity of themontmorillonitic clay is 103 times larger for Fe(II). Hence, in the presence of a high amount ofdissolved Fe(II), nearly all the strong sites will be saturated by sorbed Fe(II). This will decreasethe clay’s ability to sorb any other cation in such anoxic environments. This effect is illustratedby the simulation results presented in Figure 3.17. The sorption edges of Zn(II), Ni(II), Eu(III)and U(VI) are shifted towards high pH as Fe(II) is introduced into the system. Considering a pHof 7 representative for groundwaters, the presence of Fe(II) in solution leads to the decrease ofpollutant sorption on clay minerals from 100 %, 93 %, 100% and 95.6% to 38%, 18 %, 87%,and 0% for Zn(II), Ni(II), Eu(III) and U(VI), respectively. Moreover, the Zn – Fe(II) competitionexperiment clearly demonstrates that a previously sorbed pollutant such as Zn(II) can bedisplaced when aqueous Fe(II) is present in solution.

75 / 204
Reactions Log Kint
SSOH + Fe2+ = SSOFe+ + H+ 5.0 *
SSOH + Zn2+ = SSOZn+ + H+ 1.6 ‡
SSOH + Ni2+ = SSONi+ + H+ -0.1 ‡
SSOH + Eu3+ = SSOEu2+ + H+ 0.8 ‡
SSOH + UO22+ = SSOUO2
+ + H+ 1.7 **Ss = strong surface sites; Sw1 and Sw2 = weak surface sites‡ after Bradbury and Baeyens (Bradbury and Baeyens, 1997, 1998, 2002)* adjusted value after the present study data** adjusted value after Turner data (Turner, 1995)Tab. 3.10 : Comparison of strong sites Log Kint for Fe(II), Zn(II), Ni(II), Eu(III) and U(VI)
0.0
20.0
40.0
60.0
80.0
100.0
2.0 4.0 6.0 8.0pH
Sor
bed
Eu(
III)
(%)
0.0
20.0
40.0
60.0
80.0
100.0
2.0 4.0 6.0 8.0pH
Sor
bed
U(V
I) (
%)
0.0
20.0
40.0
60.0
80.0
100.0
2.0 4.0 6.0 8.0pH
Sor
bed
Ni(I
I) (
%)
0.0
20.0
40.0
60.0
80.0
100.0
2.0 4.0 6.0 8.0pH
Sor
bed
Zn(
II) (
%)
With
out F
e(II)
With
Fe(
II)
With
out F
e(II)
With
Fe(
II)
With
out F
e(II)
With
Fe(
II)
With
out F
e(II)
With Fe(II)
Figure 3.17 : Simulation of the competitive effect of Fe(II) on the Zn(II), Ni(II), Eu(III) and U(VI)sorption on a 4.35 g L-1 0.04 M CaCl2 clay suspension . The parameters of the simulation aregiven in Tab. 3.8, Tab. 3.9 and Tab. 3.10. Solid line: 3.6 µM pollutant sorption isotherm inabsence of added Fe(II) (i.e. only with 0.005 mol kg-1 of preliminary sorbed Fe(II)). Dotted line:3.6 µM pollutant sorption isotherm in presence of 69 µM Fe(II).

76 / 204If this behavior also applies to other cations and to the clay weak sorption sites in a
compacted bentonite system, this could lead to a weakening of clay immobilization capacitytowards heavy metals and radionuclides in natural iron-rich ground- and pore-waters, and inengineered systems such as zero-valent iron PRBs and deep radioactive waste depositorysites. In particular, the presence of a zero-valent PRB upstream from a polluted area could leadto the release of a secondary pollution downstream from the barrier due to the replacement ofsorbed heavy metals by Fe(II).
ACKNOWLEDGEMENTS
This research was funded by the French National radioactive waste management agency(ANDRA).

77 / 204
3.3. EVIDENCES EXPERIMENTALES DE PRECIPITATION D’UNE PHASE SI-FE ET D’OXYDATION DU FE(II) A LA SURFACE DES ARGILES
Les deux articles précédents ont quantifié deux phénomènes d’adsorption du Fe(II) à lasurface de l’argile : l’échange cationique et une adsorption spécifique sur des sites permettantdes effets de compétition entre cations. Ces types de sorption sont modélisés avec succès avecdes modèles disponibles dans la littérature.
L’article qui suit montre que ces deux phénomènes de sorption ne sont pas les seuls àrendre compte des quantités de Fe(II) fixées par l’argile. Il est ainsi montré que la sorption duFe(II) est due à haut pH à la précipitation d'un composé au rapport Si/Fe compris entre 1 et 2. Abas pH, la grande affinité du Fe(II) pour les sites de côtés de l'argile est confirmée. La fixationdu Fe(II) par l'argile est alors due à plusieurs phénomènes qui se superposent (Figure 3.18):
� un remplacement du Mg(II) octaédrique par le Fe(II) ;
� une sorption du Fe(II) sur les bordures suivie d'une oxydation. L'oxydant est, ici, supposéêtre le Fe(III) structural de l'argile ;
� une sorption coopérative avec H4SiO4, à l'origine d'une précipitation de surface.
Mg
Fe
Fe
Sorption compétitive
Fe
Sorption coopérative
Fe
Oxydation induitepar l’adsorption
Si
Figure 3.18 : Schématisation des différents mécanismes à l'origine de la sorption du Fe(II) parla montmorillonite à bas pH.

78 / 204

79 / 204
SORPTION OF FE(II) ON MONTMORILLONITE IN ANOXIC CONDITIONS:EVIDENCE FOR A NEW FE-SI SOLID PHASE PRECIPITATION AND FOR
SURFACE OXIDATION OF FE(II).
Christophe Tournassat1,2, Laurent Charlet1, Jean-Marc Greneche3
1 LGIT - CNRS/UJF, University of Grenoble-I, P.O. Box 53, F 38041 Grenoble, France
2 ANDRA, Parc de la Croix Blanche, 1/7 rue Jean Monnet, F-92298 Châtenay-Malabry CEDEX, France
3 Laboratoire de physique des états condensés UMR CNRS 6087, University of Maine, F 72085 Le Mans,Cedex 9, France

80 / 204
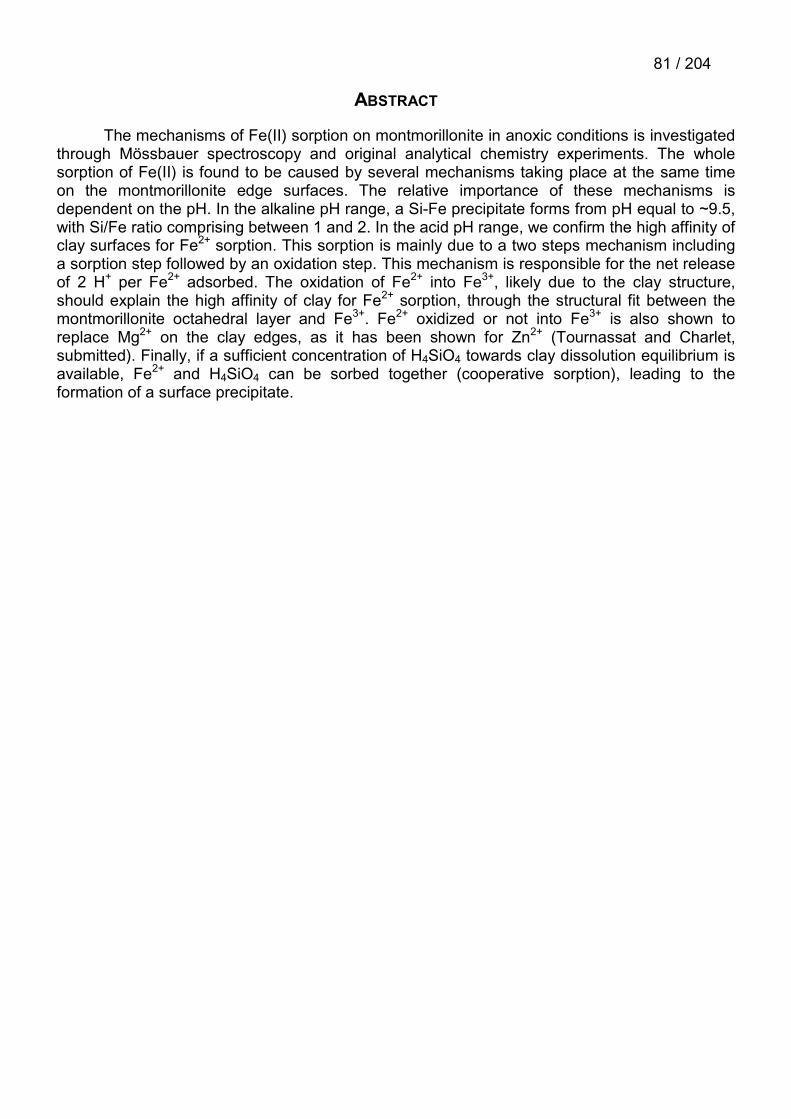
81 / 204
ABSTRACT
The mechanisms of Fe(II) sorption on montmorillonite in anoxic conditions is investigatedthrough Mössbauer spectroscopy and original analytical chemistry experiments. The wholesorption of Fe(II) is found to be caused by several mechanisms taking place at the same timeon the montmorillonite edge surfaces. The relative importance of these mechanisms isdependent on the pH. In the alkaline pH range, a Si-Fe precipitate forms from pH equal to ~9.5,with Si/Fe ratio comprising between 1 and 2. In the acid pH range, we confirm the high affinity ofclay surfaces for Fe2+ sorption. This sorption is mainly due to a two steps mechanism includinga sorption step followed by an oxidation step. This mechanism is responsible for the net releaseof 2 H+ per Fe2+ adsorbed. The oxidation of Fe2+ into Fe3+, likely due to the clay structure,should explain the high affinity of clay for Fe2+ sorption, through the structural fit between themontmorillonite octahedral layer and Fe3+. Fe2+ oxidized or not into Fe3+ is also shown toreplace Mg2+ on the clay edges, as it has been shown for Zn2+ (Tournassat and Charlet,submitted). Finally, if a sufficient concentration of H4SiO4 towards clay dissolution equilibrium isavailable, Fe2+ and H4SiO4 can be sorbed together (cooperative sorption), leading to theformation of a surface precipitate.

82 / 204
INTRODUCTION
Sorption mechanisms on clay surfaces have been studied for decades and onedistinguishes: (i) inorganic cation exchange in the interlayer and on basal plane surfaces (e.g.Sposito, 1981) and (ii) specific pH dependent sorption of cations and anions on the edges (e.g.Sposito, 1984). Edge sorption mechanism is related to the acido-basic properties of the clayedges (Fletcher and Sposito, 1989; Charlet et al., 1993; Stadler and Schindler, 1993; Zacharaand Smith, 1994; Bradbury and Baeyens, 1997; Avena, 2002 and others) whereas cationexchange on basal planes is related to the permanent charge generated by the clay structure(Sposito, 1981). The former mechanism is a pH dependant specific sorption on the clay edges.It has already been well established that the proton surface charge density (�H) on the clayedges depends on physico-chemical solution parameters (pH, ionic strength) that control theprotonation state of the surface (Fletcher and Sposito, 1989; Charlet et al., 1993; Zachara et al.,1993; Wanner et al., 1994; Baeyens and Bradbury, 1997; Bradbury and Baeyens, 1997; Avena,2002 and others). At variance, the cation exchange mechanism originates from the presence ofa permanent negative structural charge in the alumino-silicate layer created by isomorphicsubstitutions in the lattice. The density of exchange sites (�o) can be derived from structuralformula, and is electrically balanced by “exchangeable cations”, which generally form outersphere complexes with siloxane cavities (Sposito, 1981, 1984). The modeling of both of thesemechanisms should permit to predict the extent of metallic cation uptake by clay minerals.Nevertheless, some authors showed that other mechanisms must be involved as precipitation ofnew clay-like phases (Charlet and Manceau, 1994; Schlegel et al., 2001b; Dähn et al., 2002b),or dehydration of some cations in exchangeable positions (e.g. Chang et al., 1998).
Previous studies of Fe(II) sorption processes on montmorillonite have shown (i) thatFe(II) can sorb onto clay minerals in cation exchange position with a similar clay affinity forFe(II) and Ca(II) (Tournassat et al., submitted-a) and (ii), Fe(II) can compete with other metalsfor sorption on edge sites (Tournassat and Charlet, submitted). These behaviors can bemodeled with already published models (e.g. Bradbury and Baeyens, 1997). However, otheruptake mechanisms, like the possible precipitation of Fe(II)-rich new phases, must not bediscarded. In the present study, we propose new chemical and spectroscopic experiments tocharacterize the different mechanisms of Fe(II) “specific sorption” on montmorillonite.

83 / 204
MATERIAL AND METHOD
Chemicals
All solutions and suspensions were prepared with boiled, argon-degassed Millipore Milli-Q 18 M��water. NaOH and HCl stock solutions were made from Titrisol ampoules. NaCl, CaCl2,FeCl2, and FeCl3 solutions were prepared from analytical grade salts. All experiments wereconducted in a O2 “free” atmosphere glove box (Jacomex, pO2 < 0.5 ppm), except forexperiment E, conducted in air.
Clay material preparation
MX80 (commercial Wyoming bentonite, reference BF100, CETCO France) clay samplematerial was obtained after homogenization from ANDRA (the French National RadioactiveWaste Management Agency). STx-1 Texas montmorillonite sample was obtained from SourceClay repository (Missouri, USA). The clay samples were dispersed in deionized water. The finefractions (< 2 m) were isolated by sedimentation. After saturation with NaCl (0.5 M), thesuspensions were successively treated with a 0.1 M acetic acid, 0.5 M NaCl solution (to removethe carbonates), then with a dithionate-citrate-bicarbonate solution (DCB + 0.5 M NaCl, toremove Fe and Mn oxides impurities), and finally with 3% H2O2, 0.5 M NaCl (to remove organicmatter, Schlegel, 2000). The final suspensions were washed with either 0.5 M NaCl or 0.05 MCaCl2 solutions and then argon-degassed.
Clay material characterization
The Na- and Ca- conditioned MX80 clay characterization is available from Tournassat etal. (Tournassat et al., submitted-c). The Na- and Ca- conditioned MX80 clay samples stillcontain some impurities, mostly as silica phase (quartz and cristobalite) and iron remainingoxides. The MX80 structural formula are:
(Si3.98Al0.02)(Al1.61Fe3+0.13Fe2+
0.02Mg0.24)O10(OH)2Na0.28 for the Na-saturated form and
(Si3.98Al0.02)(Al1.61Fe3+0.13Fe2+
0.02Mg0.24)O10(OH)2Ca0.14 for the Ca-saturated form.
The structural CEC was found to be equal to 0.76 eq kg-1. Due to large amounts of silicaimpurities in the STx-1 clay sample (Mermut and Cano, 2001), we do not give any structuralformula for this clay. Its mean structural CEC was estimated to be equal to 0.86 eq kg-1 (Mermutand Lagaly, 2001). The method used to measure the clay suspension content is available fromTournassat et al. (Tournassat et al., submitted-c).
Experimental procedures
Experiments A (MX80) and B (STx-1). Comparative potentiometric titrations
In this experiment the level of H+ desorption from montmorillonite was studied as afunction of pH and compared for Fe(II)-free and Fe(II)-rich clay suspension. The experimentaltitration procedure is fully described in details in Tournassat et al. (Tournassat et al., submitted-c) and only summarized here. Centrifugation tubes were numbered and precisely weighed(mtube in g) with a Mettler Toledo AG285 balance. A known volume of clay suspension wasadded in each 17-ml centrifuge tube with a calibrated micropipette (Vsusp, clay particle
84 / 204
concentration �). Volumes of NaOH and HCl were then added (Vb and Va, concentration Cb andCa). Volumes of NaCl or CaCl2 solutions (Vc, [H+] = Cc) solution were used to complete at 15 ml(Vtot). Mean measured concentration of CaCl2, added FeCl2 concentration, and clay contentsare shown in Tab. 3.11. Care was taken to minimize the variations of salt ionic backgroundconcentrations from one tube to another in a given experiment. The tubes were shaken for oneweek. The two experiments (with and without Fe(II)) were conducted in a O2-free atmosphereglove box (Jacomex, pO2 < 0.5 ppm). After one week the tubes were centrifuged. An aliquot ofeach supernatant tube was filtered and used for backtitration (Vback). The backtitrations wereperformed with a dosimeter (Metrohm 665 Dosimat, volume resolution = 0.005 mL) with pH 7chosen as the titration end point. The pH was measured with a microelectrode (Mettler Toledo,inlab 423). One other aliquot was filtered for Si, Al, Mg and Fe measurement by ICP-AES.Control Fe(II) measurement were done with the O-phenantrolin method (Rodier, 1996) in orderto check that the iron concentration measured by ICP was in the Fe(II) form. The Si, Al, Mg, Feconcentrations of a third supernatant aliquot was measured without filtration to obtain anestimated mass of particles still present in the supernatant (mcorrection, see Tournassat et al.(Tournassat et al., submitted-c)). The centrifuged reaction tubes, containing the clay slurry,were weighed (mcentrif) and 10 ml of 1 M ammonium acetate were added to each. They wereshaken for one week. Na- and Ca-CEC were then measured as described by Sposito et al.(Sposito et al., 1983a). The relative proton surface charge �[H+] is given by (Tournassat et al.,submitted-c):
� � � � � � ��
���
���� �
back
totBTBTBTBTBBAA V
VCVCVCVCV
aH
BBAA
1 [1]
where
a = the clay content of the suspension in kg l-1;
totV = the whole volume of solution in one tube in l;
backV = the volume of filtrated suspension used in the backtitration in l;
AV = the volume of acid solution added to the clay suspension in l;
BV = the volume of alkali solution added to the clay suspension in l;
AC = the concentration of the acid solution in mol l-1;
BC = the concentration of the acid solution in mol l-1;
ABTV = the volume of acid solution used in backtitration in l;
BBTV = the volume of alkali solution used in backtitration in l;
ABTC = the concentration of acid solution used in backtitration in mol l-1;
BBTC = the concentration of alkali solution used in backtitration in mol l-1.
The Ca-CEC, in eq kg-1, is given by:

85 / 204
� �� �� � correctionsusp
susptubecentrifCasol
CaAmm
mVVmmCC
CECCa��
������
���
�
�102 [2]
where volumes are given in ml, concentration in mol l-1, clay content in g l-1 and masses in g.The density of all solutions is taken equal to 1.0. The ionic background was set to CaCl2 = 0.05mol l-1. This ionic background ensures us that no exchange reaction occurs with Fe(II) and thatFe(II) sorbs only on specific sorption site (Tournassat et al., submitted-a).
Titration experiment A Titration experiment B
Clay sample MX80 STx-1
Ionic background CaCl2 0.05 mol l-1 CaCl2 0.05 mol l-1
Clay content 1.41 g l-1 2.03 g l-1
Tab. 3.11 : Experimental conditions of the two comparative potentiometric titration experiments
Experiment C. Dissolution and readsorption
Tournassat and Charlet (Tournassat and Charlet, submitted) showed that Fe(II) can sorbonto clay edge sites at low pH (i.e. at pH values as low as pH 2). In their experiments theydecreased the pH below pH 2 to desorb (or dissolve) Fe(II) from the clay and then increased thepH, step by step, and measured Fe(II) present in solution within the reactor vessel. They alsoshowed that Fe(II) can compete for sorption with Zn(II) at pH 5.8, while Charlet et al. (Charlet etal., 1993) demonstrated that Al3+ can also sorb at low pH (between pH 3 and 4). At even lowerpH values, soluble H4SiO4 and Al3+ can originate from the clay particle dissolution. Then,experiment C was designed to measure the influence of Fe(II) on both the Al3+ readsorption andthe change of Si solution concentration, as a function of increasing pH, after a clay dissolutionstep. The Ca- conditioned MX80 clay sample was selected for this experiment. A 3.6 g clay l-1,0.05 mol l-1 CaCl2, O2 free suspension was allowed to dissolve at a pH value of 2.1 in amagnetic stirred reactor, within the glove box. Since this clay material contains iron oxidesimpurities (Tournassat et al., submitted-c), 1.5 mmol l-1 sodium dithionite was added to removethem partially and to increase the Fe(II) amount in solution. This adding should ensure usreductive experimental conditions. The clay was allowed to dissolve during 23 days. During thistime, samples were collected and analyzed for Si, Al, Fe and Mg by ICP-AES. Afterwards, twogroups of centrifugation tubes were filled with 5 ml of clay suspension with 5 ml of solutions, sothat pH values varied between 2.2 and 10.7. The ionic background was 0.05 mol l-1 CaCl2 ineach tube. 1 ml of Fe(II) solution was added in the tubes of one group. The added Fe(II)corresponded to 110 mmol kg-1 clay. Final clay content were 1.75 g l-1 for tubes without addedFe(II) and 1.52 g l-1 for tubes containing added Fe(II). The suspensions were allowed to furtherequilibrate for 24-hrs.
Experiment D. 57Fe Mössbauer spectroscopy
The clay obtained after the dissolution step of experiment C was used in this experiment.57Fe(II) stock solution was prepared with the method developed in Tournassat et al. (Tournassatet al., submitted-a). Aliquots of clay suspension were mixed with 57Fe(II) stock solution in tubesand equilibrated for 24-hrs at a given pH and in presence or absence of sodium dithionite, in the
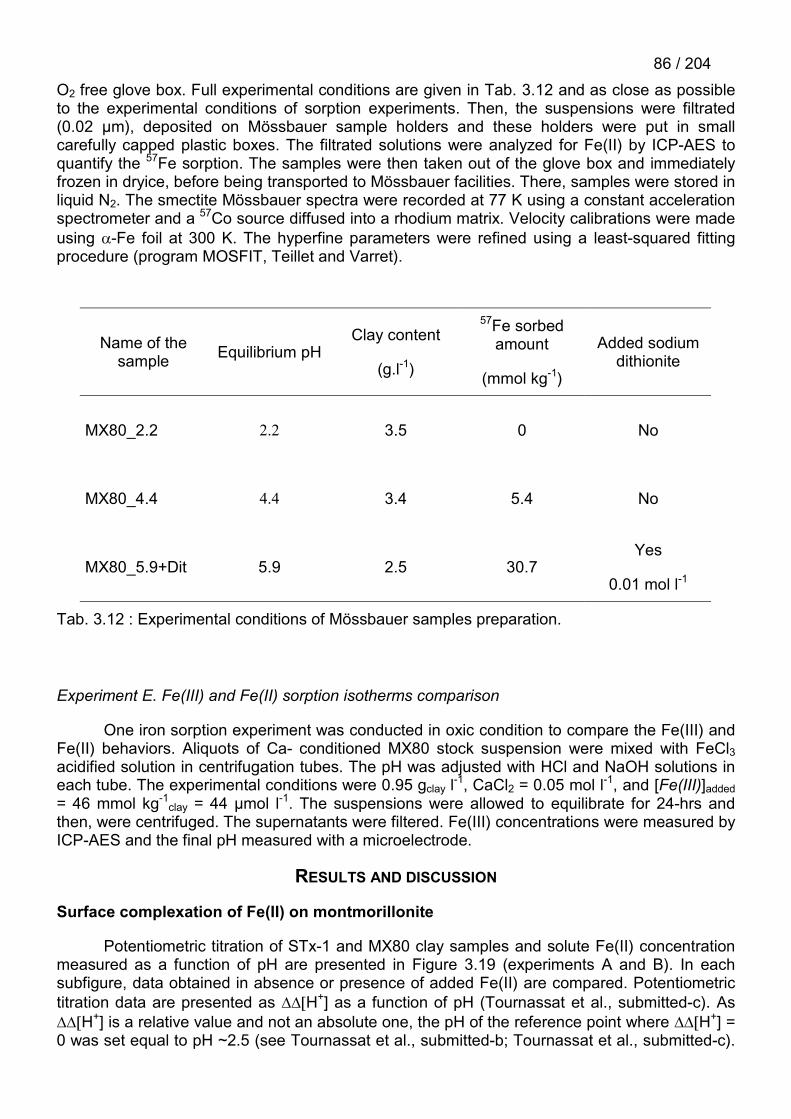
86 / 204O2 free glove box. Full experimental conditions are given in Tab. 3.12 and as close as possibleto the experimental conditions of sorption experiments. Then, the suspensions were filtrated(0.02 µm), deposited on Mössbauer sample holders and these holders were put in smallcarefully capped plastic boxes. The filtrated solutions were analyzed for Fe(II) by ICP-AES toquantify the 57Fe sorption. The samples were then taken out of the glove box and immediatelyfrozen in dryice, before being transported to Mössbauer facilities. There, samples were stored inliquid N2. The smectite Mössbauer spectra were recorded at 77 K using a constant accelerationspectrometer and a 57Co source diffused into a rhodium matrix. Velocity calibrations were madeusing �-Fe foil at 300 K. The hyperfine parameters were refined using a least-squared fittingprocedure (program MOSFIT, Teillet and Varret).
Name of thesample Equilibrium pH
Clay content
(g.l-1)
57Fe sorbedamount
(mmol kg-1)
Added sodiumdithionite
MX80_2.2 2.2 3.5 0 No
MX80_4.4 4.4 3.4 5.4 No
MX80_5.9+Dit 5.9 2.5 30.7Yes
0.01 mol l-1
Tab. 3.12 : Experimental conditions of Mössbauer samples preparation.
Experiment E. Fe(III) and Fe(II) sorption isotherms comparison
One iron sorption experiment was conducted in oxic condition to compare the Fe(III) andFe(II) behaviors. Aliquots of Ca- conditioned MX80 stock suspension were mixed with FeCl3acidified solution in centrifugation tubes. The pH was adjusted with HCl and NaOH solutions ineach tube. The experimental conditions were 0.95 gclay l-1, CaCl2 = 0.05 mol l-1, and [Fe(III)]added= 46 mmol kg-1
clay = 44 µmol l-1. The suspensions were allowed to equilibrate for 24-hrs andthen, were centrifuged. The supernatants were filtered. Fe(III) concentrations were measured byICP-AES and the final pH measured with a microelectrode.
RESULTS AND DISCUSSION
Surface complexation of Fe(II) on montmorillonite
Potentiometric titration of STx-1 and MX80 clay samples and solute Fe(II) concentrationmeasured as a function of pH are presented in Figure 3.19 (experiments A and B). In eachsubfigure, data obtained in absence or presence of added Fe(II) are compared. Potentiometrictitration data are presented as �� H+] as a function of pH (Tournassat et al., submitted-c). As�� H+] is a relative value and not an absolute one, the pH of the reference point where �� H+] =0 was set equal to pH ~2.5 (see Tournassat et al., submitted-b; Tournassat et al., submitted-c).

87 / 204Both, Fe(II) solute concentration and potentiometric titration data are normalized to the amountof clay present in suspension, so that the results are expressed in mmol kg-1 clay.
As a first result, both types of clay sorb Fe(II) in the pH range from 3.5 to 7 and theydepict a negative Fe(II) surface excess below pH 3.5 which may originate both from desorptionor from dissolution. MX80 clay sample desorb (or dissolve) more Fe(II) than the STx-1 claysample does. This can be related to the higher amount of Fe(II), in the MX80 structure or to theimpurities more present in this clay material, than in the STx-1 clay (Mermut and Cano, 2001;Tournassat et al., submitted-c). The presence of added Fe(II) causes a discrepancy in thepotentiometric titration curves, by decreasing the �� H+] values while Fe(II) sorbs onto clay.This discrepancy corresponds to 2 or 3 times the amount of Fe(II) sorbed onto the clay. Thuseach Fe(II) adsorbed lead to a release of 2 to 3 protons. The arrows in Figure 3.19 shows howto restore the potentiometric titration curves without added Fe(II) by subtracting the amount ofsorbed Fe(II) from the �� H+] value given in the potentiometric titration curve with Fe(II). Figure3.20 exhibits the potentiometric curves without added Fe(II) together with the rebuiltpotentiometric titration curves. For experiment A (MX80), the restoration is better by addingtwice the amount of sorbed Fe(II), whereas for experiment B (STx-1), the restoration is better byadding three times the amount of sorbed Fe(II). Then, the sorption of one mole of Fe(II) leads tothe desorption of two moles of H+ for MX80. Hence, the clay edge charge is unaffected bysorption of Fe(II). This conclusion is also supported by results presented in Figure 3.21, wherethe Ca-CEC, plotted as a function of pH, is found not to be influenced by the presence of Fe(II).Then, as expected by the [Ca2+]/[Fe2+] ratio previously in solution, Fe(II) must not sorb inexchange site position and the change of �� H+] has no effect on this curve. However, we mustnote that the error bars extents are greater than the charge difference observed in Figure 3.19.

88 / 204
-600
-500
-400
-300
-200
-100
0
100
2 4 6 8 10 12
pH
H+
(mm
ol k
g-1 cl
ay)
-1500
-1300
-1100
-900
-700
-500
-300
-100
100
2 4 6 8 10 12
pH
��
H+
(mm
ol k
g-1 cl
ay)
0
5
10
15
20
25
30
35
40
45
50
2 4 6 8 10 12
pH
Sol
ute
Fe(
II) (
mm
ol k
g-1 c
lay)
0
10
20
30
40
50
60
70
2 4 6 8 10 12
pH
Sol
ute
Fe(
II) (
mm
ol k
g-1 c
lay)
MX80
MX80
STx-1
STx-1
Fe sorbed x 2 or x 3
Figure 3.19 : Comparison of clay potentiometric backtitration experiments, with and withoutFe(II) added in solution. ��[H+], the relative amount of H+ adsorbed on the surface, is plotted asa function of pH. Left: experiment A, 1.41 g l-1 MX80, 0.05 mol l-1 CaCl2. Right: experiment B,2.03 g l-1 STx-1, 0.05 mol l-1 CaCl2, added [Fe(II)] = 86 µmol l-1. Top: Comparative backtitrationresults. Diamonds: experiments without added Fe(II). Squares: experiments with added Fe(II).Bottom: Fe(II) sorption/desorption data. Diamonds: experiments without added Fe(II). Thecontinuous lines represent the amount of Fe(II) added. Dotted lines represent the error bar onthis value. The arrows on the left part indicate how the potentiometric titration curve withoutadded Fe(II) can be rebuild with the Fe(II) sorption curve (bottom part) and the potentiometrictitration curve with added Fe(II).

89 / 204
-1000
-800
-600
-400
-200
0
2 4 6 8 10 12
pHC
orre
cted
H
+ (m
mol
kg-1
clay
)
MX80 STx-1-600
-500
-400
-300
-200
-100
0
100
2 4 6 8 10 12
pH
Cor
rect
ed
H+
(mm
ol k
g-1 c
lay)
Figure 3.20 : Comparison of clay potentiometric backtitration data without Fe(II) added insolution (open diamonds), together with the curves rebuild with the method explained in figure1. The corrections correspond to the addition of twice the amount of Fe(II) adsorbed (blacksquares) or three times this amount (black diamonds).
0
500
1000
1500
2000
2500
3000
2 4 6 8 10 12 14
pH
Ca-
CE
C (
meq
kg-1
clay
)
0200400600800
100012001400160018002000
2 4 6 8 10 12 14
pH
Ca-
CE
C (
meq
kg-1
clay
)
Figure 3.21 : Comparison of the Ca- CEC plotted as a function of pH, in experiments with(squares) and without (diamonds) addition of Fe(II). Left: experiment A, 1.41 g l-1 MX80, 0.05mol l-1 CaCl2. Right: experiment B, 2.03 g l-1 STx-1, 0.05 mol l-1 CaCl2, added [Fe(II)] = 86 µmoll-1.
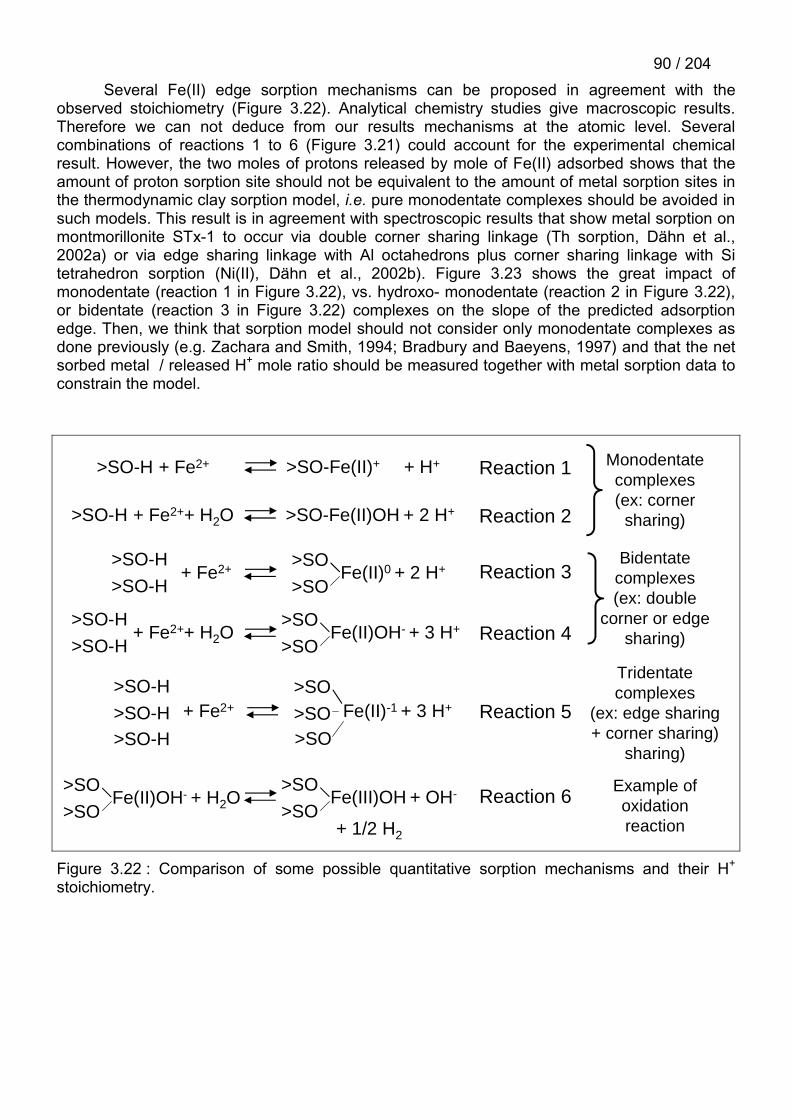
90 / 204Several Fe(II) edge sorption mechanisms can be proposed in agreement with the
observed stoichiometry (Figure 3.22). Analytical chemistry studies give macroscopic results.Therefore we can not deduce from our results mechanisms at the atomic level. Severalcombinations of reactions 1 to 6 (Figure 3.21) could account for the experimental chemicalresult. However, the two moles of protons released by mole of Fe(II) adsorbed shows that theamount of proton sorption site should not be equivalent to the amount of metal sorption sites inthe thermodynamic clay sorption model, i.e. pure monodentate complexes should be avoided insuch models. This result is in agreement with spectroscopic results that show metal sorption onmontmorillonite STx-1 to occur via double corner sharing linkage (Th sorption, Dähn et al.,2002a) or via edge sharing linkage with Al octahedrons plus corner sharing linkage with Sitetrahedron sorption (Ni(II), Dähn et al., 2002b). Figure 3.23 shows the great impact ofmonodentate (reaction 1 in Figure 3.22), vs. hydroxo- monodentate (reaction 2 in Figure 3.22),or bidentate (reaction 3 in Figure 3.22) complexes on the slope of the predicted adsorptionedge. Then, we think that sorption model should not consider only monodentate complexes asdone previously (e.g. Zachara and Smith, 1994; Bradbury and Baeyens, 1997) and that the netsorbed metal / released H+ mole ratio should be measured together with metal sorption data toconstrain the model.
Reaction 2
Reaction 3
Reaction 4
Reaction 5
Reaction 6
>SO-H
>SO-H+ Fe2+
>SO
>SOFe(II)0 + 2 H+
>SO-H + Fe2++ H2O >SO-Fe(II)OH + 2 H+
>SO-H
>SO-H
>SO
>SOFe(II)OH- + 3 H++ Fe2++ H2O
>SO
>SOFe(II)OH- + H2O
>SO
>SOFe(III)OH + OH-
+ 1/2 H2
>SO-H
>SO-H + Fe2+
>SO
>SO Fe(II)-1 + 3 H+
>SO-H >SO
>SO-H + Fe2+ >SO-Fe(II)+ + H+ Reaction 1
Bidentatecomplexes(ex: double
corner or edgesharing)
Monodentatecomplexes(ex: corner
sharing)
Tridentatecomplexes
(ex: edge sharing+ corner sharing)
sharing)
Example ofoxidationreaction
Figure 3.22 : Comparison of some possible quantitative sorption mechanisms and their H+
stoichiometry.
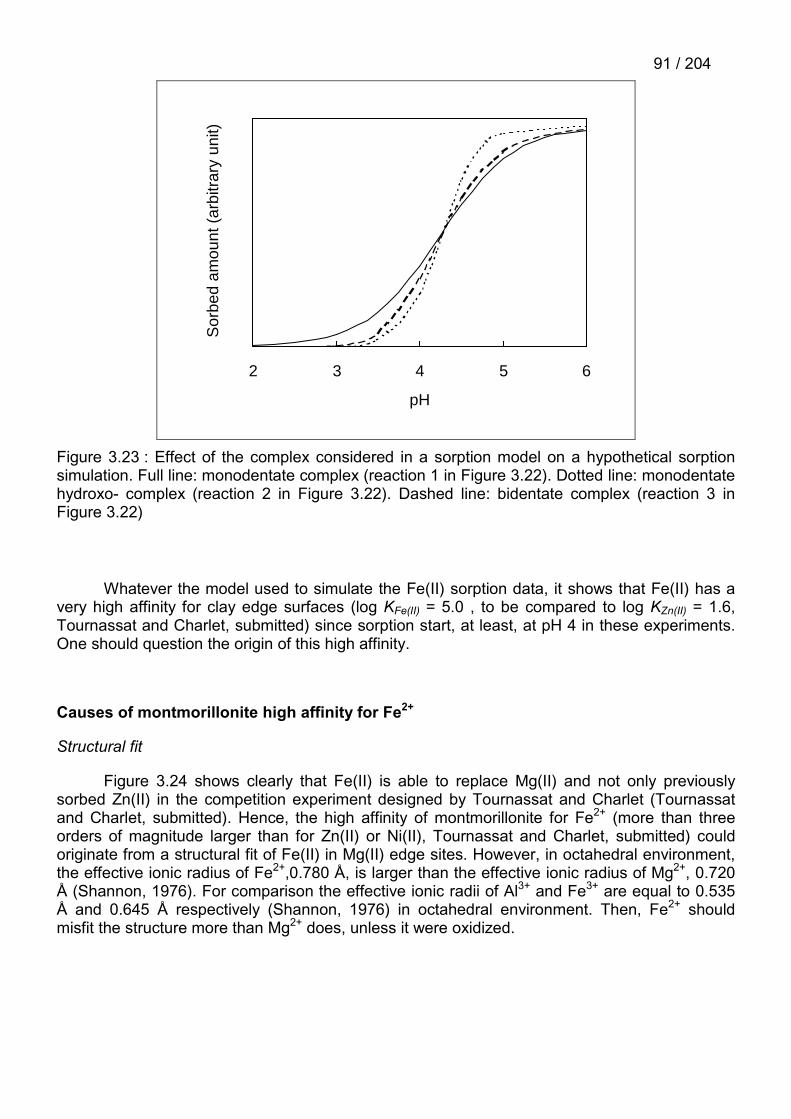
91 / 204
0
2 3 4 5 6
pH
Sor
bed
amou
nt (
arbi
trar
y un
it)
Figure 3.23 : Effect of the complex considered in a sorption model on a hypothetical sorptionsimulation. Full line: monodentate complex (reaction 1 in Figure 3.22). Dotted line: monodentatehydroxo- complex (reaction 2 in Figure 3.22). Dashed line: bidentate complex (reaction 3 inFigure 3.22)
Whatever the model used to simulate the Fe(II) sorption data, it shows that Fe(II) has avery high affinity for clay edge surfaces (log KFe(II) = 5.0 , to be compared to log KZn(II) = 1.6,Tournassat and Charlet, submitted) since sorption start, at least, at pH 4 in these experiments.One should question the origin of this high affinity.
Causes of montmorillonite high affinity for Fe2+
Structural fit
Figure 3.24 shows clearly that Fe(II) is able to replace Mg(II) and not only previouslysorbed Zn(II) in the competition experiment designed by Tournassat and Charlet (Tournassatand Charlet, submitted). Hence, the high affinity of montmorillonite for Fe2+ (more than threeorders of magnitude larger than for Zn(II) or Ni(II), Tournassat and Charlet, submitted) couldoriginate from a structural fit of Fe(II) in Mg(II) edge sites. However, in octahedral environment,the effective ionic radius of Fe2+,0.780 Å, is larger than the effective ionic radius of Mg2+, 0.720Å (Shannon, 1976). For comparison the effective ionic radii of Al3+ and Fe3+ are equal to 0.535Å and 0.645 Å respectively (Shannon, 1976) in octahedral environment. Then, Fe2+ shouldmisfit the structure more than Mg2+ does, unless it were oxidized.

92 / 204
Time (hr)
0 5 10 15 50 100 150 200 250 300 350
Zn
and
Mg
in s
olut
ion
(µm
ol/L
)
0
2
4
6
8
10
12
14
16
18
20
Zn desorption
Mg desorption
Addition of3.4 µM Znat t = 0 h
Addition of69 µM Fe2+
at t = 73 h
Zn
and
Mg
in s
olut
ion
(µm
ol l-
1 )
Figure 3.24 : Mg and Zn desorptions as a function of time in a Fe(II)-Zn(II) competitionexperiments on montmorillonite MX80, at pH 5.82, by adding 3.4 µM Zn(II) at t = 0 hrs and 69µM Fe(II) at t = 73 hrs to a 4.35 g L-1 and 0.05 M CaCl2 clay suspension (Tournassat andCharlet, submitted).
Oxidation of sorbed Fe2+
57Fe Mössbauer spectroscopy results are shown on Figure 3.25, and the associatedhyperfine parameters are shown in Tab. 3.13. In addition to the expected quadrupolar doubletsof Fe(III) and Fe(II), the MX80_4.4 sample spectrum exhibits a magnetic sextet with broadenedlines. This magnetic sextet was already observed on montmorillonite MX80 by Tournassat et al.(Tournassat et al., submitted-c) and was attributed to remaining iron oxides. This magneticsextet is not retrieved in MX80_2.2 sample spectrum, although MX80_4.4 sample was preparedby (i) adding 57Fe to the same suspension as used for MX80_2.2 sample preparation and (ii)increasing pH to 4.4 value. Nevertheless, the poorly defined baseline of MX80_2.2 samplespectrum may contain this magnetic sextet. In this experiment, we attempted to measure the57Fe(II) / (57Fe(III) + 57Fe(II)) ratio. The fitting models, consist in two or three main quadrupolardoublets attributed to Fe(II) and Fe(III) surface species. For sample MX80_4.4 a magneticsextet was attributed to iron oxides. It is clear that other fitting models can be proposed, e.g.with additional quadrupolar components but a sensibility analysis on the Fe(II) / Fe(III) + Fe(II)ratio value showed that this value remains almost constant whatever the model. In Tab. 3.14,the percentage of 57Fe(II) in the samples is compared to the expected percentages in case of

93 / 204total or no oxidation of added 57Fe(II). Though all care was taken in the procedure to avoid O2, itis clear that most of sorbed Fe(II) oxidizes into Fe(III). This oxidation is partial at pH 4.4 andcomplete at pH 5.9, even in presence of 0.01 mol l-1 sodium dithionite. Since the Fe(III)contribution to Mössbauer spectra are quadrupolar peaks, the 57Fe(III) atom ions did notpolymerize. Otherwise, paramagnetic or magnetic features should have been measured. Then,57Fe(III) atoms are dispersed on the clay surface. This results is in agreement with a sorption ofsingle Fe(II) ions followed by an oxidation step. The nature of the oxidant is unknown. One canimagine that water or structural Fe(III) may oxidize the Fe(II) sorbed on the edges. For instance,Gournis et al. showed that clay edge surfaces can catalyze the formation of hydroxyl radicals,and thus the oxidation of surface iron, and that the yield of hydroxyl radicals depends on theclay lattice iron (Gournis et al., 2002). In the present Mössbauer spectroscopy experiments, themaximum amount of sorbed 57Fe(II) was 30.7 mmol kg-1, whereas the clay contains about 350mmol Fe(III) kg-1. Hence, the electron transfer between structural Fe(III) and Fe(II) atomssorbed onto clay edges may be responsible for our Mössbauer results.
-3 0 3
0,99
0,99
1,00
1,00
1,00
rela
tive
trans
mis
sion
V [mm/s]
-12 -9 -6 -3 0 3 6 9 12
0,99
1,00
1,00
rela
tive
trans
mis
sion
V [mm/s]
-9 -6 -3 0 3 6 9
1,00
1,00
rela
tive
trans
mis
sion
V [mm/s]
-3 0 +3
V (mm s-1)
12 9 -6 -3 0 3 6 9 12
12 9 -6 -3 0 3 6 9 12
MX80_2.2
MX80_4.4
MX80_5.9+Dit
Figure 3.25 : Dots: 77 K Mössbauer spectra of the MX80_2.2 (top), MX80_4.4 (middle) andMX80_5.9Dit (bottom) samples. Thin lines: decomposition of the spectrum. Thick line: sum of allthe contributions of the decomposition. The experimental conditions of the sample preparationare given in Tab. 3.12 and the parameters of the decomposition are given in Tab. 3.13.

94 / 204
Sample ContributionI.S.
mm s-1
�
mm s-1
Q.S. or2�
mm s-1
Hhyp
T%
MX80_2.2 Fe(II) 1.27 0.27 3.02 27%
Fe(III) 0.43 1.20 0.73 73%
MX80_4.4 Fe(II) 1.28 0.47 3.10 28%
Fe(III) 0.44 0.87 0.76 64%
Magneticsextet 0.44 0.90 0.49 54.4 9%
MX80_5.9Dit Fe(II) 1.27 0.23 3.13 7%
Fe(III) A 0.48 0.47 0.69 78%
Fe(III) B 0.41 0.39 1.15 15%
I.S. = isomer shift; � = linewidth; Q.S. = quadrupolar splitting value; 2��= quadrupolarshift value, Hhyp = hyperfine field value, % = ratio of each component.
Tab. 3.13 : Mössbauer parameters of the samples listed in Tab. 3.12.
Name of thesample Measured %Fe(II)
%Fe(II) in case oftotal oxidation
%Fe(II) in case ofno oxidation
MX80_2.2 27 % 27 % 27 %
MX80_4.4 28 % 17 % 54 %
MX80_5.9+Dit 7 % 6 % 83 %
Tab. 3.14 : Comparison of measured Fe(II) percentage in Mössbauer samples with predictedpercentages based on total or no oxidation of added 57Fe(II).
The Fe(III) sorption isotherm as a function of pH (Figure 3.26) shows that Fe3+ can sorbon clay edges with a high affinity, since Fe(III) sorb at almost two pH units below Fe(II). Hence,the high affinity of clay for Fe2+ may indeed originate both from the possibility to transform Fe2+
into Fe3+ by a two steps – sorption + oxidation – process and the Fe3+ structural fit and thus highaffinity for the structure.

95 / 204
0
20
40
60
80
100
2 3 4 5 6 7 8
pH
% F
e in
sol
utio
n Fe(III) sorption
Fe(II) sorption
Figure 3.26 : Comparison of Fe(III) sorption isotherms (experiment E, 0.95 gclay l-1, 0.05 mol l-1CaCl2, and [Fe(III)]added = 46 mmol kg-1 clay = 44 µmol l-1) and Fe(II) sorption isotherms(experiments A and C). The lines are drawn as eyes guidelines.
Reversibility
Once Fe(II) was sorbed (and transformed into Fe(III)), desorption / dissolutionexperiments, were performed by decreasing the pH to test the reversibility of the overallsorption process. At variance with what is expected from Mössbauer results, it was possible toretrieve all sorbed iron after less than one day at pH 1.5 – 2 (data not shown). All this iron wasretrieved as Fe(II) as shown by both O-phenantrolin (Rodier, 1996) and ferrozin (Viollier et al.,2000) methods. Nevertheless, no data is available to attribute this released Fe(II) to previouslyadsorbed Fe(II) or to structural Fe(II) / reduced structural Fe(III). Then, we can just say that theFe(II) sorption plus oxidation process is quantitatively an apparent reversible process.
Clay dissolution and precipitation of Fe-Si new phase
Time-limited dissolution at various pH (experiment A and B)
Figure 3.27 exhibits the effect of added Fe(II) on the solute Si concentration as a functionof pH. Results are plotted in mmol kg-1 clay. A great discrepancy exists between experiment A(MX80) and B (STx-1). The increase of Si concentration, with increasing pH, starts at pH valueequal to approximately 7 for MX80, and approximately 5 for STx-1. We attribute this differenceto the presence of large amounts of fine grained silica impurities in STx-1 clay sample. Bothquartz and cristobalite are present as impurities in the conditioned clay material. Hence, thesolute Si concentrations are compared with quartz and cristobalite(s) equilibriumconcentrations. These concentrations are also expressed in mmol kg-1. Two different equilibriumconstants for cristobalite, i.e. with �- cristobalite and �- cristobalite, are reported in Figure 3.27.At low pH (< 5), the solute Si concentrations are lower than those given by equilibrium with thesilica phases and the addition of Fe(II) has no influence. This result denotes that silica dissolveswith a too slow kinetics at these pH values to control the concentration in solution and that

96 / 204montmorillonite dissolution equilibrium constant controls the Si concentration in acid pH range.In the pH range values 5 – 8.5, no effect of added Fe(II) on Si solute concentration is measuredbut discrepancies exist between experiments A (MX80) and B (STx-1). In case of MX80 claysample, the solute Si concentration seems to be limited by kinetics and equilibrium with quartz,whereas in cases of STx-1 clay sample, quartz equilibrium does not limit the Si concentration.At pH value 8.5, almost 190 mmol Si per kg of clay dissolved in the STx-1 suspension. Itrepresents 11 g of dissolved SiO2 per kg of clay. Above pH 8.5, discrepancies exist betweenexperiments A and B and within these experiments as a function of added Fe(II). From pH 8.5to 10, in experiment A, without added Fe(II), solute Si concentration is limited by the equilibriumwith quartz. Beyond, and in both cases, Si concentration is controlled by the precipitation of aCa-Si phase (Tournassat et al., submitted-c). In presence of added Fe(II), the solute Siconcentrations decrease. By applying the same method than shown on Figure 3.19 forpotentiometric titration curves, we restore the Fe(II) free Si concentration curve, by adding once(or twice) the amount of sorbed Fe(II) to the amount of Si in solution (arrows in Figure 3.27, left).In experiment B run in presence of added Fe(II), the solute Si concentrations is lower, betweenpH 8.5 and pH 10.5, compared to Fe(II) free experiment B. We can restore the Si concentrationcurve, obtained without Fe(II), by adding twice the amount of sorbed Fe(II) to the amount of Siin solution (arrows in Figure 3.27, right). The Si concentration of the last point of experiment B,considered together with the increase of Ca- CEC (Figure 3.21) is clearly influenced by theprecipitation of a Ca-Si phase (Tournassat et al., submitted-c).
0
100
200
300
400
500
600
2 4 6 8 10 12
pH
Sol
ute
Si (
mm
ol k
g-1 c
lay)
0
50
100
150
200
250
2 4 6 8 10 12
pH
Sol
ute
Si (
mm
ol k
g-1 c
lay) MX80 STx-1
Quartz equilibrium
Quartz equilibrium
�- cristobalite equilibrium
�- cristobalite equilibrium
Fe sorbed x 2F
e sorbed x 1x 2
Figure 3.27 : Si concentrations in solution as a function of pH in experiments A (left) and B(right), presented in mmol kg-1 clay. Experimental conditions: 0.05 mol l-1 CaCl2, clay content:1.41 g l-1 (experiment A) and 2.03 g l-1 (experiment B), added [Fe(II)] = 86 µmol l-1 (experimentsA and B). Open diamonds: experiments without added Fe(II); Open squares: experiments withadded Fe(II). The black square and arrows indicate a correction of once ( 1) the value ofsorbed Fe(II) (left) or twice ( 2) this amount (right) as explained for Figure 3.19. Equilibriumconcentration of Quartz and cristobalite phases are plotted as mmol kg-1 clay as a function ofpH. �- and �- cristobalite refers to two equilibria listed in the Llnl.dat thermodynamic database.

97 / 204As a conclusion, at even higher pH than the Ca – Si tobermorite like phase precipitates, a
Fe – Si containing phase should precipitate, with Si/Fe molar ration varying between 1 and 2 .At low pH, there is no or little influence of the presence of sorbed Fe(II) on the Si concentration.The results, exhibited on Figure 3.28, show that there is no influence of added Fe(II) on Al andMg concentrations. Hence the addition of Fe(II) has no influence on the montmorillonitedissolution at low pH. This results is at variance with the effect of Zn or Co on the dissolutionrate of hectorite, a trioctahedral smectite (Schlegel et al., 1999; Schlegel, 2000; Schlegel et al.,2001a; Schlegel et al., 2001b). Hectorite dissolution starts to be significant below pH 7(Schlegel, 2000), while the montmorillonite dissolution is significant only below pH 4 (Figure3.27 and Figure 3.28). For instance, Zn can sorb specifically on hectorite edge surface at highsurface coverage (~45 mmol kg-1, Schlegel, 2000) at pH 6.5, i.e. in pH condition where it canaffect hectorite dissolution. With montmorillonite, below pH 4, the amount of sorbed Fe(II) is toolow to have a sufficient surface coverage (Figure 3.19) and thus to have a significant effect onthe dissolution kinetics. At pH higher than 4, Fe(II) sorbs significantly onto montmorilloniteedges but the montmorillonite dissolution kinetics is so slow that no effect of added Fe(II) canbe measured.
0
5
10
15
20
25
30
35
40
2 4 6 8
pH
Sol
ute
Al a
nd M
g (m
mol
kg-1
cla
y)
0
5
10
15
20
25
30
2 4 6 8
pH
Sol
ute
Al a
nd M
g (m
mol
kg-1
cla
y)
Figure 3.28 : Al (open symbols) and Mg (filled symbols) concentrations in solution as a functionof pH in experiments A (left) and B (right), presented in mmol kg-1 clay. Experimental conditions:0.05 mol l-1 CaCl2, clay content: 1.41 g l-1 (experiment A) and 2.03 g l-1 (experiment B), added[Fe(II)] = 86 µmol l-1 (experiments A and B)Diamonds: experiments without added Fe(II);Squares: experiments with added Fe(II).
Dissolution at fixed acid pH (experiment C)
Figure 3.29A presents the results of the MX80 montmorillonite dissolution experimentperformed at pH 2.1 for Si, Al, Fe and Mg in µmol l-1 as a function of time. After a rapid initial

98 / 204dissolution, the clay seems to dissolve afterwards with an almost constant dissolution rate, i.e.steady state is reached after ~5 days. Figure 3.29B was build by applying the following formula:
MeSiinit
MeMe rCCionconcentratCorrected /)( ��� in µmol l-1 [2]
where CMe is the concentration of element Me, CMeinit is the concentration of element Me at the
first experimental point and rSi/Me is the structural Si to Me ratio. For Si, rSi/Si is equal to 1, for AlrSi/Al is equal to 3.98/1.63 = 2.44, and so on… This Figure 3.29B is built to see if the claydissolves congruently or not. In case of congruent dissolution, all experimental points should beon the same curve. Figure 3.29B shows that Si and Al dissolve congruently. This result is inagreement with the dissolution mechanism of hectorite and nontronite at low pH, which wasfound to take place on the edge surfaces (Bosbach et al., 2000; Bickmore et al., 2001). Mg(II)and Fe(II) concentrations are not congruent with the structural formula. This result may beexplained by (i) the dissolution of iron oxide remaining phases as shown in Mössbauerspectrum (see above section) and (ii) the subsequent replacement of Mg2+ by Fe2+ (eventuallyoxidized, see section above) on clay edges. This result confirms also that Fe2+ can sorb on clayedges at very low pH, the increase of Fe2+ concentration being controlled by the kinetics of theFe2+ adsorption and the kinetics of iron oxide phase dissolution.
A
0
50
100
150
200
250
300
350
400
0 5 10 15 20 25
Time (day)
Con
cent
ratio
ns in
sol
utio
n (µ
mol
l-1)
0
200
400
600
800
1000
1200
0 5 10 15 20 25
Time (day)
Cor
rect
ed c
once
ntra
tions
(µm
ol l-
1)C
orre
cted
con
cent
ratio
n (µ
mol
l-1)
(µm
ol l-1
)
B
Figure 3.29 : Dissolution experiment as a function of time at fixed low pH of a MX80 claysuspension: 3.6 g clay l-1, 0.05 mol l-1 CaCl2 + 1.5 mmol l-1 sodium dithionite, pH = 2.1. A:original data. Si (diamonds), Al (squares) Fe (circles) and Mg (triangles) concentrations insolution . B: Si (diamonds), Al (squares) Fe (circles) and Mg (triangles) corrected concentrationsin solution as a function of time in dissolution experiment C. The correction corresponds to the

99 / 204multiplication of the metal concentration by the Si/Metal ratio of the clay structural formula (seetext for details).
Si, Al, Mg and Fe titration after etching (experiment C)
Once completed the pH 2.1 dissolution step, aliquots of suspension were titrated up topH 11 and the readsorption of various solutes was followed. The results are presented in Figure3.30, in term of “sorbed” amounts in mmol kg-1
clay, calculated as follows:
�
MeMe CCMeamountSorbed �
�
0)( [3]
where CMe0 is the total initial amount of element Me given by the last point of the pH 2.1
dissolution experiment (t = 0 for the present experiment) and the subsequent dilution (5 mldiluted in 10 or 11 ml). Positive values indicate that a given element has sorbed or precipitatedduring the 24-hrs experiment, whereas negative values indicate that the given elementdissolved.

100 / 204
AlFe
-5
0
5
10
2 4 6 8 10 12
pH
"Sor
bed"
am
ount
(mm
ol k
g-1)
-10
0
10
20
30
40
2 4 6 8 10 12
pH
"Sor
bed"
am
ount
(mm
ol k
g-1)
-20
0
20
40
60
80
100
120
2 4 6 8 10 12
pH
"Sor
bed"
am
ount
(mm
ol k
g-1)
-60
-40
-20
0
20
40
60
80
2 4 6 8 10 12
pH
"Sor
bed"
am
ount
(mm
ol k
g-1)
-70
-50
-30
-10
10
30
50
70
2 4 6 8 10 12
pH
"Sor
bed"
am
ount
(mm
ol k
g-1)
MgSi
100 % sorption
100 % sorption
100 % sorption
14 % sorption
57 % sorption36 % sorption
Sor
bed
amou
nt (
mm
ol k
g-1 )
Sor
bed
amou
nt (
mm
ol k
g-1 )
Figure 3.30 : Readsorption experiment in tubes as a function of pH. Experimental conditions:0.05 mol l-1 CaCl2, 1.75 (without added Fe(II)) or 1.52 (with added Fe(II)) gclay l-1, added [Fe(II)] =175 µmol l-1. Si, Al, Fe and Mg sorbed amounts are plotted as a function of pH. Diamonds:experiment without added Fe(II). Squares: experiment with added Fe(II). The percentagescorrespond to the maximum sorption data points.
Without added Fe(II) and below pH value of 3.5, Si, Al, Fe and Mg depict a net negativesurface excess via desorption or dissolution. Above a pH value of 3.5, Al is adsorbed onto themontmorillonite as previously observed by Charlet et al. (Charlet et al., 1993) and is notinfluenced by the addition of Fe(II) and its adsorption. Since the sorption of Al occurs in thesame pH range than the sorption of Fe(II), this result shows that there is no competitive sorptioneffect between Fe(II) and Al(III). Then, either sorption site are present in sufficient amount inorder not to have competition between the two sorbing species, or Fe(II) and Al(III) do not sorbon the same sites.
Mg is weakly adsorbed above pH 9.5 and is not influenced by the presence of addedFe(II). Since Fe(II) has been shown to be able to displace Mg(II) from the clay, this resultindicates that Mg(II) should be readsorbed on a site different from one it desorbed from.

101 / 204The Si case is different. On the one hand, one should expect Si concentration to increase
with pH because equilibrium is not attained with respect to the various silica phases. On theother hand, spectroscopic results showed that the sorption of metal on clay minerals can lead tothe neoformation of a clay-like phase, i.e. to the coadsorption of aqueous silica and metal ion(Manceau et al., 1999; Schlegel, 2000; Schlegel et al., 2001b; Dähn et al., 2002b). Silica acidadsorption is typical of a species which deprotonates at high pH (pKa1 = 9.83): adsorptionincrease up to the pK and then decreases, as observed previously in silicic acid adsorption ongoethite (Stumm et al., 1980). Indeed, in absence of added Fe(II), Si adsorption increases frompH 5 to 9.5, to decrease afterwards, i.e. when pH gets close to pKa1. We also note that, at pH 8,the sorbed amount of Si is equal to the sorbed amount of Al, i.e. equal to ~30 mmol kg-1 clay (14% of the initial Si in solution) and that the Si and Fe adsorption curves match each other quitewell (Figure 3.31, top). In presence of Fe(II), the sorption of Si at low pH is enhanced and at pH~8.5, 56 % initial Si is sorbed. Figure 3.31 shows that the readsorption of Si at low pH seems tobe correlated to the sorption of Fe(II). The presence of Fe(II) prevents also netdesorption/dissolution processes up to pH 10.2.
-10
10
30
50
70
2 4 6 8 10 12
pH
"Sor
bed"
am
ount
(mm
ol k
g-1)
-10
10
30
50
70
90
110
130
150
2 4 6 8 10 12
pH
"Sor
bed"
am
ount
(mm
ol k
g-1)
Sor
bed
amou
nt (
mm
ol k
g-1 )
Sor
bed
amou
nt (
mm
ol k
g-1 )
Figure 3.31 : Comparisons of Si (diamonds) and Fe(II) (circles) sorption curves as a function ofpH in readsorption experiments. Experimental conditions: 0.05 mol l-1 CaCl2, 1.75 (withoutadded Fe(II)) or 1.52 (with added Fe(II)) gclay l-1, added [Fe(II)] = 175 µmol l-1. Top: experimentwithout added Fe(II). Bottom: experiment with added Fe(II).

102 / 204
These result stand in apparent contradiction with the results of experiments A and B thatshowed that there is no effect of the presence of Fe(II) on the Si concentration below pH 8.5,when no preliminary dissolution reaction step at low pH was imposed. The simplest way toexplain these results is to consider that at low pH, the Si concentration is controlled by the clayphase dissolution equilibrium. In experiment C, after a dissolution step at low pH, the increaseof pH leads either to the precipitation of an Al-Fe-Si clay-like phase, or to the sorption of theseelements to the clay present in suspension and reconstruction of the clay phase, i.e. surfaceprecipitation. We think that the second mechanism is more probable in our experiment, since Aland Fe “sorb” prior to Si, as a function of pH. Since Fe was shown to displace Mg(II) from theclay structure and therefore to be adsorbed on the clay edges, this analytical chemistryexperiment could be considered as an evidence of surface precipitation. In experiment A and B,the Si concentration was at equilibrium with the clay at near neutral pH and the addedconcentration of Fe(II) was not sufficient to increase sufficiently the ion activity productcorresponding to the precipitation of the clay, and then to lead to the “sorption” of Si. Inexperiment C, after increasing pH, the Si concentration was too high with regards to theequilibrium with clay and the added Fe(II) concentration enhanced the precipitation byincreasing the ion activity product.
In experiment C, the amount of “sorbed” Si together with Fe(II) represents only 20 % ofthe total amount of sorbed Fe(II). Then, only part of Fe(II) must sorb on clay surfaces togetherwith Si (cooperative sorption) and the other part must sorb without Si (replacement of Mg2+ inthe lattice or adsorption plus oxidation mechanism). Then, this experiment shows that thesorption of Fe(II) can not be related to only one phenomena at low pH, as well as at high pH.
ACKNOWLEDGEMENT
This research was funded by the French National radioactive waste management agency(ANDRA).
103 / 204
4. MODELISATION MORPHOLOGICO -STRUCTURALE DE LA REACTIVITE DES
ARGILES

104 / 204

105 / 204
4.1. QUANTIFICATION DES AIRES DES DIFFERENTES SURFACES DEL'ARGILE
L’article qui suit présente la détermination des surfaces de la montmorillonite MX80 pardeux approches indépendantes : la microscopie à force atomique (AFM) et l’absorption de gazà très basse pression. Les deux méthodes aboutissent au même résultat pour la valeur dessurfaces de côté (ou latérale) de l’argile, à savoir environ 8 m2 g-1 (Figure 4.1). Cettecorrespondance confirme la justesse des interprétations des isothermes d’adsorption de gaz àtrès basse pression. Cependant il n’existe pas de correspondance entre les deux expériencespour les autres surfaces. Cette différence provient de la différence d’état d’hydratation et decompaction de l’argile dans les deux types d’expérience. Dans les expériences d’AFM, lesparticules observées proviennent d’une suspension diluée. Les feuillets sont presquetotalement dispersés et les particules sont formées par un ou deux feuillets. La surfacemesurée est alors la surface totale des feuillets. Dans les expériences d’absorption de gaz,l’argile est sèche et souvent sous une forme compactée. Les particules sont constituées d’unempilement de feuillets TOT séparés par des espaces interfoliaires. Ces espaces interfoliairesne sont pas accessibles à la mesure. La surface totale mesurée correspond à la surface totaledes feuillets moins les surfaces interfoliaires.
Surface externe totale à l’état sec, surface BET ~ 30 m2 g-1
Surfaces de bordure, DIS + AFM ~ 8.5 m2 g-1
Surfaces basales et interfoliaires = surface externe totale en suspensionDIS + AFM ~ 750 m2 g-1
TOT
TOT
TOT
Figure 4.1 : Les différentes surfaces des argiles et leurs aires mesurées par différentesméthodes.

106 / 204Dans la plupart des études portant sur les argiles, la surface spécifique des particules est
mesurée par une méthode d'absorption de gaz, la méthode BET (ex : Wanner et al., 1994;Baeyens and Bradbury, 1997; Cama et al., 2000). Cependant, la valeur donnée par cettemesure est de peu d’utilité pour contraindre les modèles de sorption sur les argiles. En effet lasurface BET correspond à la surface externe exprimée par les argiles (Figure 4.1) et necorrespond donc, ni à la surface totale (latérale + basale + interfoliaire), ni à la surface descôtés de l’argile. Les méthodes présentées dans l'article qui suit permettent, elles, decontraindre précisément les surfaces réactives de la montmorillonite MX80, données qui serontutilisées, par la suite, comme un paramètre fixe et non plus comme une variable ajustée.

107 / 204
NANOMORPHOLOGY OF MONTMORILLONITE PARTICLES:ESTIMATION OF THE CLAY EDGE SORPTION SITE DENSITY BY LOW-
PRESSURE GAS ADSORPTION AND AFM OBSERVATIONS.
Christophe Tournassat1, 2, Alexander Neaman3, Frédéric Villiéras3, Dirk Bosbach4, LaurentCharlet1
1 LGIT - CNRS/UJF, Université Joseph Fourier (Grenoble), P.O. Box 53, F 38041 Grenoble,France
2 ANDRA, Parc de la Croix Blanche, 1/7 rue Jean Monnet, F-92298 Châtenay-Malabry CEDEX,France3 Laboratoire Environnement et Minéralurgie, UMR 7569 CNRS&INPL, ENSG, P.O. Box 40, F54 501 Vandoeuvre – lès – Nancy Cedex, France4 Institut für Nukleare Entsorgung (INE), Forschungszentrum Karlsruhe, P.O. Box 3640, 76021Karlsruhe, Germany

108 / 204

109 / 204
ABSTRACT
Dry and in situ (fluid cell) Atomic Force Microscopy (AFM) and Low-Pressure GasAdsorption experiments were used to investigate the surfaces of pure Na-smectite particles.These two techniques permit the identification of different surfaces of the platelets (lateral, basaland interlayer surfaces) and to quantify their surface area. Calculation of the surface area wasdone for AFM, by measuring directly the dimensions of the clay particles on AFM images, andfor gas adsorption experiments, by applying the Derivative Isotherm Summation (DIS)procedure designed by Villiéras et al. (Villiéras et al., 1992; Villiéras et al., 1997a; Villiéras et al.,1997b).
In the present study, we find a discrepancy between the two measurements of the basaland interlayer surface area. This difference is due to the stacking of platelets in dry conditionscompared to their dispersion in aqueous suspension. A particle is estimated to be formed ofnearly 20 stacked layers in the dehydrated state used in the gas adsorption experiment,whereas it is estimated to be formed of only 1 or 2 layers in aqueous suspension, on the basisof AFM measurements. However, the two techniques give similar results for the lateral surfacearea of the platelets (i.e., about 8 m2 g-1) and the perimeter to area ratio value of the particlesbecause the stacking of platelets does not alter these values. This correlation confirms theeffectiveness of the interpretation of the gas adsorption experiments at the lowest pressuredomains as the adsorption on lateral surfaces.
The lateral surface area has important implications in the calculation of specific sorptionsite density on clay material. The relevance of the lateral surface area value (8 m2 g-1) wastested subsequently with sorption data found in the literature. Based on these results we showthat one essential parameter for the calculation of particle edge site density is the meanperimeter to area ratio value. This parameter can be obtained by microscopic techniques butthe measurement is tedious. The good correlation between the AFM results and the DIS –method results for the measurement of the lateral surface area confirms that the DIS – methodoffers a quick and reliable alternative method to measure it. AFM experiments can be furtherconducted to constrain the dispersion around the DIS value and the anisotropy of suspendedparticles.
INTRODUCTION
Sorption mechanisms on clay surfaces have been studied for decades: inorganic cationexchange on the interlayer and basal surfaces (e.g., Sposito, 1981), specific pH dependantsorption of inorganic cations and anions on the edges (e.g., Sposito, 1984), sorption of organichydrophobic molecules on the interlayer and basal surfaces (e.g., Schwarzenbach et al., 1993;Titiloye and Skipper, 2000) and binding of organic matter on the edges (e.g., Claret et al.,2002). Edge sorption mechanisms are related to the acid-basic properties of the clay edges,whereas sorption on the interlayer and basal planes are related to the permanent chargegenerated by the clay structure (cation exchange) or to the presence of hydrophobic patches onthese planes (hydrophobic adsorption).
It appeared in the past twenty years that two types of reaction are necessary to explainion adsorption on clay surfaces. The first one is a cation exchange mechanism which occurs onthe interlayer and basal planes (Figure 4.2), as described by Sposito (Sposito, 1981). Itoriginates from the presence of a permanent negative structural charge in the alumino-silicatelayer created by isomorphic substitutions in the lattice. The quantity of exchange sites (�0) canbe derived from structural formula, and is compensated by “exchangeable cations” whichgenerally form outer sphere complexes with siloxane cavities (Sposito, 1981, 1984). Thesecond type of reaction is the pH-dependent specific sorption on the clay edges (e.g., Fletcher

110 / 204and Sposito, 1989; Avena et al., 1990; Charlet et al., 1993; Wanner et al., 1994; Zachara andSmith, 1994; Baeyens and Bradbury, 1997; Bradbury and Baeyens, 1997). On these clayedges, the proton surface charge (�H) depends on physico-chemical solution parameters (pH,ionic strength) which control the protonation state of the surface (e.g., Fletcher and Sposito,1989; Avena et al., 1990; Charlet et al., 1993; Wanner et al., 1994; Zachara and Smith, 1994;Baeyens and Bradbury, 1997; Bradbury and Baeyens, 1997). It depends also naturally from theamount of available sites for protonation (n):
n = Ni � A Eq. 4.1
where Ni is the edge site density in mol m-2, and A is the surface area in m2 g-1. Hence, in theabsence of values for these last two parameters, it is not possible to calculate a theoreticalvalue for �H. Ni can be obtained by theoretical structural information (White and Zelazny, 1988),but A remains unknown. This information is therefore critical to model the proton and cationsorption on edge surfaces. Furthermore, reactive transport models also need information aboutthe relative amount of basal and interlayer surfaces when applied to a clay medium, e.g., topredict diffusion of radionuclides through a geotechnical bentonite backfill as well as geologicalclay barrier, or the diffusion of organics out of a waste disposal site. The ion exchange mustoccur faster between the solution and the basal planes than between the solution and theinterlayer planes because, in the latter case, ions must diffuse in (and out) the interlayer spaceprior to any sorption process (e.g. Ochs et al., 1998; Ochs et al., 2001).
Figure 4.2 : Cartoon of stacked phyllosilicate layers. Cat = exchangeable cation.
The aim of this investigation was to estimate experimentally the area of the differentsurfaces of swelling clay particles in dry and wet conditions by using two techniques: lowpressure argon adsorption and atomic force microscopy. The mean edge surface area derivedfrom these two techniques is then used with literature data to demonstrate the relevance of thisresult. A synthetic table of clay surface properties is then proposed to model clay systems.
MATERIALS AND METHODS
Solid Preparation and Characterization.
The MX-80 bentonite (Wyoming) sample material was obtained from the French nationalradioactive waste management agency (ANDRA). The fine fraction of the MX80 montmorillonitehas the following structural formula (Sauzéat et al., 2000):

111 / 204(Si3.98Al0.02)(Al1.55Fe3+
0.09Fe2+0.08Mg0.28)O10(OH)2Na0.18Ca0.10
Clay purification.
For AFM experiments, the sample material was dispersed in deionized water and the finefraction (< 2 �m) was isolated by sedimentation techniques. A high concentration of NaCl (from0.5 to 1 M) was maintained during the preparation stages. After saturating the suspension for aminimum of one week with sodium (0.5 M NaCl) it was treated with acidic solution (acetic acid0.1 M), then with dithionate-citrate-bicarbonate (DCB) and finally with 3% H2O2 solutions toremove mineral impurities and organic matter.
For low-pressure gas adsorption analysis, the bentonite was dispersed in water and thefine fraction was separated by sedimentation under gravity. The purified sample was thensaturated with Na. It was treated three times as follows: the suspension was saturated with a 1M NaCl solution, washed with distilled water, and centrifuged until the electrical conductivity ofthe equilibrium solution was <10 dS/m. The samples were then freeze-dried.
Clay Immobilization for AFM imaging.
AFM experiments were performed on both dry samples and in situ samples (i.e., inwater). The montmorillonite particles were deposited on a freshly cleaved graphite sampleholder by putting on the holder a droplet of a montmorillonite-NaCl suspension and by drying itat 40°C. For in situ AFM analysis, the montmorillonite particles were immobilized usingvariations of the technique described by Bickmore et al. (Bickmore et al., 1999) and Bosbach etal. (Bosbach et al., 2000). A small square of freshly cleaved muscovite is dipped into a 1:1000(volume:volume) Polyethyleneimine solution (PEI, C2H5N)n (M.W. 1800, Polysciences,Warrington, Pennsylvania), then rinsed with deionized water, placed at the bottom of acentrifugation tube and immersed in a ~0.05 M NaCl ~0.05 g clay/L suspension. The tube wascentrifuged at 2000 rpm (~900 g) for 25 min. The clay-coated muscovite sample was thenrinsed one time with deionized water and immersed in pure deionized water in an AFM fluid cell.
AFM Imaging.
A Topometrix TMX2000 Explorer AFM operating in tapping mode was used for imagingclay particles under ambient conditions in air (after drying). High aspect ratio silicon singlecrystal AFM tips (Topometrix, product #1660) were used. The cantilever nominal oscillationresonance frequency was 190 kHz. The maximum scan rate was 2 Hz. While they wereexposed to an aqueous solution, images were taken in contact mode. V-shaped Si3N4cantilevers with integrated pyramidal tips were used. Features in the AFM images wereanalyzed using the Image WSxM 2.0 software. The areas and perimeters were measured withthe Image Tool 2.0 software.
Low pressure argon adsorption at 77K.
High-resolution, low-pressure isotherms of argon and nitrogen were recorded on acustom-built automatic quasi-equilibrium volumetric set-up (Michot et al., 1990; Villiéras et al.,1992; Villiéras et al., 1997a; Villiéras et al., 1997b). The experimental procedure has beendiscussed by Rouquerol et al. (Rouquerol et al., 1988) and Michot et al. (Michot et al., 1990).Michot et al.(1990) showed that using low pressure quasi equilibrium volumetry proposed byGrillet et al. (Grillet et al., 1977) and Rouquerol et al. (1988), the resolution of adsorptionisotherms can be enhanced in the low relative pressure domain, i.e. when the first layer of gasis adsorbed. Then, this method equipped with pressure sensors that work at low pressuresallows to study in satisfactory conditions the surface heterogeneity of solids. In the case ofphyllosilicates, it has been demonstrated that such adsorption experiments coupled to a careful

112 / 204analysis of experimental adsorption isotherms enable to derive shape factor, i.e. lateral andbasal surface areas (Bardot et al. 1998; Cases et al. 1986; 2000; Michot et al. 1994; 2002;Villiéras et al. 1992; 1997a; 1997b; Villiéras et al., 2002).
A slow, constant and continuous flow of the adsorbate is introduced into the adsorptionsystem through a microleak. The flowrate is constant, at least up to the BET domain, and canbe adjusted by the pressure imposed before the leak. If the introduction rate is low enough, themeasured pressures can be considered as quasi equilibrium pressures. Then, from therecording of the quasi equilibrium pressure (in the range of 10-3, 3.104 Pa) as a function of time,the adsorption isotherm is derived. In the most recent apparatus, three high accuracy MKSdifferential pressure transducers were used for pressure measurements: 1) 0-1.3 Pa, 2) 0-1.3x10² Pa and 3) 0-1.3x10⁵ Pa (698 type Bartron Pressure transducers). The minimalsensitivities were 1.3x10⁻⁴, 1.3x10⁻² and 1.3 Pa for gauges 1) to 3), respectively. Pressureaccuracy was 0.05% of read pressure. A dynamic vacuum of 10-7 Pa is ensured on thereference side by the use of a turbomolecular vacuum pump. An accurate constant level ofliquid nitrogen is maintained by using a home made electronic controlled device. The frequencyof pressure recording is adjusted after each measurement to record 100 - 200 experimentalpoints per unit log of relative pressure. Thus, 2000 to 3000 experimental points were collectedevery time for relative pressures lower than 0.15 (Villiéras et al. 1992, 1997b).
The data were then treated using the Derivative Isotherm Summation (DIS) proceduredesigned by Villiéras et al. (Villiéras et al., 1992; Villiéras et al., 1997a; Villiéras et al., 1997b) toexamine the surface energetic heterogeneity of the samples. Due to the large number ofexperimental data points acquired by the quasi-equilibrium procedure, the experimentalderivative of the adsorbed quantity as a function of the logarithm of relative pressure can becalculated accurately. The total derivative adsorption isotherm on a heterogeneous surface issimulated by the sum of i local theoretical derivative adsorption isotherms. The adsorptionisotherm on a heterogeneous surface formed with i different energetic domains can be writtenas:
� ��
���i
diiiXiti iXt ������� ).().( Eq. 4.2
where �t is the total adsorption isotherm, �it, the adsorption isotherms on the different energeticdomains of the surface, Xi is its contribution to �t, � is the adsorption energy, � is the physicaldomain of �, �i(�) a "local" theoretical adsorption isotherm and �i(�) is the dispersion of � on theith domain. The experimental curve is then fitted with theoretical local isotherms derived fromBET formalism by using a derivative isotherm summation (DIS) procedure designed for thatpurpose (Villiéras et al., 1992). For each local isotherm, the following parameters are thenobtained:
- the position of the peak (ln P/Po), which depends on solid-gas and gas-gas interactionenergies;
- an apparent gas-gas interaction parameter (�), which depends on real gas-gas interactionenergy and the spreading of solid-gas interaction energies;- a monolayer capacity, which can be converted to surface area by taking into account the crosssectional area of adsorbed argon (i.e. 13.8 Å2).
The experimental conditions were a sample mass of ~0.6 g, outgassing at 0.001 Pa at atemperature of 120°C. The gas used was Argon N56 (purity>99.9996), supplied by Alphagaz(France).

113 / 204
AFM RESULTS
Montmorillonite particles have irregular morphologies like “cornflakes” (Figure 4.3). Someof their edges appear to be aligned in a straight line but their direction can not be attributed toany particular crystallographic direction.
Thin isolated montmorillonite particles are identified both in the in situ experiment and inthe dry experiment. Some particles present several lateral domains with different heights. Thesedifferences of height can be attributed either to precipitates, or to platelet stacking. In the dryexperiments, many high circular peaks are observed (from 5 to 23 nm high, Figure 4.3, whitearrows). These peaks are not observed in the in situ experiments and are attributed to theprecipitation of NaCl salt during the drying step. In both experiments, some particles appear tobe constituted by several layers (Figure 4.3, circled area). The height of the lowest layer wasmeasured for each particle on several transects. 102 measurements (30 particles) for the dryexperiment and 90 measurements (24 particles) for the in situ experiment were recorded.Results are shown in Figure 4.4. Particles do not have the same mean height in dry (12.4 Å �1.4) and hydrated (15.9 Å � 2.1) conditions, nor the same height distribution.
Hence, for the same platelet number, the volume of a particle depends on hydrationconditions. To avoid this problem in the following calculation, we calculated a theoretical volumefor each particle. We determined the number of platelets in each particle, and the volume ofone particle is calculated by multiplying its measured basal area by a theoretical height. Thistheoretical height is equal to the measured number of layers multiplying a constant theoreticalheight of one layer. The theoretical volume of a particle is then given by the formula:
hnareaHareaV t ����� Eq. 4.3
where V is the theoretical volume of the considered particle, Ht its theoretical height, n itsmeasured number of platelets and h the theoretical height of one platelet. We consider a 9.5 Åtheoretical height in order to be consistent with gas adsorption experiments. This valuecorresponds to a completely dehydrated layer whose density can be estimated to be 2.7 kg/dm3
on the basis of the smectite structural formula and cell volume.
The mass of each particle was calculated by the formula: dVm ii �� , where mi and Vi arethe mass and the volume of the particle i, and d is the above density. In the case of particlesconstituted by several layers, the layers were considered individually and summed to obtain theparticle mass and volume values. The lateral surface (in m2/g) of one particle (or layer) wascalculated as follows:
densityareaperimeter
densityheightareaheightperimeter
mheightperimeterS
i �
�
��
�
�
�
� Eq. 4.4
In this formula it is clear that the parameter S does not depend on the height of one layerbut on the chosen density, i.e., the chosen hydration of the system (see discussion below). Inthe following text and tables, the results can be applied to dehydrated particles only. In othercases, a correction factor equal to the ratio between density of dehydrated and hydrated claymust be used.

114 / 204
Figure 4.3 : AFM images of MX-80 particles. Left: dry AFM experiment. Right: in situ AFMexperiment. White arrows indicate NaCl salt precipitates. White rounded areas indicate thepossible stacking of platelets. Note the good correlation between the lateral dimensions of theplatelets and the lateral dimension derived from low-pressure gas measurements (~170 nm).

115 / 204
9 10 11 12 13 14 15 16 17 18 19 20 21 22
num
ber
of m
easu
rem
ents
0
5
10
15
20
25
30
35
40
Height of the particles (Å)
Figure 4.4 : Distribution of the height of the layers as measured with AFM. White bars:distribution within dry samples. Black bars: distribution within in situ samples. The data aregrouped in 1 Å intervals.
The weighed mean values for volume, height and lateral surface were calculated asfollowing:
� ��
i T
ii V
Vxx Eq. 4.5
where x is the recorded parameter (volume, height or lateral surface) of particle i, Vi its volume,and VT the total volume of the measured samples. Results are summarized in the Tab. 4.1. Byrepeating the measurements 5 times, we estimate the error to be approximately 10%.
Height of onelayer(Å)
Mean heightof particles(number ofplatelets)
Lateralsurface area
(m2/g)
lateral surfacearea / volume
ratio = perimeterto area ratio
(nm-1)
Dry AFM samples 12.5 � 1.4 1.32 7.4 � 0.7 0.0199
In situ AFMsamples 15.9 � 2.1 1.82 8.7 � 0.9 0.0235
Weighed mean � 1.51 7.9 � 0.8 0.0212
DIS measurements 9.5* ~29 8.5 0.0230
* Theoretical value
Tab. 4.1 : Morphological parameters of the clay platelets obtained by AFM and low pressuregas adsorption.

116 / 204
LOW-PRESSURE ARGON ADSORPTION RESULTS
An experimental argon derivative isotherm is presented in Figure 4.5 together with theresults of the DIS fitting procedure. Fitting parameters are collected in Tab. 4.2. The curve istypical of phyllosilicates (Villiéras et al., 1992; Villiéras et al., 1997a; Villiéras et al., 1997b;Bardot et al., 1998) with a main peak around P/P0=1.7 10–2 and a shoulder around 8.3 10–4. Themain peak corresponds to the adsorption on basal faces, whereas the shoulder is assigned tothe adsorption on lateral faces. The broad high-energy peak centered on 4.5 10–5 is alsoassigned to lateral faces of the particles, which are considered to be very heterogeneous. As forother phyllosilicates, it is then possible to derive the lateral and basal surface areas to 8.5 and26.6 m2/g, respectively (Villiéras et al., 1997b).
0.0
0.5
1.0
1.5
2.0
2.5
3.0
3.5
4.0
-15 -10 -5 0ln P/Po
13 g STP cm �
���
����
��
�
0
lnPP
Vads
Figure 4.5 : Experimental argon derivative isotherm for the sample MX80 (dotted line) and fittedcurve (thin lines: contribution of elementary surfaces; thick line = sum of the contributions). Thefitting parameters are presented in Tab. 4.2. Arrows indicate the peaks at P/P0 values of 8.0 10-
2, 1.6 10-2, 8.7 10-4 and 3.4 10-5.
As a rough approximation, the smectite particles can be modeled as perfectmonodisperse regular plates with square basal faces. In this case, surface areas of basal andlateral faces can be used simply to derive the thickness (t) and length (l) of the particles:
l = 4 /d.Sl and t = 2 / d.Sb Eq. 4.6
where d is the density (2.7 kg/dm3) and Sl and Sb the lateral and basal surface areas,respectively. Computations give 1743 Å and 278 Å for t and h, respectively. By taking intoaccount the theoretical thickness of one dry smectite unit layer (taken to be equal to 9.5 Å), theamount of 2:1 layers is around 29 in the modeled particles.
Peak Positionln P/P0 P/P0
Vmonolayer(cm3/g)
�
(kT)SSA
(m2/g)
Domain 1 -2.52 8.0 10-2 0.55 1.9 2.0

117 / 204
Domain 2 -4.14 1.6 10-2 6.63 1.3 24.6
Domain 3 -7.05 8.7 10-4 1.51 1.1 5.6
Domain 4 -10.29 3.4 10-5 0.78 -1.4 2.9
Total 35.1
Tab. 4.2 : Parameters adjusted to the experimental argon derivative isotherm presented inFigure 4.5.
DISCUSSION
The AFM observation of Na-montmorillonite particles confirms several properties alreadydemonstrated by other authors with other techniques. First, the AFM observation of the heightof the particles confirms that Na-montmorillonite particles are well dispersed (e.g. Hight et al.,1960; Hight et al., 1962; Cebula et al., 1978), constituted of single or double platelets. Thisbehavior was suggested by Schramm and Kwak (Schramm and Kwak, 1982) based on viscosityand light-transmission measurements of dilute suspensions of montmorillonite having differentexchangeable cations. They reported that the mean number of layers for a Na-montmorilloniteis between 1.2 and 1.7 times the value for a Li-montmorillonite. These values are in goodagreement with those presented in Tab. 4.1. Complementary experiments are needed to statepositively that Li-montmorillonite particles are about one layer thick. Second, the comparisonbetween in-situ and dry-state AFM observations confirms that the height value of one layerdepends on the hydration conditions (e.g., Mooney et al., 1952; Keren and Shainberg, 1975;Sato et al., 1992; Tamura et al., 2000). The peaks distribution is centered on a ~12.5 Å value forthe dry experiment (atmospheric humidity) and on ~15.5 and ~18.5 Å values for the in situexperiment (Figure 4.4). This difference could be due to two factors: (i) the presence in the insitu experiment of the PEI coating between the particle and the mica substrate as explained inBosbach et al. (Bosbach et al., 2000), or (ii) a difference of hydration of the particles. This lastexplanation seems to be in good agreement with previously reported results. Bérend et al. andothers (Bérend, 1991; Cases et al., 1992; Bérend et al., 1995) studied the amount of waterbound to exchangeable cations as a function of the nature of the cation and the humidityconditions. The unit layer of the Na – montmorillonite presents a 9.55 Å thickness for the zero-layer hydrate montmorillonite, 12.5 Å for the one-layer hydrate, 15.6 Å for the two-layers hydrateand 18.6 Å for the three-layers hydrate. These values are in very good agreement with Figure4.4 and above cited distribution peaks. In the dry experiment an one-water molecule layer mayhave formed between the substrate and the clay particle, or between two platelets within agiven particle, whereas in the in situ experiment a two- and three-layer hydrates should haveformed (Bérend, 1991; Cases et al., 1992).
The observed lateral dimension (l) of the platelets (Figure 4.3) are consistent with themean dimension calculated on the basis of the rectangular plate model (DIS l = 174 nm, AFMdry l = ~145 nm, AFM in situ l = ~190 nm, AFM mean l = ~170 nm), although this model shapedoes not fit real shape of the particles (see Figure 4.3). By considering a rectangular platemodel and the measured lateral surface area to calculate the “mean lateral dimension” of theplatelets, we underestimate the mean dimension. The particles are, in fact, larger, but haveconvexities and concavities that increase their lateral surface area.
The important result of this AFM study is that the mean lateral surface area and meanlateral surface area to volume ratio are in good agreement with the value obtained with the DISmethod. Hence, the comparison of the AFM and DIS results confirms the reliability of theinterpretation of the DIS low-pressure domain as the edge surface contribution. However, the

118 / 204mean height of the particles is not concordant. No AFM-measured value is in agreement withthe BET-surface area reported for the MX-80 montmorillonite (31.5 m2/g, Wanner et al., 1994).This BET value is close to the sum of the lateral and basal surface areas measured with the DISmethod but, in fact, has no significance for montmorillonite in suspension due to layerexpansion and dispersion in water (Norrish, 1954). The difference of height values of theparticles is due to the stacking of the platelets in dehydrated conditions. This stacking does notchange the accessibility of the lateral surfaces, but the stacking of layer creates interlayersurfaces, which are not accessible like all basal surfaces as observed with water vapor.Consequently, basal surface area derived from argon adsorption is meaningless whenphenomena at solid/water interface are considered, and should not be used to model edgesurface phenomena, as previously done by several authors (e.g. Wanner et al., 1994; Bradburyand Baeyens, 1997; Boult et al., 1998; Cama et al., 2000; Avena, 2002). Instead, we proposethat the edge surface value given in this article should be used.
APPLICATION
The models of clay titrations and sorption isotherms on clay minerals involve theknowledge of the amount of sites available for such processes. The site density is sometimesfixed arbitrarily, for example at 10-15 % of the total cation exchange capacity value (CEC)(Fletcher and Sposito, 1989), or is fitted concomitantly with the pK of the edge sites (Bradburyand Baeyens, 1997). In fact, the edge site density does not differ a lot from one study to oneanother and 10-15 % of the CEC value can be considered as a good empirical value. The aimof this paragraph is to demonstrate, with previously published data, that a reliable estimate ofthe edge site can be derived from the perimeter to area ratio value and some structuralinformation. This result makes sense to the empirical 10-15 % CEC value usually used to modelsorption data.
In the following, the reference studies were carried out on the fine fraction of smectites.Then the size of the particles and the perimeter to area ratio value measured in the presentpaper are similar to those of the published data clay material. The number of edge sites iscalculated after the results of White and Zelazny (White and Zelazny, 1988) and the perimeterto area ratio of the clay (RP/A in m-1), according to the equation:
dRN
n APOcAl
/�
� Eq. 4.7
dRN
n APTSi
/�
� Eq. 4.8
where nSi and nAl are the site densities of silanol and aluminol edge sites respectively (inmol/kg), NT and NOc are the site densities given by White and Zelazny (White and Zelazny,1988) (in mol/m2), d is the density of the clay material (in kg/m3). NT and NOc depend on thestructural formula of the clay. With the following general structural formula of a montmorillonite,M0.33(Al2-xMgx)(Si4-yAlyO1O(OH)2, NT and NOc can be estimated to:
26 mol/m4
41039.6 yNT�
���� Eq. 4.9
26 mol/m2
21039.6 xNOc�
���� Eq. 4.10

119 / 204Tab. 4.3 summarizes the comparison results. There is a very good agreement betweenpublished values and the value calculated with the present method. Then the empirical value foredge sites density can be retrieved with structural and morphological information.
Study+
Smectite name
Method foredge sitedensity
evaluation
nAl(mmol/kg)
nSi(mmol/kg)
nAl + nSi
or total amount offormal sites (>SOH)
(mmol/kg)
This study AFM + DIS* 39.4± 1.8‡
51.1± 2.3‡
90.5± 4.1‡
Stadler andSchindler (Stadler
and Schindler,1993)
Swy-1 †
Fitted value 59.8± 0.5
35.5± 0.4
95.3± 0.9
Charlet et al.(Charlet et al.,
1993)Swy-1†
Fixed value § - - 86.4
Zachara and Smith(Zachara andSmith, 1994)
Swy-1
Fitted value 39.5 47.4 86.9
Bradbury andBaeyens (Bradbury
and Baeyens,1997, 1998)
Swy-1
Fitted value - - 82.0
† Swy-1 structural formula (Zachara et al., 1993):M0.359(Al1.515Fe(III)0.205Mg0.266)(Si3.925Al0.075)O10(OH)2* Calculation assuming d = 2.7 g/cm3, and a perimeter to area ratio value of 0.022 ± 0.001 nm-1.‡ The standard deviation interval corresponds to the standard deviation between AFM andDIS measurements§ See reference article for details
Tab. 4.3 : comparison between the number of sites published in the literature and the number ofsites calculated by the present method.
This result shows that the perimeter to area ratio is the key parameter that must bemeasured and used for edge-site density calculation. It confirms that a simple BET-measurement is not a reliable measurement for the calculation of clay reactive surface area inelectrolyte suspensions as previously suggested by other authors. The perimeter to area ratiocan be obtained by microscopic techniques but this work is tedious. We have demonstrated thatthe low-pressure domain of the DIS curve can be interpreted as the contribution of the edgesurfaces. Hence, we propose the DIS method as an alternative way to quickly determine thelateral surface area of pure clay minerals. The Tab. 4.4 summarizes our results for the Na-MX80 clay fraction, both in dilute suspension and in a compacted state. The tabulated surfacevalues should be used as fixed parameter in clay models. On going studies of clay titration willconfirm the relevance of this approach.

120 / 204
Basal SurfaceArea (m2 g-1)
InterlayerSurface Area
(m2 g-1)
Edge SurfaceArea (m2 g-1)
Total SurfaceArea (m2 g-1)
Compactedclay 26.6 753 8.5 788
Clay in dilutesuspension 780* N.A* 8.5 788
* The platelets are one layer thick
Tab. 4.4 : Surface area values for the Na-MX80 clay fraction in suspension and in compactedstate.
ACKNOWLEDGMENTS
This research was partly funded by the French National radioactive waste management agency(ANDRA, Agence Nationale de gestion des Déchets RAdioactifs) and by EGIDE Procope(Project 99151). AFM facilities at the Institut für Nukleare Entsorgung of the ForschungszentrumKarlsruhe were used. Special thanks to M. Plaschke and Ms. Pieper (INE) for their help with theAFM.
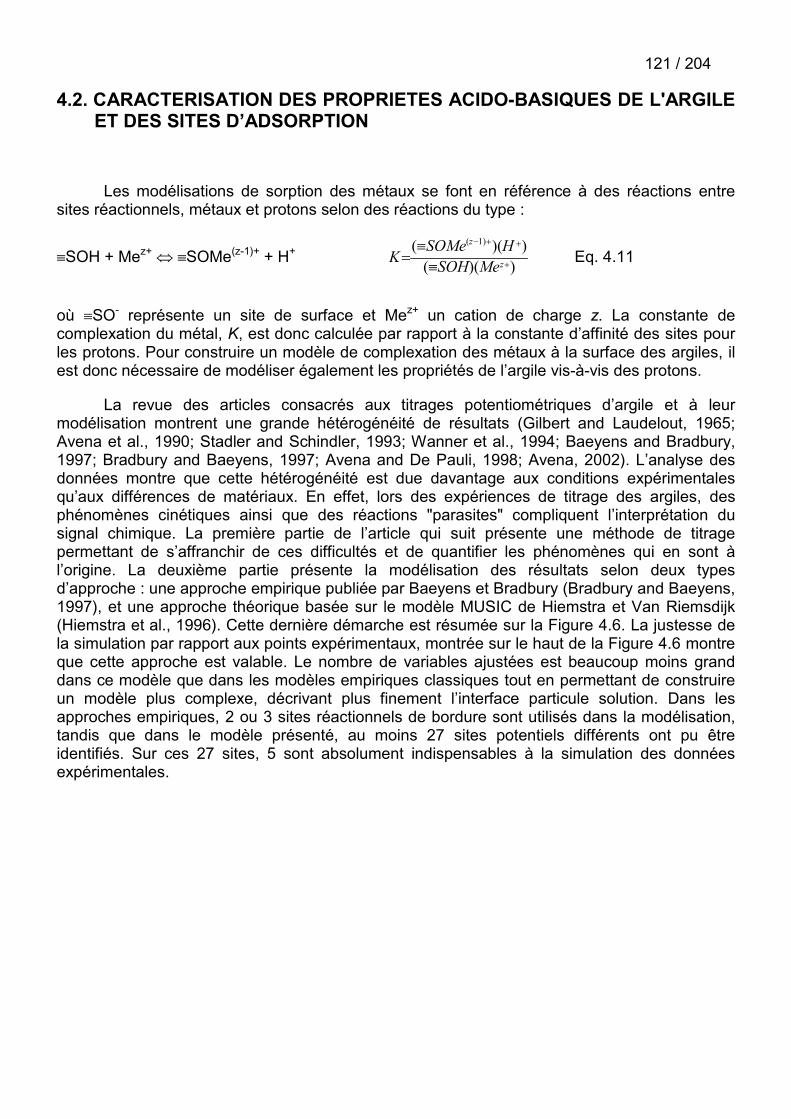
121 / 204
4.2. CARACTERISATION DES PROPRIETES ACIDO-BASIQUES DE L'ARGILEET DES SITES D’ADSORPTION
Les modélisations de sorption des métaux se font en référence à des réactions entresites réactionnels, métaux et protons selon des réactions du type :
�SOH + Mez+ � �SOMe(z-1)+ + H+ ))(())(( )1(
�
���
�
�
� z
z
MeSOHHSOMe
K Eq. 4.11
où �SO- représente un site de surface et Mez+ un cation de charge z. La constante decomplexation du métal, K, est donc calculée par rapport à la constante d’affinité des sites pourles protons. Pour construire un modèle de complexation des métaux à la surface des argiles, ilest donc nécessaire de modéliser également les propriétés de l’argile vis-à-vis des protons.
La revue des articles consacrés aux titrages potentiométriques d’argile et à leurmodélisation montrent une grande hétérogénéité de résultats (Gilbert and Laudelout, 1965;Avena et al., 1990; Stadler and Schindler, 1993; Wanner et al., 1994; Baeyens and Bradbury,1997; Bradbury and Baeyens, 1997; Avena and De Pauli, 1998; Avena, 2002). L’analyse desdonnées montre que cette hétérogénéité est due davantage aux conditions expérimentalesqu’aux différences de matériaux. En effet, lors des expériences de titrage des argiles, desphénomènes cinétiques ainsi que des réactions "parasites" compliquent l’interprétation dusignal chimique. La première partie de l’article qui suit présente une méthode de titragepermettant de s’affranchir de ces difficultés et de quantifier les phénomènes qui en sont àl’origine. La deuxième partie présente la modélisation des résultats selon deux typesd’approche : une approche empirique publiée par Baeyens et Bradbury (Bradbury and Baeyens,1997), et une approche théorique basée sur le modèle MUSIC de Hiemstra et Van Riemsdijk(Hiemstra et al., 1996). Cette dernière démarche est résumée sur la Figure 4.6. La justesse dela simulation par rapport aux points expérimentaux, montrée sur le haut de la Figure 4.6 montreque cette approche est valable. Le nombre de variables ajustées est beaucoup moins granddans ce modèle que dans les modèles empiriques classiques tout en permettant de construireun modèle plus complexe, décrivant plus finement l’interface particule solution. Dans lesapproches empiriques, 2 ou 3 sites réactionnels de bordure sont utilisés dans la modélisation,tandis que dans le modèle présenté, au moins 27 sites potentiels différents ont pu êtreidentifiés. Sur ces 27 sites, 5 sont absolument indispensables à la simulation des donnéesexpérimentales.

122 / 204
Modélisation des titrages potentiométriques
Types de sites et quantités Affinité pour les sites
Morphologie Structure
AFM – Isothermes d’absorption de gaz
0.0
0.5
1.0
1.5
2.0
2.5
3.0
3.5
4.0
-15 -10 -5 0ln P/Po0.0
0.5
1.0
1.5
2.0
2.5
3.0
3.5
4.0
-15 -10 -5 0ln P/Po
Chimie analytique
-0.20
-0.10
0.00
0.10
0.20
0.30
0.40
1 2 3 4 5 6 7 8 9 10 11 12
pH
��
H+ (eq
kg-1
)
Littérature
Modélisation des titrages potentiométriques
Types de sites et quantités Affinité pour les sites
Morphologie Structure
AFM – Isothermes d’absorption de gaz
0.0
0.5
1.0
1.5
2.0
2.5
3.0
3.5
4.0
-15 -10 -5 0ln P/Po0.0
0.5
1.0
1.5
2.0
2.5
3.0
3.5
4.0
-15 -10 -5 0ln P/Po
AFM – Isothermes d’absorption de gaz
0.0
0.5
1.0
1.5
2.0
2.5
3.0
3.5
4.0
-15 -10 -5 0ln P/Po0.0
0.5
1.0
1.5
2.0
2.5
3.0
3.5
4.0
-15 -10 -5 0ln P/Po
Chimie analytique
-0.20
-0.10
0.00
0.10
0.20
0.30
0.40
1 2 3 4 5 6 7 8 9 10 11 12
pH
��
H+ (eq
kg-1
)
LittératureLittérature
Figure 4.6 : Démarche adoptée pour la construction d'un modèle morphologico-structural de laréactivité des surfaces des argiles.

123 / 204
THE TITRATION OF CLAY MINERALS. PART I. DISCONTINUOUSBACKTITRATION TECHNIQUE COMBINED TO CEC MEASUREMENTS
Christophe Tournassat1,2, Jean-Marc Greneche3, Delphine Tisserand1, Laurent Charlet1
To be submitted to Journal of Colloid and Interface Sciences
1 LGIT - CNRS/UJF, University of Grenoble-I, P.O. Box 53, F 38041 Grenoble, France
2 ANDRA, Parc de la Croix Blanche, 1/7 rue Jean Monnet, F-92298 Châtenay-Malabry CEDEX, France
3 Laboratoire de Physique de l'Etat Condensé, UMR CNRS 6087, University du Maine, F-72085Le Mans, CEDEX 9, France

124 / 204
125 / 204
ABSTRACT
In this paper, a critical review of previous works on clay potentiometric titration is made topoint out the difficulties encountered to interpret such data. To avoid these difficulties, a refinedtitration technique is proposed, combining discontinuous backtitration and CEC measurementtechniques. This technique was applied to the potentiometric titration of Na- and Ca-conditioned montmorillonites. Each of the following contributions can be discriminated andprecisely estimated: cation exchange, edge surface proton charge, dissolution of clay, andprecipitation of new phases.
Thanks to these results, we have shown that a precise measurement of the variations ofnet proton surface charge is possible. This result has important implications in clay surfacemodeling (see part II of this article) and in processes that are dependent on the clay surfacecharge, e.g., alteration, rheological processes, or contamination retention applications. Assecondary results, this study confirms the adsorption of ionic pairs such as CaCl+ in exchangesite position and shows that CaOH+ can behave like CaCl+. This result, together with theevidence of precipitation of a Ca-Si phase in a short time scale (one week) at high pH and lowtemperature, could be used to constrain the understanding of the concrete / clays interactions.At low pH, we confirm and quantify the H+/Na+ exchange reaction. We demonstrate finally thatboth the edge surface charge and the permanent structural charge are compensated by thenon-specific sorption of cations from the solution in the whole pH range. Therefore, the surfacepotential is fully screened and does not need to be invoked to model the sorption processes onclay particles in dilute suspensions.
Key words: clay, potentiometric titration, backtitration, CEC
126 / 204
INTRODUCTION
Sorption mechanisms on clay surfaces have been studied for decades and onedistinguishes: (i) inorganic cation exchange in the interlayer and on basal plane surfaces (e.g.Sposito, 1981) and (ii) specific pH dependant sorption of cations and anions on the edges (e.g.Sposito, 1984). Edge sorption mechanism is related to the acid-basic properties of the clayedges (Fletcher and Sposito, 1989; Charlet et al., 1993; Stadler and Schindler, 1993; Zacharaand Smith, 1994; Bradbury and Baeyens, 1997; Avena, 2002 and others) whereas cationexchange on basal planes is related to the permanent charge generated by the clay structure(Sposito, 1981). The former mechanism is a pH dependant specific sorption on the clay edges.It has already been well established that the proton surface charge density (�H) on the clayedges depends on physico-chemical solution parameters (pH, ionic strength) which control theprotonation state of the surface (Fletcher and Sposito, 1989; Charlet et al., 1993; Zachara et al.,1993; Wanner et al., 1994; Baeyens and Bradbury, 1997; Bradbury and Baeyens, 1997; Avena,2002 and others). The latter mechanism originates from the presence of a permanent negativestructural charge in the alumino-silicate layer created by isomorphic substitutions in the lattice.The density of exchange sites (�o) can be derived from structural formula, and is compensatedby “exchangeable cations”, which generally form outer sphere complexes with siloxane cavities(Sposito, 1981, 1984).
In the literature, these two mechanisms are often analyzed separately. In this study wefirst show the limitations of such experimental approaches and then we try to developexperimental tools to study of the two mechanisms concomitantly. This approach is used toconstrain clay potentiometric titration data.

127 / 204
EXPERIMENTAL AND THEORETICAL BACKGROUND ON TITRATIONS TECHNIQUES
The first attempts to titrate the sorption sites on clay mineral edges were conducted withthe same method as for oxides, i.e. by continuous titrations in reactor (Charlet et al., 1993;Wanner et al., 1994; Avena and De Pauli, 1998). The amount of H+ bound to the surface iscalculated according to formula (Wanner et al., 1994)
� � ���
����
����
�
��� CHKwHtH
aH
c
][][][1 Eq. 4.12
in which �[H+] is the proton surface charge expressed in mol kg-1 clay, a is the clay content ofthe suspension in kg clay l-1, [H+]t is the total amount of H+ in the system in mol l-1, [H+] is theconcentration of proton measured in the suspension in mol l-1, cKw is the dissociation constant ofwater at the temperature of the experiment and at a given ionic strength, and C is a correctionfactor used to consider side-reactions like clay dissolution. In this approach, some problems aredifficult to resolve, e.g., the definition of [H+]t absolute value and the definition of C. [H+]t must beconsidered as the sum of an initial unknown total concentration of H+; present in the suspensionat the start of the experiment, [H+]init, plus the measured concentration of H+ added (or removed)during the titration, [H+]added. One titration curve does not give any information on �[H+] and thendoes not permit to give an absolute measurement of the proton edge surface charge. In case ofoxides, the titration curves recorded at different ionic strengths cross each other at a singlepoint, the point of zero salt effect (PZSE), which is assigned to be equal to the point of zero netproton charge (PZNPC) (e.g. Jolivet, 1994 and references therein). Hence, [H+]init can becalculated and the recalculated �[H+] values can be considered as absolute values. In the caseof clay minerals, the titration experiments conducted at different ionic strengths failed to find aunique cross point of the curves (Wanner et al., 1994; Baeyens and Bradbury, 1997; Avena,2002). Thus, [H+]init can not be determined and the �[H+] values are only relative values asstated by Avena (Avena, 2002). Hence, the results should be expressed as relative values andshould be noted �(�[H+]). The C factor, when present, is not clearly described (Wanner et al.,1994) and since the dissolution rate of clay minerals as a function of pH is not well known, it isdifficult to estimate the relevance of this correction factor. The increase of uncertainty linked tothe measurement at low and high pH gives some additional difficulties (Wanner et al., 1994). Inprevious studies, pH drift lower than of 1 mV h-1 (Charlet et al., 1993), 1 mV/5 min (Wanner etal., 1994), 1mV min-1 (Avena and De Pauli, 1998) were considered as sufficient criteria toassess the equilibrium of the protonation reaction. 1 mV corresponds to 0.02 pH unit, which canbe considered as the standard error on the pH measurement. Then, according to equation 4.12,the error on �[H+] due to the error on the pH measurement is equal to
� �02.02 1010
1011
���
�
����
���
�� pHpH
pH
Kwa
error Eq. 4.13
Considering a = 5 g l-1, the error is negligible between pH 4.5 to 9.5 (i.e. error < 0.5 mmol kg-1)but becomes greater and greater outside of this pH range. At pH 2 or 12 the error value has thesame order of magnitude as the total amount of edge sites assumed to be present (100 mmolkg-1, after Charlet et al., 1993; Zachara and Smith, 1994; Bradbury and Baeyens, 1997). Lastbut not least, a fourth problem arises when the reversibility of the protonation reaction is tested.Baeyens and Bradbury observed a hysteresis phenomena when they tried to titrate a claysuspension by increasing the pH and then by decreasing the pH (Baeyens and Bradbury, 1995,1997). This behavior was verified as preliminary experiment in the present study. Thishysteresis can originate from several processes: dissolution of the solid phase, or carbonateeffect, as pointed out by Gaboriaud and Ehrhardt in the case of goethite titration (Gaboriaud and
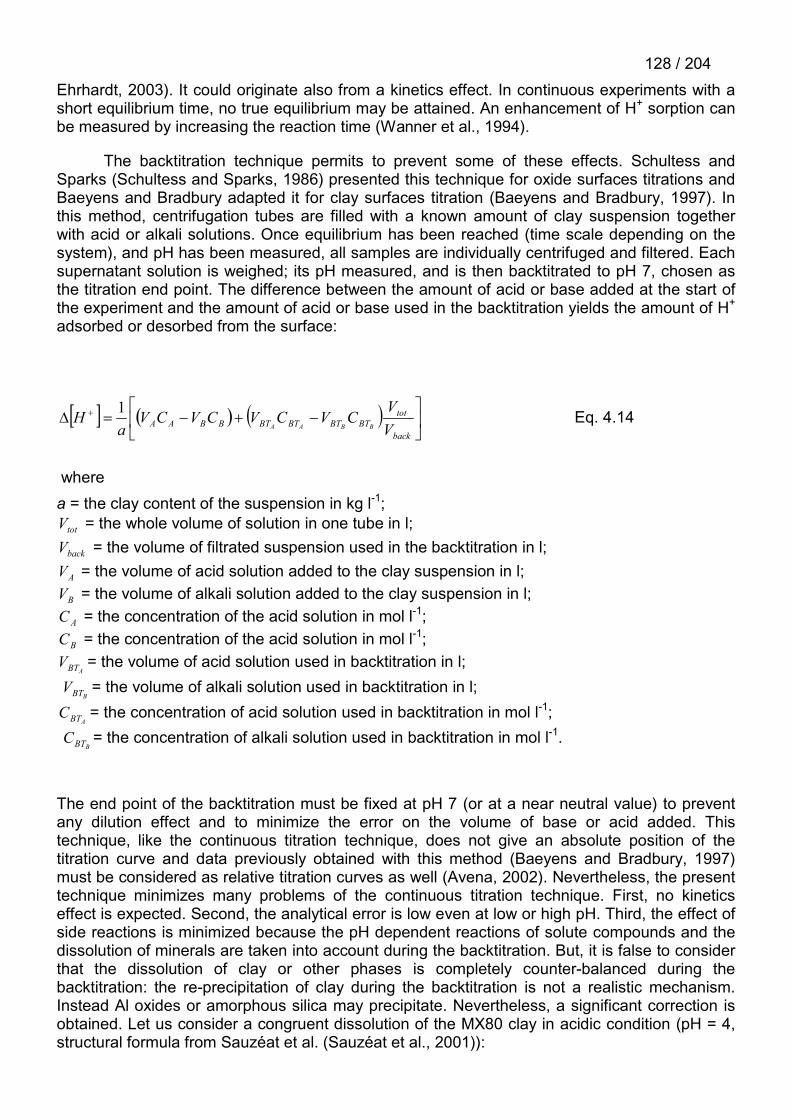
128 / 204Ehrhardt, 2003). It could originate also from a kinetics effect. In continuous experiments with ashort equilibrium time, no true equilibrium may be attained. An enhancement of H+ sorption canbe measured by increasing the reaction time (Wanner et al., 1994).
The backtitration technique permits to prevent some of these effects. Schultess andSparks (Schultess and Sparks, 1986) presented this technique for oxide surfaces titrations andBaeyens and Bradbury adapted it for clay surfaces titration (Baeyens and Bradbury, 1997). Inthis method, centrifugation tubes are filled with a known amount of clay suspension togetherwith acid or alkali solutions. Once equilibrium has been reached (time scale depending on thesystem), and pH has been measured, all samples are individually centrifuged and filtered. Eachsupernatant solution is weighed; its pH measured, and is then backtitrated to pH 7, chosen asthe titration end point. The difference between the amount of acid or base added at the start ofthe experiment and the amount of acid or base used in the backtitration yields the amount of H+
adsorbed or desorbed from the surface:
� � � � � � ��
��
���� �
back
totBTBTBTBTBBAA V
VCVCVCVCV
aH
BBAA
1 Eq. 4.14
wherea = the clay content of the suspension in kg l-1;
totV = the whole volume of solution in one tube in l;
backV = the volume of filtrated suspension used in the backtitration in l;
AV = the volume of acid solution added to the clay suspension in l;BV = the volume of alkali solution added to the clay suspension in l;AC = the concentration of the acid solution in mol l-1;BC = the concentration of the acid solution in mol l-1;
ABTV = the volume of acid solution used in backtitration in l;
BBTV = the volume of alkali solution used in backtitration in l;
ABTC = the concentration of acid solution used in backtitration in mol l-1;
BBTC = the concentration of alkali solution used in backtitration in mol l-1.
The end point of the backtitration must be fixed at pH 7 (or at a near neutral value) to preventany dilution effect and to minimize the error on the volume of base or acid added. Thistechnique, like the continuous titration technique, does not give an absolute position of thetitration curve and data previously obtained with this method (Baeyens and Bradbury, 1997)must be considered as relative titration curves as well (Avena, 2002). Nevertheless, the presenttechnique minimizes many problems of the continuous titration technique. First, no kineticseffect is expected. Second, the analytical error is low even at low or high pH. Third, the effect ofside reactions is minimized because the pH dependent reactions of solute compounds and thedissolution of minerals are taken into account during the backtitration. But, it is false to considerthat the dissolution of clay or other phases is completely counter-balanced during thebacktitration: the re-precipitation of clay during the backtitration is not a realistic mechanism.Instead Al oxides or amorphous silica may precipitate. Nevertheless, a significant correction isobtained. Let us consider a congruent dissolution of the MX80 clay in acidic condition (pH = 4,structural formula from Sauzéat et al. (Sauzéat et al., 2001)):

129 / 204(Si7.96Al0.04)(Al3.10Fe3+
0.18Fe2+0.16Mg0.56)O20(OH)4Na0.76 + 8.38 H2O + 11.62 H+
7.96 H4SiO40 + 3.14 Al+3 + 0.16 Fe2+ + 0.18 Fe(OH)3(s) + 0.56 Mg2+ + 0.76 Na+
The backtitration to pH 7 leads to the formation of the following solute species:
7.96 H4SiO40
7.96 H4SiO40
3.14 Al+3 + 9.42 OH- 3.14 Al(OH)3(s)
0.16 Fe2+ 0.16 Fe2+
0.18 Fe(OH)3(s) 0.18 Fe(OH)3(s)
0.56 Mg2+ 0.56 Mg2+
0.76 Na+ 0.76 Na+
Thus, 11.62 H+ are consumed by the dissolution reaction and 9.42 OH- are consumed duringthe backtitration. The global H+ balance (+ 2.2 H+) is the same in case of alkali dissolution:
(Si7.96Al0.04)(Al3.10Fe3+0.18Fe2+
0.16Mg0.56)O20(OH)4Na0.76 + 12.04 H2O + 5.92 OH-
7.96 H3SiO4- + 3.14 Al(OH)3(s) + 0.16 FeOH+ + 0.18 Fe(OH)3(s) + 0.56 Mg2+ + 0.76 Na+
7.96 H3SiO4- + 7.96 H+
7.96 H4SiO40 or 7.96 (SiO2(s) + 2 H2O)
3.14 Al(OH)3(s) 3.14 Al(OH)3(s)
0.16 FeOH+ + 0.16 H+ 0.16 Fe2+
0.18 Fe(OH)3(s) 0.18 Fe(OH)3(s)
0.56 Mg2+ 0.56 Mg2+
0.76 Na+ 0.76 Na+
5.92 OH- are consumed by the dissolution reaction and 8.12 H+ are consumed during thebacktitration. Furthermore, the precipitation of Al(OH)3(s), or Fe(OH)3(s) in the centrifugation tubedoes not change the final balance. The dissolution of silica phases is also fully taken intoaccount with this technique. Thus the proton release or sink issued from a non-congruentdissolution is also well taken into account with this method. Nevertheless, since trivalent cationsgenerated by dissolution processes are partially removed from solution by cation exchange,they may not be backtitrated and the relative proton charge is underestimated as stated byBaeyens and Bradbury (Baeyens and Bradbury, 1997). This effect can be minimized and oravoided by choosing a high Na+ or a Ca2+ background salt concentration. In other case, acorrection must be applied, or the pH-domain, in which the dissolution occurs, cannot beanalyzed.

130 / 204In this study we propose a refinement of the technique by combining the backtitration
technique with the cation exchange capacity (CEC) measurement method described by Spositoet al. (Sposito et al., 1981; Sposito et al., 1983a). The combination of the two methods permitsto evaluate the relative proton charge variations together with the CEC variations as a functionof pH. It allows to distinguish protons sorbed on the basal plane and protons sorbed on clayedges, and to evaluate the effect of proton uptake by clay edges on the overall CEC.
MATERIAL AND METHOD
Chemicals.
All solutions and suspensions were prepared with boiled, argon-degassed Millipore Milli-Q 18 M�water. NaOH and HCl stock solutions were made from Titrisol ampoules. NaCl andCaCl2 solutions were prepared from analytical grade salts.
Clay material preparation.
MX80 clay sample (commercial Wyoming bentonite, reference BF100, CETCO France)material was obtained after a homogenization treatment from ANDRA (the French NationalRadioactive Waste Management Agency) and was dispersed in deionized water. The finefraction (< 2 �m) was isolated by sedimentation. After saturating the suspension with NaCl (0.5M), it was successively treated with a 0.1 M acetic acid, 0.5 M NaCl solution to removecarbonates, then with a dithionate-citrate-bicarbonate solution (DCB + 0.5 M NaCl), and finallywith 3% H2O2, 0.5 M NaCl to remove mineral impurities and organic matter (Schlegel, 2000).The final suspensions were washed with either 0.5 M NaCl or 0.05 M CaCl2 solutions and thenargon-degassed.
Clay material characterization.
XRD data
The raw material and the Na- and Ca-conditioned clay material were characterized with aSiemens D501 X-ray diffractometer equipped with a scintillation detector and diffracted-beammonochromated Co K� radiation. Stepping rotor drive and data collection were performed witha Socabim DACO system. Oriented slides were prepared by pipetting slurry of the claysuspensions on a glass side and drying it at 40°C for a few hours to obtain an air-driedpreparation. Results are exhibited in Figure 4.7. The diffraction patterns of the conditionedmaterial were found to be in agreement with Na- and Ca-saturated smectites and showed thatfew impurities (mostly quartz and cristobalite) were present after preparation. These impuritiescannot be removed completely from natural clay, because they are as fine as clay particles andthey can not be dissolved by chemical treatment, without dissolving clay particles.

131 / 204
0
5 15 25 35
2 � CoK�
Figure 4.7: Oriented XRD patterns of the fine fraction of the MX80 (full thin line), treated Na-MX80 (dotted line), and treated Ca-MX80 (dotted-dashed line). The arrows indicate theremaining presence of cristobalite (4.03 Å) and quartz (3.34 Å) after treatment.
Mössbauer data and chemical analysis
The Mössbauer spectrum of the Na-conditioned smectite was recorded at 77 K using aconstant acceleration spectrometer and a 57Co source diffused into a rhodium matrix. Velocitycalibrations were made using �-Fe foil at 300 K. The hyperfine parameters were refined using aleast-squared fitting procedure (program MOSFIT, Teillet and Varret, ). Results are shown onFigure 4.8, and the associated hyperfine parameters are shown in Tab. 4.5. In addition to theexpected quadrupolar doublets of Fe(III) and Fe(II), the spectrum exhibits two unexpectedfeatures: a magnetic sextet with broadened lines, and, a strongly distorted base line as it isindicated at about ~ - 2 mm s-1 by the arrow in Figure 4.8. The fitting model consists thus inthree quadrupolar doublets (two attributed to Fe(III) sites and one to Fe(II) site), and a singleline and a magnetic sextet, both with broad lines. It is clear that other fitting models can beproposed but after different assumptions, we conclude that the present one is ratherreasonable. One criterion of goodness was the proportion of each iron type, taken as theabsorption area of each component. Let us emphasize that the scattering of results is given bythe error bars that are listed in Tab. 4.5. The magnetic sextet is attributed to the presence ofremaining iron oxides while the single line is probably due to the presence ofsuperparamagnetic Fe(III) containing particles, resulting from uncompleted chemical reaction.The amount of oxides is too low to be characterized by XRD (~18 % of the total iron). Heron etal. (Heron et al., 1994) have demonstrated that the DCB-treatment does not remove all theoxyhydroxides present in sediments, but, that some large particles (e.g. goethite or hematite)are not completely dissolved. This result points out the difficulty in obtaining a pure smectitefrom a natural bentonite. In absence of other information, the contribution of the singlet isattributed to Fe3+ present in the smectite structure. Based on this assumption, the clay structuralFe(II)/Fe(III) balance has been calculated at Fe2+/Fetot = 11/82 = 13 %. According to Sauzéat etal. (Sauzéat et al., 2001), the fine fraction of the MX80 montmorillonite has the followingstructural formula in the Na-saturated form:
(Si3.98Al0.02)(Al1.55Fe3+0.09Fe2+
0.08Mg0.28)O10(OH)2Na0.38

132 / 204with the formula in the Ca-saturated expected to be:
(Si3.98Al0.02)(Al1.55Fe3+0.09Fe2+
0.08Mg0.28)O10(OH)2Ca0.19
I.S.mm s-1
mm s-1Q.S. or2�
mm s-1BhfT %
Fe(III) A 0.45 (0.01) 0.47 (0.04) 0.50 (0.05) 20 (2)
Fe(III) B 0.45 (0.01) 0.47 (0.04) 1.12 (0.05) 10 (2)
Singlet 0.45 (0.01) 4.2 0 41 (5)
Fe(II) 1.26 (0.02) 0.27 (0.02) 3.07 (0.05) 11 (2)
Magneticsextet
0.45 (0.01) 1.65 0.14 (0.05) 50 (2) 18 (5)
I.S. = isomer shift; = linewidth; Q.S. = quadrupolar splitting value ; 2��= quadrupolarshift value, Bhf = hyperfine field value, % = ratio of each component.
Tab. 4.5 : Mössbauer parameters of the Na-conditioned smectite. Error bars are indicated inparenthesis.
-9 -6 -3 0 3 6 9
1,00
ARGILE BASE 77K
rela
tive
trans
mis
sion
V [mm/s]
Rel
ativ
e tr
ansm
issi
on
V (mm s-1)-9 -6 -3 0 3 6 9
Figure 4.8 : Dots: 77 K Mössbauer spectrum of the Na-conditioned clay. Thin lines:decomposition of the spectrum. Thick line: sum of all the contributions of the decomposition.The parameters of the decomposition are given in Tab. 4.5. Contributions of Fe(III) A and Fe(III)B are shown together.
The Mössbauer results show clearly a discrepancy between their clay and our sample forthe Fe3+/Fe2+ balance. The above-described pretreatment and the natural heterogeneity of claymaterial may lead to this discrepancy. In particular the DCB and the following H2O2 treatmentscould have changed the Fe3+/Fe2+ ratio compared to the original one. Then, we decided to
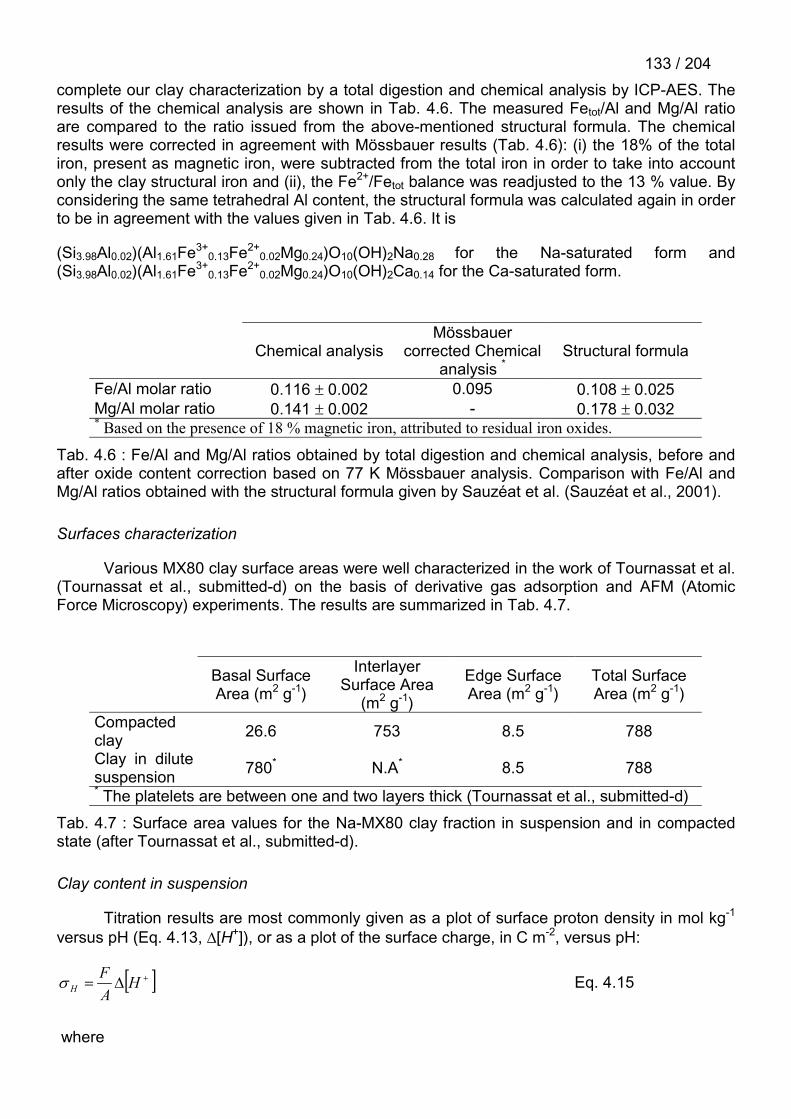
133 / 204complete our clay characterization by a total digestion and chemical analysis by ICP-AES. Theresults of the chemical analysis are shown in Tab. 4.6. The measured Fetot/Al and Mg/Al ratioare compared to the ratio issued from the above-mentioned structural formula. The chemicalresults were corrected in agreement with Mössbauer results (Tab. 4.6): (i) the 18% of the totaliron, present as magnetic iron, were subtracted from the total iron in order to take into accountonly the clay structural iron and (ii), the Fe2+/Fetot balance was readjusted to the 13 % value. Byconsidering the same tetrahedral Al content, the structural formula was calculated again in orderto be in agreement with the values given in Tab. 4.6. It is
(Si3.98Al0.02)(Al1.61Fe3+0.13Fe2+
0.02Mg0.24)O10(OH)2Na0.28 for the Na-saturated form and(Si3.98Al0.02)(Al1.61Fe3+
0.13Fe2+0.02Mg0.24)O10(OH)2Ca0.14 for the Ca-saturated form.
Chemical analysisMössbauer
corrected Chemicalanalysis *
Structural formula
Fe/Al molar ratio 0.116 � 0.002 0.095 0.108 � 0.025Mg/Al molar ratio 0.141 � 0.002 - 0.178 � 0.032* Based on the presence of 18 % magnetic iron, attributed to residual iron oxides.
Tab. 4.6 : Fe/Al and Mg/Al ratios obtained by total digestion and chemical analysis, before andafter oxide content correction based on 77 K Mössbauer analysis. Comparison with Fe/Al andMg/Al ratios obtained with the structural formula given by Sauzéat et al. (Sauzéat et al., 2001).
Surfaces characterization
Various MX80 clay surface areas were well characterized in the work of Tournassat et al.(Tournassat et al., submitted-d) on the basis of derivative gas adsorption and AFM (AtomicForce Microscopy) experiments. The results are summarized in Tab. 4.7.
Basal SurfaceArea (m2 g-1)
InterlayerSurface Area
(m2 g-1)
Edge SurfaceArea (m2 g-1)
Total SurfaceArea (m2 g-1)
Compactedclay 26.6 753 8.5 788
Clay in dilutesuspension 780* N.A* 8.5 788* The platelets are between one and two layers thick (Tournassat et al., submitted-d)
Tab. 4.7 : Surface area values for the Na-MX80 clay fraction in suspension and in compactedstate (after Tournassat et al., submitted-d).
Clay content in suspension
Titration results are most commonly given as a plot of surface proton density in mol kg-1
versus pH (Eq. 4.13, �[H+]), or as a plot of the surface charge, in C m-2, versus pH:
� ��
�� HAF
H� Eq. 4.15
where
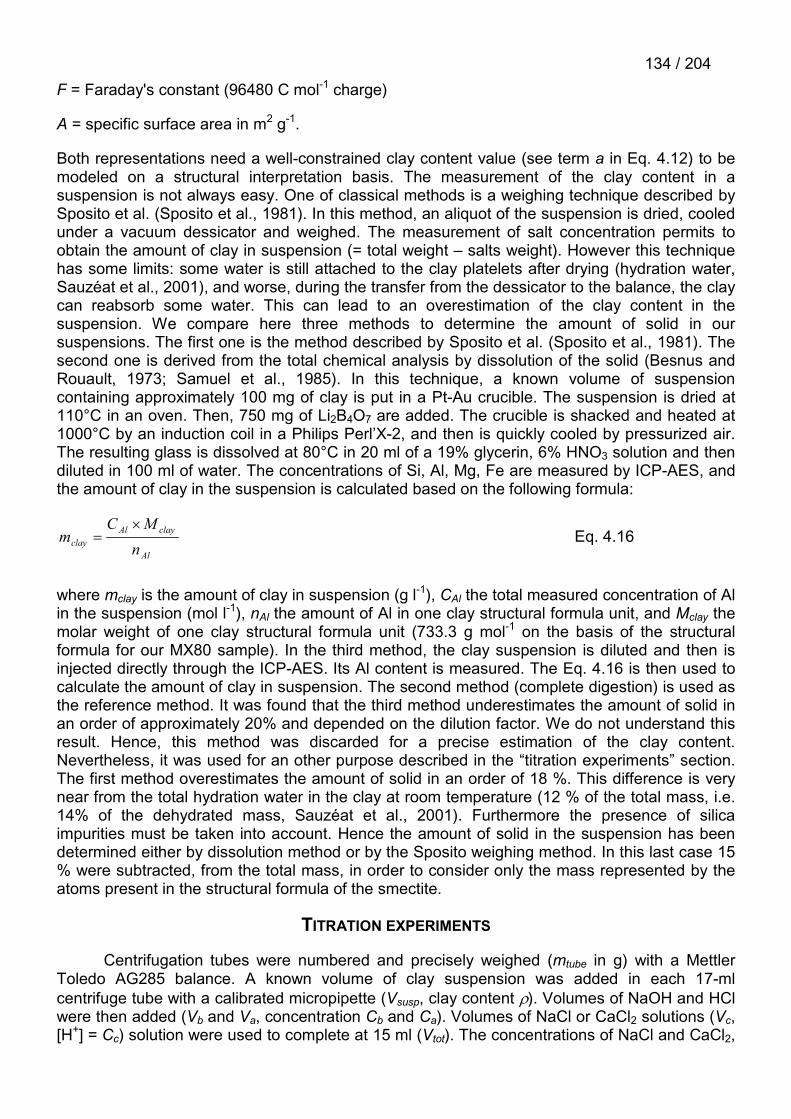
134 / 204F = Faraday's constant (96480 C mol-1 charge)
A = specific surface area in m2 g-1.
Both representations need a well-constrained clay content value (see term a in Eq. 4.12) to bemodeled on a structural interpretation basis. The measurement of the clay content in asuspension is not always easy. One of classical methods is a weighing technique described bySposito et al. (Sposito et al., 1981). In this method, an aliquot of the suspension is dried, cooledunder a vacuum dessicator and weighed. The measurement of salt concentration permits toobtain the amount of clay in suspension (= total weight – salts weight). However this techniquehas some limits: some water is still attached to the clay platelets after drying (hydration water,Sauzéat et al., 2001), and worse, during the transfer from the dessicator to the balance, the claycan reabsorb some water. This can lead to an overestimation of the clay content in thesuspension. We compare here three methods to determine the amount of solid in oursuspensions. The first one is the method described by Sposito et al. (Sposito et al., 1981). Thesecond one is derived from the total chemical analysis by dissolution of the solid (Besnus andRouault, 1973; Samuel et al., 1985). In this technique, a known volume of suspensioncontaining approximately 100 mg of clay is put in a Pt-Au crucible. The suspension is dried at110°C in an oven. Then, 750 mg of Li2B4O7 are added. The crucible is shacked and heated at1000°C by an induction coil in a Philips Perl’X-2, and then is quickly cooled by pressurized air.The resulting glass is dissolved at 80°C in 20 ml of a 19% glycerin, 6% HNO3 solution and thendiluted in 100 ml of water. The concentrations of Si, Al, Mg, Fe are measured by ICP-AES, andthe amount of clay in the suspension is calculated based on the following formula:
Al
clayAlclay n
MCm
�
� Eq. 4.16
where mclay is the amount of clay in suspension (g l-1), CAl the total measured concentration of Alin the suspension (mol l-1), nAl the amount of Al in one clay structural formula unit, and Mclay themolar weight of one clay structural formula unit (733.3 g mol-1 on the basis of the structuralformula for our MX80 sample). In the third method, the clay suspension is diluted and then isinjected directly through the ICP-AES. Its Al content is measured. The Eq. 4.16 is then used tocalculate the amount of clay in suspension. The second method (complete digestion) is used asthe reference method. It was found that the third method underestimates the amount of solid inan order of approximately 20% and depended on the dilution factor. We do not understand thisresult. Hence, this method was discarded for a precise estimation of the clay content.Nevertheless, it was used for an other purpose described in the “titration experiments” section.The first method overestimates the amount of solid in an order of 18 %. This difference is verynear from the total hydration water in the clay at room temperature (12 % of the total mass, i.e.14% of the dehydrated mass, Sauzéat et al., 2001). Furthermore the presence of silicaimpurities must be taken into account. Hence the amount of solid in the suspension has beendetermined either by dissolution method or by the Sposito weighing method. In this last case 15% were subtracted, from the total mass, in order to consider only the mass represented by theatoms present in the structural formula of the smectite.
TITRATION EXPERIMENTS
Centrifugation tubes were numbered and precisely weighed (mtube in g) with a MettlerToledo AG285 balance. A known volume of clay suspension was added in each 17-mlcentrifuge tube with a calibrated micropipette (Vsusp, clay content �). Volumes of NaOH and HClwere then added (Vb and Va, concentration Cb and Ca). Volumes of NaCl or CaCl2 solutions (Vc,[H+] = Cc) solution were used to complete at 15 ml (Vtot). The concentrations of NaCl and CaCl2,

135 / 204and the clay contents are shown in Tab. 4.8 for each experiment. Care was taken to minimizethe variations of salt ionic background concentrations from one tube to one another in a givenexperiment. Nevertheless, these variations cannot be completely avoided because of cationexchange reactions between Na+, Ca2+, H+ and ionic pairs (see results and discussion section).The tubes were shaken for one week. One experiment (0.05 M CaCl2 ionic background,experiment 3) was conducted in an O2-free atmosphere glove box (Jacomex, pO2 < 0.5 ppm).After one week the tubes were centrifuged. An aliquot of each supernatant tube was filtrated(0.20 µm) and used for backtitration (Vback). The backtitrations were performed with a dosimeter(Metrohm 665 Dosimat, volume resolution = 0.005 mL) with pH 7 chosen as the titration endpoint. The pH was measured with a microelectrode (Mettler Toledo, inlab 423). An other aliquotwas filtrated for Na, Ca, Si, Al, Mg and Fe measurement on a Perkin-Elmer Optima 3300 DVinductively coupled plasma atomic emission spectrometer (ICP-AES). The Si, Al, Mg, Feconcentrations of a third supernatant aliquot was measured without filtration to give anestimation of the mass of particles still present in the supernatant (mcorrection, obtained with Eq.4.15; see second method in clay content determination section). The centrifuged reaction tubes,containing the clay slurry, were weighed (mcentrif) and 10 ml of 1 M ammonium acetate wereadded to each. They were shaken for one week. Na- and Ca-CEC were then measured asdescribed by Sposito et al. (Sposito et al., 1983a). The relative proton surface charge �[H+] isgiven by Eq. 4.13. The Na- and Ca-CEC, in eq kg-1, are given by:
� �� �� � correctionsusp
susptubecentrifNasol
NaAmm
mVVmmCC
CECNa��
������
��
�
�10 Eq. 4.17
� �� �� � correctionsusp
susptubecentrifCasol
CaAmm
mVVmmCC
CECCa��
������
���
�
�102 Eq. 4.18
where volumes are given in ml, concentration in mol l-1, clay content in g l-1 and masses in g.The density of all solutions are taken equal to 1.0. Experimental conditions are summarized inTab. 4.8.
Experiment 1 Experiment 2 Experiment 3
Ionic background NaCl 0.02 mol l-1 CaCl2 0.0068 mol l-1 CaCl2 0.05 mol l-1
Clay content 4.69 g l-1 3.03 g l-1 1.53 g l-1
Tab. 4.8 : Experimental conditions of the three titrations
RESULTS AND DISCUSSION
Figure 4.9 presents the results of the surface proton charge titrations together with theCEC measurements.

136 / 204
0.4
0.6
0.8
1.0
1.2
1.4
1.6
1.8
2.0
2.2
1 3 5 7 9 11pH
���O
H- ]a
nd C
EC
(C
a2+)
(eq
kg-1
)
0.4
0.5
0.6
0.7
0.8
0.9
1.0
1.1
1 3 5 7 9 11pH
���O
H- ] a
nd C
EC
(N
a+ )(eq
kg-1
)
0.4
0.6
0.8
1.0
1.2
1.4
1.6
1.8
2.0
2.2
1 3 5 7 9 11pH
���O
H- ] a
nd C
EC
(C
a2+)
(eq
kg-1
)
1
2
3
Figure 4.9 : Titration measurements (��[OH-] black diamonds) presented concomitantly with theCEC measurements (open squares) as a function of pH. (1) Experiment 1, 0.02 mol l-1 NaCl, (2)experiment 2, 0.0068 mol l-1 CaCl2, (3) experiment 3, 0.05 mol l-1 CaCl2.
��[OH-] is plotted as a function of pH to compare easily the variations of surface chargetogether with those of CEC. ��[OH-] is the sum of -�[H+], whose value is given by Eq. 4.13, plusan arbitrary constant �c chosen for a given experiment to match ��[OH-] and CEC values asclose as possible. The constant value is different for experiments 1, 2 and 3. The absolute value
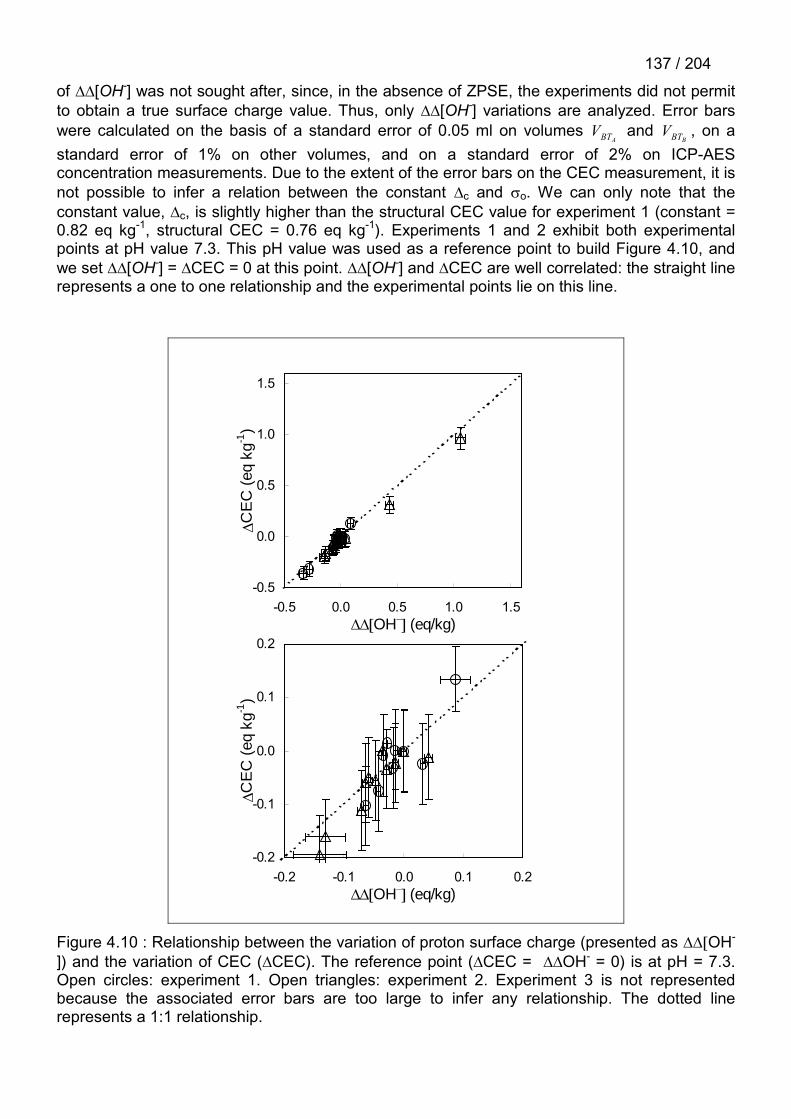
137 / 204
of ��[OH-] was not sought after, since, in the absence of ZPSE, the experiments did not permitto obtain a true surface charge value. Thus, only ��[OH-] variations are analyzed. Error barswere calculated on the basis of a standard error of 0.05 ml on volumes
ABTV and BBTV , on a
standard error of 1% on other volumes, and on a standard error of 2% on ICP-AESconcentration measurements. Due to the extent of the error bars on the CEC measurement, it isnot possible to infer a relation between the constant �c and �o. We can only note that theconstant value, �c, is slightly higher than the structural CEC value for experiment 1 (constant =0.82 eq kg-1, structural CEC = 0.76 eq kg-1). Experiments 1 and 2 exhibit both experimentalpoints at pH value 7.3. This pH value was used as a reference point to build Figure 4.10, andwe set ��[OH-] = �CEC = 0 at this point. ��[OH-] and �CEC are well correlated: the straight linerepresents a one to one relationship and the experimental points lie on this line.
-0.5
0.0
0.5
1.0
1.5
-0.5 0.0 0.5 1.0 1.5���OH�
��(eq/kg)
�C
EC
(eq
kg-1
)
-0.2
-0.1
0.0
0.1
0.2
-0.2 -0.1 0.0 0.1 0.2���OH�
��(eq/kg)
�C
EC
(eq
kg-1
)
Figure 4.10 : Relationship between the variation of proton surface charge (presented as ���OH-
]) and the variation of CEC (�CEC). The reference point (�CEC = ��OH- = 0) is at pH = 7.3.Open circles: experiment 1. Open triangles: experiment 2. Experiment 3 is not representedbecause the associated error bars are too large to infer any relationship. The dotted linerepresents a 1:1 relationship.

138 / 204This result means that a decrease in surface proton charge is counterbalanced by an equivalentincrease in Na+ or Ca2+ charge. Thus protonated and deprotonated sites are not present as freecharged species but are rather neutralized by the ions present in the neighboring of the surface.This behavior was already suggested by Charlet et al. (Charlet et al., 1993) on the basis of theK-saturated montmorillonite continuous titration, where proton charge was almost independentof ionic strength. As stated by these authors, this result is in agreement with electroacousticmeasurements performed on kaolinite indicating that most of the surface charge is balanced bymonovalent ions (Hunter and James, 1992). Hence, the surface complexes must contributenothing to the electrokinetic charge. This could explain why Bradbury and Baeyens needed tosuppress the electrostatic term in order to fit their H+ sorption curves concomitantly with theirZn2+, Ni2+, and Eu3+ sorption curves (Bradbury and Baeyens, 1997, 1998, 2002). Figure 4.11shows the titration data of experiment 1 (NaCl 0.02 M), concomitantly with the 7 days, 0.5 MNaClO4 titration curve of Baeyens and Bradbury (Baeyens and Bradbury, 1995, 1997). There islittle difference between the two titration curves. Hence, we can consider that our results can beapplied to their system and that the background anion (Cl- vs. ClO4
-) has little impact on thetitration data. Figure 4.11 shows also the titration data of experiments 1, 2 and 3 from pH 4 topH 9 on the same graph. Between pH 4 and pH 9, there is no significant difference between theresults of the two Ca-clay titration data, and between the results of Na- and Ca-clay titrationdata. This result is in agreement with the previous statement: there is no effect of the ionicbackground salt concentration and identity on the titration data.
-0.08
-0.06
-0.04
-0.02
0.00
0.02
0.04
4 5 6 7 8 9pH
OH
- ] (eq
kg-1
)
Figure 4.11 : Variation of the proton surface charge (presented as ���OH-]) as a function of pHfor experiments 1 (open circles), 2 (open triangles), 3 (open diamonds) and the 7 daysexperiments of Baeyens and Bradbury (Baeyens and Bradbury, 1997, black circles). Thereference point (���OH-] ~ 0) is at pH = 7.3.
Nevertheless, some pronounced differences among experiments appear below pH 4 andabove pH 9 (see Figure 4.9). Cation exchange and dissolution likely explain these differences.At pH > 9 and with Ca2+ as cationic background, the large increase in ��[OH-] is correlated tothe same increase in apparent Ca-CEC (Figure 4.9). This increase is particularly pronouncedbetween pH 11 and pH 12, i.e. around the first hydrolysis constant of Ca2+ (pKa = 12.85, Llnl.datdatabase). Thus it is likely due to the sorption of CaOH+ cations. In the calculation of the Ca-

139 / 204CEC (Eq. 4.18), each Ca2+ ions is assumed to balance two negative charge of the exchanger.Instead, the reaction Ca2+ + H2O CaOH+ + H+ leads to (i) a net consumption of one OH- perCaOH+ in exchange position and thus, to the increase of ��OH-, and (ii) to an overestimation ofthe CEC, each Ca balancing only one charge of the exchanger. Nevertheless, the amount ofCaOH+ in exchange position can not exceed the CEC value. In the extreme case, where all theexchange sites are occupied by CaOH+, the apparent CEC value should be twice the structuralCEC value (~1.52 eq/kg based on the structural formula). In experiment 2, the amount of sorbedCa(II) is equal to 1.85 eq/kg at pH 11.93. Thus an additional mechanism must be invoked, toexplain this excess of apparent surface charge. Since this excess of charge is observed in a pHrange, where a decrease in aqueous Si is observed (Figure 4.12), the additional mechanism isattributed to the precipitation of a Ca-Si hydrate solid phase, e.g. a tobermorite-like phase(Ca5Si6H6O20) (Claret et al., 2002). The ion activity product observed in the experimentalconditions of the last point of experiment 2 is equal to 1072.46, and indicates a net oversaturationwith respect to tobermorite (Ca5Si6H6O20 +10 H+ � 5 Ca2+ + 6 SiO2 + 8 H2O pKs = -69.08).
0
100
200
300
400
500
600
700
800
2 4 6 8 10 12 14pH
Si i
n so
lutio
n (µ
mol
l-1)
Figure 4.12 : Concentration of Si in solution as a function of pH for experiments 1 (open circles)and 2 (open triangles). The arrow indicates the decrease of the Si concentration at high pH inexperiment 2 (CaCl2 ionic background) and the probable precipitation of a Ca-Si hydratedphase.
At pH < 4, the pronounced decrease in ��[OH-] concomitant to a Na-CEC decrease(Figure 4.9) can be attributed to two distinct phenomena. The first one is a H+/Na+ exchangereaction (Gilbert and Laudelout, 1965). The second one is the dissolution of the clay and theexchange of Na+ by Al3+ (Baeyens and Bradbury, 1997). Figure 4.13 shows the concentration ofAl, Mg, and Fe between pH 2 and pH 4.5 in experiment 3. Al is significantly released in solutionin this experiment (up to 2.9�10-5 mol l-1 at pH 2.14).

140 / 204
0
5
10
15
20
25
30
35
2.0 2.5 3.0 3.5 4.0 4.5pH
Con
cent
ratio
ns (
µmol
l-1)
Al
Fe
Mg
Figure 4.13 : Concentrations of Al (black squares), Fe (open triangles), Mg (open circles) as afunction of pH in experiment 3.
The Al concentrations are compared in Figure 4.14 for experiments 1, 2 and 3. It appears thatsignificant and equivalent concentrations of Al are measured in case of experiments 2 and 3,i.e., experiments in CaCl2 ionic background.
0
5
10
15
20
25
30
35
1.0 2.0 3.0 4.0 5.0 6.0pH
Al i
n so
lutio
n (µ
mol
l-1)
1
2
3
Figure 4.14 : Concentration of Al as a function of pH in experiments 1 (open circles), 2 (opentriangles), and 3 (open diamonds).
In case of experiment 1, i.e. in NaCl ionic background, the observed Al concentrations are closeto the detection limit (d.l. = 0.5 µmol l-1). These low Al concentrations are attributed to theadsorption of Al3+ at basal plane cation exchange position, due to the high Al/Na selectivity
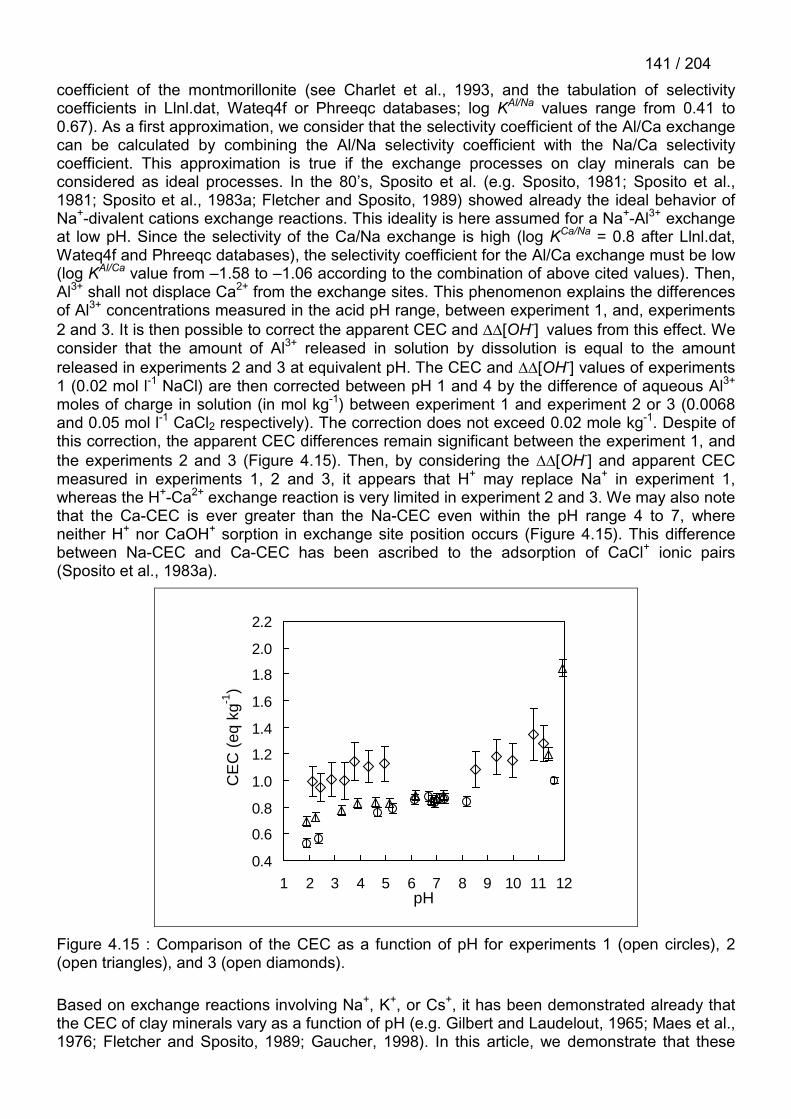
141 / 204coefficient of the montmorillonite (see Charlet et al., 1993, and the tabulation of selectivitycoefficients in Llnl.dat, Wateq4f or Phreeqc databases; log KAl/Na values range from 0.41 to0.67). As a first approximation, we consider that the selectivity coefficient of the Al/Ca exchangecan be calculated by combining the Al/Na selectivity coefficient with the Na/Ca selectivitycoefficient. This approximation is true if the exchange processes on clay minerals can beconsidered as ideal processes. In the 80’s, Sposito et al. (e.g. Sposito, 1981; Sposito et al.,1981; Sposito et al., 1983a; Fletcher and Sposito, 1989) showed already the ideal behavior ofNa+-divalent cations exchange reactions. This ideality is here assumed for a Na+-Al3+ exchangeat low pH. Since the selectivity of the Ca/Na exchange is high (log KCa/Na = 0.8 after Llnl.dat,Wateq4f and Phreeqc databases), the selectivity coefficient for the Al/Ca exchange must be low(log KAl/Ca value from –1.58 to –1.06 according to the combination of above cited values). Then,Al3+ shall not displace Ca2+ from the exchange sites. This phenomenon explains the differencesof Al3+ concentrations measured in the acid pH range, between experiment 1, and, experiments2 and 3. It is then possible to correct the apparent CEC and ��[OH-] values from this effect. Weconsider that the amount of Al3+ released in solution by dissolution is equal to the amountreleased in experiments 2 and 3 at equivalent pH. The CEC and ��[OH-] values of experiments1 (0.02 mol l-1 NaCl) are then corrected between pH 1 and 4 by the difference of aqueous Al3+
moles of charge in solution (in mol kg-1) between experiment 1 and experiment 2 or 3 (0.0068and 0.05 mol l-1 CaCl2 respectively). The correction does not exceed 0.02 mole kg-1. Despite ofthis correction, the apparent CEC differences remain significant between the experiment 1, andthe experiments 2 and 3 (Figure 4.15). Then, by considering the ��[OH-] and apparent CECmeasured in experiments 1, 2 and 3, it appears that H+ may replace Na+ in experiment 1,whereas the H+-Ca2+ exchange reaction is very limited in experiment 2 and 3. We may also notethat the Ca-CEC is ever greater than the Na-CEC even within the pH range 4 to 7, whereneither H+ nor CaOH+ sorption in exchange site position occurs (Figure 4.15). This differencebetween Na-CEC and Ca-CEC has been ascribed to the adsorption of CaCl+ ionic pairs(Sposito et al., 1983a).
0.4
0.6
0.8
1.0
1.2
1.4
1.6
1.8
2.0
2.2
1 2 3 4 5 6 7 8 9 10 11 12pH
CE
C (
eq k
g-1)
Figure 4.15 : Comparison of the CEC as a function of pH for experiments 1 (open circles), 2(open triangles), and 3 (open diamonds).
Based on exchange reactions involving Na+, K+, or Cs+, it has been demonstrated already thatthe CEC of clay minerals vary as a function of pH (e.g. Gilbert and Laudelout, 1965; Maes et al.,1976; Fletcher and Sposito, 1989; Gaucher, 1998). In this article, we demonstrate that these

142 / 204variations are correlated with protonation/deprotonation reactions attributed to the reactivity ofclay platelet edges, for pH value between 4 and 9. The CEC is measured often at near neutralpH (e.g. Metson, 1956). In such conditions, the measured CEC must be attributed to twocontributions: the contribution of the structural charge (�O) given by the structural formula andthe contribution of the edge charge (�H).
CONCLUSION
The combination of titration plus backtitration technique, for net proton surface excessmeasurement, with ammonium acetate extraction, for Na- and Ca-CEC measurements, ispowerful. It permits to identify the main mechanisms responsible for changes in titration curves:dissolution processes, variations in edge net proton surface charge, exchange mechanisms,adsorption of ionic pairs and precipitation of new phases. As a summary, we have shown that:
� between pH 4 and pH 9, the titration data do depend on neither the ionic background salt(NaCl or CaCl2) nor its concentration;
� below pH 4, dissolution and Na+/H+ exchange affects the titration data;
� above pH 9, the sorption in exchange site position of CaOH+ ionic pairs can lead to anoverestimation of both Ca2+ adsorbed or H+ desorbed amounts, i.e. an overestimate of boththe CEC and the net proton surface charge;
� above pH 11, the dissolution of clay together with the presence of calcium in the solutionleads to the formation of a tobermorite-like phase; and
� on the whole pH range, the negative charge created by the deprotonation reactions iscompensated by an equivalent sorption of Na+ or Ca2+. Then, the electrostatic term can beignored in clay complexation models
The whole results can be used to test existing models and/or to construct a coherent H+
sorption model. This work is presented in part II of the present article.
ACKNOWLEDGEMENT
This research was funded by the French National radioactive waste management agency(ANDRA).

143 / 204
THE TITRATION OF CLAY MINERALS. PART II. STRUCTURAL BASEDMODEL AND IMPLICATIONS ON CLAY REACTIVITY.
Christophe Tournassat1,2, Eric Ferrage1,2, Christiane Poinsignon3, Laurent Charlet1
To be submitted to Journal of Colloid and Interface Sciences
1 LGIT - CNRS/UJF, University of Grenoble-I, P.O. Box 53, F 38041 Grenoble, France
2 ANDRA, Parc de la Croix Blanche, 1/7 rue Jean Monnet, F-92298 Châtenay-Malabry CEDEX, France
3 LEPMI-ENSEEG, University of Grenoble-I, P.O. Box 75, F 38041 Grenoble, France

144 / 204
145 / 204
ABSTRACT
The potentiometric titration and CEC data, presented in part I, are modeled in the presentpart II. Two models are compared. The first one is the 2 pK, 3 complexation sites plus exchangesites non-electrostatic model developed by Baeyens and Bradbury. The second one is a modelbased on the Hiemstra and Van Riemsdijk MUSIC approach. Morphological and structuralinformation is used to develop this model. Morphological information is taken from the literature,whereas structural information is taken from literature and constrained by supporting FTIRexperiments.
The Baeyens and Bradbury model is found to respect the whole tendency of the titrationcurve, whereas the model based on Hiemstra and Van Riemsdijk MUSIC approach permits tobetter adjust the experimental data. The former uses only 3 edge reaction sites, whereas thelater uses at least 27 edge reaction sites. 5 main reactive sites are sufficient to fit the curve, butthe model allows us to derivate the properties of 22 other reactive sites. Logically, the greaterthe amount of sites, the better the adjustment. Nevertheless, a lower amount of adjustableparameters is necessary to build the model based on the Hiemstra and Van Riemsdijk MUSICapproach, than to build the Baeyens and Bradbury model, thanks to structural andmorphological constraints. The precision of the potentiometric titration curve is not sufficient toverify that the properties of the 27 sites, given by the model, are effective. Thus, we linked someproperties of clay minerals, like dissolution, to the modeled acid – base properties of these sites,to assess our model. Then, we question the ability of oversimplified models to predict theinteractions, between clay minerals and solutions, in natural environments.
As secondary results, we have derived, from our CEC data, the cation exchangeselectivity coefficients for CaCl+ and CaOH+ ionic pairs, and H+.

146 / 204
INTRODUCTION
Sorption mechanisms on clay surfaces have been studied for decades and onedistinguishes: (i) inorganic cation exchange in the interlayer and on basal plane surfaces (e.g.Sposito, 1981) and (ii) specific pH dependent sorption of cations and anions on the edges (e.g.Sposito, 1984). Edge sorption mechanism is related to the acido-basic properties of the clayedges (Fletcher and Sposito, 1989; Charlet et al., 1993; Stadler and Schindler, 1993; Zacharaand Smith, 1994; Bradbury and Baeyens, 1997; Avena, 2002 and others) whereas cationexchange on basal planes is related to the permanent charge generated by the clay structure(Sposito, 1981). The former mechanism is a pH dependant specific sorption on the clay edges.It has already been well established that the proton surface charge density (�H) on the clayedges depends on physico-chemical solution parameters (pH, ionic strength) which control theprotonation state of the surface (Fletcher and Sposito, 1989; Charlet et al., 1993; Zachara et al.,1993; Wanner et al., 1994; Baeyens and Bradbury, 1997; Bradbury and Baeyens, 1997; Avena,2002 and others). The latter mechanism originates from the presence of a permanent negativestructural charge in the alumino-silicate layer created by isomorphic substitutions in the lattice.The density of exchange sites (�o) can be derived from structural formula, and is compensatedby “exchangeable cations”, which generally form outer sphere complexes in siloxane cavities(Sposito, 1981, 1984).
In part I (Tournassat et al., submitted-c), Na- and Ca-MX80 montmorillonite surfacecharge data were presented. They were obtained by the combination of (i) potentiometricbacktitration technique (Schultess and Sparks, 1986; Baeyens and Bradbury, 1997) and (ii)CEC measurements technique (Sposito et al., 1983a). This combination is shown to bepowerful as it permits to identify each phenomena which concurs to the whole surface chargephenomenon: dissolution processes, variations of the net proton edge surface charge, cationand proton exchange mechanisms, adsorption of ionic pairs and precipitation of new phases. Inthe present paper (part II), models of the surface charge data are proposed. The first approachis a macroscopic surface complexation model (Bradbury and Baeyens, 1997). The second oneis based on the bond valence principle (MUSIC, Hiemstra et al., 1996). The first model is anempirical model, developed by fitting together titration and metal sorption data, the qualitycriterion being the best agreement between model and experimental data. In the MUSIC model,morphological and structural data are used to derivate chemical properties of the solid.However, even with this more sophisticated approach, assumptions (e.g. on cationsdistributions) are necessary to build the surface clay chemical model. Supporting information,obtained with Fourier Transform Infra Red (FTIR) spectoscopy experiments, is used to constrainthese assumptions.
STRUCTURAL INPUT FROM FTIR MEASUREMENTS
Theoretical background
Some sites present within the structure are a priori able to present acid-base propertiesas shall be shown below, based on their affinity for proton. However, diffusion of H+ through thesiloxane plane is doubtful. Hence, the first goal of FTIR experiments was to refute the possiblefast proton sorption within the clay structure, and thus to show that fast proton sorption occursonly on edge surfaces. Deuterium atoms (D, = hydrogen isotope of mass value equal to two)have the same chemical properties than hydrogen atoms. Use of D2O for hydrothermalsynthesis is a common method for identifying the IR absorption bands in clay minerals like talc,because of the conversion of some, or of all, of the OH groups to OD groups (Stubican andRoy, 1961; Farmer et al., 1968; Russel et al., 1970; Shirozu and Ishida, 1982; Ishida, 1990;Grauby et al., 1991; Martin et al., 1999). When D replaces H, the difference in atomic massinduces a shift of all vibrations due to OH groups towards lower wavenumbers by a factor R

147 / 204close to 1.37 (Langer and Lattard, 1980). Then deuterated OD stretching bands are present inthe 2800-2500 cm-1 region. Since this region of the spectrum is free of other structural vibrationsin case of clay minerals, it allows the degree of H-D exchange to be easily determined. In thepresent work, we apply the same technique to smectite, in order to see the possible diffusion ofD+ (and hence H+) inside of the structure at 25°C.
Gaining knowledge on the cation distribution inside the octahedral layer was the secondgoal of FTIR experiments. The 950-750 cm-1 wavenumbers range OH-bending region givesinformation on the cation distribution occurring in the octahedral layer (Vantelon et al., 2001). Byquantifying the area of the bands corresponding to the substitution of Al by Mg or Fe, it ispossible to know if the cation distribution is ordered, random, or clustered. The procedure ofBesson and Drits (Schultess and Sparks, 1988; Besson and Drits, 1997a) was here applied tofit the OH-bending bands: the components were extracted, as pure Lorentzian curve, from thetotal curve together with the background. The bands decomposition program uses aconjugated-gradient fitting procedure taking into account Gaussian and/or Lorentzian shapesfunctions.
Preparation of the sample and measurement
A Na-conditioned smectite has been equilibrated during 90 days with a 40% D2O 60%H2O 0.01 mol l-1 NaCl solution, at 25 °C. A 1 ml aliquot of suspension was deposited on acircular silicon support (25 � 2 mm, Eurolabo reference 1840) and was allowed to dry at roomtemperature. FTIR spectra of the clay film on support and support alone were recorded using aNicolet 710 FTIR spectrometer (128 scans in the 4000-400 cm-1 domain, with a 4 cm-1
resolution). Spectra of the clay film were obtained by subtracting the support signal from thetotal signal.
Results
Figure 4.16 shows the results of the FT-IR experiment. Characteristic deformation bandsfor montmorillonite are well designed in the region 1100-800 cm-1 (Madejova and Komadel,2001). Impurities of quartz are also visible (arrow on Figure 4.16). The 3800-3200 cm-1
wavenumber region exhibits a single band relative to (Me1Me2)OH stretching vibration, whereMe1 and Me2 denote octahedral cations (Al3+, Mg2+, Fe3+ and Fe2+). This region is almost freefrom OH vibration of interlayer water, meaning that most of the water has evaporated.Therefore, OD vibration bands of interlayer deuterated water can not overlap with the ODstretching bands characteristics of inner surface hydroxyl groups. While the (Me1Me2)OHstretching bands are usually observed at 3633 cm-1, we do not observe any peak correspondingto the deuteration of the (Me1Me2)OD stretching bands in the 2800-2500 cm-1 region. Hence, wecan conclude that little H+/D+ diffusion occurs in the bulk of the smectite structure at 25°C andthus, that clay protonation does not involve – within 90 days reaction time – the structuralsmectite protons. This is in agreement with previous studies; on talc for instance, H+ do notdiffuse perpendicularly to the basal planes (e.g. Ferrage et al., 2003). Based on these resultswe shall use only surface reactions to explain the smectite titration data detailed in part I.

148 / 204
40080012001600200024002800320036004000wavenumbers (cm-1)
Abs
orba
nce
2400280032003600Wavenumbers (cm-1)
Abs
orba
nce
250027503000
Figure 4.16 : Transmission IR spectra of Na- D2O-conditioned MX80 montmorillonite at 25°Cusing a silicon support (see text for details). Top: spectrum in the 4000 to 400 cm-1 range.Bottom: zoom on the OH stretching region (3700-3500 cm-1) and on the OD stretching region(3000-2500 cm-1).
Figure 4.17 shows the decomposition of the 950-750 cm-1 wavenumbers region. Three mainbending bands are expected to be present (�AlAlOH, �AlFeOH and �AlMgOH) based on the structuralformula of MX80 smectite clay (Tournassat et al., submitted-c):
(Si3.98Al0.02)(Al1.61Fe3+0.13Fe2+
0.02Mg0.24)O10(OH)2Na0.28

149 / 204
750800850900950Wavenumbers (cm-1)
Ab
so
rba
nc
e
Figure 4.17 : Thick line: transmission IR spectrum of Na-conditioned MX80 montmorillonite inthe OH-bending range (980-750 cm-1). Thin line: decomposition of the spectrum (see text fordetails).
After removal of the background, the spectrum can be fitted with three bending bands inthe 820-950 cm-1 region corresponding to �AlAlOH (~919 cm-1), �AlFeOH (~882 cm-1) and �AlMgOH(~848 cm-1). These vibration positions are in good agreement with those given by Vantelon etal. (Vantelon et al., 2001) for similar smectites. The position of the �AlFeOH band fits well withband position given for montmorillonite by Craciun (Craciun, 1984) as a function of Fe content(calculated value at 883 cm-1). Bands at 799 and 780 cm-1 are attributed to quartz (Madejovaand Komadel, 2001). Other bending bands, such as �AlFeIIOH and �MgMgOH bands, are notdetected here, due to low Fe(II) and Mg(II) content in the MX80 smectite octahedral layer.
The area under the �AlAlOH, �AlFeOH and �AlMgOH bands are compared in Figure 4.18 totheoretical areas, calculated on the basis of (i) the above structural formula, (ii) the assumedcation random distribution in the octahedral layer and (iii), an assumed invariant absorptioncoefficient for the different OH groups (Slonimskaya et al., 1986; Besson and Drits, 1997b, a;Madejova and Komadel, 2001; Vantelon et al., 2001). For example, the �AlAlOH band should
represent 8.64100261.1
261.1
��� % of the total absorbance area. Figure 4.18 shows that the
experimental points lie on the line corresponding to a random distribution. According to thisresult, the distribution of Al, Fe and Mg cations within the octahedral layer is a near-randomdistribution. In the following, this information will be used to calculate the proportion of eachedge surface functional group.
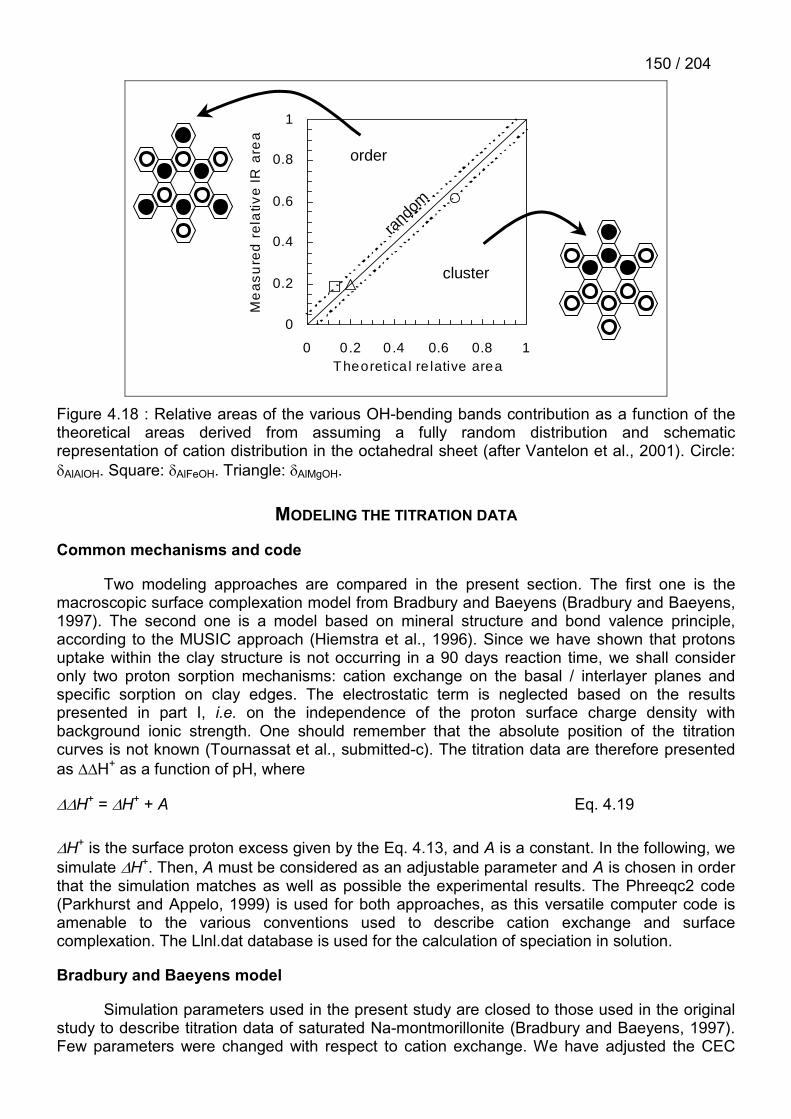
150 / 204
0
0.2
0.4
0.6
0.8
1
0 0.2 0.4 0.6 0.8 1Theoretica l re lative area
Me
as
ure
d r
ela
tive
IR
are
a
rand
om
cluster
order
Figure 4.18 : Relative areas of the various OH-bending bands contribution as a function of thetheoretical areas derived from assuming a fully random distribution and schematicrepresentation of cation distribution in the octahedral sheet (after Vantelon et al., 2001). Circle:�AlAlOH. Square: �AlFeOH. Triangle: �AlMgOH.
MODELING THE TITRATION DATA
Common mechanisms and code
Two modeling approaches are compared in the present section. The first one is themacroscopic surface complexation model from Bradbury and Baeyens (Bradbury and Baeyens,1997). The second one is a model based on mineral structure and bond valence principle,according to the MUSIC approach (Hiemstra et al., 1996). Since we have shown that protonsuptake within the clay structure is not occurring in a 90 days reaction time, we shall consideronly two proton sorption mechanisms: cation exchange on the basal / interlayer planes andspecific sorption on clay edges. The electrostatic term is neglected based on the resultspresented in part I, i.e. on the independence of the proton surface charge density withbackground ionic strength. One should remember that the absolute position of the titrationcurves is not known (Tournassat et al., submitted-c). The titration data are therefore presentedas ��H+ as a function of pH, where
��H+ = �H+ + A Eq. 4.19
�H+ is the surface proton excess given by the Eq. 4.13, and A is a constant. In the following, wesimulate �H+. Then, A must be considered as an adjustable parameter and A is chosen in orderthat the simulation matches as well as possible the experimental results. The Phreeqc2 code(Parkhurst and Appelo, 1999) is used for both approaches, as this versatile computer code isamenable to the various conventions used to describe cation exchange and surfacecomplexation. The Llnl.dat database is used for the calculation of speciation in solution.
Bradbury and Baeyens model
Simulation parameters used in the present study are closed to those used in the originalstudy to describe titration data of saturated Na-montmorillonite (Bradbury and Baeyens, 1997).Few parameters were changed with respect to cation exchange. We have adjusted the CEC

151 / 204value to our theoretical value (Tournassat et al., submitted-c), which takes into account thestoichiometry of the clay and the dehydrated suspended clay concentration (0.76 eq kg-1). Tab.4.9 summarizes these parameters. Vanselow’s convention was used to model cation exchange(Vanselow, 1932; Sposito et al., 1981). Cation exchange selectivity coefficients were fitted withour Na- and Ca-CEC data and with the CEC data previously published by Sposito et al. (Spositoet al., 1983a). The cation exchange of ion pairs (like CaCl+ and CaOH+) was considered inagreement with Sposito et al. results (Sposito et al., 1983a) and with the results presented inpart I (Tournassat et al., submitted-c).
Site types Site capacities
Strong sites (�SsOH) 2�10-3 mol kg-1 †
Weak sites 1 (�Sw1OH) 4�10-2 mol kg-1 †
Weak sites 2 (�Sw2OH) 4�10-2 mol kg-1 †
Cation exchange sites (X-) 0.76 eq kg-1 ‡
† Fixed‡ Adjusted to the theoretical structural CEC value(Tournassat et al., submitted-c)
Tab. 4.9 : Site types and sites capacities used in the simulation, based on Bradbury andBaeyens model (Bradbury and Baeyens, 1997).
Hiemstra and Van Riemsdijk MUSIC model
In the MUSIC model, the proton affinity of a surface group is calculated from thefractional charge of a surface oxygen and from the bond valence of all its ligands (Hiemstra etal., 1996; Venema et al., 1998). Initially created to model simple oxides like quartz, alumina,titanium oxides or iron (hydr)oxides (Hiemstra et al., 1989a; Hiemstra et al., 1989b), it has beenrefined several times (Hiemstra et al., 1989b; Hiemstra and Van Riemsdijk, 1996; Hiemstra etal., 1996; Venema et al., 1998). In the present article, we first attempt to apply its updatedversion (Hiemstra et al., 1996; Venema et al., 1998) to complex oxides, namely clay minerals.Proton affinity were computed with the following formula (Hiemstra et al., 1996):
���
����
��� � VsAK
jjlog Eq. 4.20
where A is a constant set to +19.8 (Hiemstra et al., 1996), V is the valence of the involvedoxygen (V= -2), and �
jjs is the sum of all bond valences of the surrounding cations (j) and H
bonds:
� �HHi
Mej
j snsmssi
�������� 1 . Eq. 4.21
where�j
iMes is the contribution of the i surrounding Mei ions, sH the bond valence of the H
donating bond (sH = 0.8), (1 - sH) the bond valence of the H accepting bond and m and nrespectively the number of donating and accepting H bridges built with adsorbed water. The
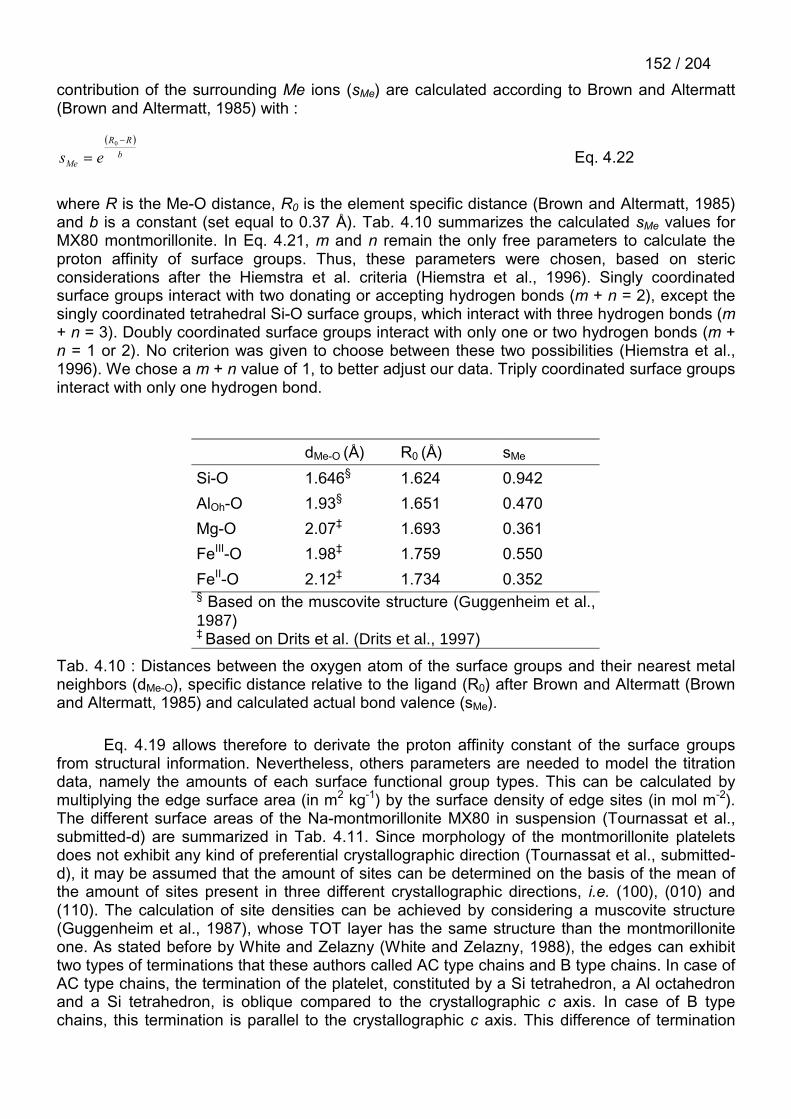
152 / 204contribution of the surrounding Me ions (sMe) are calculated according to Brown and Altermatt(Brown and Altermatt, 1985) with :
� �
bRR
Me es�
�
0
Eq. 4.22
where R is the Me-O distance, R0 is the element specific distance (Brown and Altermatt, 1985)and b is a constant (set equal to 0.37 Å). Tab. 4.10 summarizes the calculated sMe values forMX80 montmorillonite. In Eq. 4.21, m and n remain the only free parameters to calculate theproton affinity of surface groups. Thus, these parameters were chosen, based on stericconsiderations after the Hiemstra et al. criteria (Hiemstra et al., 1996). Singly coordinatedsurface groups interact with two donating or accepting hydrogen bonds (m + n = 2), except thesingly coordinated tetrahedral Si-O surface groups, which interact with three hydrogen bonds (m+ n = 3). Doubly coordinated surface groups interact with only one or two hydrogen bonds (m +n = 1 or 2). No criterion was given to choose between these two possibilities (Hiemstra et al.,1996). We chose a m + n value of 1, to better adjust our data. Triply coordinated surface groupsinteract with only one hydrogen bond.
dMe-O (Å) R0 (Å) sMe
Si-O 1.646§ 1.624 0.942AlOh-O 1.93§ 1.651 0.470Mg-O 2.07‡ 1.693 0.361FeIII-O 1.98‡ 1.759 0.550FeII-O 2.12‡ 1.734 0.352§ Based on the muscovite structure (Guggenheim et al.,1987)‡ Based on Drits et al. (Drits et al., 1997)
Tab. 4.10 : Distances between the oxygen atom of the surface groups and their nearest metalneighbors (dMe-O), specific distance relative to the ligand (R0) after Brown and Altermatt (Brownand Altermatt, 1985) and calculated actual bond valence (sMe).
Eq. 4.19 allows therefore to derivate the proton affinity constant of the surface groupsfrom structural information. Nevertheless, others parameters are needed to model the titrationdata, namely the amounts of each surface functional group types. This can be calculated bymultiplying the edge surface area (in m2 kg-1) by the surface density of edge sites (in mol m-2).The different surface areas of the Na-montmorillonite MX80 in suspension (Tournassat et al.,submitted-d) are summarized in Tab. 4.11. Since morphology of the montmorillonite plateletsdoes not exhibit any kind of preferential crystallographic direction (Tournassat et al., submitted-d), it may be assumed that the amount of sites can be determined on the basis of the mean ofthe amount of sites present in three different crystallographic directions, i.e. (100), (010) and(110). The calculation of site densities can be achieved by considering a muscovite structure(Guggenheim et al., 1987), whose TOT layer has the same structure than the montmorilloniteone. As stated before by White and Zelazny (White and Zelazny, 1988), the edges can exhibittwo types of terminations that these authors called AC type chains and B type chains. In case ofAC type chains, the termination of the platelet, constituted by a Si tetrahedron, a Al octahedronand a Si tetrahedron, is oblique compared to the crystallographic c axis. In case of B typechains, this termination is parallel to the crystallographic c axis. This difference of termination

153 / 204leads to differences in site types densities. The structure of the montmorillonite is presented inthe AC and B type chain configuration in Figure 4.19 (top and bottom respectively).
Basal and InterlayerSurface Area (m2 g-1) Edge Surface Area (m2 g-1) Total Surface Area (m2 g-1)
780 8.5 788
Tab. 4.11 : Surface area values for the Na-MX80 clay fraction in suspension (after Tournassatet al., submitted-d).
The calculated sites densities for these two types of configuration are summarized in Tab. 4.12.Since we have no information about the dominant configuration, we considered the mean valueof the densities present on the AC and B chains. Tab. 4.12 shows that there is little variations ofthe total amount of sites between the two types of edge chains. Thus, on the basis of thestructural formula and assuming a cation random distribution in the octahedral layer (seestructural input from FTIR Section), it is possible to calculate the amounts of each type ofsurface functional groups. Results are presented in Tab. 4.13, together with the proton affinityconstant calculated according to Eq. 4.20. Considering that �SOHz represents one type of edgesurface functional group with a z formal charge, then the first protonation constant listed in Tab.4.13 corresponds to reaction:
�SO(z-1) + H+ � �SOHz Eq. 4.23
and the second protonation corresponds to reaction:
�SOHz + H+ � �SOH2(z+1). Eq. 4.24
Site density (sites nm-2) direction MeTd-O MeOh-O MeOh-O-MeT MeOh-O-MeOh (MeOh)2-O-MeT
AC type chains(100) 4.05 2.02 2.02 4.04 4.05(010) 4.67 3.50 1.17 2.34 4.67(110) 4.67 2.34 2.34 4.66 4.67Mean 4.46 2.62 1.84 3.68 4.46
B type chains(100) 6.07 0 4.05 4.04 4.05(010) 4.67 2.33 2.33 2.34 4.67(110) 4.67 0 4.67 4.66 4.67Mean 5.14 0.78 3.69 3.68 4.46
Mean of AC + B types chainsMeTdO MeOhO MeOh-O-MeT MeOh-O-MeOh (MeOh)2-O-MeT
Sites nm-2 4.80 1.70 2.77 3.68 4.46mmol kg-1 67.8 24.0 39.0 52.0 63.0
Tab. 4.12 : Density (sites nm-2) of different sites present on the lateral surfaces of clay particles.Td indicates a tetrahedral position whereas Oh indicates an octahedral position of the metal ion(Me). The calculation of the densities is based on the parameters shown on Figure 4.19, on theedge surface area given in Tab. 4.4, and on a TOT layer thickness of 9.5 Å.
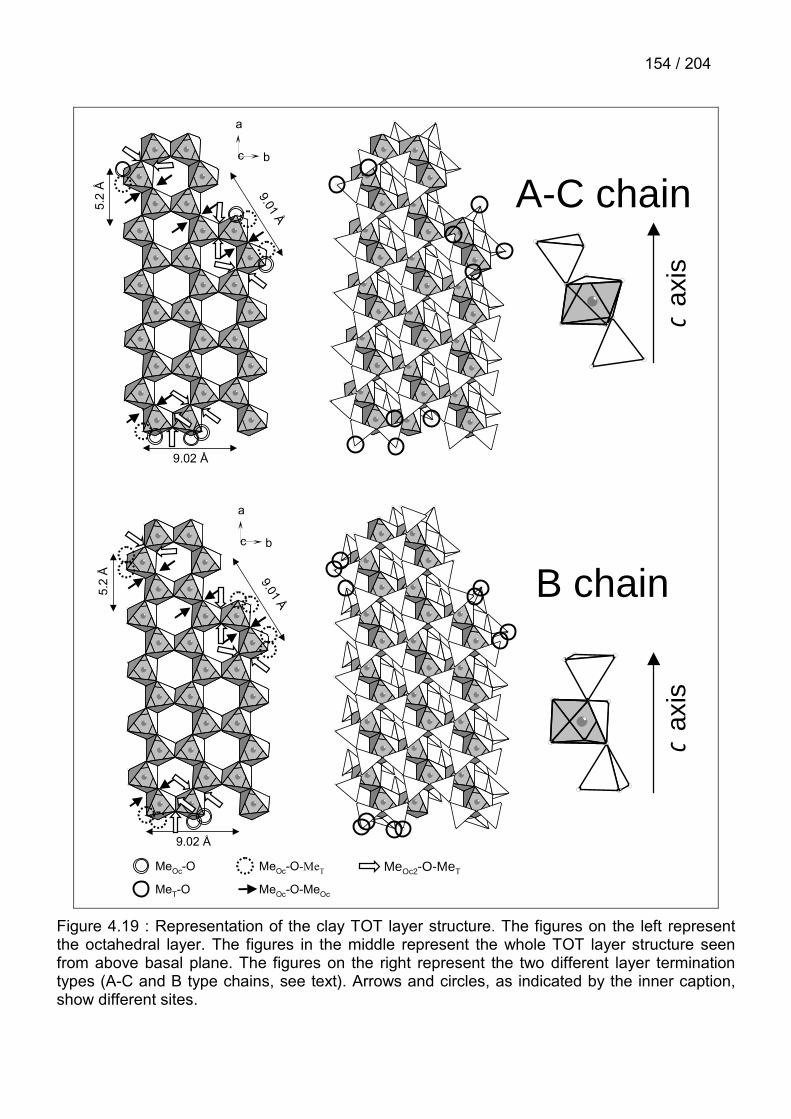
154 / 204
a
bc
9.02 Å
5.2
Å 9.01 Å
MeOc-O
MeT-O
MeOc-O-MeT
MeOc-O-MeOc
MeOc2-O-MeT
a
bc
9.02 Å
5.2
Å 9.01 Å
MeOc-O
MeT-O
MeOc-O-MeT
MeOc-O-MeOc
MeOc2-O-MeT
A-C chain
B chain
c ax
isc
axis
Figure 4.19 : Representation of the clay TOT layer structure. The figures on the left representthe octahedral layer. The figures in the middle represent the whole TOT layer structure seenfrom above basal plane. The figures on the right represent the two different layer terminationtypes (A-C and B type chains, see text). Arrows and circles, as indicated by the inner caption,show different sites.

155 / 204
Site m + n log K 1st
protonationlog K 2nd
protonationAmount of sites
(mmol kg-1)SiTd-O 3 9.1 8.2 -2.8 67.5AlOh-O 2 22.4 10.5 19.3MgOh-O 2 24.5 12.7 2.9FeII
Oh-O 2 24.7 12.8 0.2FeIII
Oh-O 2 20.8 8.9 1.6AlOh-O -AlOh 1 17.0 5.1 4.8 33.7AlOh-O -MgOh 1 19.2 7.3 10.0AlOh-O -FeII
Oh 1 19.3 7.5 0.8AlOh-O -FeIII
Oh 1 15.4 3.5 5.4MgOh-O -MgOh 1 21.3 9.5 0.7MgOh-O-FeIII
Oh 1 17.6 5.7 0.8MgOh-O -FeII
Oh 1 21.5 9.6 0.1FeIII
Oh-O-FeIIIOh 1 13.8 2.0 0.2
FeIIIOh-O-FeII
Oh 1 17.8 5.9 0.1FeII
Oh-O-FeIIOh 1 21.7 9.8 0.0
AlOh-O-SiTd 1 7.7 7.2 -4.2 31.3MgOh-O-SiTd 1 9.8 -2.0 4.7FeII
OhO -SiTd 1 10.0 -1.9 0.4FeIII
Oh-O-SiTd 1 6.1 -5.8 2.5AlOh2-O-SiTd 1 -2.7 -14.5 40.8AlMgOh-O-SiTd 1 -0.4 -12.3 12.7AlFeIII
Oh-O-SiTd 1 -4.3 -16.2 6.6AlFeII
Oh-O-SiTd 1 -0.3 -12.1 1.0MgOh2-O-SiTd 1 1.8 -10.1 0.9MgFeIII
Oh-O-SiTd 1 -2.1 -13.9 1.0MgFeII
Oh-O-SiTd 1 2.0 -13.9 0.2FeIII
Oh2-O-SiTd 1 -5.9 -17.8 0.3
Tab. 4.13 : List of the sites present on the lateral surface of the clay platelets with their m+nparameter, the site densities in mmol kg-1 and the proton affinity constants given by equation4.20. Bold values are those used for the simulation. Brackets indicate that several sites weregrouped because of their similar proton affinity constants. The shaded sites are not taken intoaccount in the simulation due to their low amount. Example of log K calculation is availableupon request.
RESULTS AND DISCUSSION
In the present part, potentiometric titration data, given in part I, are simulated accordingto two models described above, i.e. an empirical cation exchange plus 3 sites 2 pK modelbased on the Bradbury and Baeyens model (Bradbury and Baeyens, 1997), and a 27 sitesstructural based model using the MUSIC approach (Hiemstra et al., 1996). The apparent CEC,which should match the measured CEC (based on ammonium acetate extraction), is simulated

156 / 204by setting it equal to the Na- or Ca- calculated adsorbed amount in exchange position, plus theamount of H+ desorbed from the edges of the clay platelets as a function of pH.
Bradbury and Baeyens model
The simulations together with the experimental potentiometric data are shown on Figure4.20.
-1.20
-1.00
-0.80
-0.60
-0.40
-0.20
0.00
0.20
1 2 3 4 5 6 7 8 9 10 11 12
��
H+ (
eq k
g-1)
0.50
0.75
1.00
1.25
1.50
1.75
2.00
1 2 3 4 5 6 7 8 9 10 11 12
Ca2
+ a
dsor
bed
(eq
kg-1
)
-0.40
-0.30
-0.20
-0.10
0.00
0.10
0.20
1 2 3 4 5 6 7 8 9 10 11 12
��
H+ (
eq k
g-1)
0.50
0.75
1.00
1.25
1.50
1.75
2.00
1 2 3 4 5 6 7 8 9 10 11 12
Ca2
+ a
dsor
bed
(eq
kg-1
)
-0.20
-0.10
0.00
0.10
0.20
0.30
0.40
1 2 3 4 5 6 7 8 9 10 11 12
��
H+ (
eq k
g-1)
0.50
0.75
1.00
1.25
1.50
1.75
2.00
1 2 3 4 5 6 7 8 9 10 11 12
Na+
ads
orbe
d (e
q kg
-1)
-0.10
-0.05
0.00
0.05
0.10
3 4 5 6 7 8 9
��
H+ (
eq k
g-1)
-0.10
-0.05
0.00
0.05
0.10
3 4 5 6 7 8 9
��
H+ (
eq k
g-1)
-0.10
-0.05
0.00
0.05
0.10
3 4 5 6 7 8 9
��
H+ (
eq k
g-1)
pH pH pH
Figure 4.20 : Experimental potentiometric titration data (��[H+], top and middle) and CEC data(bottom) of three experiments, described in part I, simulated by the 3 sites, 2 pK Bradbury andBaeyens’ model (Bradbury and Baeyens, 1997). From left to right, experiments 1 to 3respectively (see part I for experimental conditions). Experiment 1, 0.02 mol l-1 NaCl, 4.69 g l-1;experiment 2, 0.0068 mol l-1 CaCl2, 3.03 g l-1; experiment 3, 0.05 mol l-1 CaCl2, 1.53 g l-1.
The parameters of the simulation are given in Tab. 4.14 for edge surface complexationreactions. The only fitted parameters in these simulations are the cation exchange selectivitycoefficients. Fletcher and Sposito have already published a synthesis of exchange selectivity

157 / 204coefficient for montmorillonite (Fletcher and Sposito, 1989). We had some difficulties to fit ourdata with these coefficients, in particular concerning the CaCl+ ionic pair, whose selectivitycoefficient is dependent on the equilibrium constant of the reaction Ca2+ + Cl- � CaCl+ andthen, on the thermodynamic database used for the simulation. Then, we decided to fit the initialdata set (Na/Ca isotherms in ClO4
- and Cl- ionic background) to model the binary and ternaryCa2+/CaCl+/Na+ exchange reactions (Sposito et al., 1983a). The Figure 4.21 shows the resultsof these simulations. A sensitivity analysis shows that, for Ca2+/Na+ exchange isotherm obtainedin ClO4
- ionic background, a Ca2+/Na+ selectivity coefficient value of 100.1 to 100.6 permits to fitas well the data within the limit of the error bars (Kv
Ca/Na = 100.17 in Fletcher and Sposito reviewFletcher and Sposito, 1989). We chose a Ca2+/Na+ exchange selectivity coefficient of 100.4.Then, the Ca2+/CaCl+/Na+ system can be described with a CaCl+/Na+ exchange selectivitycoefficient, which value lies between 102.2 and 102.8. In agreement with these results and ourresults (Figure 4.20 and Figure 4.21), the exchange selectivity coefficients were fixed to thevalues indicated in Tab. 4.15. The 0.0 log K value for H+/Na+ exchange selectivity coefficient isvery near the 0.1 log K value tabulated by Fletcher and Sposito (Fletcher and Sposito, 1989)and denotes an equal affinity of the exchanger for the two cations. Furthermore, it should benoted that the experimental data at high pH are well simulated with a CaOH+/Na+ exchangeselectivity coefficient value equal to the CaCl+/Na+ one. Hence, we suppose that ionic pairs mayreact with the clay surface with the same affinity, either in the case of Me2+-Cl-, or in the case ofMe2+-OH-.
Surface complexation reactions log Kint
SSOH + H+ = SSOH2 4.5
SSOH = SSO- + H+ -7.9
SW1OH + H+ = SW1OH2+ 4.5
SW1OH = SW1O- + H+ -7.9
SW2OH + H+ = SW2OH2+ 6.0
SW2OH = SW2O- + H+ -10.5
Tab. 4.14 : Surface complexation reactions and associated protolysis constants (Kint) of thesimulation based on the Bradbury and Baeyens model (Bradbury and Baeyens, 1997).

158 / 204
0
0.2
0.4
0.6
0.8
1
1.2
1.4
0.0 0.2 0.4 0.6 0.8 1.0
sorb
ed a
mou
nt (e
q/kg
)
0
0.2
0.4
0.6
0.8
1
1.2
1.4
0.0 0.2 0.4 0.6 0.8 1.0
sorb
ed a
mou
nt (e
q/kg
)
CaE~
CaE~
Figure 4.21 : Fit of the Ca2+/Na+ exchange data of Sposito and al. (Sposito et al., 1983a) inperchlorate (top) and chloride ionic background (bottom). Perchlorate ionic background: thickline, log Kv
Ca2+/Na+ = 0.4; thin dotted lines log KvCa2+/Na+ varied from 0.1 to 0.6. Chloride
background: thick line, log KvCa2+/Na+ = 0.4 and log Kv
CaCl+/Na+ = 2.5; thin dotted lines, logKv
Ca2+/Na+ = 0.4 and log KvCaCl+/Na+ varied from 2.2 to 2.8.
Based on the Bradbury and Baeyens model (Bradbury and Baeyens, 1997), thesimulation respects the whole tendency of the proton surface charge titrations and of theapparent CEC increase. Nevertheless, it fails to respect the details of the measurements.
Hiemstra and Van Riemsdijk MUSIC model
In the MUSIC based model we consider both edge sites listed in Tab. 4.13 and cationexchange site used in the previous model. Furthermore, the cation exchange selectivitycoefficients are the same as those listed in Tab. 4.15. Some edge sites were grouped together

159 / 204in the model (brackets in Tab. 4.13) and some sites were neglected due to their low amountpresent at the edges of the particles (shaded lines). The pK of the sites used in the simulationare marked in bold. Only three log K parameters were adjusted (Tab. 4.13, horizontal arrowscolumns 3 and 4). The slight adjustments correspond to a maximal dMe-O shortening of less than0.01 Å and we do not allow the bonds to elongate. The shortening of the Me-O distances at theborder of the layers is an expected phenomenon based on the Pauling bond valence approach(Pauling, 1929; Brown, 1981; Brown and Altermatt, 1985; Brown, 1992, Schlegel, 2000).
Exchange reactions log Kint
2 NaX + Ca2+ � CaX2 + 2 Na+ 0.4 §
NaX + H+ � HX + Na+ 0.0 §
NaX + CaCl+ � CaClX + Na+ 2.5 §
NaX + CaOH+ � CaOHX + Na+ 2.5 ¶§ Adjusted (data from this study and Sposito et al.,1983a)¶ Set equal to Kv
CaCl+/Na+
Tab. 4.15 : Cation exchange reaction selectivity coefficients (Kv) used in both simulations.
This model describes very well both the titration data and the apparent CEC variations asa function of pH (Figure 4.22). Despite the numerous approximations done relative to thedifferent edge faces contribution and thus, to the different edge surface groups populations, theMUSIC approach is successful to model the surface proton charge of montmorillonite.Nevertheless, some criticisms can be made on the choice of the m + n values (Gaboriaud andEhrhardt, 2003). We hope that studies like molecular dynamic studies could help to constrainthese last parameters. In order to confirm the effectiveness of our approach, and, of our choicesfor these questionable parameters, we tried to link some clay properties (surface potential;dissolution kinetics) to the protonation state of the edge sites, as given by our model.

160 / 204
-1.20
-1.00
-0.80
-0.60
-0.40
-0.20
0.00
0.20
1 2 3 4 5 6 7 8 9 10 11 12
��
H+ (
eq
kg-1
)
-0.40
-0.30
-0.20
-0.10
0.00
0.10
0.20
1 2 3 4 5 6 7 8 9 10 11 12
��
H+ (
eq
kg-1
)
-0.20
-0.10
0.00
0.10
0.20
0.30
0.40
1 2 3 4 5 6 7 8 9 10 11 12
��
H+ (
eq k
g-1
)
-0.10
-0.05
0.00
0.05
0.10
3 4 5 6 7 8 9
��
H+ (
eq
kg-1
)
-0.10
-0.05
0.00
0.05
0.10
3 4 5 6 7 8 9
��
H+ (
eq
kg-1
)
-0.10
-0.05
0.00
0.05
0.10
3 4 5 6 7 8 9
��
H+ (
eq
kg-1
)
0.50
0.75
1.00
1.25
1.50
1.75
2.00
1 2 3 4 5 6 7 8 9 10 11 12
Na+ a
dso
rbe
d (e
q kg
-1)
0.50
0.75
1.00
1.25
1.50
1.75
2.00
1 2 3 4 5 6 7 8 9 10 11 12
Ca
2+ a
dsor
bed
(e
q kg
-1)
0.50
0.75
1.00
1.25
1.50
1.75
2.00
1 2 3 4 5 6 7 8 9 10 11 12
Ca
2+ a
dsor
bed
(e
q kg
-1)
Figure 4.22 : Experimental potentiometric titration data (top and middle) and CEC data (bottom)of part I simulated by the Hiemstra and Van Riemsdijk MUSIC model (this study and Hiemstra etal., 1996). From left to right, experiments 1 to 3 respectively. Experiment 1, 0.02 mol l-1 NaCl,4.69 g l-1; experiment 2, 0.0068 mol l-1 CaCl2, 3.03 g l-1; experiment 3, 0.05 mol l-1 CaCl2, 1.53 gl-1.
Surface potential of clay minerals
According to the model it is possible to calculate the pH at which the global edge surfacecharge is zero (Point of Zero Charge, PZC). By setting the edge groups formal charge to thevalues given in Tab. 4.16, we found a pHPZC value of 7.45 (Figure 4.23). At this pH, the edgecontribution to the total charge of the clay should be 0, and then, the apparent CEC should beequal to the structural one. The Figure 4.22 shows that it is not the case: a positive difference ofapproximately 10% of the structural CEC is observed for experiment 1. The experiments 2 and3 cannot be considered in this analysis, because of the adsorption of CaCl+ ionic pairs. Weestimate that a 10% error in the measurement/calculation of the structural CEC is reasonablesince many parameters, such as the Al content in the tetrahedral layer, are difficult to estimateand can significantly influence the theoretical structural CEC value. The clay edges PZC found
pH pH pH

161 / 204value justifies also, a-posteriori, the habit of measuring the CEC at near neutral pH (e.g.Metson, 1956).
Approximated formal charge
Types of sites Deprotonation First protonation Second protonation
SiTd-O -1 0 N.A
Me(III)Oh-O N.A. -1/2 +1/2
Me(II)Oh -O N.A. -2/3 +1/3
Me(III)Oh-O –Me(III)Oh N.A. 0 +1
Me(III)Oh-O –Me(II)Oh N.A. -1/6 +5/6
Me(II)Oh-O –Me(II)Oh N.A. -1/3 +2/3
Me(III)Oh-O-SiTd -1/2 +1/2 N.A.
Me(II)Oh-O-SiTd -2/3 +1/3 N.A.
Me(II)Oh2-O-SiTd -1/3 +2/3 N.A.
AlOh2-O-SiTd 0 N.A. N.A.
AlMgOh-O-SiTd -1/6 N.A. N.A.
AlFeIIIOh-O-SiTd 0 N.A. N.A.
Tab. 4.16 : Approximated formal charge of the edge surface groups of the clay. Surface sitesare grouped into categories, where Me(III) indicates a trivalent cation and Me(II) a divalentcation.

162 / 204
-0.1
-0.08
-0.06
-0.04
-0.02
0
0.02
0.04
0.06
0.08
0.1
2 3 4 5 6 7 8 9 10 11 12
pH
Edg
e su
rfa
ce
ch
arg
e (m
ol k
g-1)
Si-O-1
Al-O-1/2- Si
Al-OH+1/2Al-OH+1-Al
Al-OH+5/6-Mg
Figure 4.23 : Calculation of the edge surface charge after the parameters given in Tab. 4.14.Thick line: whole surface edge charge. Thin lines: individual contributions of the five maincomponents, SiTd-OH (deprotonation, pK = 8.2, 67.5 mmol kg-1), AlOh-OH (double protonation,pK = 10.5, 19.3 mmol kg-1), AlOh-OH-AlOh (double protonation, pK = 4.8, 33.7 mmol kg-1), AlOh-OH-MgOh (double protonation, pK = 7.3, 10.0 mmol kg-1), and AlOh-OH-SiTd (double protonation,pK = 7.2, 31.3 mmol kg-1). The Point of Zero Charge pH value is equal to pH = 7.5.
We can note that the maximum variation of the edge surface charge value is smaller than20% of the structural CEC. Since the charges created at the surface are also compensated bycations present in the solution, such as Na+ or Ca2+, the effect of pH on the measured surfacepotential must be negligible. Many studies (e.g. Delgado et al., 1986; Delgado et al., 1988;Avena et al., 1990; Avena and De Pauli, 1998; Avena, 2002) have shown already that the zetapotential of montmorillonite is weakly negative and invariant as a function of pH, supporting thepresented results and their interpretations. We could also argue that the clay in dilutesuspension is almost completely dispersed (e.g. Schramm and Kwak, 1982; Tournassat et al.,submitted-d). Hence, the edge surface charge is expressed in only one dimension (the linerepresented by the perimeter of the platelet), decreasing the capability of the charges to createan electrostatic potential. This supports our assumption, following Bradbury and Baeyens(Bradbury and Baeyens, 1997), of a lack of surface potential.
Edge sites protonation and clay particle dissolution.
Recent Atomic Force Microscopy studies showed clearly, that the dissolution of clay suchas nontronite or hectorite occurs by edge retreat rather than by pit formation (Bickmore et al.,2001). Dissolution rates have been shown on various oxides and silicates to be controlled bythe protonation state of surface functional groups (Furrer and Stumm, 1986; Stumm andWollast, 1990).
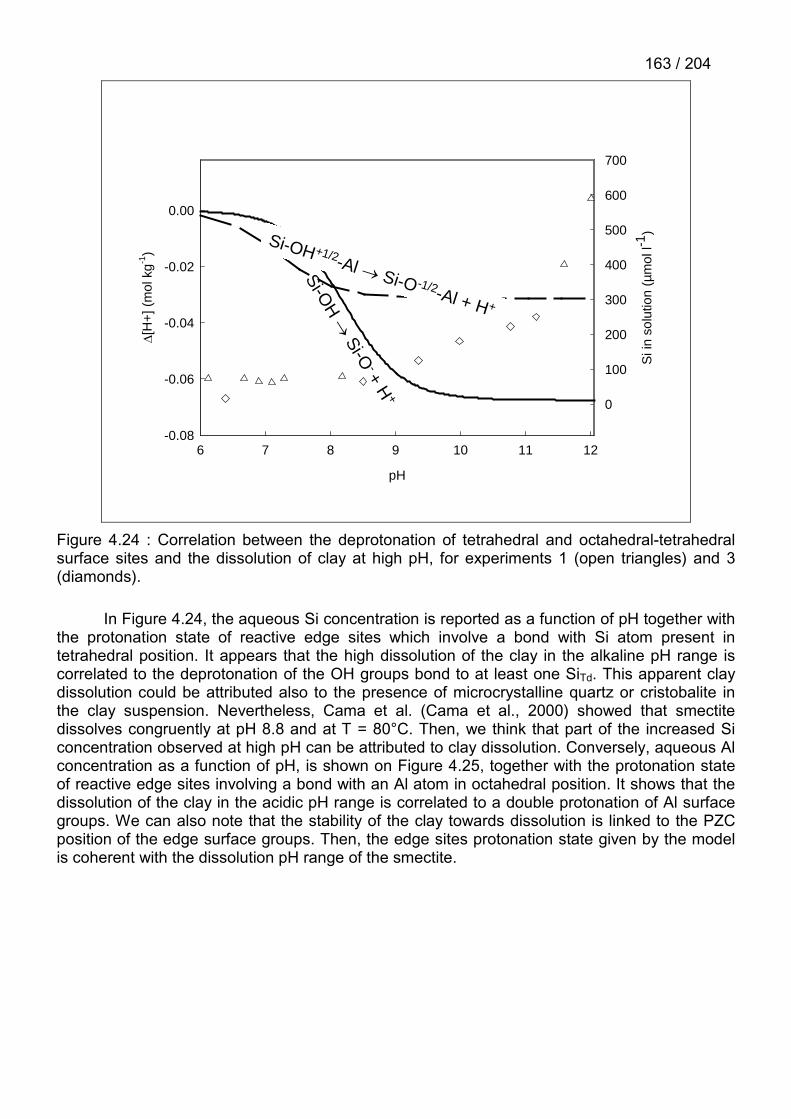
163 / 204
�[H
+] (
mol
kg-1
)
-0.08
-0.06
-0.04
-0.02
0.00
pH
6 7 8 9 10 11 12
Si i
n so
lutio
n (µ
mol
l-1)
0
100
200
300
400
500
600
700
Si-OH
� Si-O
- + H+
Si-OH+1/2-Al � Si-O-1/2-Al + H+
Figure 4.24 : Correlation between the deprotonation of tetrahedral and octahedral-tetrahedralsurface sites and the dissolution of clay at high pH, for experiments 1 (open triangles) and 3(diamonds).
In Figure 4.24, the aqueous Si concentration is reported as a function of pH together withthe protonation state of reactive edge sites which involve a bond with Si atom present intetrahedral position. It appears that the high dissolution of the clay in the alkaline pH range iscorrelated to the deprotonation of the OH groups bond to at least one SiTd. This apparent claydissolution could be attributed also to the presence of microcrystalline quartz or cristobalite inthe clay suspension. Nevertheless, Cama et al. (Cama et al., 2000) showed that smectitedissolves congruently at pH 8.8 and at T = 80°C. Then, we think that part of the increased Siconcentration observed at high pH can be attributed to clay dissolution. Conversely, aqueous Alconcentration as a function of pH, is shown on Figure 4.25, together with the protonation stateof reactive edge sites involving a bond with an Al atom in octahedral position. It shows that thedissolution of the clay in the acidic pH range is correlated to a double protonation of Al surfacegroups. We can also note that the stability of the clay towards dissolution is linked to the PZCposition of the edge surface groups. Then, the edge sites protonation state given by the modelis coherent with the dissolution pH range of the smectite.

164 / 204
pH
2 3 4 5 6
0
5
10
15
20
25
30
35
Al c
once
ntra
tion
(µm
ol l-1
)
�[H
+] (
mol
kg-1
)
-0.01
0.00
0.01
0.02
0.03
0.04
Figure 4.25 : Correlation between the double protonation of dioctahedral surface sites and thedissolution of clay at low pH, for experiment 3 (black points).
The pH conditions for dissolving clay minerals are dependent on clay type, which isconsidered. Hectorite, a Mg2+, Li+ trioctahedral smectite, is less stable at low pH but more stableat high pH than montmorillonite (e.g. Schlegel, 2000). In this structure, the main octahedralsurface sites for proton adsorption should be the Mg2-O-Si, the Mg-O and the Mg-O-Mg sites.The approximate formal charges of these sites are represented as a function of pH in Figure4.26. Structurally, the presence of two Mg2-O-Si sites should correspond to the presence of aMg-O-Mg site. The Mg-O sites should be present at a less extent than the others. Thus theglobal charge of the edges should be mainly controlled by the charge of the Mg-O-Mg site,since the Mg2-O-Si site has the same charge over the whole usual pH range. Hence, the PZCshould be shifted towards a basic pH value of approximately 10, in agreement with theobserved differences of stability pH range for montmorillonite and hectorite.

165 / 204
pH
(Mg-OH2-Mg)+2/3 (Mg-OH-Mg)-1/3
(Mg-OH2)+1/3
(Mg2-O-Si)-1/3
1 2 3 4 5 6 7 8 9 10 11 12
Figure 4.26 : Scheme of the protonation state of the hectorite main octahedral surface sites as afunction of pH.
Implications
The edge surfaces of smectite (and by extension, of other clays) are very heterogeneous,and then, complicated systems. Nevertheless, the present structural and morphological modelpermits to predict their reactivity towards protons. In Tab. 4.13, it can be noted that only 5 mainsites are necessary to model the titration data, because the relative amounts of other sites aretoo low to really affect the goodness of the adjustment. These main sites are: SiTd-OH(deprotonation, pK = 8.2, 67.5 mmol kg-1), AlOh-OH (double protonation, pK = 10.5, 19.3 mmolkg-1), AlOh-OH-AlOh (double protonation, pK = 4.8, 33.7 mmol kg-1), AlOh-OH-MgOh (doubleprotonation, pK = 7.3, 10.0 mmol kg-1), and AlOh-OH-SiTd (double protonation, pK = 7.2, 31.3mmol kg-1). The decomposition of the total edge surface charge is shown on Figure 4.23. Onlyfour adjusted parameters were necessary to quantify the amounts of these sites and theiraffinity for proton, namely three m+n values and the ratio between A-C and B type chains. ThreepK values were further slightly adjusted to better fit the data, but cannot be considered as freelyadjusted parameters. This low amount of adjustable parameters for a 27 (or more) sites model,should be compared to the amount of adjustable parameters for the 3 sites model of Bradburyand Baeyens (Bradbury and Baeyens, 1997): three different amounts of sites and six affinityconstants for protonation reactions were necessary to fit their data. This comparison shows theefficiency of a structurally and morphologically based model to predict clay surface reactivitywith a maximal precision and a minimal amount of adjustable parameters.
The clay proton affinity constants are often used to derivate clay metal complexationconstants (Stadler and Schindler, 1993; Zachara and Smith, 1994; Bradbury and Baeyens,1997, 1998; Turner et al., 1998). But, by considering the heterogeneity of the clay edges andthe chemical properties of H+ and metallic cations, it becomes doubtful to consider that metalliccations do sorb on the same sites than protons. Schlegel et al. (Schlegel et al., 1999) showedthat Co2+ can form inner sphere complex onto hectorite edge surfaces and that Co2+ sharesedges rather than corners with octahedral layer sites, yielding to the link of Co2+ to, at least, twooxygen surface groups. Since protons are linked to only one oxygen surface group, the classicalempirical modeling approaches for metal complexation on clay minerals should be questioned.For example, Zachara et al. (Zachara et al., 1993; Zachara and Smith, 1994) or Turner et al(Turner, 1995; Turner et al., 1998) consider that the reactivity of clay edges can be modeled by

166 / 204considering the reactivity of alumina and silica, and by using a triple layer model, as anelectrostatic model. In their studies, they fitted the amount of edge sites concomitantly with theirmetal adsorption data, but without titration data, or, they calculated the amount of sites on thebasis of morphological information and on structural information given by White and Zelazny(White and Zelazny, 1988). In this model, only Si-OH and Al-OH amphoteric sites areconsidered (2-pK model), according to White and Zelazny suggestion (White and Zelazny,1988). This approach is successful to fit the sorption data, but many hypotheses are not reallyjustified. In the present study, we show for instance that AlOh-OH-SiTd sites could react in thenear neutral pH range towards protons, standing in contradiction with White and Zelaznysuggestion. Furthermore, the sites described in this study do not have an amphoteric behaviorin the pH range usually considered for sorption experiments (i.e. pH value between 2 and 10).
CONCLUSION
Natural clay systems are far more complex than the systems studied in the laboratories.In natural or engineered systems, competition effects for sorption are expected (Tournassat andCharlet, submitted). If the density and affinities of sites available for competitive sorption werenot well constrained, these competition effects could not be precisely modeled. Hence, theoversimplification of the clay edge reactivity towards cations could lead to an impossibility tomodel the interactions between multi-solute system and clay particles. Whereas surfacecomplexation models such as Bradbury and Baeyens models are an improvement compared toKd approach, we question their “mechanistic model” attribute and their effectiveness to modelnatural systems since:
� cations complexation pK values are fitted relatively to an “arbitrary” surface protonation pKvalue;
� a given complexation reaction is attributed arbitrarily to a single type of site, and a verylimited set of sites is considered in this type of simulation, whereas the structuralheterogeneity of surface groups allows a huge amount of site configurations and availablecoordinations, due to the morphology of the clay platelets, and, due to the chemicalcomposition of the clay (especially the heterogeneous octahedral layer); and
� the complexation reactions involve only one site (e.g. via single corner sharing) and theauthors do not consider the possible interactions between two or more protonated sites andthe cations (e.g. via double corner or edge sharing) as shown for Ni2+ by polarized EXAFSspectroscopy (Schlegel et al., 1999; Dähn et al., 2003), or the nucleation processes of newphases as shown for Zn and Co on hectorite and montmorillonite (Schlegel et al., 2001b;Dähn et al., 2002b).
With the present study, we have shown that a model, based on sound morphological andstructural information, is able to predict the reactivity of clay edge surfaces towards protons witha better accuracy and with fewer free parameters than empirical 3 (or 2) sites 2 pK models. Thisapproach can be combined to the prediction of the variations of the CEC as a function of pH.We hope that such an approach could be extended to other cation complexation reactions.
As secondary results, we have derived the cation exchange selectivity coefficient forCaCl+ and CaOH+ ionic pairs. These ionic pairs have similar and high affinity constants values(log Kv = 2.5). We refer the reader to the article from Sposito et al. (Sposito et al., 1983a) toexplain the high CaCl+ exchange constant. The adsorption of CaOH+ and the high affinity ofclays for these ion pair is of importance in alkaline medium such a cement alkaline solution.Finally, we have confirmed the non-preference of the clay exchanger for H+ and Na+ (log Kv =0), and clearly distinguished this cation exchange from the (simultaneously occurring) mineraldissolution reaction.

167 / 204
ACKNOWLEDGEMENT
This research was funded by the French National radioactive waste management agency(ANDRA).

168 / 204

169 / 204
5. CONCLUSION GENERALE

170 / 204

171 / 204
5.1. DEMARCHE SCIENTIFIQUE APPLIQUEE LORS DE CES TROIS ANNEESDE RECHERCHE
L'enchaînement des chapitres de cette thèse vise à montrer le plus simplement etlogiquement possible l'ensemble des résultats collectés pendant ces trois années de thèse.L'enchaînement des expériences et des résultats fut en fait très différent. La première difficultéfut d'abord de résoudre le problème de l'oxydation en solution du Fe(II) en Fe(III). Cettedifficulté nous a amené à définir les protocoles de purification des solutions décrites en annexe6.3 et à utiliser systématiquement la boîte à gants comme milieu d'expérience. La premièreboîte à gants utilisée (marque Coy) ne nous donnant pas entière satisfaction (problème deporosité de l’enceinte, fuites à répétition…), nous avons du acquérir un modèle plus performantchez un autre fournisseur (marque Jacomex). L'utilisation de la boîte à gants apporte desrestrictions expérimentales. En particulier, il est très difficile de contrôler en début d'expérienceles concentrations des solutions et les teneurs des suspensions (problème de l'évaporation del'eau dans le sas sous vide ou lors de l'équilibrage avec l'atmosphère de la boîte à gants). Cettedifficulté explique les valeurs des concentrations et des teneurs qui ne tombent jamais sur desvaleurs "rondes". Cette difficulté surmontée, les expériences de sorption ont pu commencer.Nous nous sommes rapidement aperçus que l'adsorption spécifique du Fe(II) se faisait à trèsbas pH. Ce résultat étonnant fut confirmé pour une gamme de conditions expérimentales assezétendue. Les conséquences de cette forte affinité de l'argile furent envisagées à savoir desphénomènes de saturation des sites et de compétition avec d'autres cations. Les phénomènesde compétition furent confirmés expérimentalement et la forte affinité du Fe(II) pour certainssites de surface était ainsi démontrée. Entre autres conséquences, les expériences d'échangecationique durent être programmées à bas pH. Elles montrèrent un comportement du Fe(II) enaccord avec le comportement attendu pour un cation divalent vis-à-vis de l'échange cationique.Toutefois, la quantité équivalente maximum de cations échangés (Ca2+, Na+ ou Fe2+) n'était pasen accord avec la capacité d'échange cationique de l'argile MX80 telle qu'elle est donnée dansla littérature. Plusieurs paramètres expérimentaux pouvaient être responsables de cettedifférence et chacun fut testé par des expériences différentes : la détermination de la teneur enargile des suspensions mère, l'effet du pH, la justesse de la formule structurale de l'argile et lerapport Fe(II)/Fe(III) dans cette formule. Chacune de ces expériences apporta son lot derésultats dont le plus marquant fut la variation de la CEC avec le pH sur toute la gamme de pH.Ce résultat était déjà partiellement disponible dans la littérature mais n'avait jamais été montrésur autant de points expérimentaux et n'était jamais expliqué ou modélisé. Cette expérience futle point de départ des expériences de titrages potentiométriques des argiles couplés à lamesure de la CEC. Entre-temps, la surface spécifique des bordures de l'argile avait étédéterminée par AFM. Au départ l'AFM devait nous permettre de montrer le fort pouvoirréducteur du Fe(II) adsorbé. Il était prévu d'étudier la réduction de composés oxydants(inorganiques du type As(V), ou organiques du type TCE) par le Fe(II) adsorbé sur lesbordures. Ces expériences devraient être bientôt possibles grâce à l'introduction d'un AFM enboîte à gants à l'INE Karlsruhe (équipe de Dirk Bosbach) mais ne l'étaient pas encore lors demon séjour en Allemagne. Nous avons tout de même regardé la morphologie des particules demontmorillonite, travail qui n'avait pas été effectué jusqu'alors. C'est en montrant les imagesdes particules lors d'une séance de travail du groupe Fe - argile à l'ANDRA qu'un des membresdu groupe, Frédéric Villiéras, nous fit remarquer que la taille de nos particules correspondait àla taille qu'il calculait à partir d'une méthode totalement différente: l'adsorption de gaz à trèsbasse pression. En faisant l'étude statistique de la taille des particules et de leurs surfaces parAFM et en les comparant aux résultats d'adsorption de gaz, nous montrions alors un excellentaccord sur les valeurs trouvées de surface spécifique. Ce résultat me permit alors de me lancerdans la modélisation morphologique et structurale de la réactivité des bordures des particulesd'argiles. L'utilisation de la spectroscopie FTIR fut rendue nécessaire par la nécessité decontraindre le lieu de réaction des protons avec l'argile sur les bordures des particules et non

172 / 204pas dans l’ensemble de la structure, et de contraindre la distribution des cations dans lastructure de l'argile (ordre des cations aléatoire dans le feuillet octaédrique). Restait à expliquerla forte affinité des bordures de l'argile pour l'ion Fe(II) comparativement à d'autres ions commele Zn(II). Des expériences complémentaires de chimie permirent de connaître la stœchiométriede la réaction et de décrire le phénomène de complexation de surface par la somme deplusieurs phénomènes : précipitation (de surface ?), sorption compétitive et oxydation. Desexpériences de spectroscopie Mössbauer furent programmées grâce à l'aide de Jean-PierreJollivet et se firent avec Jean-Marc Greneche au Laboratoire de Physique de L'Etat Condensédu Mans (université du Maine). Celles-ci montrèrent que tout le fer adsorbé était sous formeoxydée Fe(III). Aujourd'hui encore, une question persiste : l'oxydation s'est-elle faite pendantl'expérience de sorption (oxydation par l'argile, par l'eau ?) ou pendant le transport de Grenoblejusqu'au Mans malgré toute les précautions prises ? De nouvelles expériences sontprogrammées avec un renforcement des précautions (en particulier, l’utilisation de l’azoteliquide pour le stockage pendant le transport). Si l'oxydation par l'argile ou par l'eau estconfirmée, celle-ci pourrait être invoquée comme étant la "driving force" de la réactiond'adsorption du Fe(II).
5.2. RETOUR SUR LA PROBLEMATIQUE DU STOCKAGE DES DECHETSRADIOACTIFS EN PROFONDEUR
Cette thèse montre un certain nombre d'effets du Fe(II) ou d'autres cations sur lespropriétés de l'argiles, pouvant avoir une influence positif ou negatif sur la performance de labarrière ouvragée.
5.2.1. Adsorption des paires ioniques en sites d'échange cationique et conductivitéhydraulique
Les résultats des expériences d'échanges montrent qu'en fond chloré, des paires ioniquesdu type CaCl+ ont une forte affinité pour les sites d'échange. A haut pH, le phénomène sembleêtre le même pour les paires ioniques CaOH+. Les cations monovalents (dont font partie cespaires ioniques) favorisent la dispersion des plaquettes d'argiles et devraient donc avoir un effetcontrecarrant la coagulation et dans un sédiment la formation de gros agrégats. La présenced'agrégats favorisant la conductivité hydraulique, la présence de ces paires ioniques devraitdiminuer cette conductivité et donc avoir un effet positif sur la performance de la barrière.Toutefois, des expériences de mesures de porosité ou de conductivités comparées en milieusodique et chloro – calcique sont nécessaires pour confirmer cet effet et surtout pour connaîtreson importance.
5.2.2. Effet tampon-pH de l'argile
A bas pH, les résultats de titration et leur modélisation permettent de prédire avec plus deprécision l'effet tampon de l'argile (environ 0.1 mol H+ par kg d'argile entre pH 5 et 8). A hautpH, la présence de CaOH+ en site d'échange cationique procure à l'argile un pouvoir tamponfort en milieu calcique (fond géologique et solutions issues de l'altération des ciments). Cepouvoir tampon peut-être facilement estimé à partir de la CEC. Entre pH 10 et 12, ce pouvoirtampon est égal à la valeur de la CEC. Cette propriété pourrait avoir un effet important sur lamodélisation de l'évolution du pH dans la barrière.

173 / 204
5.2.3. Effet de précipitation à haut pH
A haut pH, des phases de type CSH (tobermorite ?) précipitent rapidement en présencede Ca(II) en solution. En présence de Fe(II), une phase Fe-Si précipite. Ces précipitationspeuvent avoir des effets soit positifs soit négatifs sur les performances des barrières : ellespeuvent contribuer à limiter la porosité du matériau (effet positif sur la performance liée à laconductivité hydraulique) mais également contribuer à la perte de plasticité de la barrière entransformant des argiles gonflantes en matériau rigide.
5.2.4. Effet compétiteur du Fe(II)
Nous avons montré que le Fe(II) peut entrer en concurrence avec d'autres éléments surcertains sites de l'argile. Ces sites peuvent être des sites d'adsorption ou de des sitesstructuraux. Des expériences futures devraient permettre d'affirmer ou d'infirmer cet effetcompétiteur avec les radionucléides, la question étant : le Fe(II) s'adsorbe-t-il sur les mêmessites que les radionucléides ? En cas de réponse positive, ce phénomène aurait un effet négatifsur la performance de la barrière, celle-ci perdant une partie de son efficacité chimique vis-à-visde la diffusion des polluants une fois la corrosion du containeur assez avancée. Un front deradionucléides adsorbés sur les argiles de la barrière en avant d'un front de Fe(II) adsorbéserait alors à prévoir. Toutefois ce résultat est à nuancer en fonction de la solubilité du Fe(II) àhaut pH. En effet cet effet compétiteur a été montré à pH 6 environ, où la solubilité du Fe(II) estbonne. A haut pH le Fe(II) peut précipiter (sidérite, berthiérine, chlorite…) ou s'incorporer dansdes phases minérales le rendant moins disponible pour la compétition. Ceci a été vérifié lors denos expériences, puisque à haut pH et en présence d'argile le Fe(II) précipite avec la silice ensolution. Toutefois, l'épisode à haut pH de la barrière devrait être limité dans le temps pourprogressivement revenir à un épisode avec un pH proche de la neutralité correspondant à l'eaude site. Ce pH favoriserait alors la dissolution du Fe(II) et son adsorption compétitive plus loinen avant du front, là ou seraient localisés les radionucléides.
5.3. BACK TO THE PROBLEMATIC OF THE NUCLEAR WASTES DEEPREPOSITORY FIELD
This thesis shows various effects of the presence of Fe(II) and other cations on the clayproperties. These effects can be positive or negative on the performance of the engineeredbarrier.
5.3.1. Ions pairs adsorption in cation exchange position and hydraulic conductivity
In a chloride medium, ionic pairs, like CaCl+, have a high affinity for cation exchange sites.At high pH, CaOH+ seems to have the same behavior. The presence of monovalent cations(including ionic pairs) leads to the dispersion of clay platelets and then, big clay aggregates arenot expected to appear. The disappearance of clay aggregates should decrease the clayhydraulic conductivity and hence should increase the performance of the barrier. Porosity andconductivity experiments are necessary to assess and quantify this effect.

174 / 204
5.3.2. Clays as pH-Buffer
At low pH, titration results should permit to enhance the precision of the model of pHevolution in the barrier. At high pH, the CaOH+ sorption in cation exchange position should givea high pH-buffer capacity to clay material. This capacity is estimated to be equal to the CECbetween pH 10 and 12.
5.3.3. High pH precipitation
At high pH, CSH like phase (tobermorite) precipitates rapidly in presence of clay andCa(II). If Fe(II) is present, a Fe-Si phase precipitates. Precipitation could have both positive andnegative effect on the barrier performance. It can limit the porosity of the material and then canenhance the effectiveness of the barrier, since hydraulic conductivity decreases. It candecrease also the plasticity of the barrier.
5.3.4. Fe(II) Competition effect
Fe(II) can compete with other elements on clay specific sorption sites. Experiments in thefuture should allow us to assess (or not) the competition effect between Fe(II) andradionuclides. If Fe(II) did compete for sorption with these elements, the performance of thebarrier would decrease. The front of sorbed radionuclides would be ahead from the front ofsorbed Fe(II). The competition effect was shown for pH ~6. Fe(II) is soluble at this pH. In arepository field, the pH should be very higher in a first time and will limit the solubility of Fe(II),decreasing its capacity of competition. Nevertheless, thereafter, the system should equilibratewith the composition of “site” water and the pH should drop to near neutral pH, releasing Fe(II)in solution which will be available for competition with radionuclides.
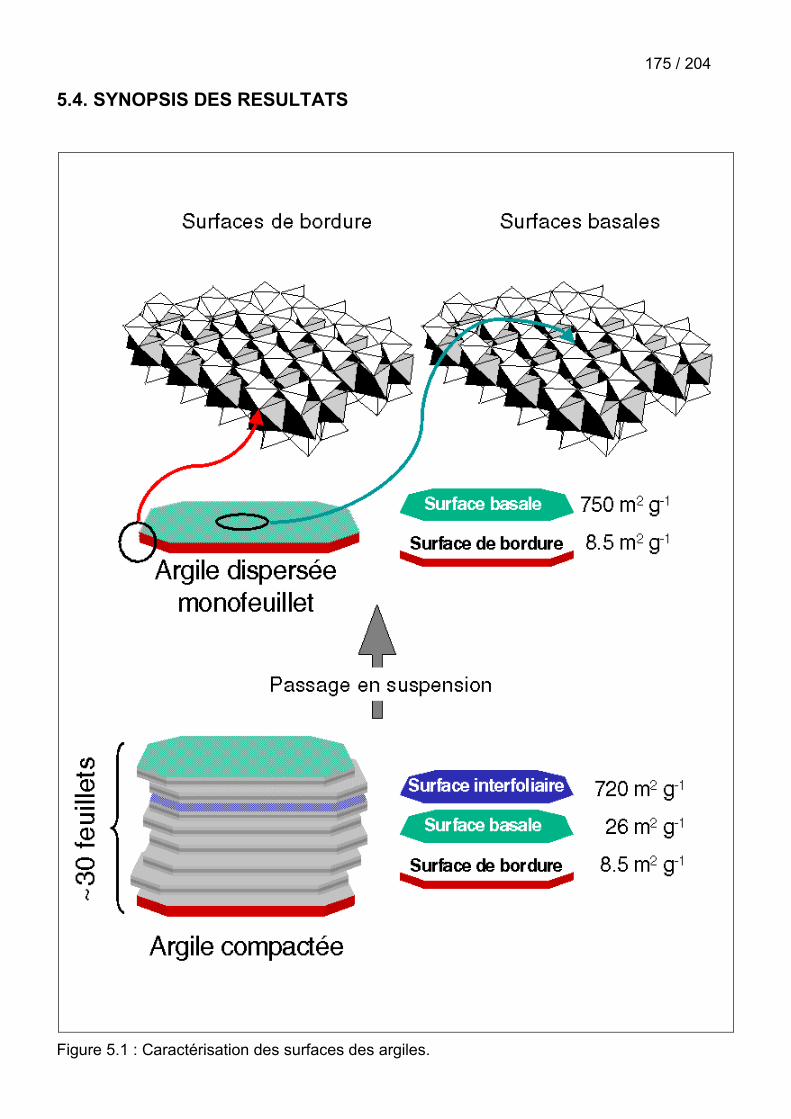
175 / 204
5.4. SYNOPSIS DES RESULTATS
Figure 5.1 : Caractérisation des surfaces des argiles.

176 / 204
Figure 5.2 : Schématisation des interactions Fe(II)�montmorillonite sur les surfaces de bordure.

177 / 204
Figure 5.3 : Vers une modélisation morphologico � structurale des interactions argiles � solutéssur les bordures des argiles.

178 / 204
Figure 5.4 : résumés des réactions d'échanges cationiques sur les surfaces basales desparticules de montmorillonite.

179 / 204
5.5. CHAMPS D'APPLICATIONS DES RESULTATS DE CETTE THESE
Figure 5.5 : Champs d'application explorés ou en cours d'exploration des résultats présentésdans cette thèse.

180 / 204
5.6. PERSPECTIVES
Le thème de cette thèse, initialement axée sur les interactions entre le Fe(II) en solutionet les argiles, a été rapidement étendu aux interactions solutés – argiles en général. En effet,devant la multiplicité et la complexité des phénomènes engendrés par la présence de Fe(II)dans des suspensions argileuses en système anoxique, les modèles empiriques d’interactionssolutés – argile déjà présents dans la littérature montrent leurs limites. La modélisationindividuelle des phénomènes englobés sous le terme générique de "sorption" représente unpremier grand chantier à explorer (Figure 5.6).
Dans cette thèse, une approche morphologico � structurale des interactionssolutés�argiles a été ébauchée. Son efficacité à modéliser les interactions argile – H+ estencourageante. L’étape de modélisation suivante est l’établissement de constantes decomplexation des métaux sur des critères autres que l’ajustement des isothermes d’adsorption(Figure 5.7), c’est à dire sur des critères structuraux pour les ions dont le complexe de surfaceou le précipité de surface, a une structure connue.
Ces données pourront alors servir à la modélisation de la dynamique des fronts redoxliés au déplacement du Fe(II) dans des aquifères, des sédiments marins ou encore dans dessystèmes d’ingénierie. Elles permettront également de mieux interpréter et prédire l’effetd’atténuation naturelle du Fe2+ adsorbé vis – à – vis de polluants tels que les solvants chlorés,les explosifs ou encore les pesticides.
Le nombre d’oxydation des espèces adsorbées est, comme nous l’avons vu pour leFe(II), pas forcément celui de l’absorbat. L’argile – voir l’eau à l’interface – peut jouer le rôled’oxydant, et ce, même quand le potentiel d’oxydo – réduction est imposé en solution à unniveau très bas. Ce phénomène, a priori, pas limité au Fe2+ a souvent été reporté pour le cérium(source de l’anomalie du cérium dans la série des lanthanides) et pourrait affecter nombre deradionucléides présents sous divers degrés d’oxydation.
Les effets de compétition pour les sites d’adsorption spécifique sont également un sujet àexplorer plus profondément et sur davantage de minéraux naturels (Figure 5.6). Lesexpériences de compétition doivent permettre de différencier des phénomènes de sorption purepour lesquels cette compétition existe, de phénomène de précipitation de surface pour lesquelscette compétition est moins probable mais où la précipitation de nouvelles surfacesentraîneraient plutôt la création de nouveaux sites d’adsorption. Il est tout à fait envisageableque ces expériences montrent que les phénomènes de complexation de surfaces sont en faitlimités aux domaines de pH acide et neutre voir faiblement basique et que les phénomènes deprécipitation de surface prennent le relais à plus haut pH. La thermodynamique de cesprécipités de surface est un domaine encore presque vierge.

181 / 204
Figure 5.6 : Résumé des perspectives liées aux interactions Fe(II)�montmorillonite.
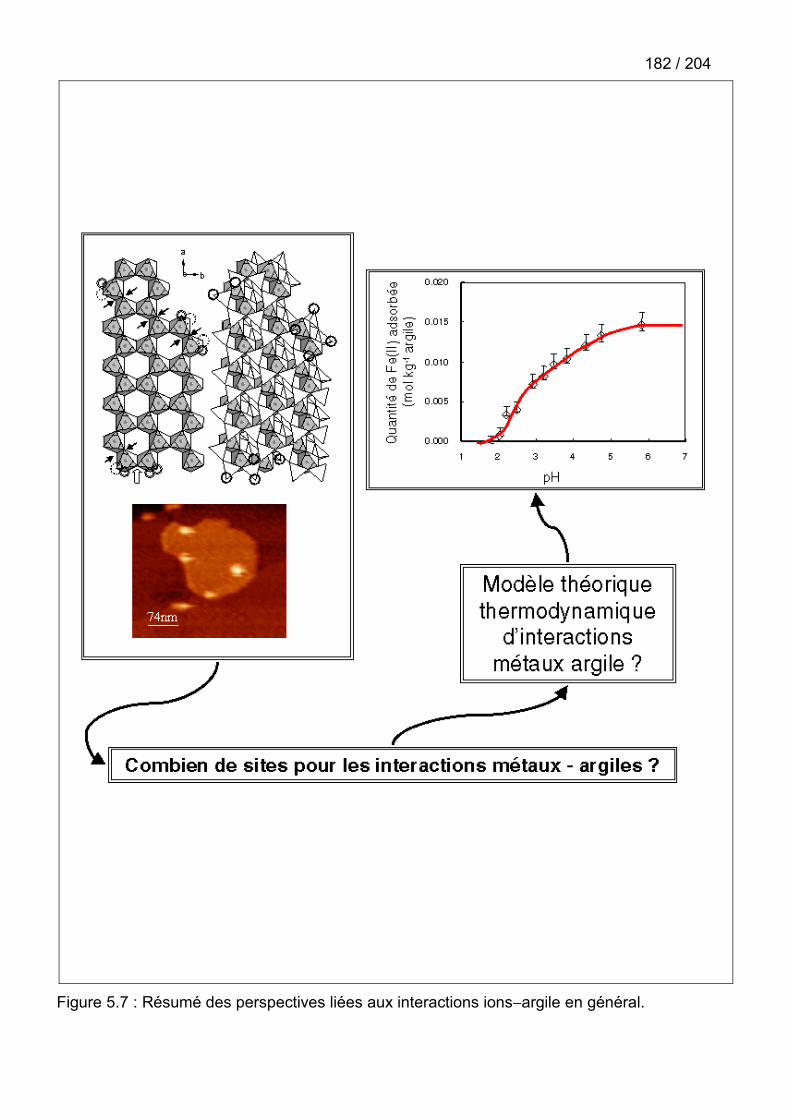
182 / 204
Figure 5.7 : Résumé des perspectives liées aux interactions ions�argile en général.

183 / 204
6. ANNEXES

184 / 204
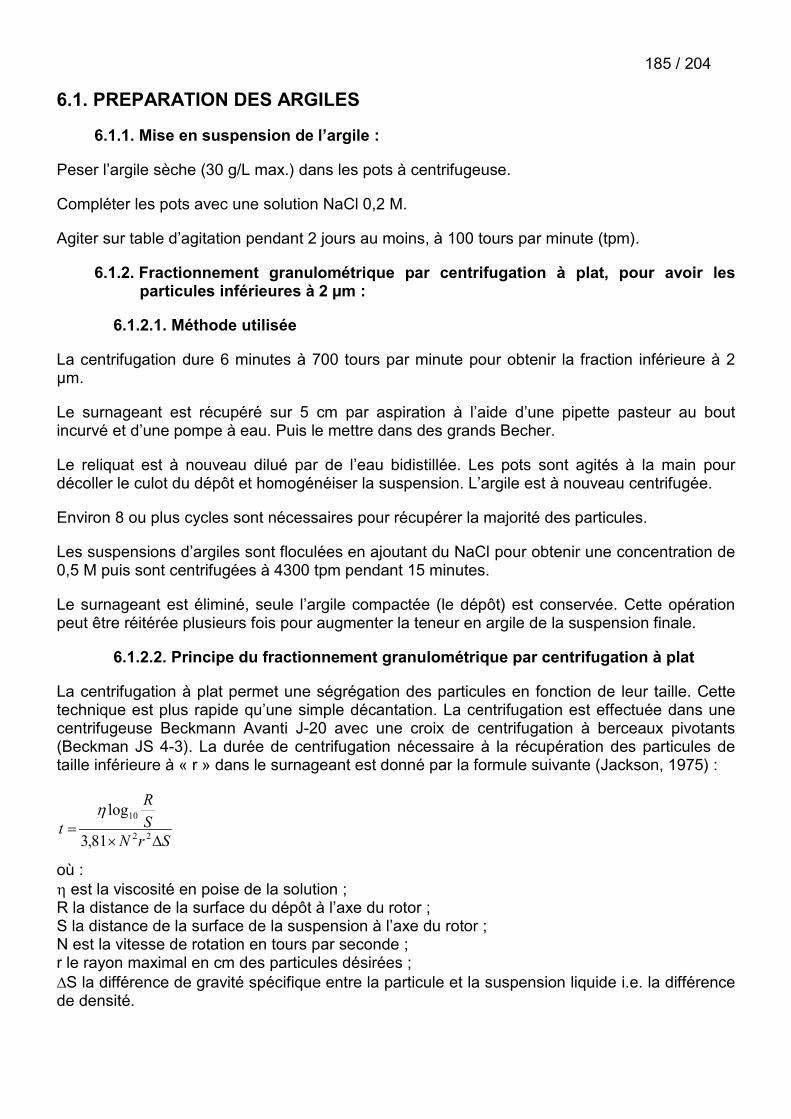
185 / 204
6.1. PREPARATION DES ARGILES
6.1.1. Mise en suspension de l’argile :
Peser l’argile sèche (30 g/L max.) dans les pots à centrifugeuse.
Compléter les pots avec une solution NaCl 0,2 M.
Agiter sur table d’agitation pendant 2 jours au moins, à 100 tours par minute (tpm).
6.1.2. Fractionnement granulométrique par centrifugation à plat, pour avoir lesparticules inférieures à 2 µm :
6.1.2.1. Méthode utilisée
La centrifugation dure 6 minutes à 700 tours par minute pour obtenir la fraction inférieure à 2µm.
Le surnageant est récupéré sur 5 cm par aspiration à l’aide d’une pipette pasteur au boutincurvé et d’une pompe à eau. Puis le mettre dans des grands Becher.
Le reliquat est à nouveau dilué par de l’eau bidistillée. Les pots sont agités à la main pourdécoller le culot du dépôt et homogénéiser la suspension. L’argile est à nouveau centrifugée.
Environ 8 ou plus cycles sont nécessaires pour récupérer la majorité des particules.
Les suspensions d’argiles sont floculées en ajoutant du NaCl pour obtenir une concentration de0,5 M puis sont centrifugées à 4300 tpm pendant 15 minutes.
Le surnageant est éliminé, seule l’argile compactée (le dépôt) est conservée. Cette opérationpeut être réitérée plusieurs fois pour augmenter la teneur en argile de la suspension finale.
6.1.2.2. Principe du fractionnement granulométrique par centrifugation à plat
La centrifugation à plat permet une ségrégation des particules en fonction de leur taille. Cettetechnique est plus rapide qu’une simple décantation. La centrifugation est effectuée dans unecentrifugeuse Beckmann Avanti J-20 avec une croix de centrifugation à berceaux pivotants(Beckman JS 4-3). La durée de centrifugation nécessaire à la récupération des particules detaille inférieure à « r » dans le surnageant est donné par la formule suivante (Jackson, 1975) :
SrNSR
t��
� 22
10
81,3
log�
où :� est la viscosité en poise de la solution ;R la distance de la surface du dépôt à l’axe du rotor ;S la distance de la surface de la suspension à l’axe du rotor ;N est la vitesse de rotation en tours par seconde ;r le rayon maximal en cm des particules désirées ;�S la différence de gravité spécifique entre la particule et la suspension liquide i.e. la différencede densité.

186 / 204
Figure 6.1 : Schéma de la centrifugation sur axe à berceau rotatif et variables associées
Dans cette étude R = 13 cm, S = 6,5 cm, � = 0,00894 p à 20°C, et la centrifugation dure 6minutes à 700 tours par minute pour obtenir la fraction inférieure à 2 µm. Le surnageant estrécupéré sur 5 cm (pour prévenir toute pollution par des particules trop grosses) par aspirationà l’aide d’une pipette pasteur au bout incurvé et d’une pompe à eau. Le reliquat qui contientencore des particules de diamètre inférieur à 2 µm du fait de leur entraînement par les autresparticules est à nouveau dilué par de l’eau bidistillée. Les pots sont agités à la main pourdécoller le culot du dépôt et homogénéiser la suspension. L’argile est à nouveau centrifugée.
6.1.3. Purification minéralogique
6.1.3.1. Attaque acide (élimine les carbonates)
Chaque pot à centrifuger est complété avec une solution d’acide acétique 0,1 M ( 5.6 ml dans1L) et de NaCl 0,5 M. (29.22 g dans 1 L).
Les pots sont agités à la main quelques dizaines de secondes,
Puis ouverts pour laisser s’échapper les gaz produits (CO2), sous la hotte.
Ils sont ensuite fermés et mis sur table d’agitation pendant 1 heure.
Les suspensions sont ensuite centrifugées pendant 30 min à 4300 tpm. Le surnageant estéliminé et une deuxième attaque acide est effectuée.
Les pots à centrifuger sont complétés avec une solution NaCl 0,5 M, agités pendant 1 heure etcentrifugés 30 min à 4300 tpm. Ce lavage est répété trois fois.
6.1.3.2. Attaque DCB (élimine les hydroxydes de fer et de manganèse pardissolution en conditions réductrices)
Chaque pot est complété avec une solution de citrate 0,2 M (52.62 g dans 1L), NaCl 0,5 M(29.22 g dans 1 L) et bicarbonate 0,1 M ou NaOH 6 g.L-1 approximativement (pour tamponner lepH autour de 6).
Une petite spatule de dithionite de sodium (Na2S2O4) est ajoutée dans chaque pot.
Les pots sont mis au bain-marie dans un évier d’eau chaude (40°C) pendant 5 minutes, puissont ouverts sous hotte pour libérer les gaz produits. Ils sont ensuite agités sur table pendant 1heure, puis centrifugés pendant 30 min à 4300 tpm. Le surnageant est éliminé. Le cycle estrépété 1 fois. Il est suivi de trois cycles de lavage au NaCl 0,5 M.
187 / 2046.1.3.3. Attaque à l’eau oxygénée (H2O2) (élimine la matière organique)
Chaque pot est complété par une solution de H2O2 3% (100 ml de H2O2 30 % dans 1 L) et NaCl0,5 M.
Agités à la main et sur table pendant ½ heure.
Le contenu de tous les pots est transféré dans un grand bêcher préalablement rincé avec lasolution de H2O2.
La suspension est chauffée à 55-60°C et agité par un barreau aimanté pendant 1 heure.
La suspension refroidie est ensuite versée dans des pots et centrifugés pendant 30 min à 4300tpm.
Le surnageant est éliminé. 3 cycles de lavages sont alors effectués avec du NaNO3 0.5 M
L’argile purifiée peut alors être stockée au réfrigérateur ou être mise à l’équilibre avec unesolution adéquate.
6.1.4. Saturation des argiles au Na+ et au Ca2+
La saturation de l’argile au sodium ou au calcium est obtenue par des cycles de lavages avec lasolution d’intérêt (NaNO3 ou CaCl2,2H20), centrifugation et élimination du surnageant. Les 3premiers cycles se font avec des solutions concentrées (1 M) puis au minimum 3 autres cyclessont effectués avec la solution de molarité souhaitée.

188 / 204
6.2. METHODE DE DOSAGE DU FE(II) ET DU FE(III) PARSPECTROPHOTOMETRIE D’ABSORPTION : METHODE FERROZINE
Cette méthode permet de descendre vers des valeurs de concentrations assez basses (autourdu micromolaire – 0.05 ppm – jusqu’environ 100 micromolaire sans dilution préalable). Lapublication d’origine est celle de Viollier et al., 2000.
6.2.1. Réactifs et standards :
Réactif AFerrozine 10-2 mol.L-1 (C20H14N4O6S2, ALDRICH 16,060-1) dans acétate d’ammonium 10-1
mol.L-1 (ALDRICH 37,233-1). Soit pour 20 mL de réactif : 0,1542 g d’acétate d’ammonium et0,09849 g de Ferrozine.
Réactif BHydroxylamine hydrochloride 1,4 mol.L-1 (ALDRICH 37,992-1, pureté > 99,9999%) dans unesolution d’HCl analytique à 2 mol.L-1. Soit pour 20 mL de réactif 1,9457 g d’hydroxylaminehydrochloride.
Réactif C = BufferAcétate d’ammonium 10 mol.L-1 ajusté à pH 9,5 avec une solution d’hydroxyde d’ammonium.Soit pour 10 mL de réactif 7,708 g d’acétate d’ammonium.Standards de Fer Préparation à partir d’une solution 1000 µg.mL-1 de Fe(III) (standard ICP) diluée dans unesolution à la force ionique de l’expérience.
6.2.2. Protocole :
)12(*)2(
1*)2(* 21)(
pentepentepente
penteApenteAC IIFe
�
�
�
�
)12(*
*12)(
pentepenteAA
C IIIFe
�
�
�
�
�
�
1. Mesurer l’absorbance A1 à 562 nm de 5 mL d’échantillon filtré + 0,5 mL de réactif A. Tracerla courbe concentration en fonction de l'absorbance A1 pente1 ;
2. Ajouter 0,5 mL de réactif B réduction du Fe(III) en Fe(II) et attendre 10 min (réduirel’attente si la solution contient peu de Fe(III)) ;
3. Ajouter 0,17 mL de réactif C et mesurer l’absorbance A2 à 562 nm. Tracer la courbeconcentration en fonction de l'absorbance A2 pente2.
Pour quelques standards, les étapes 2 et 3 sont répétées une fois ( A2’) pour obtenir lefacteur de dilution � entre les mesures de A1 et A2 : � = A2’/A2. La moyenne des � trouvésdonne une bonne estimation du facteur de dilution.

189 / 204
6.3. METHODE POUR LIMITER LA QUANTITE DE O2 PRESENTE DANS LESSUSPENSIONS ET LES SOLUTIONS
La solution idéale est de préparer le maximum de solutions et suspensions en boîte àgants.
Toutes les solutions sont effectuées à partir d'eau milli-Q bouillie et refroidie ensuite sousargon ou azote (bullage par un fritté). Butler et al. (Butler et al., 1994) ont montré que fairebuller de l'azote pendant une heure dans une solution était la méthode la plus simple et la plusefficace pour supprimer le O2 présent en solution; la phase d'ébullition n'étant pas nécessaire.Cependant, l'ébullition permet également de se débarrasser des traces de carbonates puisquela dissolution des bicarbonates est moins forte à haute température qu'à basse température. Ilest possible de purifier le gaz dont on se sert pendant le refroidissement de l'eau, en le faisantpasser successivement dans trois bains différents (Figure 6.2)
H2SO4 10 % NaOH 10 %(ajout de pyrogallol
après 1 heure)
Solution à la forceionique del ’expérience
Figure 6.2 : Schéma des 3 bains, purifiant le gaz (argon ou N2) avant son utilisation. H2SO4permet d’éliminer les impuretés acides, NaOH les impuretés basiques (ex : carbonates) et lepyrogallol l'oxygène (méthode tirée de Liger et al., 1999).
Transférer cette eau immédiatement en boîte à gant permet d'éviter qu'elle se recharge enO2. La faire équilibrer avec l'atmosphère de la boîte à gant (en ouvrant la bouteille) doitpermettre de gagner encore en pureté.
Certaines solutions ou suspensions ne peuvent pas être préparées dans la boîte à gant,voir sont déjà préparées avec de l'eau non dégazée (ex : suspensions d'argile, ampoulestitrisol…). Avant de les utiliser, il convient de les faire dégazer une nuit par de l'azote purifié (onveillera à ce que le dernier bain soit à la force ionique de la solution pour éviter une évaporationtrop importante). Elles ont alors rentrées en boîte à gants et si possible mises à équilibrer avecson atmosphère (pendant cette phase, il peut y avoir évaporation et donc changement desconcentrations).

190 / 204

191 / 204
7. BIBLIOGRAPHIE GENERALE

192 / 204

193 / 204
Akcay, H. Aqueous speciation and pH effect on the sorption behavior of uranium bymontmorillonite, Journal of Radioanalytical and Nuclear Chemistry, 1998, 237, p. 133-137.
ANDRA Référentiel matériaux. ANDRA C.RP.AMAT.01.060, 2001.
Avena, M. J. Acid-base behavior of clay surfaces in aqueous media, Encyclopedia of surfaceand colloid science, 2002, p. 37-63.
Avena, M. J., Cabrol, R. and De Pauli, C. Study of some physicochemical properties of pillaredmontmorillonites: acid-base potentiometric titrations and electrophoretic measurements,Clays and Clay Minerals, 1990, 38, p. 356-362.
Avena, M. J. and De Pauli, C. Proton adsorption and electrokinetics of an argentineanmontmorillonite, Journal of Colloid and Interface Science, 1998, 202, p. 195-204.
Baeyens, B. and Bradbury, M. H. A quantitative mechanistic description of Ni, Zn and Casorption on Na-montmorillonite. Paul Scherrer Institut (PSI) ISSN 1019-0643, 1995.
Baeyens, B. and Bradbury, M. H. A mechanistic description of Ni and Zn sorption on Na-montmorillonite. Part I: Titration and sorption measurements, Journal of ContaminantHydrology, 1997, 27, p. 199-222.
Balzer, W. On the distribution of iron and manganese at the sediment / water interface:thermodynamic versus kinetic control, Geochimica et Cosmochimica Acta, 1982, 46, p.1153-1161.
Bardot, F., Villiéras, F., Michot, L. J., François, M., Gérard, G. and Cases, J. M. High resolutiongas adsorption study on illites permuted with various cations: assessment of surfaceenergetic properties, J. Dispersion Science and Technology, 1998, 19, p. 739-759.
Bérend, I. Les mécanismes d'hydratation de montmorillonites homoioniques pour des pressionsrelatives inférieures à 0,95. Thesis defended at INPL Nancy, 1991.
Bérend, I., Cases, J. M., François, M., Uriot, J.-P., Michot, L., Masion, A. and Thomas, F.Mechanism of adsorption and desorption of water vapor by homoionic montmorillonites:2. The Li+, Na+, K+, Rb+ and Cs+-exchanged forms, Clays and Clay Minerals, 1995, 43, p.324-336.
Berner, R. A., Ed. Principles of Chemical Sedimentology McGraw-Hill, 1971.
Besnus, Y. and Rouault, R. Une methode d'analyse des roches au spectrometre d'arc à lecturedirecte par un dispositif d'electrode rotative, Analusis, 1973, 2, p. 111-116.
Besson, G. and Drits, V. A. Refined relationship between chemical composition of dioctahedralfine-grained micaceous minerals and their infrared spectra within the OH stretchingregion. Part I: identification of the OH stretching bands, Clays and Clay Minerals, 1997a,45, p. 158-169.
Besson, G. and Drits, V. A. Refined relationship between chemical composition of dioctahedralfine-grained micaceous minerals and their infrared spectra within the OH stretchingregion. Part II: the main factors affecting OH vibrations and quantitative analysis, Claysand Clay Minerals, 1997b, 45, p. 170-183.

194 / 204Bickmore, B., Bosbach, D., Hochella, M. F., Charlet, L. and Rufe, E. In situ atomic force
microscopy study of hectorite and nontronite dissolution: implications for phyllosilicateedge surface structures and dissolution mechanisms, American Mineralogist, 2001, 86,p. 411-423.
Bickmore, B., Hochella, M. F., Bosbach, D. and Charlet, L. Methods for performing atomic forcemicroscopy imaging of clay minerals in aqueous solution, Clays and Clay Minerals, 1999,47, p. 573-581.
Bosbach, D., Charlet, L., Bickmore, B. and Hochella, M. F. The dissolution of hectorite: in-situ,real-time observations using atomic force microscopy, American Mineralogist, 2000, 85,p. 1209-1216.
Bosbach, D., Charlet, L., Brandt, F., Pieper, H. and Plaschke, M., The reactivity of clay mineralsurfaces: a microscopic perspective of nanoscale geochemical processes. In Clays innatural and engineered barriers for radioactive waste confinement, Reims, 2002.
Bott, M. Iron sulfides in Baldeggersee during the last 8000 years: formation processes, chemicalspeciation and mineralogical constrains from EXAFS spectroscopy. Thesis defended atETH Zürich, 2002.
Boult, K. A., Cowper, M. M., Heath, T. G., Sato, H., Shibutani, T. and Yui, M. Towards anunderstanding of the sorption of U(VI) and Se(VI) on sodium bentonite, Journal ofContaminant Hydrology, 1998, 35, p. 141-150.
Bradbury, M. H. and Baeyens, B. A mechanistic description of Ni and Zn sorption on Na-montmorillonite. Part II: modeling, Journal of Contaminant Hydrology, 1997, 27, p. 223-248.
Bradbury, M. H. and Baeyens, B. Modeling the sorption of Zn and Ni on Ca-montmorillonite,Geochimica et Cosmochimica Acta, 1998, 63, p. 325-336.
Bradbury, M. H. and Baeyens, B. Sorption of Eu on Na- and Ca-Montmorillonites: ExperimentalInvestigations and Modeling with Cation Exchange and Surface Complexation,Geochimica et Cosmochimica Acta, 2002, 66, p. 2325-2334.
Brown, I. D. On the geometry of O-H...O hydrogen bonds, Acta Crystallographica, 1976, A32,
Brown, I. D. The bond-valence method: an empirical approach to chemical structure andbonding. London, 1981.
Brown, I. D. Chemical and steric constrains in inorganic solids, Acta Crystallographica, 1992,48, p. 553-572.
Brown, I. D. and Altermatt, D. Bond-valence parameters obtained from a sytematic analysis ofthe inorganic crystal structure database, Acta Crystallographica, 1985, 41, p. 244-247.
Butler, I. B., Schoonen, M. A. A. and Rickard, D. T. Removal of dissolved oxygen from water: acomparison of four common techniques, Talanta, 1994, 41, p. 211-215.
Cama, J., Ganor, J., Ayora, C. and Lasagna, C. A. Smectite dissolution kinetics at 80°C and pH8.8, Geochimica et Cosmochimica Acta, 2000, 64, p. 2701-2717.
195 / 204Cases, J. M., Bérend, I., Besson, G., François, M., Uriot, J.-P., Thomas, F. and Poirier, J. E.
Mechanism of adsorption and desorption of water vapor by homoionic montmorillonite. 1.The sodium-exchanged form, Langmuir, 1992, 8, p. 2730-2739.
Cebula, D. J., Thomas, R. K. and White, J. W., The structure and dynamics of clay-watersystems studied by neutron scattering. In Proc. Int. Clay Conf., Oxford, 1978.
Chang, F. R. C., Skipper, N. T. and Sposito, G. Computer-Simulation of Interlayer Molecular-Structure in Sodium Montmorillonite Hydrates, Langmuir, 1995, 11, p. 2734-2741.
Chang, F. R. C., Skipper, N. T. and Sposito, G. Monte Carlo and molecular dynamicssimulations of electrical double-layer structure in potassium-montmorillonite hydrates,Langmuir, 1998, 14,
Charlet, L., Bosbach, D. and Peretyashko, T. Natural attenuation of TCE, As, Hg linked to theheterogeneous oxidation of Fe(II): an AFM study, Chemical Geology, 2002, 190, p. 303-319.
Charlet, L. and Manceau, A. Evidence fot the neoformation of clays upon sorption of Co(II) andNi(II) on silicates, Geochimica et Cosmochimica Acta, 1994, 58, p. 2577-2582.
Charlet, L., Schindler, P. W., Spadini, L., Furrer, G. and Zysset, M. Cation adsorption on oxidesand clays : The aluminum case, Aquatic Science, 1993, 55/4, p. 1015-1621.
Claret, F., Bauer, A., Schäfer, T., Griffault, L. and Lanson, B. Experimental investigation of theinteraction of clays with high pH solutions: A case study from the Callovo-Oxfordianformation, Meuse - Haute Marne underground laboratory (France), Clays and ClayMinerals, 2002, 50, p. 632-645.
Craciun, C. Influence of the Fe3+ for Al3+ octahedral substitutions on the IR spectra ofmontmorillonite minerals, Spectroscopy Letters, 1984, 17, p. 579-590.
Criaud, A. and Fouillac, C. Etude des eaux thermominérales carbogazeuses du Massif Centralfrançais. I. Potentiel d'oxydo-réduction et comportement du fer, Geochimica etCosmochimica Acta, 1986a, 50, p. 525-533.
Criaud, A. and Fouillac, C. Etude des eaux thermominérales carbogazeuses du Massif Centralfrançais. II. Comportement de quelques métaux en trace, de l'arsenic, de l'antimoine, etdu germanium, Geochimica et Cosmochimica Acta, 1986b, 50, p. 1573-1582.
Dähn, R., Scheidegger, A. M., Manceau, A., Curti, E., Baeyens, B., Bradbury, M. H. andChateigner, D. L. Th uptake on montmorillonite: A powder and polarized extended X-rayabsorption fine structure (EXAFS) study, Journal of Colloid and Interface Science, 2002a,249, p. 8-21.
Dähn, R., Scheidegger, A. M., Manceau, A., Schlegel, M., Baeyens, B., Bradbury, M. H. andChateigner, D. L. Structural evidence for the sorption of Ni(II) atoms on the edges ofmontmorillonite clay minerals: A polarized X-ray absorption fine structure study,Geochimica et Cosmochimica Acta, 2003, 37, p. 1-15.
Dähn, R., Scheidegger, A. M., Manceau, A., Schlegel, M., Baeyens, B., Bradbury, M. H. andMorales, M. Neoformation of Ni phyllosilicate upon Ni uptake on montmorillonite: akinetics study by powder and polarized extended X-ray absorption fine structurespectroscopy, Geochimica et Cosmochimica Acta, 2002b, 66, p. 2335-2347.

196 / 204Davison, W., Phillips, N. and Tabner, B. J. Soluble iron sulfide species in natural waters:
reappraisal of their stoichiometry and stability constants, Aquatic Sciences, 1999, 61, p.23-43.
de Carvalho, R. J. F. L. and Skipper, N. T. Atomistic computer simulation of the clay-fluidinterface, Journal of Chemical Physic, 2001, 114, p. 3727-3733.
Delgado, A., Gonzalez-Caballero, F. and Bruque, J. M. On the zeta potential and surfacecharge density of montmorillonite in aqueous electrolyte solutions, Journal of Colloid andInterface Science, 1986, 113, p. 203-211.
Delgado, A., Gonzalez-Caballero, F., Salcedo, J. and Cabrerizo, M. A. A study of theelectrophoretic properties of montmorillonite particles in aqueous electrolyte solutions,Materials Chemical Physics, 1988, 19, p. 327-340.
Drever, J. I. Magnesium-iron replacement in clay minerals in anoxic marine sediments, Science,1971, 172, p. 1334-1336.
Drits, V. A., Dainyak, L. G., Muller, F., Besson, G. and Manceau, A. Isomorphous cationdistribution in celadonites, glauconites and Fe-illites determined by infrared, Mössbauerand EXAFS spectroscopies, Clay Minerals, 1997, 32, p. 153-179.
Dzombak, D. A. and Morel, F. M. M. Surface complexation modeling-Hydrous ferric oxide. NewYork, 1990.
Emerson, S. Early diagenesis in anaerobic lake sediments: chemical equilibria in intersticialwaters, Geochimica et Cosmochimica Acta, 1976, 40, p. 925-934.
Emerson, S., Jahnke, R., Bender, M., Froelich, P., Klinkhammer, G., Bowser, C. and Setlock, G.Early diagenesis in sediments from the eastern equatorial pacific. I. pore water nutrientand carbonate results, Earth Planete Science Letters, 1980, 49, p. 57-80.
Farmer, V. C., Russel, J. D. and Ahlrichs, J. L., Characterization of clay minerals by infraredspectroscopy. In 9th International Congress of Soil Science, 1968.
Ferrage, E., Martin, F., Petit, S., Pejo-Soucaille, S., Micoud, P., Fourty, G., Ferret, J., Salvi, S.,De Parseval, P. and Fortuné, J. P. Evaluation of talc morphology using FTIR and H/Dsubstitution, Clay Minerals, 2003, 38,
Fletcher, P. and Sposito, G. The chemical modeling of clay/electrolyte interactions formontmorillonite., Clay Minerals, 1989, 24, p. 375-391.
Furrer, G. and Stumm, W. The coordination chemistry of weathering: I. Dissolution kinetics of �-Al2O3 and BeO, Geochimica et Cosmochimica Acta, 1986, 50, p. 1847-1860.
Gaboriaud, F. and Ehrhardt, J. J. Effects of different crystal faces on the surface charge ofcolloidal goethite (�-FeOOH) particles: an experimental and modeling study, Geochimicaet Cosmochimica Acta, 2003, 67, p. 967-983.
Gaucher, E. Interactions eaux-argiles. Etude experimentale. Thesis defended at Denis Diderot,1998.
Gehring, A. U., Fry, I. V., Lloyd, T. and Sposito, G. Residual manganese(II) entrapped in single-layer-hydrate montmorillonite interlayers, Clays and Clay Minerals, 1993, 41, p. 565-569.

197 / 204Gehring, A. U. and Sposito, G. Residual manganese(II) speciation in montmorillonite (reply to
comment), Clays and Clay Minerals, 1995, 43, p. 385-386.
Gilbert, M. and Laudelout, H. Exchange properties of hydrogen ions in clays, Soil Science,1965, 100, p. 157.
Gournis, D., Karakassides, M. A. and Petridis, D. Formation of hydroxyl radicals catalyzed byclay surfaces, Physics and Chemistry of Minerals, 2002, 29, p. 155-158.
Grauby, O., Petit, S., Enguehard, F., Martin, F. and Decarreau, A., XRD, EXAFS and FTIRoctahedral cation distribution in synthetic Ni-Co kerolites. In 7th Euroclay Conference,Dresden, 1991.
Grillet, Y., Rouquerol, F. and Rouquerol, J. Etude de l'adsorption physique des gaz par uneprocédure continue. I. Application à la détermination des surfaces spécifiquesd'adsorbants non poreux et mésoporeux, Journal of Chemical Physic, 1977, 74, p. 179-182.
Guggenheim, S., Chang, Y. and Koster van Groos, A. F. Muscovite dehydroxylation: high-temperature studies, American Mineralogist, 1987, 72, p. 537-550.
Heron, G., Crouzet, C., Bourg, A. C. M. and Christensen, T. H. Speciation of Fe(II) and Fe(III) incontaminated aquifer sediments using chemical extraction techniques, EnvironmentalScience and Technology, 1994, 28, p. 1698-1705.
Hiemstra, T., De Wit, J. C. M. and Van Riemsdijk, W. H. Multisite proton adsorption modelling atthe solid/solution interface of (hydr)oxides: a new approach. II. Application to variousimportant (hydr)oxides, Journal of Colloid and Interface Science, 1989a, 133, p. 105-117.
Hiemstra, T. and Van Riemsdijk, W. H. A surface structural approach to ion adsorption: thecharge distribution (CD) model, Journal of Colloid and Interface Science, 1996, 179, p.488-508.
Hiemstra, T., Van Riemsdijk, W. H. and Bolt, G. H. Multisite proton adsorption modelling at thesolid/solution interface of (hydr)oxides: a new approach. I. Model descritpion andevaluation of intrinsic reaction constants, Journal of Colloid and Interface Science,1989b, 133, p. 91-104.
Hiemstra, T., Venema, P. and Van Riemsdijk, W. H. Intrinsic proton affinity of reactive surfacegroups of metal (hydr)oxides: the bond valence principle, Journal of Colloid and InterfaceScience, 1996, 184, p. 680-692.
Hight, R. J., Higdon, W. L., Darley, H. C. H. and Schmidt, P. W. Small angle X-ray scatteringfrom montmorillonite clay suspensions. II, Journal of Chemical Physic, 1962, 37,
Hight, R. J., Higdon, W. L. and Schmidt, P. W. Small angle scattering study of sodiummontmorillonite clay suspensions, Journal of Chemical Physic, 1960, 33, p. 1656-1661.
Holland, H. D. The chemistry of the atmosphere and oceans. New York, 1978.
Hunter, R. J. and James, M. Charge reversal of kaolinite by hydrolyzable metal ions: anelectroacoustic study, Clays and Clay Minerals, 1992, 40, p. 644-649.

198 / 204Hyun, S. P., Cho, Y. H., Kim, S. J. and Hahn, P. S. Cu(II) sorption mechanism on
montmorillonite: an electron paramagnetic resonance study, Journal of Colloid andInterface Science, 2000, 222, p. 254-261.
Ishida, K. Identification of infrared OH librational bands of talc-willemseite solid solutions andAl(IV) free amphiboles through deuteration, Mineralogical Journal, 1990, 15, p. 93-104.
Jackson, M. L. Soil chemical analysis - advanced course 2nd edition. University of Wisconsin,Madison, Wisconsin, 1975.
Jensen, H. E. Potassium - calcium exchange equilibria on a montmorillonite and a kaolinite clay,Agrochimica, 1973, 17, p. 181-190.
Jolivet, J. P. De la solution à l'oxyde. Condensation des cations en solution acqueuse. Chimiede surface des oxydes. Paris, 1994.
Keren, R. and Shainberg, I. Water vapor isotherms and heat of immersion of Na/Ca-montmorillonite systems. I: homoionic clay, Clays and Clay Minerals, 1975, 23, p. 193-200.
Langer, K. and Lattard, D. Identification of a low OH valence vibration in zoisite, AmericanMineralogist, 1980, 50, p. 779-783.
Liger, E., Charlet, L. and Van Cappellen, P. Surface catalysis of uranium (VI) reduction byiron(II), Geochimica Cosmochimica Acta, 1999, 63, p. 2939-2955.
Madejova, J. and Komadel, P. Baseline studies of the clay minerals society source clays:infrared method, Clays and Clay Minerals, 2001, 49, p. 410-432.
Maes, A., Peigneur, P. and Cremers, A., Thermodynamics of transition metal ion exchange inmontmorillonite. In International Clay Conference 1975, 1976.
Manceau, A. and Gates, W. P. Surface structural model for ferrihydrite, Clays and ClayMinerals, 1997, 43, p. 448-460.
Manceau, A., Schlegel, M. L., Nagy, K. L. and Charlet, L. Evidence for the formation oftrioctahedral clay upon sorption of Co2+ on quartz, Journal of Colloid and InterfaceScience, 1999, 220, p. 181-197.
Martin, F., Petit, S., Grauby, O. and Lavie, M. P. Gradual H/D substitution in syntheticgermanium bearing talcs: a method for infrared band assignment, Clay Minerals, 1999,34, p. 365-374.
McBride, M. B. Environmental Chemistry of Soils. New York Oxford, 1994.
McBride, M. B. On the natural Mn(II) EPR signal of SWy-1 montmorillonite (comment), Claysand Clay Minerals, 1995, 43, p. 383-384.
McBride, M. B., Fraser, A. R. and McHardy, W. J. Cu2+ interaction with microcrystallinegibbsite. Evidence for oriented chemisorbed copper ions, Clays and Clay Minerals, 1984,32, p. 12-18.
McBride, M. B., Pinnavaia, T. J. and Mortland, M. M. Perturbation of structural Fe3+ in smectiteby exchange ions, Clays and Clay Minerals, 1975, 23, p. 103-107.

199 / 204Mermut, A. R. and Cano, A. F. Baseline studies of the clay minerals society source clays:
chemical analyses of major elements, Clays and Clay Minerals, 2001, 49, p. 381-386.
Mermut, A. R. and Lagaly, G. Baseline studies of the clay minerals society source clays: layer-charge determination and characteristics of those minerals containing 2:1 layers, Claysand Clay Minerals, 2001, 49, p. 393-397.
Metson, A. J. Methods of chemical analysis for soil survey samples, Neo-Zealand Soil BuroBulletin, 1956, 12,
Michot, L., François, M. and Cases, J. M. Surface heterogeneity studied by a quasi-equilibriumadsorption procedure, Langmuir, 1990, 6, p. 637-643.
Millero, F. J. Chemical Oceanography. Second Edition ed., Washington D.C., 2002.
Mooney, R. W., Keenan, A. G. and Wood, L. A. Adsorption of water vapor by montmorillonite. II.Effect of exchangeable ions and lattice swelling as measured by X-ray diffraction, Journalof American Chemical Society, 1952, 74, p. 1331-1374.
Naftz, D. L., Feltcorn, E. M., Fuller, C. C., Wilhelm, R. G., Davis, J. A., Morrison, S. J., Freethey,G. W., Piana, M. J., Rowland, R. C. and Blue, J. E. Field demonstration of permeablereactive barriers to remove dissolved uranium from groundwater, Fry Canyon, Utah.United State Environmental Protection Agency EPA 402-C-00-001, 2000.
Norrish, K. The swelling of montmorillonite, Faraday Discussion Society, 1954, 18, p. 120-134.
Ochs, M., Boonekamp, M., Wanner, H., Sato, H. and Mikazu, Y. A quantitative model for iondiffusion in compacted bentonite, Radiochimica Acta, 1998, 82, p. 437-443.
Ochs, M., Lothenbach, B., Wanner, H., Sato, H. and Mikazu, Y. An integrated sorption-diffusionmodel for the calculation of consistent distribution and diffusion coefficients in compactedbentonite, Journal of Contaminant Hydrology, 2001, 47, p. 283-296.
Pabalan, R. T., Turner, D. R. and Bertetti, F. P. Sorption modeling for HLW performanceassesment. NRC high-level radioactive waste research at CNWRA. Center for NuclearWaste Regulatory Analyses CNWRA 94-01S, 1994.
Parkhurst, D. L. and Appelo, C. A. J. Phreeqc2 user's manual and program, 1999,http://www.geo.vu.nl/users/posv/phreeqc.html.
Pauling, L. The principles determining the structure of complex ionic crystals, Journal ofAmerican Chemical Society, 1929,
Pitteloud, C., Powell, D. H., Gonzalez, M. A. and Cuello, G. J. Neutron diffraction studies of ioncoordination and interlayer water structure in smectite clays: lanthanide(III)-exchangedWyoming montmorillonite, Colloids and Surfaces A: Physicochemical EngineeringAspects, In press,
Postma, D. Pyrite and siderite formation in brackish and freshwater swamp sediments,American Journal of Science, 1982, 282, p. 1151-1183.
Powell, D. H., Fischer, H. E. and Skipper, N. T. The structure of interlayer water in Li-montmorillonite studied by neutron diffraction with isotopic substitution, Journal ofPhysical Chemistry B, 1998, 102, p. 10899-10905.

200 / 204Rodier, J. L'Analyse de l'eau, eaux naturelles, eaux résiduaires, eau de mer. 8ème édition ed.,
Paris, 1996.
Rouquerol, J., Rouquerol, F., Grillet, Y. and Ward, R. J. In Characterization of Porous solids.Hunger, K. K., Ed. 1988, Vol. 67-76.
Russel, J. D., Farmer, V. C. and Velde, B. Replacement of OH by OD in layer silicates andidentification of these groups in infrared spectra, Mineralogical Magazine, 1970, 37, p.292.
Samuel, J., Rouault, R. and Besnus, Y. Analyse multielementaire standardisee des materiauxgeologiques en spectrometrie d'emission par plasma à couplage inductif, Analusis, 1985,13, p. 312-317.
Sato, T., Watanabe, T. and Otsuka, R. Effects of layer charge, charge location, and energychange on expansion properties of dioctahedral smectites, Clays and Clay Minerals,1992, 40, p. 103-113.
Sauzéat, E., Guillaume, D., Neaman, A., Peiffert, C., Ruck, R., Dubessy, J., Cathelineau, M.,Villiéras, F. and Yvon, J. MX-80 : une argile de référence méthodologique pour l'ANDRA.ANDRA, Agence nationale pour la gestion des déchets radioactifs 2000.
Sauzéat, E., Guillaume, D., Villiéras, F., Dubessy, J., François, M., Pfeiffert, C., Pelletier, M.,Ruck, R., Barrès, O., Yvon, J. and Cathelineau, M. Caractérisation minéralogique,cristallochimique et texturale de l'argile MX-80. ANDRA C RP 0LEM 01-001, 2001.
Saylest, F. L. and Mangelsdorf, P. C. J. Cation-exchange characteristics of Amazon Riversuspended sediment and its reaction with seawater, Geochimica et Cosmochimica Acta,1979, 43, p. 767-779.
Schindler, P. W., Fürst, B., Dick, R. and Wolf, P. U. Ligand properties of surface silanol groups:I. Surface complex formation with Fe2+, Cu2+, Cd2+ and Pb2+, Journal of Colloid andInterface Science, 1976, 55, p. 469-475.
Schlegel, M. De l'adsorption du cobalt et du zinc sur l'hectorite et le quartz, à la nucléationhétérogène de phyllosilicates. Thesis defended at Université Grenoble-I, 2000.
Schlegel, M., Charlet, L. and Manceau, A. Sorption of metal ions on clay minerals. II.Mechanism of Co sorption on hectorite at high and low ionic strength and impact on thesorbent stability, Journal of Colloid and Interface Science, 1999, 220, p. 392-405.
Schlegel, M., Manceau, A., Charlet, L. and Hazemann, J. L. Adsorption mechanisms of Zn onhectorite as a function of time, pH, and ionic strength, American Journal of Science,2001a, 301, p. 798-830.
Schlegel, M. L., Manceau, A., Charlet, L., Chateigner, D. L. and Hazemann, J. L. Sorption ofmetal ions on clay minerals. III. Nucleation and epitaxial growth of Zn phyllosilicate on theedges of hectorite, Geochimica et Cosmochimica Acta, 2001b, 65, p. 4155-4470.
Schramm, L. L. and Kwak, J. C. T. Influence of exchangeable cation composition on the sizeand shape of montmorillonite particles in dilute suspension, Clays and Clay Minerals,1982, 30, p. 40-48.
Schultess, C. P. and Sparks, D. L. Backtitration tecnhique for proton isotherm modeling of oxidesurfaces, Soil Science Society of America, 1986, 50, p. 1406-1411.

201 / 204Schultess, C. P. and Sparks, D. L. A critical assessment of surface adsorption model, Soil
Science Society of America, 1988, 52, p. 92-97.
Schwarzenbach, R. P., Gschwend, P. M. and Imboden, D. M. Environmental organic chemistry.New York, 1993.
Shannon, R. D. Revised effective ionic radii and systematic studies of interatomic distances inhalides and chalcogenides, Acta Crystallographica, 1976, 32, p. 751-767.
Shirozu, H. and Ishida, K. Infrared study of some 7 Å and 14 Å layer silicates by deuteration,Mineralogical Journal, 1982, 11, p. 161-171.
Skipper, N. T., Chang, F. R. C. and Sposito, G. Monte Carlo simulation of interlayer molecularstructure in swelling clay minerals. 1. Methodology, Clays and Clay Minerals, 1995a, 43,p. 285-293.
Skipper, N. T., Sposito, G. and Chang, F. R. C. Monte Carlo simulation of interlayer molecularstructure in swelling caly minerals. 2. Monolayer hydrates., Clays and Clay Minerals,1995b, 43, p. 294-303.
Slonimskaya, M. V., Besson, G., Dainyak, L. G., Tchoubar, C. and Drits, V. A. Interpretation ofthe IR spectra of celadonites and glauconites int he region of OH stretching frequencies,Clay Minerals, 1986, 21, p. 377-388.
Sposito, G. The thermodynamics of soil solution. New York, 1981.
Sposito, G. Surface chemistry of soils. New York, 1984.
Sposito, G., Holtzclaw, K. M., Charlet, L., Jouany, C. and Page, A. L. Sodium-calcium andsodium-magnesium exchange on Wyoming bentonite in perchlorate and chloridebackground ionic media, Soil Science Society of America, 1983a, 47, p. 51-56.
Sposito, G., Holtzclaw, K. M., Johnston, C. T. and Le Vesque, C. S. Thermodynamics ofsodium-copper exchange on Wyoming bentonite at 298 K, Soil Science Society ofAmerica, 1981, 45, p. 1079-1084.
Sposito, G., Holtzclaw, K. M., Jouany, C. and Charlet, L. Cation selectivity in sodium-calcium,sodium-magnesium, and calcium-magnesium exchange on Wyoming bentonite at 298 K,Soil Science Society of America, 1983b, 47, p. 917-921.
Sposito, G., Skipper, N. T., Sutton, R., Park, S. and Soper, A. K. Surface geochemistry of theclay minerals, Proceedings of the National Academy of Sciences of the United States ofAmerica, 1999, 96, p. 3358-3364.
Stadler, M. and Schindler, P. W. Modeling of H+ and Cu2+ adsorption on calcium-montmorillonite, Clays and Clay Minerals, 1993, 41, p. 288-296.
Stubican, V. and Roy, R. A new approach to assignment of infrared absorption band in layer-structure silicates, Zeischrift für Kristallographie, 1961, 115, p. 200-214.
Stumm, W., Kummert, R. and Sigg, L. A ligand exchange model for the adsorption of inorganicand organic ligands at hydrous oxide interfaces, Croatica Chemica Acta, 1980, 53, p.291-312.

202 / 204Stumm, W. and Lee, G. F. Oxygenation of ferrous iron, Industrial and Engineering Chemistry
Research, 1961, 53, p. 143-146.
Stumm, W. and Morgan, J. J. Aquatic chemistry. 1996.
Stumm, W. and Wollast, R. Coordination Chemistry of Weathering: Kinetics of the Surface-Controlled Dissolution of Oxide Minerals, Reviews of Geophysics, 1990, 28, p. 53-90.
Tamura, K., Yamada, H. and Nakazawa, H. Stepwise hydratation of high-quality syntheticsmectite with various cations, Clays and Clay Minerals, 2000, 48, p. 400-404.
Teillet, J. and Varret, F. Unpublished program MOSFIT, MOSFIT.
Titiloye, J. O. and Skipper, N. T. Computer simulation of the structure and dynamics of methanein hydrated Na-smectites clays, Chemical Physical Letters, 2000, 329, p. 23-28.
Tournassat, C. and Charlet, L. Competitive specific sorption of Fe(II) on clay minerals in anoxicwaters, Environmental Science and Technology, submitted,
Tournassat, C., Charlet, L. and Greneche, J. M. Fe(II)-Na(I)-Ca(II) cation exchange onmontmorillonite in chloride medium; evidence for preferential clay adsorption of chloride –metal ion pairs in seawater., Aquatic Geochemistry, submitted-a,
Tournassat, C., Ferrage, E., Poinsignon, C. and Charlet, L. The titration of clay minerals. Part II.Insights from infrared spectroscopy, and models using Bradbury and Baeyens or MUSICapproach, Journal of Colloid and Interface Science, submitted-b,
Tournassat, C., Greneche, J. M., Tisserand, D. and Charlet, L. The titration of clay minerals.Part I. Discontinuous backtitration technique combined to CEC measurements, Journal ofColloid and Interface Science, submitted-c,
Tournassat, C., Neaman, A., Villiéras, F., Bosbach, D. and Charlet, L. Nanomorphology ofmontmorillonite particles: Estimation of the clay edge sorption site density by low-pressure gas adsorption and AFM observations, American Mineralogist, submitted-d,
Turner, D. R. A uniform approach to surface complexation modeling of radionuclide sorption.Center for Nuclear Waste Regulatory Analyses NRC-02-93-005, 1995.
Turner, D. R., Pabalan, R. T. and Bertetti, F. P. Neptunium(V) sorption on montmorillonite: anexperimental and surface complexation modeling study, Clays and Clay Minerals, 1998,46, p. 256-269.
Vanselow, A. P. Equilibria of the base-exchange reaction of bentonites, permutites, Soil colloidsand zeolites, Soil Science, 1932, 33, p. 95-113.
Vantelon, D., Pelletier, M., Michot, L., Barrès, O. and Thomas, F. Fe, Mg and Al distribution inthe octahedral sheet of montmorillonites. An infrared study in the OH-bending region,Clay Minerals, 2001, 36, p. 369-379.
Venema, P., Hiemstra, T., Weidler, P. G. and Van Riemsdijk, W. H. Intrinsic proton affinity ofreactive surface groups of metal (hydr)oxides: application to iron (hydr)oxides, Journal ofColloid and Interface Science, 1998, 198, p. 282-295.

203 / 204Villiéras, F., Cases, J. M., François, M., Michot, L. J. and Thomas, F. Textural properties and
surface energetic heterogeneity of solids from modeling of low pressure gas adsorptionisotherms, Langmuir, 1992, 8, p. 1789-1795.
Villiéras, F., Michot, L. J., Bardot, F., Cases, J. M., François, M. and Rudzinski, W. An improvedderivative isotherm summation method to study surface heterogeneity of clay minerals,Langmuir, 1997a, 13, p. 1104-1117.
Villiéras, F., Michot, L. J., Bardot, F., Chamerois, M., Eypert-Blaison, C., Gérard, G. and Cases,J. M. Surface heterogeneity of minerals, C. R. Geosciences, 2002, 334, p. 597-609.
Villiéras, F., Michot, L. J., Cases, J. M., Berend, I., Bardot, F., François, M., Gérard, G. andYvon, J., Eds. Static and dynamic studies of the energetic surface heterogeneity of clayminerals; Elsevier Sci. Pub. B. V.: Amsterdam, 1997b; Vol. 104.
Viollier, E., Inglett, P. W., Hunter, K., Roychoudhury, A. N. and Van Cappellen, P. The ferrozinemethod revisited : Fe(II)/Fe(III) determination in natural waters, Applied Geochemistry,2000, 15, p. 785-790.
Wanner, H., Albinson, Y., Karnland, O., Wieland, E., Wersin, P. and Charlet, L. The acid/basechemistry of montmorillonite, Radiochimica Acta, 1994, 66/67, p. 157-162.
White, G. N. and Zelazny, L. W. Analysis and implications of the edge structure of dioctahedralphyllosilicates, Clays and Clay Minerals, 1988, 36, p. 141-146.
Zachara, J. M. and Smith, S. C. Edge complexation reactions of cadmium on specimen andsoil-derived smectite, Soil Science Society of America, 1994, 58, p. 762-769.
Zachara, J. M., Smith, S. C., McKinley, J. P. and Resch, C. T. Cadmium sorption on specimenand soil smectites in sodium and calcium electrolytes, Soil Science Society of America,1993, 57, p. 1491-1501.

204 / 204
RESUME
Les interactions entre du Fe(II) en solution et unemontmorillonite sont étudiées dans des conditionsanoxiques et à température ambiante, sur une échelle detemps variant de l’heure à la semaine.
Le Fe2+ s’adsorbe sur les sites d’échangecationique de l’argile avec la même affinité que le Ca2+ ; enprésence de chlore, le Fe(II) forme des paires ioniques,FeCl+, qui s’adsorbent avec une affinité comparable àcelles de CaCl+ et MgCl+. Les simulations montrent qu’enfond anionique chloré concentré (comme l’eau de mer) lesions monovalents (Na+ et paires ioniques du type CaCl+ etMgCl+) sont majoritaires sur les sites d’échangecationique.
Le Fe2+ s’adsorbe sur les surfaces de bordure de lamontmorillonite avec une affinité très forte. Cetteadsorption spécifique peut être modélisée convenablementavec des modèles simples de complexation de surface. LeFe2+ s’adsorbe sur l’argile avec une affinité d’environ 1000fois plus forte que celle du Zn2+. Des expériences coupléesd’adsorption, de titrage, de dissolution et de spectroscopieMössbauer montrent que l’adsorption spécifique du Fe2+
est due à plusieurs réactions distinctes :
� une adsorption compétitive avec remplacement decations présents sur les surfaces de bordure ou dans lastructure (ex : Mg2+, Zn2+) ;
� une adsorption coopérative avec H4SiO4, cemécanisme étant compatible avec la précipitation desurface d’une phase Fe – Si ;
� un mécanisme d’adsorption suivi d’une oxydation duFe2+ en Fe3+, cette réaction libérant deux H+ en solutionpar Fe2+ adsorbé.
Ces phénomènes ne peuvent pas tous être pris encompte dans les modèles classiques de complexation desurface. Une approche nouvelle pour les argiles est doncdéveloppée pour modéliser les interactions solutés –argiles, basée sur une approche morphologique etstructurale de l’argile. Les surfaces de la montmorillonitesont caractérisées par deux méthodes indépendantes, lamicroscopie à force atomique (AFM) et l’adsorption degaz à très basse pression, qui donnent le même résultatpour les surfaces de bordure : 8,5 m2 g-1. L’étude théoriquede la structure de l’interface argiles – solutés montrequ’elle ne porte pas moins de 27 sites réactionnelsdifférents pour les interactions argile – H+. Le modèleMUSIC est utilisé pour prédire leur réactivité. L’excellentaccord entre les données expérimentales de titragepotentiométrique et leur simulation nous encourage àpoursuivre dans cette voie et à compléter le modèle pourprédire les interactions surface – cations métalliques.
ABSTRACT
Solute Fe(II) – montmorillonite interactions arestudied in anoxic conditions and at room temperature forreaction times from hour to week.
Fe2+ is shown to be sorbed on cation exchangesite with the same affinity than Ca2+. In chloride anionicmedium, Fe(II) form ionic pairs – FeCl+ - which is sorbedwith almost the same affinity than CaCl+ and MgCl+ are.The exchange thermodynamics constants derived from thisstudy are used to simulate the change in the exchangercomposition as clay river particles enter seawater. In highconcentration chloride medium, as seawater, monovalentions (Na+ and CaCl+, MgCl+ ionic pairs) are shown to bethe major species of the exchanger.
Fe2+ is sorbed specifically on the montmorilloniteedge surfaces with a very high affinity. Simplecomplexation model are able to model the sorption dataand show that the Fe2+ affinity for clay edge surfaces is~1000 times higher than the Zn2+ one. Mössbauerexperiments combined to sorption, titration and dissolutionexperiments show that the Fe2+ sorption is due to severaldifferent reactions:
� effective competitive sorption with replacement ofpreviously sorbed or structural cations (Zn2+, Mg2+);
� cooperative sorption together with H4SiO4, inagreement with a possible surface precipitation of a Fe –Si phase;
� a sorption mechanism followed by an oxidationreaction, with a release of two H+ in solution per Fe(II)sorbed, and a product (Fe(III)) fitting better octahedralsurface “sites”.
All these phenomena can not be taken intoaccount in a classical surface complexation model. Hence,an innovative model is developed to model clay – soluteinteractions, based on a morphological and structuralapproach. Montmorillonite edge surface area wasdetermined using two independent methods, AFMmeasurement and low-pressure gas adsorption, that givethe same value for this area, i.e. 8.5 m2 g-1. The clay –solute interface was found to be constituted by a mix of, atleast, 27 reactive sites. Their reactivity towards H+ wasmodeled with the MUSIC model. An excellent agreementis found between potentiometric measurement data andpredicted curves. This model should be further developedto predict the clay surfaces – metallic cations interactions.