Interaction specificity of clustered protocadherins ...
6
Interaction specificity of clustered protocadherins inferred from sequence covariation and structural analysis John M. Nicoludis a,b,1 , Anna G. Green c,1 , Sanket Walujkar d , Elizabeth J. May a , Marcos Sotomayor d , Debora S. Marks c,2 , and Rachelle Gaudet a,2 a Department of Molecular and Cellular Biology, Harvard University, Cambridge, MA 02138; b Department of Chemistry and Chemical Biology, Harvard University, Cambridge, MA 02138; c Department of Systems Biology, Harvard Medical School, Boston, MA 02115; and d Department of Chemistry and Biochemistry, The Ohio State University, Columbus, OH 43210 Edited by William I. Weis, Stanford University School of Medicine, Stanford, CA, and approved July 30, 2019 (received for review December 17, 2018) Clustered protocadherins, a large family of paralogous proteins that play important roles in neuronal development, provide an important case study of interaction specificity in a large eukaryotic protein family. A mammalian genome has more than 50 clustered protocadherin isoforms, which have remarkable homophilic spec- ificity for interactions between cellular surfaces. A large antipar- allel dimer interface formed by the first 4 extracellular cadherin (EC) domains controls this interaction. To understand how specificity is achieved between the numerous paralogs, we used a combination of structural and computational approaches. Molecular dynamics simulations revealed that individual EC interactions are weak and undergo binding and unbinding events, but together they form a stable complex through polyvalency. Strongly evolutionarily coupled residue pairs interacted more frequently in our simulations, suggest- ing that sequence coevolution can inform the frequency of interaction and biochemical nature of a residue interaction. With these simulations and sequence coevolution, we generated a statistical model of interaction energy for the clustered protocadherin family that measures the contributions of all amino acid pairs at the interface. Our interaction energy model assesses specificity for all possible pairs of isoforms, recapitulating known pairings and predicting the effects of experimental changes in isoform specificity that are consistent with literature results. Our results show that sequence coevolution can be used to understand specificity determinants in a protein family and prioritize interface amino acid substitutions to reprogram specific protein–protein interactions. clustered protocadherins | protein–protein interactions | sequence covariation | molecular dynamics | polyvalency C lustered protocadherins (Pcdhs) are a large protein family that play roles in vertebrate nervous system development, including neuronal survival, axon targeting, neuronal arborization, and dendritic self-avoidance (1–9). Dendritic self-avoidance, wherein dendritic arbors are pruned when 2 dendrites from the same neuron come in contact, is mediated by formation of a clustered Pcdh assembly between 2 dendrites (5, 10). This assembly con- sists of specific homodimers formed in trans across 2 cellular membranes, engaging the first 4 extracellular cadherin (EC) repeat domains in an antiparallel arrangement (Fig. 1A). In addition to these trans interfaces, ECs 5 and 6 interact between protocadherins on the same neuron (cis), resulting in a zipper-like lattice (11). The trans homodimers are highly specific such that no cross interactions are observed in even the most similar isoforms (12–14). The trans EC1-4 interaction is also found in nonclustered Pcdhs (15–17), indicating the importance of this adhesive interface in cognitive function. Given the many isoforms per vertebrate genome, in- cluding 53 in the human genome, we sought to understand how specificity is achieved in this large interface. Structures of Pcdh trans dimers (11, 15, 18–20) have revealed idiosyncratic characteristics of individual dimer structures, like the lack of EC1/EC4 interaction in the PcdhγA1 and PcdhγA8 structures (20) and the small EC2/EC3 interface in PcdhγB3 (15). Based on the variety of interfaces found in the existing crystal structures (15, 18–20), it is possible that every isoform achieves specificity by adopting a different static interface conformation, or that isoforms sample a distribution of conformations, with different combinations of interface residues determining preference for self-interaction. Understanding Pcdh interaction specificity re- quires disentangling these scenarios by considering both interface conformations and residue–residue interaction preferences. Prior computational work has sought to understand the evo- lution of specificity of the Pcdh trans interaction, finding positive selection on the trans interface (21), and suggesting that the EC2/ EC3 interface plays a greater role in specificity between closely related protocadherins (10, 15). However, this computational framework could not analyze residue dependencies at the in- terface, or be used to predict specificities for new mutations or combinations of protocadherins. Recent computational methods based on residue coevolution have proven useful for understanding Significance The more than 50 clustered protocadherin isoforms impart neu- ronal identity to prevent self-synapses. This is accomplished via highly specific homodimers of the first 4 extracellular cadherin (EC) domains between neuronal processes. Using molecular dynamics, we found that individual EC domain interactions are weak and dynamic, suggesting the complex is held together by polyvalency. Using evolutionary couplings—a computational technique that identifies interacting amino acids in a protein— we found that interacting residue pairs with strong coupling scores were in contact more frequently and across more simula- tions than weak pairs. We built a statistical model of specificity that predicts the relative likelihood that any 2 isoforms interact and identify residues contributing strongly to specificity to reprogram protein–protein interactions. Author contributions: J.M.N., A.G.G., M.S., D.S.M., and R.G. designed research; J.M.N., A.G.G., and S.W. performed research; J.M.N., A.G.G., and E.J.M. contributed new re- agents/analytic tools; J.M.N., A.G.G., and S.W. analyzed data; and J.M.N., A.G.G., S.W., M.S., D.S.M., and R.G. wrote the paper. The authors declare no conflict of interest. This article is a PNAS Direct Submission. Published under the PNAS license. Data deposition: The structures have been deposited in the Protein Data Bank, www. wwpdb.org (PcdhγB3 EC1-4 no HEPES [PDB ID 6MEQ] and PcdhγB3 EC1-4 less HEPES [PDB ID 6MER]), and the corresponding raw diffraction images have been deposited to the SBGridDB (datasets 602 and 603, respectively). 1 J.M.N. and A.G.G. contributed equally to this work. 2 To whom correspondence may be addressed. Email: [email protected] or [email protected]. This article contains supporting information online at www.pnas.org/lookup/suppl/doi:10. 1073/pnas.1821063116/-/DCSupplemental. www.pnas.org/cgi/doi/10.1073/pnas.1821063116 PNAS Latest Articles | 1 of 6 BIOPHYSICS AND COMPUTATIONAL BIOLOGY
Transcript of Interaction specificity of clustered protocadherins ...
Interaction specificity of clustered protocadherinsinferred from sequence covariation andstructural analysisJohn M. Nicoludisa,b,1, Anna G. Greenc,1, Sanket Walujkard, Elizabeth J. Maya, Marcos Sotomayord, Debora S. Marksc,2,and Rachelle Gaudeta,2
aDepartment of Molecular and Cellular Biology, Harvard University, Cambridge, MA 02138; bDepartment of Chemistry and Chemical Biology, HarvardUniversity, Cambridge, MA 02138; cDepartment of Systems Biology, Harvard Medical School, Boston, MA 02115; and dDepartment of Chemistry andBiochemistry, The Ohio State University, Columbus, OH 43210
Edited by William I. Weis, Stanford University School of Medicine, Stanford, CA, and approved July 30, 2019 (received for review December 17, 2018)
Clustered protocadherins, a large family of paralogous proteinsthat play important roles in neuronal development, provide animportant case study of interaction specificity in a large eukaryoticprotein family. A mammalian genome has more than 50 clusteredprotocadherin isoforms, which have remarkable homophilic spec-ificity for interactions between cellular surfaces. A large antipar-allel dimer interface formed by the first 4 extracellular cadherin(EC) domains controls this interaction. To understand how specificityis achieved between the numerous paralogs, we used a combinationof structural and computational approaches. Molecular dynamicssimulations revealed that individual EC interactions are weak andundergo binding and unbinding events, but together they form astable complex through polyvalency. Strongly evolutionarily coupledresidue pairs interacted more frequently in our simulations, suggest-ing that sequence coevolution can inform the frequency of interactionand biochemical nature of a residue interaction. With these simulationsand sequence coevolution, we generated a statistical model ofinteraction energy for the clustered protocadherin family thatmeasures the contributions of all amino acid pairs at the interface.Our interaction energy model assesses specificity for all possiblepairs of isoforms, recapitulating known pairings and predictingthe effects of experimental changes in isoform specificity that areconsistent with literature results. Our results show that sequencecoevolution can be used to understand specificity determinants ina protein family and prioritize interface amino acid substitutionsto reprogram specific protein–protein interactions.
clustered protocadherins | protein–protein interactions |sequence covariation | molecular dynamics | polyvalency
Clustered protocadherins (Pcdhs) are a large protein familythat play roles in vertebrate nervous system development,
including neuronal survival, axon targeting, neuronal arborization,and dendritic self-avoidance (1–9). Dendritic self-avoidance, whereindendritic arbors are pruned when 2 dendrites from the sameneuron come in contact, is mediated by formation of a clusteredPcdh assembly between 2 dendrites (5, 10). This assembly con-sists of specific homodimers formed in trans across 2 cellularmembranes, engaging the first 4 extracellular cadherin (EC) repeatdomains in an antiparallel arrangement (Fig. 1A). In addition tothese trans interfaces, ECs 5 and 6 interact between protocadherinson the same neuron (cis), resulting in a zipper-like lattice (11). Thetrans homodimers are highly specific such that no cross interactionsare observed in even the most similar isoforms (12–14). The transEC1-4 interaction is also found in nonclustered Pcdhs (15–17),indicating the importance of this adhesive interface in cognitivefunction. Given the many isoforms per vertebrate genome, in-cluding 53 in the human genome, we sought to understand howspecificity is achieved in this large interface.Structures of Pcdh trans dimers (11, 15, 18–20) have revealed
idiosyncratic characteristics of individual dimer structures, likethe lack of EC1/EC4 interaction in the PcdhγA1 and PcdhγA8
structures (20) and the small EC2/EC3 interface in PcdhγB3(15). Based on the variety of interfaces found in the existing crystalstructures (15, 18–20), it is possible that every isoform achievesspecificity by adopting a different static interface conformation, orthat isoforms sample a distribution of conformations, with differentcombinations of interface residues determining preference forself-interaction. Understanding Pcdh interaction specificity re-quires disentangling these scenarios by considering both interfaceconformations and residue–residue interaction preferences.Prior computational work has sought to understand the evo-
lution of specificity of the Pcdh trans interaction, finding positiveselection on the trans interface (21), and suggesting that the EC2/EC3 interface plays a greater role in specificity between closelyrelated protocadherins (10, 15). However, this computationalframework could not analyze residue dependencies at the in-terface, or be used to predict specificities for new mutations orcombinations of protocadherins. Recent computational methodsbased on residue coevolution have proven useful for understanding
Significance
The more than 50 clustered protocadherin isoforms impart neu-ronal identity to prevent self-synapses. This is accomplished viahighly specific homodimers of the first 4 extracellular cadherin(EC) domains between neuronal processes. Using moleculardynamics, we found that individual EC domain interactions areweak and dynamic, suggesting the complex is held together bypolyvalency. Using evolutionary couplings—a computationaltechnique that identifies interacting amino acids in a protein—we found that interacting residue pairs with strong couplingscores were in contact more frequently and across more simula-tions than weak pairs. We built a statistical model of specificitythat predicts the relative likelihood that any 2 isoforms interactand identify residues contributing strongly to specificity toreprogram protein–protein interactions.
Author contributions: J.M.N., A.G.G., M.S., D.S.M., and R.G. designed research; J.M.N.,A.G.G., and S.W. performed research; J.M.N., A.G.G., and E.J.M. contributed new re-agents/analytic tools; J.M.N., A.G.G., and S.W. analyzed data; and J.M.N., A.G.G., S.W.,M.S., D.S.M., and R.G. wrote the paper.
The authors declare no conflict of interest.
This article is a PNAS Direct Submission.
Published under the PNAS license.
Data deposition: The structures have been deposited in the Protein Data Bank, www.wwpdb.org (PcdhγB3 EC1-4 no HEPES [PDB ID 6MEQ] and PcdhγB3 EC1-4 less HEPES [PDBID 6MER]), and the corresponding raw diffraction images have been deposited to theSBGridDB (datasets 602 and 603, respectively).1J.M.N. and A.G.G. contributed equally to this work.2To whom correspondence may be addressed. Email: [email protected] [email protected].
This article contains supporting information online at www.pnas.org/lookup/suppl/doi:10.1073/pnas.1821063116/-/DCSupplemental.
www.pnas.org/cgi/doi/10.1073/pnas.1821063116 PNAS Latest Articles | 1 of 6
BIOPH
YSICSAND
COMPU
TATIONALBIOLO
GY

the structure and function of protein complexes (22, 23). Thesemethods use undirected graphical models of protein sequences tofind statistical dependencies between pairs of residues (24–26),successfully predicting correct protein–protein interaction pairingsfor families with many paralogs (27, 28), informing specificityreprogramming experiments (29, 30) and predicting the effect ofmutations on protein function (31). Therefore, these generativemodels of residue dependencies may allow for characterization ofresidues important to specificity in the clustered Pcdh family, andprediction of interaction probability of all possible isoform pairs.To better understand the structural and dynamical determi-
nants of Pcdh interaction specificity, we use molecular dynamics(MD) simulations and crystal structures to show that isoformsadopt a range of conformations and to identify interacting residuepairs. We build a statistical model using evolutionary couplings(24, 25) to analyze specificity of all possible trans isoform inter-actions and infer which domains are important for interaction andspecificity. This work provides insight into the molecular origins ofspecificity within the clustered Pcdh family and demonstrates thatmodels based on sequence coevolution and MD simulations can beused to guide reprogramming of protein–protein interaction specificity.
ResultsStructures and MD Show That Pcdh trans Interfaces Sample aDistribution of Conformations. The trans interface of clusteredPcdhs is specific for self-interaction (12, 13) (Fig. 1A). ClusteredPcdh paralogs share only 40% residue identity at their interfaces(Fig. 1C). Crystal structures of many Pcdh isoform dimers (15,18–20) revealed idiosyncratic features of individual isoforms,raising the possibility that different isoforms adopt differentconformations in vivo, resulting in molecular specificity. Forexample, PcdhγA1 (in 1 of 2 dimers) and PcdhγA8 (20) lackEC1/EC4 contacts, and PcdhγB3 EC2-3 has a surprisingly smallinterface (15). Pairs of different isoform static structures share amean of 32% of their interface residue contacts, with only 14contact pairs shared between all 4 analyzed isoforms (Fig. 1D). Wethus used MD simulations to test whether distinct features of in-dividual isoforms result from static conformational differences, orfrom a dynamic interface crystallized in different conformations.We performed 120-ns all-atom MD equilibrium simulations of
4 different EC1-4 homodimers from different Pcdh subfamiliesto distinguish the above hypotheses: PcdhγB3, PcdhγB7, Pcdhβ6,and Pcdhα7 (SI Appendix, Table S1). Overall, the complexes didnot dissociate over the course of simulation (SI Appendix, Fig.S1A and Fig. 1B). While root-mean-squared deviation (RMSD)is not an appropriate metric to determine convergence for thefull Pcdh complex due to its large size and the flexibility of thehinge regions between EC repeats (32), overall RMSD remainedstable and below ∼8 Å for all structures. Moreover, the RMSDof individual ECs ranged from 2 to 3 Å, showing local equilib-rium (SI Appendix, Fig. S2). Also, the overall buried surface area(BSA) of each isoform was stable: The average BSA was 4,400 ±400 Å2 for PcdhγB3, 4,500± 300 Å2 for PcdhγB7, 4,200± 300 Å2 forPcdhβ6, and 3,500 ± 200 Å2 for Pcdhα7.At an individual EC interaction level, fluctuations in BSA
suggest these interactions are weak. Between individual EC domaindimers, which average 700 to 1,300 Å2 in BSA, fluctuations inBSA can be more than 400 Å2 over the course of a few nanosec-onds (Fig. 1B and SI Appendix, Table S2). For example, 1 EC1/EC4dimer of Pcdhα7 fluctuates in BSA from 1,000 Å2 at the start of thesimulation to ∼200 Å2 at 6 ns then to 1,200 Å2 around 35 ns (Fig.1B). In another example, our previously published PcdhγB3 struc-ture has a particularly small BSA for the EC2/EC3 interface (15).In our simulations, each EC2/EC3 interface increases in BSA from∼600 to ∼1,200 Å2 in the first 6 ns. The presence of HEPES at thisinterface did not cause the small interface, as structures with less orno HEPES were identical (overall RMSD over 3,210 atoms: 0.890and 0.785 Å, respectively) (SI Appendix, Fig. S3), suggesting this
structure is a conformation sampled by PcdhγB3 in solution. Thelarger BSA of the equilibrated PcdhγB3 structure is similar to thatof other simulated clustered Pcdhs (SI Appendix, Fig. S1B). In fact,this was generally true of all simulations: the proportion of sharedinterface sites across the simulations is higher than that across thecrystal structures alone (Fig. 1D), indicating that simulations candefine interface residues representative of a protein family.Although the MD simulations are not necessarily equilibrated,
the fluctuations suggest that if these individual EC interactionswere found in isolation they would be low affinity, consistent withthe observation that EC1-3 constructs do not dimerize in solution(14, 18). These fluctuations in BSA agree with other simulationsthat find sharp decreases in BSA as prerequisites to protein com-plex dissociation (33). Overall, our simulations indicate that eachisoform can sample a range of interface conformations, and that theavailable crystal structures represent only a snapshot of these con-formational possibilities. Furthermore, simulations can improveconsistency when defining interface residues in a protein family.
Highly Coevolving Residue Pairs Are in Frequent Contact in Simulations.Computational methods based on residue coevolution havebeen useful in understanding the structure of Pcdhs, predictingthe EC1/EC4 interaction and that the trans dimer architecture
0
400
800
1200
1600
Bur
ied
surf
ace
area
(Å
2 )
0 20 40 60 80Time (ns)
EC1 EC2
EC3EC4
100
EC5EC6EC5 EC6
cell 1 cell 2
EC3 EC4
EC2 EC1
% Sequence Identity
%Contacts shared in crystal
0
100
0
100
%Contacts sharedin simulation
0
400
800
1200
1600
Bur
ied
surf
ace
area
(Å
2 )
0 20 40 60 80Time (ns)
100
0
400
800
1200
1600
Bur
ied
surf
ace
area
(Å
2 )
0 20 40 60 80Time (ns)
1000
400
800
1200
1600
Bur
ied
surf
ace
area
(Å
2 )
0 20 40 60 80Time (ns)
100
*
*
* *
**
*
*
*
* * * * *
**
*
*
A
B
C D
Fig. 1. Clustered Pcdhs have diverse and dynamic interfaces. (A) The clus-tered Pcdh dimer is an antiparallel complex where EC1 of the first protomerinteracts with EC4 of the other protomer (orange and yellow) and EC2 in-teracts with EC3 (blue and green). Each simulation thus provides 2 examplesof each type of interaction. (B) The BSA of the EC1/EC4 and EC2/EC3 inter-actions varies throughout the simulations for each simulated isoform(PcdhγB3 EC1-4, PcdhγB7 EC1-4, Pcdhβ6 EC1-4, and Pcdhα7 EC1-5). Instances ofrapid interface BSA changes (>400 Å2 in under 5 ns) are indicated with anasterisk in the corresponding color. (C) Percent identity of EC1-4 of the 4clustered Pcdhs studied here. (D) Percentage of interface residue contactsshared between structures (Pcdhα7, 5dzv; Pcdhβ6, 5dzx; PcdhγB3, 5k8r;PcdhγB7, 5szp) and between structures and MD simulations. Each structureshares a mean of 32% of its contacts with other structures, and a mean of47% of its contacts with other isoforms in simulation.
2 of 6 | www.pnas.org/cgi/doi/10.1073/pnas.1821063116 Nicoludis et al.
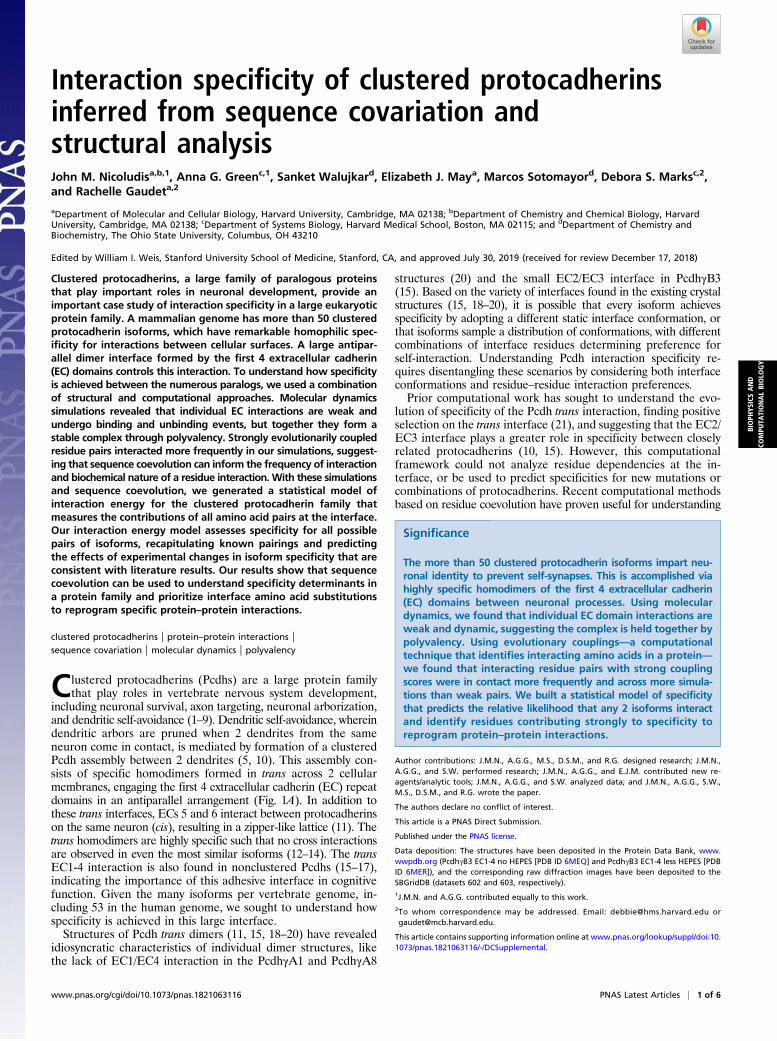
exists in nonclustered Pcdhs, both findings later confirmed ex-perimentally (15, 16, 18, 34). Coevolving residue pairs identifyinterprotein contacts (22, 23) but can correspond to positions onlyin contact in certain conformations (35–37). Given the dynamicnature of the Pcdh interface and the above observation that crystalstructures represent only a snapshot of possible conformations, weanalyzed how often highly coevolving interface residues in thePcdhs (15, 18) are in contact across simulations and over time.In our sequence coevolution analysis, the set of top 200
coevolving pairs includes mostly intramolecular contacts and 15intermolecular pairs (SI Appendix, Fig. S4). We calculated theresidue–residue distance of these 15 coevolving intermolecularpairs (Fig. 2A) over the course of the MD simulations. Of note,each simulation provides 2 (semi)independent observations foreach residue pair due to the 2-fold symmetry of the dimer. Ingeneral, pairs with higher coevolution scores are more frequentlyin contact across more simulations than weaker pairs (Fig. 2B),consistent with the observation that lower-scoring pairs are lesspredictive of physically interacting residues (22, 23).A closer examination of the top 15 intermolecular pairs reveals
diverse trajectories during simulations (Fig. 2C). For the mosthighly coevolving pairs, the residues are in close contact most ofthe time in most simulations. For example, the 84 to 338 and 123to 300 pairs (based on PcdhγΒ3 numbering in SI Appendix, Fig.S5) remain at ∼4 Å throughout all but 1 simulation (SI Appendix,Fig. S6). For some lower-scoring pairs, the residues are in closeproximity in some simulations but further in others, e.g., the 159 to302 pair residue–residue distances fluctuate between 6 and 18 Å inmost simulations but stay consistently close in the Pcdhα7 interface.Other lower scoring pairs fluctuate widely in all simulations andrarely if ever come into contact, such as the 39 to 338 pair.
Model Parameters Reveal Biochemical Interactions Underlying InterfaceSpecificity. Coevolving pairs are calculated using an undirectedgraphical model, which has parameters for single-site biases andpairwise residue preferences for all sites (24–26). The pairwiseresidue preferences can capture biochemical relationships be-tween amino acids (38). We asked whether the pairwise residuepreferences, termed Jij matrices, can shed light on the bio-chemical nature of interactions in the interface and inform whichresidues stay in contact during simulations.We observe a weak correlation between the pairwise residue
preference (Jij value) of a particular residue pair in a particularisoform, and the fraction of the simulation that this pair spendsin contact (Pearson’s r = 0.30, P < 0.05, n = 56; Fig. 3B) The top-scoring pairs, 84–338, 77–371, and 41–342, are a hydrophobicinteraction, a charged-aromatic interaction, and a salt bridge,respectively (Fig. 3A). These interactions are conserved in theirbiochemical nature even though the particular residues haveundergone substitution. Further down the list of top-scoring in-termolecular coevolving pairs, the biochemical nature of theinteraction becomes less apparent. For instance, the 124 to 302pair appears to be an interaction between the hydrophobic po-sition 124 and the charged or polar position 302. These could bedue to noise in parameter inference or could indicate positionsthat are rapidly diversifying and inhabiting repulsive states toachieve specificity. Consistent with this latter hypothesis, theselower-scoring pairs are found predominantly on EC2/EC3, whichhas been identified as a region of rapid diversifying selection (21).Extreme Jij value residue pairs for EC1/EC4 are concentrated inbiochemically similar regions (e.g., 84 to 338 and 77 to 371), whilesignificant residue pair Jij values for EC2/EC3 pairs are broadlydistributed in biochemically diverse pairs (SI Appendix, Fig. S7).The dynamics and structural heterogeneity of residue pair
interactions in EC2/EC3 may explain why coevolving pairs onthis interface have lower scores. Four of the top 15 coevolvingpairs cluster in the β4–β5 loop of EC2, which interacts with EC3.During simulations of the PcdhγB3 EC1-4 interface, conformational
changes in this loop leads to an increased interface BSA duringthe first 6 ns of simulation (SI Appendix, Fig. S1B), including theformation of hydrogen bonds between Y161 and K302, and N155and T286, and a van derWaals interaction between L156 andM216(numbering based on SI Appendix, Fig. S5 and Fig. 4A). The cor-responding interresidue distances vary in a coordinated fashion asthe loop fluctuates between the disengaged state seen in thestructure and an engaged state where the loop interacts directlywith EC3 (SI Appendix, Fig. S8). The heterogeneity of the EC2 β4–β5 loop is echoed in its diverse conformations in other clusteredPcdh structures (SI Appendix, Fig. S9). Pcdhα7 and PcdhγB7(unlike Pcdhβ6) also use the EC2 β4–β5 loop to interact withEC3 but use a distinct set of amino acid interactions (Fig. 4B).These interactions are biochemically diverse, including hydrogenbonds and electrostatic and van der Waals interactions (Fig. 4C).For all 3 isoforms, the interactions are dynamic and go throughbinding and unbinding events (SI Appendix, Fig. S8). Isoformdifferences in how the EC2 β4–β5 loop interacts with EC3 mayexplain the biochemical diversity of the coevolving residue pairsat this interface and the relative low strength of these couplings.
SEI Describes Pcdh Specificity Distributions. We used evolutionarycouplings and simulation data to build a model of clustered Pcdhinteraction specificity (Methods and SI Appendix). We assess thepropensity for any 2 Pcdhs to interact by summing the pairwise
A
2 5 9 20 33 38 76 81 85 92 96 101
116
131
160
84-3
38
77-3
71
41-3
42
123-
300
39-3
20
159-
302
159-
286
124-
302
125-
290
39-3
38
155-
302
41-3
40
162-
302
104-
253
205-
297
B
C
0
5
10
15
20
)Å(
ecnatsideudiser-eudise
R
Coupling score rank order
EC1
EC4
EC2
EC3
EC1/EC4EC2/EC3
Residue position pair 0.0 1.00.5Fraction of simulation <5Å
Fig. 2. Evolutionary coupling scores of intermolecular pairs correlate withresidue–residue interactions in simulations. (A) Clustered Pcdh half-dimer ofEC1-2 and EC3-4 showing coevolving residue pairs across the EC1/EC4 (pink)and EC2/EC3 (green) interface. (B) Box plots of residue–residue distances fortop 15 intermolecular pairs for all 4 simulations. Boxes are colored based ontheir location on the EC1/EC4 (pink) or EC2/EC3 (green) interface. (C) Heat-map of the fraction of time the top 15 intermolecular coevolving pairs arewithin 5 Å for the 4 simulations.
Nicoludis et al. PNAS Latest Articles | 3 of 6
BIOPH
YSICSAND
COMPU
TATIONALBIOLO
GY

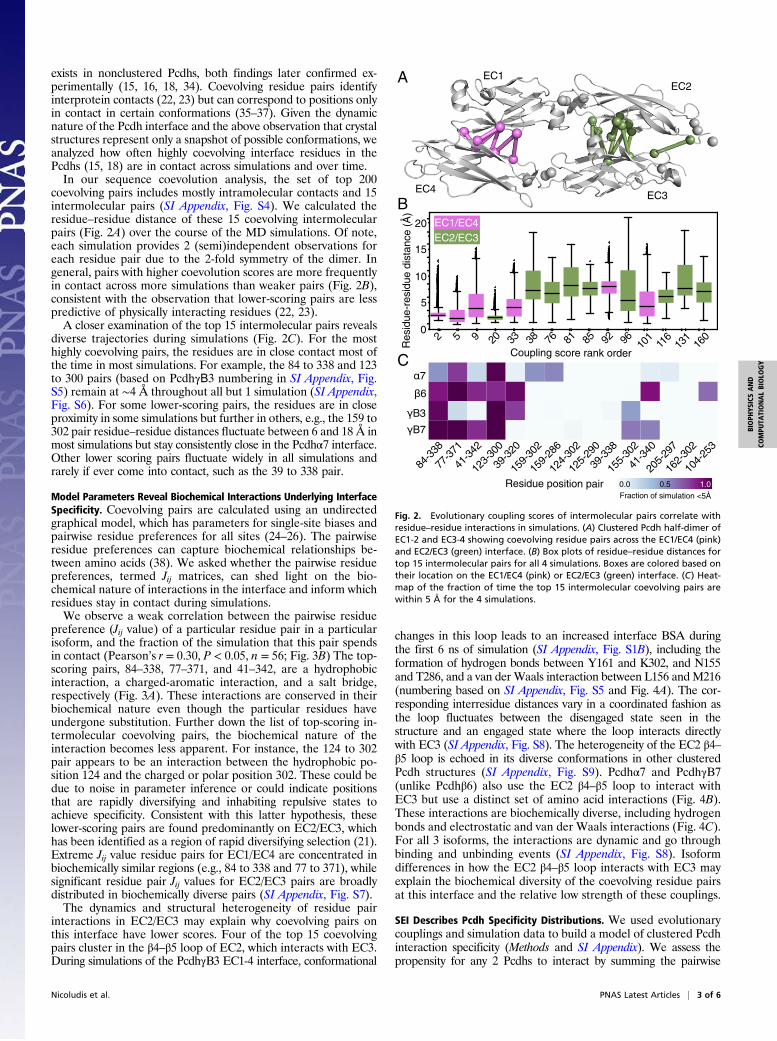
residue preferences for all interface residue pairs, producing a scorethat we call the statistical energy of interaction (SEI) (Methods andFig. 5A). A higher SEI indicates a higher propensity for interaction.Our statistical model allows us to compare covariation-based
determinants of specificity between all isoforms to discern therelative likelihood of interaction. For the α, β, and γ Pcdh subfamiliesin mouse, the SEI of a sequence with itself (a self pairing) is higherthan the SEI of a sequence with a different isoform (a nonselfpairing; Fig. 5B). This is generally consistent with previous cellaggregation experiments in which clustered Pcdhs only formhomodimers (12, 13). While these studies observed no nonselfinteraction in their experiments, our model finds that in somecases the SEI for nonself pairs is as high as for a self pairing, e.g.,between β4 and β6. This could be due to particulars of the cellaggregation assay or suggest that some in vivo determinants ofspecificity are not fully captured by our model.We compared the contribution of each domain–domain inter-
face to the overall SEI. The nonself Pcdh pairs of the mouse α, γB,and γA subfamilies have a lower SEI in the EC2/EC3 interfacethan in the EC1/EC4 interface, indicating that the EC2/EC3 in-terface contributes more to specificity of these isoforms (Fig. 5Cand SI Appendix, Fig. S10). The α subfamily has nearly identicalSEI between EC1/EC4 self and nonself interfaces, suggesting thisinteraction has little discriminatory power in the α subfamily. Thisfinding extends our previous analysis (14) that found that the EC2/EC3 interface tends to contribute more to specificity than theEC1/EC4 interface. The difference in SEI between EC2/EC3 andEC1/EC4 nonself pairs may be due to having mutations betweenself and nonself EC2/EC3 pairs compared to EC1/EC4 pairs, whichnegatively correlates with the SEI (SI Appendix, Fig. S11).The SEI model allows us to predict how particular mutations
may alter interaction specificity by recalculating SEI using individ-ual coupling terms from the mutant sequence. Previous work hastested chimeric constructs in cell aggregation assays to un-derstand how specificity is encoded in the clustered Pcdh family(14), and our model correctly predicts the phenotype of themajority of these mutants (SI Appendix, Fig. S12). On closerinspection of the Pcdhα7/Pcdhα8 pair, the SEI of Pcdhα8 EC1/EC4 nonself pairs are lower than the nonself EC1/EC4 pairs inother α isoforms (SI Appendix, Fig. S10). Coincidentally, thePcdhα7/Pcdhα8 EC2/EC3 SEI is nearly identical to the self SEIscores, suggesting that, within this pair, EC1/EC4 provides morediscrimination than EC2/EC3. This agrees with literature results(14) but remains an exception to the trend that EC2/EC3 providemore discriminatory power in the α, γB, and γA subfamilies.Our model parameters are inferred only from natural se-
quences, and therefore self pairings, which may bias the modelagainst nonself pairings. To avoid this possible bias, we imple-mented an iterative pairing algorithm that allows the isoforms to
find favorable nonself pairings, if such pairings exist (23, 24) (SIAppendix, Fig. S13). The algorithm reproduces self pairings for74% of all sequences in the alignment, averaged across 5 replicates,after iteration to convergence. This is on par with accuracy ofpartner detection for other proteins pairs performed by relatedalgorithms (23, 34) and supports the use of our model built fromnatural sequences. When the EC1/EC4 and EC2/EC3 interactionswere paired in isolation, we found that the accuracy of matching
84
338
L VL L
77
371
E QE E
Y Y T Y
L VL L
39
320
A H I S
41
340
K RE E
S SK K
342 F SH R
155
286
N RN N
K T T T
159V RS S 162 L P
P P
205
297
V I A A
P L H L
104
253
P P S P
S Q N G
123 P L A I
124 L L L L
125 E KE E
290 E VE E
300 H KY Q
302 T T K K
positive negativepolar hydrophobicaromatic
-0.2 -0.1 0 0.1 0.2
0
20
40
60
80
100
% o
f sim
ulat
ion
in c
onta
ct
Jij
BA
S SA T
Fig. 3. Coevolving residue pairs reveal biochemical interactions across clustered Pcdh interface. (A) The top 15 coevolving pairs and the amino acids found atthese positions for the 4 simulations. (B) Weak correlation is seen between the pairwise residue preferences (Jij values) and the fraction of the simulation theseresidues pairs were in contact (within 5 Å).
1.00.0
156H
158Q
159V
160K
215S
216L
286K
288P
300H
304L
161P
302T
155N
154P
215D
216M
286T
288G
300Y
304Q
302K
157E
156L
158G
159S
160R
161Y
155N
154E
157D
215D
216V
286T
288D
300Q
304I
302K
156P
158G
159S
160K
161Y
155N
154D
157D
154-215154-302155-215155-286155-302156-216156-286156-302156-304157-286158-286159-216159-286159-302159-304160-215160-216160-302161-288161-300161-302
0.5
Fraction of simulation
A
Y161Y161
K302N155
T286
L156
M216
K302
N155
T286
L156
M216
0 ns 40 ns
B C
Fig. 4. Structural heterogeneity and sequence diversity of EC2 β4–β5 loopcontribute to isoform specificity. (A) The EC2 β4–β5 samples conformationalspace in the PcdhγB3 simulation, forming several interactions with EC3(numbering based on SI Appendix, Fig. S5). (B) Residue–residue interactions(shown as a heatmap of the fraction of the simulation pairs within 5 Å) of theEC2 β4–β5 loop (positions 154 to 161) with EC3 (positions 215, 216, 286, 288,300, 302, and 304) differ between isoforms. (C) The differences in interactingresidue pairs reflect diverse biochemical interactions of this loop with EC3.
4 of 6 | www.pnas.org/cgi/doi/10.1073/pnas.1821063116 Nicoludis et al.

was less than when the whole interface was used, indicating that bothinterfaces act in combination to achieve full specificity of the interface.Our model allows us to compute a SEI score for all pairs of
clustered Pcdhs that generally agrees with experimental findingsabout specificity of Pcdh isoforms. Importantly, it also allowed usto dissect contributions of various interface components at an overalland subfamily level. We observed lower mean SEI at EC2/EC3nonself interfaces than at EC1/EC4 nonself interfaces, indicatingthat the EC2/EC3 interface tends to be more involved in specificity.
DiscussionThe highly specific antiparallel Pcdh interface that forms betweenneurons is required for many roles in neuronal development. Ourresults address the determinants of specificity in this interaction bysimulating the dynamics of the Pcdh interface and modeling thecontributions of each residue pair to interaction specificity.Our MD simulations of clustered Pcdh dimers reveal that in-
dividual EC interactions sample a range of conformations in everyisoform. The variations in BSA for individual EC interactionssuggest that the individual interactions are weak, and the overallstability of a Pcdh dimer is established by the polyvalent nature ofthese individual EC interactions. This type of cooperative bindingis widespread in biology and plays roles in multisubunit proteinmachine assembly, signaling at the membrane, and signaling betweencells (39–41). The dynamic nature of clustered Pcdh complexesand the cooperativity of individual EC interactions likely play arole in interaction specificity, motivating us to incorporate thesesimulations in our statistical model of specificity.The MD simulations allowed us to observe how coevolving
residue pairs across a protein interface vary over time. Overall,we found that higher scoring pairs are closer together throughoutthe simulations and across multiple homologs, demonstrating a
relationship between the strength of an interaction and the couplingscore of a residue pair. This result extends previous empiricalresults showing that coevolving pairs are more likely to be closein 3D (22, 23), and that evolutionary couplings can correspond tomultiple incompatible conformations (35–37). We also find thatresidue–residue distances vary between isoforms, suggesting thatcoevolving pairs may be important for the stability of only a subsetof proteins. Thus, our MD results illustrate that coevolving pairscan represent residue interactions that are present in the ensembleof conformations sampled by the collection of homologous proteinsthat are present in the coevolutionary model. This knowledge couldinform further developments to benchmark structure predictionusing coevolution data.By analyzing the correlation between evolutionary couplings
and the behavior of residue pairs in simulations, we have shed lighton the role of coevolving residue pairs in the specificity of clusteredPcdh interactions. Generally, the most strongly coevolving pairs arefound between EC1 and EC4, and these pairs are frequently incontact. The biochemical nature of these interactions is consistentbetween isoforms, indicating that they serve a conservative role inthe Pcdh interactions. Coevolving pairs between EC2/EC3 are lessfrequently in contact and their biochemical character changes be-tween isoforms, suggesting these interactions are rapidly diversifyingand metastable so that they can flexibly occupy new specificity space.We constructed a model of interaction specificity from sequence
data, using residue pairs found to interact in our simulations. Weused this model to evaluate pairs of individual EC interfaces,allowing us to determine the relative likelihood of an interaction.We found that the difference in statistical energy of interaction(ΔSEI) supports literature results that the Pcdh interface is specificfor self-interaction. Nonself pairings of the EC2/EC3 interface havelower SEI than nonself EC1/EC4 pairings for the α, γΑ, and γB
In vivo interaction
��
� �
�
�
��
� �
�
ExpectedSEI
Y
N
High
Low
self pairing
mea
n S
EI o
f int
erfa
ce
selfno
nself
EC1/EC4EC2/EC3
C
nonself pairing
α1α2
α3α4
α5α6
α7α8
α9α10
α11α12
β4β6
β8β10
β11β12
β5β7
β9β1
β2β3
β14β15
β16β17
β18β19
β20β21
β22
β13
γA2γA3
γA4γA5
γA6γA7
γA8γA9
γA10
γA1
γA12γB1
γB2γB4
γB5γB6
γB7γB8
γA11
α γAβ γB
0
8
6
4
2
-2
A B
α1α2
α3α4
α5α6
α7α8
α9α1
0α1
1α1
2β4
β6β8
β10
β11
β12
β5β7
β9β1
β2β3
β14
β15
β16
β17
β18
β19
β20
β21
β22
β13
γA2
γA3
γA4
γA5
γA6
γA7
γA8
γA9
γA10
γA1
γA12
γB1
γB2
γB4
γB5
γB6
γB7
γB8
γA11
Calculate SEI of interface pairs
0
1
2
3
4
Fig. 5. Statistical energy of interaction supports experimental evidence for self-interaction and divergent roles of EC2/EC3 and EC1/EC4 interfaces. (A) SEI forevery possible pairing of Pcdhs was calculated by summing the energy contribution of each interacting residue pair at the interface. Based on prior work (27,28), we expect to observe high statistical energy for self pairings, which interact in vivo (12, 13), and low statistical energy for nonself pairings. (B) Statisticalenergy for all possible combinations of isoforms. (C) Mean statistical energy of every self and nonself pairing for the EC2/EC3 and EC1/EC4 interface, measuredwithin all subfamilies of clustered Pcdhs in mouse.
Nicoludis et al. PNAS Latest Articles | 5 of 6
BIOPH
YSICSAND
COMPU
TATIONALBIOLO
GY

subfamilies, indicating that the EC2/EC3 interface has a greatercontribution to specificity. There are some differences between sub-families as noted previously (15, 20), with the β and γA subfamilieshaving nearly equal contributions to specificity from both interfaces.The extent to which protein–protein interactions avoid cross
talk with paralogs is dependent on the evolutionary consequencesof having promiscuous interactions. To avoid spurious signaling,bacterial 2-component systems have strict specificity encoded in asmall number of residues (42, 43). Promiscuous intermediates havebeen derived experimentally for bacterial toxin–antitoxin and PDZdomains (44, 45), although these sequences likely have not beenvisited evolutionarily. The work presented here suggests a strategyused by clustered Pcdhs to ensure specificity and yet allow newspecificities to easily arise through evolution. Small changes in in-dividual EC affinity caused by a small number of mutations canalter the affinity of the whole dimer through the cooperativity of theindividual EC interactions. This strategy may explain the pervasivenessof this interface for cell–cell adhesion in nervous system development.
MethodsDetailed procedures for all methods are provided in SI Appendix.
Statistical Interaction Energy Model of Clustered Pcdh Specificity. We usedevolutionary couplings to build a model of clustered Pcdh interactions.Previous studies used the statistical energy of an evolutionary couplingsmodel to identify interacting histidine kinase-response regulator pairs (27,28) and to predict the effects of mutations on protein function (31). For ourmodel, only the interface residue pairs determined by our MD approach
were used. The interaction energy between 2 sequences (σA, σB) is the sum ofthe individual coupling terms (Jij) between the interface residues of the 2sequences:
SEI�σA, σB
�=
X
interface ði, jÞcontacts
Jij�σAi , σ
Bj
�.
The Jij term is the matrix of pairwise residue preferences for all possibleamino acids in positions i and j (31). The change in SEI(σ) is used to predictwhether the interaction will become more or less favorable. See SI Appendixfor further explanation. See Datasets S1–S3 for interface residues, residuepairs, and an alignment of mouse isoforms.
ACKNOWLEDGMENTS. We thank members of the R.G. and D.S.M. laboratoriesfor stimulating discussions on this project, Raul Araya-Secchi and Bennett Vogtfor initial work on PcdhγB3, and the Northeastern Collaborative Access Team(NE-CAT) beamline staff and the SBGrid support team for help with crystallo-graphic data collection and analysis. NE-CAT is funded by NIH (P30 GM124165and S10 RR029205) and the Advanced Photon Source by the US Departmentof Energy (DE-AC02-06CH11357). Evolutionary couplings analysis was con-ducted on the Orchestra High Performance Compute Cluster at Harvard MedicalSchool, funded by NIH (National Center for Research Resources 1S10RR028832-01). MD simulations were performed on Texas Advanced Computing Center’sStampede2 supercomputer (Extreme Science and Engineering Discovery En-vironment MCB140226) and Ohio Supercomputer Center’s Owens cluster(PAS1037). J.M.N. was supported by a National Defense Science and EngineeringGraduate Fellowship, and A.G.G. by National Science Foundation Graduate Re-search Fellowship DGE1144152. Support was also provided by NIH (GM106303[to D.S.M.] and DC015271 [to M.S.]).
1. M. R. Emond, J. D. Jontes, Inhibition of protocadherin-α function results in neuronaldeath in the developing zebrafish. Dev. Biol. 321, 175–187 (2008).
2. A. M. Garrett, D. Schreiner, M. A. Lobas, J. A. Weiner, γ-Protocadherins control corticaldendrite arborization by regulating the activity of a FAK/PKC/MARCKS signalingpathway. Neuron 74, 269–276 (2012).
3. D. Kostadinov, J. R. Sanes, Protocadherin-dependent dendritic self-avoidance regu-lates neural connectivity and circuit function. eLife 4, e08964 (2015).
4. J. Ledderose, S. Dieter, M. K. Schwarz, Maturation of postnatally generated olfactory bulbgranule cells depends on functional γ-protocadherin expression. Sci. Rep. 3, 1514 (2013).
5. J. L. Lefebvre, D. Kostadinov, W. V. Chen, T. Maniatis, J. R. Sanes, Protocadherins mediatedendritic self-avoidance in the mammalian nervous system. Nature 488, 517–521 (2012).
6. L. Suo, H. Lu, G. Ying,M. R. Capecchi, Q.Wu, Protocadherin clusters and cell adhesion kinaseregulate dendrite complexity through Rho GTPase. J. Mol. Cell Biol. 4, 362–376 (2012).
7. X. Wang et al., Gamma protocadherins are required for survival of spinal interneu-rons. Neuron 36, 843–854 (2002).
8. J. A. Weiner, X. Wang, J. C. Tapia, J. R. Sanes, Gamma protocadherins are required forsynaptic development in the spinal cord. Proc. Natl. Acad. Sci. U.S.A. 102, 8–14 (2005).
9. M. J. Molumby, A. B. Keeler, J. A. Weiner, Homophilic protocadherin cell-cell inter-actions promote dendrite complexity. Cell Rep. 15, 1037–1050 (2016).
10. G. Mountoufaris, D. Canzio, C. L. Nwakeze, W. V. Chen, T. Maniatis, Writing, reading,and translating the clustered protocadherin cell surface recognition code for neuralcircuit assembly. Annu. Rev. Cell Dev. Biol. 34, 471–493 (2018).
11. J. Brasch et al., Visualization of clustered protocadherin neuronal self-recognitioncomplexes. Nature 569, 280–283 (2019).
12. D. Schreiner, J. A. Weiner, Combinatorial homophilic interaction between γ-proto-cadherin multimers greatly expands the molecular diversity of cell adhesion. Proc.Natl. Acad. Sci. U.S.A. 107, 14893–14898 (2010).
13. C. A. Thu et al., Single-cell identity generated by combinatorial homophilic interac-tions between α, β, and γ protocadherins. Cell 158, 1045–1059 (2014).
14. R. Rubinstein et al., Molecular logic of neuronal self-recognition through proto-cadherin domain interactions. Cell 163, 629–642 (2015).
15. J. M. Nicoludis et al., Antiparallel protocadherin homodimers use distinct affinity- andspecificity-mediating regions in cadherin repeats 1-4. eLife 5, e18449 (2016).
16. S. R. Cooper, J. D. Jontes, M. Sotomayor, Structural determinants of adhesion byProtocadherin-19 and implications for its role in epilepsy. eLife 5, 1–22 (2016).
17. X. Peng et al., Affinity capture of polyribosomes followed by RNAseq (ACAPseq), adiscovery platform for protein-protein interactions. eLife 7, e40982 (2018).
18. J. M. Nicoludis et al., Structure and sequence analyses of clustered protocadherinsreveal antiparallel interactions that mediate homophilic specificity. Structure 23,2087–2098 (2015).
19. K. M. Goodman et al., Structural basis of diverse homophilic recognition by clusteredα- and β-protocadherins. Neuron 90, 709–723 (2016).
20. K. M. Goodman et al., γ-Protocadherin structural diversity and functional implica-tions. eLife 5, e20930 (2016).
21. Q. Wu, Comparative genomics and diversifying selection of the clustered vertebrateprotocadherin genes. Genetics 169, 2179–2188 (2005).
22. T. A. Hopf et al., Sequence co-evolution gives 3D contacts and structures of proteincomplexes. eLife 3, e03430 (2014).
23. S. Ovchinnikov, H. Kamisetty, D. Baker, Robust and accurate prediction of residue-residueinteractions across protein interfaces using evolutionary information. eLife 3, e02030 (2014).
24. D. S. Marks et al., Protein 3D structure computed from evolutionary sequence vari-ation. PLoS One 6, e28766 (2011).
25. F. Morcos et al., Direct-coupling analysis of residue coevolution captures native contactsacross many protein families. Proc. Natl. Acad. Sci. U.S.A. 108, E1293–E1301 (2011).
26. J. I. Sułkowska, F. Morcos, M. Weigt, T. Hwa, J. N. Onuchic, Genomics-aided structureprediction. Proc. Natl. Acad. Sci. U.S.A. 109, 10340–10345 (2012).
27. A.-F. Bitbol, R. S. Dwyer, L. J. Colwell, N. S. Wingreen, Inferring interaction partnersfrom protein sequences. Proc. Natl. Acad. Sci. U.S.A. 113, 12180–12185 (2016).
28. T. Gueudré, C. Baldassi, M. Zamparo, M. Weigt, A. Pagnani, Simultaneous identifi-cation of specifically interacting paralogs and interprotein contacts by direct couplinganalysis. Proc. Natl. Acad. Sci. U.S.A. 113, 12186–12191 (2016).
29. R. R. Cheng, F. Morcos, H. Levine, J. N. Onuchic, Toward rationally redesigning bac-terial two-component signaling systems using coevolutionary information. Proc. Natl.Acad. Sci. U.S.A. 111, E563–E571 (2014).
30. R. R. Cheng et al., Connecting the sequence-space of bacterial signaling proteins tophenotypes using coevolutionary landscapes. Mol. Biol. Evol. 33, 3054–3064 (2016).
31. T. A. Hopf et al., Mutation effects predicted from sequence co-variation. Nat. Bio-technol. 35, 128–135 (2017).
32. M. Sotomayor, K. Schulten, The allosteric role of the Ca2+ switch in adhesion andelasticity of C-cadherin. Biophys. J. 94, 4621–4633 (2008).
33. L. Zhang, S. Borthakur, M. Buck, Dissociation of a dynamic protein complex studied byall-atom molecular simulations. Biophys. J. 110, 877–886 (2016).
34. J. M. Nicoludis, R. Gaudet, Applications of sequence coevolution in membrane proteinbiochemistry. Biochim. Biophys. Acta Biomembr. 1860, 895–908 (2018).
35. A. Toth-Petroczy et al., Structured states of disordered proteins from genomic se-quences. Cell 167, 158–170.e12 (2016).
36. T. A. Hopf et al., Three-dimensional structures of membrane proteins from genomicsequencing. Cell 149, 1607–1621 (2012).
37. F. Morcos, B. Jana, T. Hwa, J. N. Onuchic, Coevolutionary signals across protein lineages helpcapture multiple protein conformations. Proc. Natl. Acad. Sci. U.S.A. 110, 20533–20538 (2013).
38. A. Coucke et al., Direct coevolutionary couplings reflect biophysical residue interac-tions in proteins. J. Chem. Phys. 145, 174102 (2016).
39. M. Mammen, S. K. Choi, G. M. Whitesides, Polyvalent interactions in biological sys-tems: Implications for design and use of multivalent ligands and inhibitors. Angew.Chem. Int. Ed. Engl. 37, 2754–2794 (1998).
40. J. D. Badji�c, A. Nelson, S. J. Cantrill, W. B. Turnbull, J. F. Stoddart, Multivalency andcooperativity in supramolecular chemistry. Acc. Chem. Res. 38, 723–732 (2005).
41. A. Whitty, Cooperativity and biological complexity. Nat. Chem. Biol. 4, 435–439 (2008).42. A. I. Podgornaia, M. T. Laub, Determinants of specificity in two-component signal
transduction. Curr. Opin. Microbiol. 16, 156–162 (2013).43. E. J. Capra, B. S. Perchuk, J. M. Skerker, M. T. Laub, Adaptive mutations that prevent crosstalk
enable the expansion of paralogous signaling protein families. Cell 150, 222–232 (2012).44. C. D. Aakre et al., Evolving new protein-protein interaction specificity through pro-
miscuous intermediates. Cell 163, 594–606 (2015).45. A. S. Raman, K. I. White, R. Ranganathan, Origins of allostery and evolvability in
proteins: A case study. Cell 166, 468–480 (2016).
6 of 6 | www.pnas.org/cgi/doi/10.1073/pnas.1821063116 Nicoludis et al.