
Interaction of Three-Dimensional Pool-Riffle Sequence and ...
11
Journal of Civil Engineering Research 2021, 11(2): 51-61 DOI: 10.5923/j.jce.20211102.03 Interaction of Three-Dimensional Pool-Riffle Sequence and the Flow Characteristics in the Presence of Wall Vegetation Nima Ataollahi 1 , Marziyeh Khabari 1 , Ehsan Shahiri Tabarestani 1 , Vijay P. Singh 2 , Hossein Afzalimehr 1,* 1 Department of Civil Engineering, Iran University of Science and Technology, Tehran, Iran 2 Department of Biological & Agricultural Engineering & Zachry Department of Civil and Environmental Engineering, Texas A&M Univ., College Station, Texas, USA Abstract Determination of the flow velocity and shear stress is fundamental for river restoration projects. There are few studies in estimation of these parameters in the presence of 3D pool and riffle which are dominant bed forms in coarse-bed Rivers. Considering the interaction of 3D bed forms and the flow characteristics in the presence of wall vegetation, the present study aims to determine the velocity distribution, shear velocity, and shear stress in a laboratory scale. Accordingly, the effects of sediment sizes and various discharges on velocity and shear stress distributions and the validity of logarithmic law were assessed in a straight laboratory flume 13 m long, 0.45 m wide, and 0.6 m deep. Experiments were conducted in 4 runs over 3D pool and riffle where the natural vegetation were used along one side of the flume wall. Results showed that the logarithmic law remains valid for relative depths Z/H= 0.36 and 0.84 where Z is distance from the bed and H is the flow depth, in different sections of 3D pool and riffle. The location of maximum velocity changed with increasing the flow discharge. The maximum velocity value occurred at higher relative depths in the pool section rather than in the riffle one. Higher flow velocity values were observed near the water surface in pool section and near the bed in riffle section, respectively. The investigation of shear stress revealed that the maximum and minimum shear stress values occurred in the pool and riffle flows, respectively, and the presence of vegetation led to a change in the location of maximum shear stress. When the median size of the bed particles decreased, less change was observed in the shear stress values. Keywords Wall vegetation, 3D bed forms, Logarithmic law, Pool-riffle sequence, Boundary layer characteristics method, Shear stress 1. Introduction The formation of irregular bed geometry and 3D bedforms is inevitable in natural channels and rivers due to flow regime changes and channel dynamics. The pool–riffle sequences are known as bedforms, which commonly occur in gravel-bed rivers, defined as deeper and shallower parts of the bed, respectively. Generally, riffles are identified as being wider, shallower and coarser than pools [1]. Vegetation is one of the suitable tools for river management, but in the past it was removed from rivers only to consider its effect on flow resistance and to increase flow capacity. Vegetation is a key factor in reducing flow velocity and its presence in floodplains changes flow resistance as well as sediment transport and may affect bedforms. Changes in the wall vegetation characteristics can affect the * Corresponding author: [email protected] (Hossein Afzalimehr) Received: Sep. 13, 2021; Accepted: Oct. 14, 2021; Published: Oct. 30, 2021 Published online at http://journal.sapub.org/jce width and migration rate of the channel as an independent factor and increase the potential capacity to change the river plan [2,3]. Numerous studies have been conducted for evaluating the impact of pool-riffle on low characteristics, sediment transport, and turbulence intensity, including experimental studies, numerical studies, and field investigation [4-12]. Caamano et al. (2006) observed flow jets in different discharges and reported that flow discharge changes affected jet locations [13]. Tokyay and Sinha (2020) showed that the maximum velocity region occurred at the riffle section and decreased towards the pool section. Also, the bed shear stress revealed its maximum and minimum values in the riffle and pool, respectively [8]. Most of the studies on the pool-riffle sequences focused on 2D bed forms. However, morphologically, pools and riffles are inherently three-dimensional and this characteristic needs to be considered in detail in river engineering projects. Vegetation has a controlling effect on river flow, erosion, and geomorphology. To investigate the effect of vegetation on the flow structure in the laboratory, some researchers used
Transcript of Interaction of Three-Dimensional Pool-Riffle Sequence and ...

Journal of Civil Engineering Research 2021, 11(2): 51-61
DOI: 10.5923/j.jce.20211102.03
Interaction of Three-Dimensional Pool-Riffle Sequence
and the Flow Characteristics in the Presence of
Wall Vegetation
Nima Ataollahi1, Marziyeh Khabari
1, Ehsan Shahiri Tabarestani
1, Vijay P. Singh
2, Hossein Afzalimehr
1,*
1Department of Civil Engineering, Iran University of Science and Technology, Tehran, Iran 2Department of Biological & Agricultural Engineering & Zachry Department of Civil and Environmental Engineering,
Texas A&M Univ., College Station, Texas, USA
Abstract Determination of the flow velocity and shear stress is fundamental for river restoration projects. There are few
studies in estimation of these parameters in the presence of 3D pool and riffle which are dominant bed forms in coarse-bed
Rivers. Considering the interaction of 3D bed forms and the flow characteristics in the presence of wall vegetation, the
present study aims to determine the velocity distribution, shear velocity, and shear stress in a laboratory scale. Accordingly,
the effects of sediment sizes and various discharges on velocity and shear stress distributions and the validity of logarithmic
law were assessed in a straight laboratory flume 13 m long, 0.45 m wide, and 0.6 m deep. Experiments were conducted in 4
runs over 3D pool and riffle where the natural vegetation were used along one side of the flume wall. Results showed that the
logarithmic law remains valid for relative depths Z/H= 0.36 and 0.84 where Z is distance from the bed and H is the flow depth,
in different sections of 3D pool and riffle. The location of maximum velocity changed with increasing the flow discharge. The
maximum velocity value occurred at higher relative depths in the pool section rather than in the riffle one. Higher flow
velocity values were observed near the water surface in pool section and near the bed in riffle section, respectively. The
investigation of shear stress revealed that the maximum and minimum shear stress values occurred in the pool and riffle flows,
respectively, and the presence of vegetation led to a change in the location of maximum shear stress. When the median size of
the bed particles decreased, less change was observed in the shear stress values.
Keywords Wall vegetation, 3D bed forms, Logarithmic law, Pool-riffle sequence, Boundary layer characteristics method,
Shear stress
1. Introduction
The formation of irregular bed geometry and 3D bedforms
is inevitable in natural channels and rivers due to flow
regime changes and channel dynamics. The pool–riffle
sequences are known as bedforms, which commonly occur
in gravel-bed rivers, defined as deeper and shallower parts
of the bed, respectively. Generally, riffles are identified as
being wider, shallower and coarser than pools [1].
Vegetation is one of the suitable tools for river
management, but in the past it was removed from rivers only
to consider its effect on flow resistance and to increase flow
capacity. Vegetation is a key factor in reducing flow velocity
and its presence in floodplains changes flow resistance as
well as sediment transport and may affect bedforms.
Changes in the wall vegetation characteristics can affect the
* Corresponding author:
[email protected] (Hossein Afzalimehr)
Received: Sep. 13, 2021; Accepted: Oct. 14, 2021; Published: Oct. 30, 2021
Published online at http://journal.sapub.org/jce
width and migration rate of the channel as an independent
factor and increase the potential capacity to change the river
plan [2,3].
Numerous studies have been conducted for evaluating
the impact of pool-riffle on low characteristics, sediment
transport, and turbulence intensity, including experimental
studies, numerical studies, and field investigation [4-12].
Caamano et al. (2006) observed flow jets in different
discharges and reported that flow discharge changes affected
jet locations [13]. Tokyay and Sinha (2020) showed that
the maximum velocity region occurred at the riffle section
and decreased towards the pool section. Also, the bed
shear stress revealed its maximum and minimum values
in the riffle and pool, respectively [8]. Most of the studies
on the pool-riffle sequences focused on 2D bed forms.
However, morphologically, pools and riffles are inherently
three-dimensional and this characteristic needs to be
considered in detail in river engineering projects.
Vegetation has a controlling effect on river flow, erosion,
and geomorphology. To investigate the effect of vegetation
on the flow structure in the laboratory, some researchers used

52 Nima Ataollahi et al.: Interaction of Three-Dimensional Pool-Riffle Sequence
and the Flow Characteristics in the Presence of Wall Vegetation
cylindrical objects to simulate the shape of vegetation, and
others used natural vegetation [14]. White and Nepf (2007)
applied the wooden cylinders as vegetation in the channel
floodplain and found that the difference in velocity and the
generation of a shear layer between the floodplain and the
main channel caused a turning point in the velocity profile
[15]. Having used artificial grass and wooden cylinders
in a floodplain, McBride et al. (2007) showed that the
flow velocity decreased in the presence of cylinders.
They claimed that at the border between the main channel
and the floodplain, a highly turbulent shear layer formed
which intensified in the presence of wooden cylinders [16].
Sun and Shiono (2009) found considerable differences in
velocity, shear stress, and discharge in the presence cylinders,
compared to experiments without cylinders [17]. Also,
vegetation on the walls generated secondary currents causing
considerable deviation in the velocity and shear stress
distributions [18]. Fazlollahi et al. (2015) found that the
presence of wall vegetation intensified the occurrence of
maximal velocity under the water surface which was called
the dip phenomenon [4].
From the above literature, it is not clear how the
interaction of 3D bed forms and wall vegetation may change
the flow characteristics, including velocity and shear stress
distributions and the validity of log law. These factors
significantly influence the estimation of fluvial hydraulic
parameters in river restoration projects. The objective of this
study is to investigate the effect of 3D bed forms and wall
vegetation on the distributions of velocity, shear stress, and
shear velocity in a laboratory flume with natural reeds.
2. Experimental Set up
All experiments were conducted in the hydraulics
laboratory of the Water Research Institute of the Ministry of
Energy. Experiments were carried out in a 13 m long, 0.45 m
wide and 0.6 m deep flume with Plexiglas sidewalls (Fig. 1).
Due to considerable turbulence in the entrance of the
flume, a set of metal panels was used as a filter to help the
with energy dissipation of the flow (Fig. 2).
Using field measurements in some reaches in Tireh
and Gelroud Rivers in Lorestan Province, in central Iran,
and the geometry of bedforms measured by Slotani
(2016) and Fazel Najafabadi (2016) in gravel-bed rivers,
the characteristics of pool-riffle sequence and the grain
size distribution were determined [19,20]. Accordingly, the
bedforms were constructed at a distance of 7 m from the
flume entrance in order to prevent the effect of the end gate
on the upstream flow. The pool-riffle sequence had a length
of 5 m and the bed elevation changes were asymmetric in the
flume width. The entrance and exit slopes of the pool section
were the same indicating an angle of 7.3 degrees and the
deepest depth of the pool was 10 cm under the bed form crest.
After leveling the bed, a layer of gravel was added randomly
across the flume to prevent any change in the bed topography.
Changes in 3D bedform elevations and the longitudinal
profile of pool section are shown in Figs. 3 and 4,
respectively.
Figure 1. Laboratory setup
Figure 2. Schematic of flow filter

Journal of Civil Engineering Research 2021, 11(2): 51-61 53
Figure 3. Changes in three-dimensional bedform elevations in laboratory
Figure 4. Longitudinal profile of pool section
Figure 5. Interior view of laboratory flume
A row of reeds with 10 m length was used as natural
vegetation only on one side of the flume wall. The average
diameter of the stems was 12.8 mm and on average 80 stems
were placed per meter of length of the flume wall. Note that
the vegetation on wall was put on the left side, by moving in
the direction of flow. The flume inside is illustrated in Fig. 5.
In the present study, the flow velocity was measured by
using a micro-current meter instrument with high density.
For this aim, a network was set for data organization, which
is indicated in Fig. 6 and velocity measurements were done
at the given points. In this network, the upper wall with
vegetation, shown with green color, is the basis for
calculating the horizontal distances (base axis) and the
horizontal distance of axes 1, 2, 3, and 4 from the vegetation
wall were 5, 15, 30, and 40 cm, respectively.
To construct the bed forms, two different types of gravel
particles with diameters of 11.7 mm and 7.81 mm were
used. The grain size distribution is presented in Fig. 7.
The parameter of geometric standard deviation for these
distributions was achieved as 1.2 and 1.3, respectively,
which indicated the uniformity of the particle size
distribution of the bed material.

54 Nima Ataollahi et al.: Interaction of Three-Dimensional Pool-Riffle Sequence
and the Flow Characteristics in the Presence of Wall Vegetation
Figure 6. A network setup in plan of flume
Figure 7. Grain size distribution for bed materials
The flow discharges and other parameters related to the
flow characteristics are presented in Table 1.
Table 1. Flow parameters in the experiments
Discharge (L/s) Uave (m/s) Fr Re
35 0.423 0.325 42638
45 0.544 0.409 54835
The experiments were classified into four separate
categories. In total more than 10,000 data were recorded. The
characteristics of experiments are presented in Table 2.
Table 2. Characteristics and symbols of different categories of experiments
Category Symbol of
experiment
Discharge
(L/s)
Median
size of bed
particles
(mm)
Presence of
vegetation
1 S1-V 35 11.7 Yes
2 S2-V 45 11.7 Yes
3 S3-V 35 7.81 Yes
4 S4-NV 35 11.7 No
3. Results and Discussion
3.1. The Logarithmic Law Validation
Using 104 velocity profiles measured in near the bed zone
and the inner layer, the validation of the logarithmic law was
investigated for the interaction of 3D and wall vegetation.
Kironoto and Graf (1995), Graf and Altinakar (1998), and
Afzalimehr and Anctil (2000) considered the relative depth
(y/h) up to 0.2 as the inner layer for 2D and without bed
form in laboratory flumes [21-23]. However, Maddahi et al.
(2016) reported the relative depth of 0.4, 0.8, and 0.33 for
the validity of logarithmic law in gravel-bed rivers in the
absence of bed forms. In the current research, the curve of
depth of the logarithmic law for the first and fourth
categories are demonstrated in Figs. 8 and 9, respectively
[10]. For visual understanding, the relative depths of the
validity of logarithmic law were classified into five separate
categories, as shown in Fig. 10.
Figs. 8 and 9 show that the logarithmic law was valid in
the presence and absence of vegetation for 3D bed forms,
and the lower and upper relative depths of the logarithmic
law validity were 0.36 and 0.84, respectively. Considering
the frequency of categories in Fig. 10, it can be stated that the

Journal of Civil Engineering Research 2021, 11(2): 51-61 55
relative depth of validity was located in 53.8% of the profiles
in the range of 0.4 to 0.6 and in 37.5% of the profiles in the
range of 0.6 to 0.8.
This means that in more than 91% of the 104 profiles
measured in this study, the depth of validity of the
logarithmic law located in the range of 0.4 to 0.8, which
was more than the relative depth of 0.2 reported for the
case without wall vegetation and bed forms. The value of
correlation coefficient for all measured profiles was more
than 0.9, indicating a reasonable fit of the velocity data to the
inner layer data in the presence of 3D bed form and wall
vegetation.. Due to the large amount of data in this study, the
correlation coefficients for logarithmic law and distance
from vegetation were investigated, but no clear relationship
was found between these two parameters.
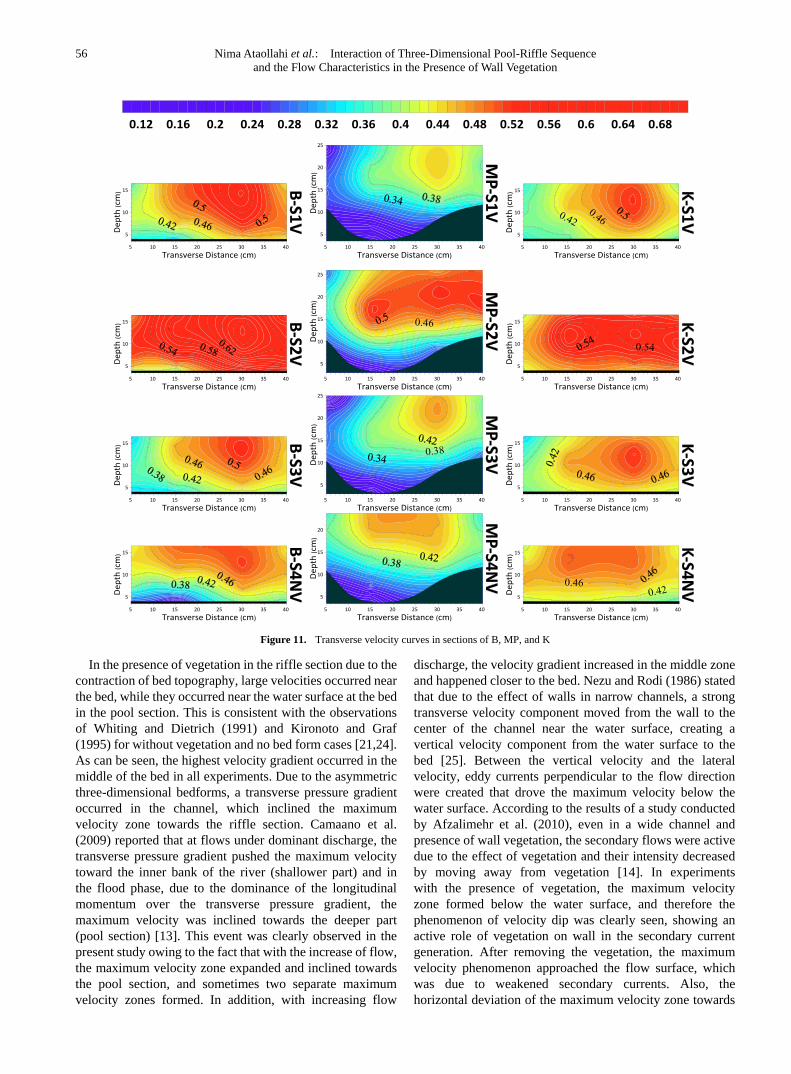
3.2. Transverse Velocity Curves
For each category of experiments, 12 transverse velocity
curves were presented. Since sections B, MP and K represent
the pool, flat and riffle sections, respectively, the assessment
and comparison of curves were done for all 4 categories of
experiments in these three sections. The transverse velocity
curves are shown in Figure 11, in which vegetation was
located on the left vertical axis.
Figure 8. The curve of elevation of logarithmic law validity in S1-V class
Figure 9. The curve of elevation of logarithmic law validity in S4-NV class
Figure 10. Frequency percentage of relative depths of logarithmic law validity in the first and fourth classes of experiments
56 Nima Ataollahi et al.: Interaction of Three-Dimensional Pool-Riffle Sequence
and the Flow Characteristics in the Presence of Wall Vegetation
Figure 11. Transverse velocity curves in sections of B, MP, and K
In the presence of vegetation in the riffle section due to the
contraction of bed topography, large velocities occurred near
the bed, while they occurred near the water surface at the bed
in the pool section. This is consistent with the observations
of Whiting and Dietrich (1991) and Kironoto and Graf
(1995) for without vegetation and no bed form cases [21,24].
As can be seen, the highest velocity gradient occurred in the
middle of the bed in all experiments. Due to the asymmetric
three-dimensional bedforms, a transverse pressure gradient
occurred in the channel, which inclined the maximum
velocity zone towards the riffle section. Camaano et al.
(2009) reported that at flows under dominant discharge, the
transverse pressure gradient pushed the maximum velocity
toward the inner bank of the river (shallower part) and in
the flood phase, due to the dominance of the longitudinal
momentum over the transverse pressure gradient, the
maximum velocity was inclined towards the deeper part
(pool section) [13]. This event was clearly observed in the
present study owing to the fact that with the increase of flow,
the maximum velocity zone expanded and inclined towards
the pool section, and sometimes two separate maximum
velocity zones formed. In addition, with increasing flow
discharge, the velocity gradient increased in the middle zone
and happened closer to the bed. Nezu and Rodi (1986) stated
that due to the effect of walls in narrow channels, a strong
transverse velocity component moved from the wall to the
center of the channel near the water surface, creating a
vertical velocity component from the water surface to the
bed [25]. Between the vertical velocity and the lateral
velocity, eddy currents perpendicular to the flow direction
were created that drove the maximum velocity below the
water surface. According to the results of a study conducted
by Afzalimehr et al. (2010), even in a wide channel and
presence of wall vegetation, the secondary flows were active
due to the effect of vegetation and their intensity decreased
by moving away from vegetation [14]. In experiments
with the presence of vegetation, the maximum velocity
zone formed below the water surface, and therefore the
phenomenon of velocity dip was clearly seen, showing an
active role of vegetation on wall in the secondary current
generation. After removing the vegetation, the maximum
velocity phenomenon approached the flow surface, which
was due to weakened secondary currents. Also, the
horizontal deviation of the maximum velocity zone towards

Journal of Civil Engineering Research 2021, 11(2): 51-61 57
the riffle section reduced, but the distribution of maximum
velocity zone across the channel was still not symmetrical.
Under the present conditions, vegetation played a more
significant role in the deviation of the maximum velocity
zone compared to 3D bed form role.
3.3. Role of 3D Bed form and Wall Vegetation
on the Velocity Distribution
In this part, the dimensionless velocity profiles of B, MP
and K sections in the first and fourth category experiments
are presented, so that the effect of vegetation on velocity
distribution can be investigated (Fig. 12 to 14). The blue dots
are related to the presence of vegetation and the red dots are
representative of the absence of vegetation.
In Fig. 12, adjacent to vegetation (point B1), the maximum
velocity occurred at a relative depth of 0.48, while with the
removal of vegetation, this value increased to 0.73. At a
distance of 15 cm from the vegetation (point B2), the relative
depth of occurrence of the maximum velocity was 0.6 and it
had increased to 0.88 with the removal of the vegetation.
This was due to the elimination of secondary currents
generated by vegetation, which resulted in the attenuation of
the velocity dip.
By moving away from the wall vegetation, the differences
between velocity distributions declined, therefore, the effect
of vegetation on the flow decreased. This observation is
consistent with the results of Afzalimehr (2009) [26].
The smoother slope in point B2 profiles indicated that
the velocity gradient in axis 2 was larger than in other axes.
As indicated in the study of transverse velocity curves, the
maximum velocity occurred below the water surface at all
distances in the presence of vegetation.
Referring to Fig. 13, in the mid-section and adjacent to
vegetation, there was a great deal of turbulence in the
distribution of point velocities. At a distance of 15 cm from
vegetation, there was no significant difference between the
relative depths where the maximum velocity occur compared
to the condition without vegetation. The velocity gradient
was also similar in two cases. Also, because the two points of
MP2 and B2 were both located on axis 2, the near-bed
velocities of flat section indicated less discrepancies in two
cases, compared to the pool section.
Figure 12. Dimensionless velocity distribution of B section in S1V and S4NV experiments
Figure 13. Dimensionless velocity distribution of MP section in S1V and S4NV experiments
Figure 14. Dimensionless velocity distribution of K section in S1V and S4NV experiments

58 Nima Ataollahi et al.: Interaction of Three-Dimensional Pool-Riffle Sequence
and the Flow Characteristics in the Presence of Wall Vegetation
The range of velocity changes in the K section
significantly decreased, compared to the mid-section (Fig.
14). This means that there was a large velocity gradient in the
pool section rather than in the flat and riffle regions, which is
in agreement with the observations of MacVicar and Roy
(2007) [2]. At this section, the maximum velocity formed
closer to the bed in both cases of with and without vegetation,
compared to the pool section (Kironoto and Graf 1995) [21].
By moving away from vegetation to the axis 3 (at a distance
of 30 cm from the vegetation), the agreement of profiles
increased and in the axis 4 (at a distance of 40 cm from the
vegetation) it has decreased again, which can be attributed to
the effect of bare wall on the flow, because axis 4 was
located 5 cm from the right wall.
The largest and lowest differences between the relative
depths of maximum velocity were related to the pool and
riffle sections, respectively. In all three selected sections,
most changes in velocity profiles were related to the nearest
axis to the vegetation (axis 1).
3.4. Shear Velocity Estimation
Shear velocity plays a significant role in river engineering
parameters, therefore, an accurate calculation and selection
of appropriate method for estimating shear velocity is of
particular importance. In the present study, three methods
of logarithmic law, parabolic law, and boundary layer
characteristics method were used to estimate the shear
velocity. For 24 selected points located on the B, MP and K
sections, Fig. 15 presents a comparison of shear velocity
estimation by the selected methods in this study.
The points located on the bisector line means a perfect
agreement by two methods. Examination of the scatter of
points indicates that the least difference in predicting shear
velocity values was related to the boundary layer method and
the logarithmic law in which data density was high around
the bisector and more than 95% of the data were in the
±25% relative error range. This value decreased to 53% for
the values obtained when comparing the parabolic law and
the logarithmic law. Afzalimehr and Rennie (2009) used the
boundary layer characteristics method to calculate the shear
velocity in several rivers in Iran and Canada and found the
log law to be valid in gravel-bed rivers [27]. Also, Fazlollahi
et al. (2015) found over 2D riffle with wall vegetation and
Shahmohammadi et al. (2018) for flow over vegetation patch
reported the validation of the logarithmic law in shear
velocity estimation in laboratory studies [4,28]. In the
present study, the shear velocity values for all points in the
network were calculated based on the boundary layer
characteristics method, which not only used all data points
in each velocity profile but also considered the velocity
distribution over 3D bedforms. This method had a good
agreement with the logarithmic law (Fig. 16), however,
when the velocity distribution indicated some change in form,
it was better to use the boundary layer characteristics method
to estimate shear velocity.
Fig. 16 shows the trend of changes in the shear velocity
values obtained by the boundary layer characteristics method
at all distances from the wall for all experimental runs.
Changes in the shear velocity values along the channel had
the same-phase and sinusoidal variation. With a relatively
good approximation, it can be claimed that the maximum
shear velocity values were at the beginning of the pool
section and mostly, the shear velocity in the axes adjacent
to the center of the channel was higher than the values
adjacent to the walls. In the study of Fazel Najafabadi et al.
(2017), the shear velocities calculated using the logarithmic
law method for two-dimensional pool-riffle sequence and
the Reynolds shear stress method for three-dimensional
sequence showed a parallel phase between changes in shear
velocity and bed elevation [20]. However, in the present
study for 3D bed forms a fuzzy difference was observed
between shear velocities and bed elevation. With increasing
discharge, the difference between the shear velocity values
in the vicinity of vegetation and other axes as well as the
range of changes in the shear velocity values increased.
By reducing the median diameter of bed particles in the third
run of experiments, the shear velocity values revealed less
fluctuations, resulting in a more balanced distribution. In
the presence of wall vegetation, the amount of shear velocity
along the 3D bedform adjacent to the wall was less than
along other longitudinal axes. This trend changed by
removing vegetation from the wall in the fourth run showing
the significant effect of vegetation on the shear velocity
estimation. By removing the vegetation, the maximum
values of shear velocity occurred along axis 2 (at a distance
of 15 cm from the base wall), which corresponded to the pool
section.
Figure 15. Comparison of estimated shear velocity values, based on logarithmic law (LWM), parabolic law (PBM), and boundary layer characteristics
(BLM) methods

Journal of Civil Engineering Research 2021, 11(2): 51-61 59
Figure 16. Shear velocity values for different distances from wall for different experiments runs
Figure 17. Bed shear stress curves for all experiment runs
3.5. Shear Stress Variation
Many studies use shear stress rather than shear velocity to
evaluate the key parameters of river engineering, including
the Shields parameter which is a dimensionless shear stress.
To investigate the shear stress, the values can be plotted on
a simple diagram considering the location of each profile.
In the present study, considering that the total number of
profiles collected in all experiments was over 200, the
same-stress curves in the bed were plotted so that the
changes in this parameter can be easily observed. The direct
estimation of shear stress is a difficult task, encouraging
the researchers to calculate it indirectly by using the
determination of shear velocity. In this section, using the

60 Nima Ataollahi et al.: Interaction of Three-Dimensional Pool-Riffle Sequence
and the Flow Characteristics in the Presence of Wall Vegetation
shear velocity obtained by the boundary layer characteristics
method for each velocity profile, the bed shear stress was
calculated by 𝜏 = 𝜌𝑢∗2, and for each experiment run, the
bed stress curves are presented separately in Fig. 17. Note
that in all plans the left wall is the bare wall.
Results of simulations performed by Tokyay and Sinha
(2020) in the pool-riffle sequences for four channel widths
of 20, 30, 60 and 90 cm showed that the maximum and
minimum bed shear stresses occurred in riffle and pool
sections, respectively. In all experiments and in the
connection slope of these two pool and riffle sections, the
shear stress decreased by moving towards the pool section
[8]. Macvicar and Rennie (2012) found that the highest shear
velocity value estimated using near-bed velocities was
related to the riffle section, while the lowest value occurred
in the pool section indicating a range between 0.005 to 0.05
m/s [29].
In the current research, in the first to third runs with
vegetation, the minimum stresses occurred in the vicinity of
wall vegetation. By moving in the direction of flow, the
occurrence of the lowest shear stress for all experiments
was in the riffle region located on the exit slope of the
pool section, and on reaching the riffle region, the
stresses increased again. With increasing flow discharge, no
noticeable changes happened in the location of the minimum
and maximum shear stresses, however, the stress values
increased significantly compared to the lower flow. By
reducing the median diameter of the bed particles, the shear
stress changes decreased. This means that the finer grains led
to less changes in the shear stress values than did the coarse
ones. On the other hand, the area of maximum shear stresses
was inclined to the pool cross section in the absence of
vegetation and the location of the minimum shear stresses
was inclined to the center of the channel.
4. Conclusions
Environmental challenges for better restoration of water
resources and river training demands a better understanding
of the flow characteristics in the presence of vegetation
and 3D bed forms. The present research focused on the
presentation and estimation of flow velocity, shear velocity,
and shear stress distribution through a 3D pool-riffle
sequence, by considering the vegetation effect on one wall
by using an experimental study. The following results can be
drawn herein:
Fitting the velocity data to the near bed data (the
inner layer) showed that in the presence of asymmetric
three-dimensional pool-riffle bed form with and without wall
vegetation, the logarithmic law is valid in more than 90% of
velocity profiles, for more than 40% of the flow depth near
the bed which is different from decelerating and accelerating
flows in gravel-bed channels reported in the literature
(e.g., Graf and Altinakar 1998). In fact, the wall vegetation
influences the location of low depth where the logarithmic
law is valid.
The location of maximum velocity (umax) is a function of
flow discharge, so that with increasing discharge, umax tends
to incline towards the pool section. The transverse pressure
gradient due to the transverse asymmetry of the bedforms
reduces the velocity values in the near bed region. The
greatest velocity gradient was observed along the channel
in the middle of the bedforms and the lowest value was
observed at the end of the riffle region toward the crest. The
velocity value near the water surface region (the outer layer)
in the pool section was greater than in the riffle section.
High velocity values also occurred near the water surface
and near the bed in pool and riffle sections of 3D bedforms,
respectively.
Investigation of velocity profiles indicated that maximum
velocity occurred close to vegetation near the bed. By
moving away from the vegetation wall, the difference
between the maximum velocity and the surface velocity
decreased to the vicinity of the bare wall and increased again
at the closest axis to the bare wall.
The use of the boundary layer characteristics method to
estimate shear velocity not only shows a good agreement
with the estimated values by logarithmic law, but also it
takes into account the velocity profile variations over 3D
bedforms in the presence of wall vegetation.
The minimum shear stress occurred in the riffle section
located on the exit slope of the pool section, and the
maximum shear stress located at the entry slope of the 3D
pool section and started decreasing toward the following
riffle crest. In the presence of vegetation, the lowest shear
stress occurred in the vicinity of vegetation. Increasing the
flow discharge caused increased shear stress values, but did
not cause a significant change in the location of the minimum
and maximum stresses. Reducing the median diameter of the
bed particles led to less change in the shear stress values.
There are some limitations in this study, including the
artificial pool and riffle which may make different the
results from the existing bed forms in coarse-bed Rivers.
The sediment size variations may be significant in some
sections in rivers which may not be easily found in in a
laboratory scale. The current-meter cannot be used very
near the bed to determine the velocity distribution and
turbulence fluctuations, demanding more advanced tools to
measure the flow velocity and turbulence in this region for
future studies.
REFERENCES
[1] Papangelakis, E., & Hassan, M. A., The role of channel morphology on the mobility and dispersion of bed sediment in a small gravel-bed stream. Earth Surface Processes and Landforms, 2016. 41(15), 2191-2206.
[2] MacVicar, B. J., & Roy, A. G., Hydrodynamics of a forced riffle pool in a gravel bed river: 1. Mean velocity and turbulence intensity. Water Resources Research, 2007. 43(12).

Journal of Civil Engineering Research 2021, 11(2): 51-61 61
[3] Montakhab, A., et al., Flow and sediment transport in vegetated waterways: A review. 2012, Springer. p. 275-287.
[4] Fazlollahi A., Afzalimehr H., Sui J., Impacts of pool and vegetated banks on turbulent flow characteristics. Can J. Civil Eng, 2015. 42 (12), 979–986.
[5] Elgueta-Astaburuaga M. A., Hassan M.A., Sediment storage, partial transport, and the evolution of an experimental gravel-bed under changing sediment supply regimes Geomorphology, 2019. 330: 1-12.
[6] Hassan M. A., Buckrell E., Chartrand S. M., McDowell C Pool-riffle adjustment due to changes in flow and sediment supply. Water Resources Research, 2021. 57 (2).
[7] Stoesser T., Kara S., MacVicar B., and Best J. L., Turbulent Flow over a mildly sloped pool-riffle sequence,” in Proceedings of the IAHR River Flow 2010 Conference, Bundesanstalt fuer Wasserbau, 2010. 409–417.
[8] Tokyay T., & Sinha S., Channel width, bedform length and turbulence: numerical investigation of flow dynamics over laboratory-scale pool–riffle sequences. Environmental Fluid Mechanics, 2020. 20(4), 819-842.
[9] Fuentes-Aguilera P., Caamaño D., Alcayaga H., & Tranmer A., The Influence of Pool-Riffle Morphological Features on River Mixing, 2020. Water, 12(4), 1145.
[10] Maddahi M. R., Afzalimehr H. and Rowinski P. M Flow Characteristics over a Gravel-bedform: Kaj River Case Study, Acta Geophys, 2016. 64(5): 1779–1796.
[11] Najafabadi E. F., Afzalimehr H., & Rowiński P. M., Flow structure through a fluvial pool-riffle sequence – Case study. Journal of Hydro-Environment Research, 2018. 19, 1–15.
[12] Shahiri Tabarestani, E., Afzalimehr, H., & Pham, Q. B. Validation of double averaged velocity method in a variable width river. Earth Science Informatics, 2021. 1-14.
[13] Caamaño, D., et al., Unifying Criterion for the Velocity Reversal Hypothesis in Gravel-Bed Rivers. Journal of Hydraulic Engineering, 2009. 135(1): p. 66-70.
[14] Afzalimehr, H., S. Jueyi, and R. Moghbel, Hydraulic parameters in channels with wall vegetation and gravel bed. International Journal of Sediment Research, 2010. 25(1): p. 81-90.
[15] White, B.L. and H.M. Nepf, Shear instability and coherent structures in shallow flow adjacent to a porous layer. Journal of Fluid Mechanics, 2007. 593: p. 1-32.
[16] McBride, M., et al., The influence of riparian vegetation on near-bank turbulence: a flume experiment. Earth Surface Processes and Landforms, 2007. 32(13): p. 2019-2037.
[17] Sun, X. and K. Shiono, Flow resistance of one-line emergent vegetation along the floodplain edge of a compound open channel. Advances in Water Resources, 2009. 32(3): p. 430-438.
[18] Afzalimehr H., Barahimi M. and Sui J., Non-uniform flow over cobble bed with submerged vegetation strip. Proceedings of the Institution of Civil Engineers. Water Management, 2019. 172(2), 86–101.
[19] Soltani, N., Afzalimehr, H., & Singh, V. P. Influence of Vegetated Banks on Turbulent Characteristics of Non-uniform Flow in Gravel Bed River, 2016.
[20] Fazel Najafabadi, E., H. Afzalimehr, and J. Sui, A comparison of two-dimensional and three-dimensional flow structures over artificial pool-riffle sequences. Canadian Journal of Civil Engineering, 2017. 2(12): p. 1084-1098.
[21] Kironoto, B.A. and W.H. Graf, Turbulence characteristics in rough non-uniform open-channel flow. Proceedings of the Institution of Civil Engineers - Water Maritime and Energy, 1995. 112(4): p. 336-348.
[22] Graf, W.H. and M.S. Altinakar, Fluvial Hydraulics: Flow and Transport Processes in Channels of Simple Geometry | Wiley. 1998: Wiley. 692-692.
[23] Afzalimehr, H. and F. Anctil, Accelerating shear velocity in gravel-bed channels. Hydrological Sciences Journal, 2000. 45(1): p. 113-124.
[24] Whiting, P.J. and W.E. Dietrich, Convective accelerations and boundary shear stress over a Channel Bar. Water Resources Research, 1991. 27(5): p. 783-796.
[25] Nezu, I. and W. Rodi, Open-channel Flow Measurements with a Laser Doppler Anemometer. Journal of Hydraulic Engineering, 1986. 112(5): p. 335-355.
[26] Afzalimehr, H. and S. Dey, Influence of bank vegetation and gravel bed on velocity and Reynolds stress distributions. International Journal of Sediment Research, 2009. 24(2): p. 236-246.
[27] Afzalimehr, H. and C.D. Rennie, Determination of bed shear stress in gravel-bed rivers using boundary-layer parameters. Hydrological Sciences Journal, 2009. 54(1): p. 147-159.
[28] Shahmohammadi R., Afzalimehr H. and Sui J., Interaction of turbulence and vegetation patch on the incipient motion of sediment. Canadian Journal of Civil Engineering, 2018. 45(9), 803-816.
[29] MacVicar, B.J. and C.D. Rennie, Flow and turbulence redistribution in a straight artificial pool. Water Resources Research, 2012. 48(2).
Copyright © 2021 The Author(s). Published by Scientific & Academic Publishing
This work is licensed under the Creative Commons Attribution International License (CC BY). http://creativecommons.org/licenses/by/4.0/


